Who owns finance’s toll roads after trading commissions fall to zero?
Finance’s “toll roads” are the regulated exchanges, brokers, market makers, clearing utilities, custodians, data vendors and software systems that move money and securities between owners. Their histories began in trading clubs, telegraph offices, paper back rooms, futures pits and discount brokerages before technology and regulation connected them into one chain. Today, free trading is largely a customer-acquisition tool. More durable revenue comes from cash, margin, securities lending, liquidity, clearing, custody, benchmarks and embedded workflows. The strongest owners are generally the firms that control scarce liquidity, legal finality or trusted data—not necessarily the app where a trade begins.
The first toll booth was a handshake
On 17 May 1792, 24 New York brokers signed a short agreement. They promised to trade securities with one another and to charge customers a fixed commission.1 Tradition places the signing under a buttonwood tree on Wall Street, and the New York Stock Exchange still traces its origin to that meeting. The document was barely a paragraph long. Its practical effect was much larger: it created a club of trusted counterparties, a place to find them and a price for access.
That was the first toll booth in this story, but it is important to define what it charged for. A toll road lets travellers cross a river faster than swimming. An exchange lets a buyer find a seller faster than approaching potential counterparties one by one. The analogy ends there. A bridge carries traffic; a market also produces a visible price, records who owns what and establishes rules that make a stranger’s promise acceptable. A financial toll road helps manufacture trust as it moves money.
Four threads that started apart
Four separate threads emerged from the eighteenth and nineteenth centuries, and for a long time they barely touched.
The first was organised liquidity. A market becomes more useful as more people use it: buyers come because sellers are available, and sellers come because buyers are available. Economists call this a network effect. The Buttonwood brokers understood the mechanism without the terminology. By trading mainly among themselves, they made their circle the place where orders gathered. That concentration, in turn, helped make it the place where prices were set.
The second thread was information. In 1851, Paul Julius Reuter opened an office in London and began sending stock prices between London and Paris over a new undersea cable.2 His product combined speed with reliability: a price that could be acted on before a rival received it, from a source customers trusted. That combination—fast, trusted market information sold by subscription—would become one of finance’s most profitable businesses.
The third thread was regulation. After the crash of 1929 and the Depression, Congress passed the Securities Exchange Act of 1934. The law created the Securities and Exchange Commission and gave it broad authority over exchanges, brokers and dealers.3 Access to markets, investor disclosure and intermediary conduct became public responsibilities. The SEC did more than police the toll roads; it became part of their architecture by determining who could operate them and what rules they had to follow.
The fourth thread was risk transfer. Futures exchanges developed around farmers and merchants who needed to lock in prices for grain or livestock months in advance. Venues such as the Chicago Mercantile Exchange, whose modern parent is CME Group $CME, offered something different from a share of a company: a standardised contract tied to a future price that a hedger could buy or sell. Later, such contracts expanded to currencies, interest rates and stock indices.
A ruler everyone agrees to use
One more idea belongs to these beginnings: the benchmark. An index is like a ruler that everyone agrees to use. When fund managers judge performance against the same basket of shares, the owner of that benchmark sits at the centre of the comparison. MSCI $MSCI, the index and analytics company, traces the base dates of its first international indices to 1969, when comparing markets across borders became a product rather than an informal exercise.4 The ruler analogy breaks down in one important respect: an index can affect what it measures. When large pools of money track an index, changes in its composition can redirect investment, while the owner can charge licence fees for using it.
The evidence against a natural monopoly
It would be convenient to say that exchanges began as natural monopolies. The historical record is more complicated. Philadelphia had a securities market before New York, while regional exchanges and over-the-counter dealers competed with the New York club for more than a century. The fixed commission in the Buttonwood agreement was also a cartel price. Looking back, the SEC treated it as an anti-competitive legacy that took until 1975 to remove.3 Both interpretations contain part of the story: the NYSE presents the agreement as market-building, while the regulator viewed the fixed-price tradition as a restriction that persisted too long.
The history narrows the claim rather than disproving it. Network effects were real, but rulebooks, membership restrictions and legal privileges helped create them. The first toll road was built on trust and protected by rules; that combination remained central as finance expanded.
As trading grew, the visible exchange proved to be only one bottleneck. Someone also had to record ownership, deliver certificates and move cash. By the 1960s, the back office—not the trading floor—was where the market came close to seizing up.
 Subscribe on LinkedIn
The market drowns in paper—and learns to share the road
By 1968, Wall Street had become a victim of its own success. Trading volumes had outgrown the back offices, and every trade still generated a paper certificate that had to be found, checked, carried across town and registered to its new owner. Clerks fell weeks behind. The NYSE closed on Wednesdays so firms could catch up, and settlement periods stretched.5 Some brokers failed not because their trades had lost money, but because they could no longer determine which trades they had made.
The lesson was blunt: a market can sell more than it can deliver. When that happens, delivery becomes the bottleneck.
Immobilise the paper, net the rest
The industry responded by stopping the movement of paper. In 1973, it created the Depository Trust Company, which held certificates in one vault and recorded ownership changes electronically.5 Shares stopped travelling; only the ledger changed.
In 1976, the National Securities Clearing Corporation began clearing and netting trades at industry scale.6 Netting offsets obligations so that only the balance moves. If a broker buys 1,000 shares of a company from other firms during the day and sells 900, it settles the 100-share difference rather than 1,900 separate deliveries.
A clearinghouse is easiest to picture as a central referee. After a trade, it becomes the buyer to every seller and the seller to every buyer, so members do not have to rely directly on the firm on the other side. But the analogy stops at money. A clearinghouse requires collateral, marks positions to market and maintains a default fund to absorb a failure. It is a referee that holds deposits and can use them if a player collapses.
The paperwork crisis also produced a quieter piece of plumbing. In March 1986, NSCC launched Fund/SERV, replacing a tangle of one-to-one links between fund companies and distributors with a central system for mutual-fund orders.7 Few investors had heard of it, but many depended on it. Today, these utilities sit under one roof, the Depository Trust & Clearing Corporation, owned by its users rather than public shareholders.
May Day
The second turning point of the era concerned price. On 1 May 1975—“May Day”—the SEC ended fixed brokerage commissions.8 For 183 years, the Buttonwood habit of a set price had survived in one form or another. Brokers now had to compete.
Critics had warned that removing fixed commissions would weaken brokers and destabilise markets. SEC officials, reflecting on the change within weeks, argued that the fears were overstated and that negotiated rates would bring competition to brokerage and research.9 In the years that followed, commissions fell, trading volume rose and new kinds of firms appeared.
Two entrepreneurs focused on a customer the old industry had largely ignored: the investor who did not want advice and did not want to pay for it. Chuck Schwab built a discount brokerage around that customer. In Omaha, Joe Ricketts founded First Omaha Securities as an early no-advice broker; it later became Ameritrade and then TD Ameritrade. In 1995, it acquired an internet trading business that helped make online self-directed investing practical for households.10 The business model was straightforward: remove the salesperson and lower the price.
The floor becomes a machine
Technology was also dismantling the physical trading floor. Instinet launched an electronic network in 1969 that allowed institutions to match orders without a floor, and Nasdaq opened as an electronic market in 1971.11 An electronic communication network is a matching machine: it takes buy and sell orders, ranks them by price and time, and executes them when they meet. The queue replaces the shouting.
Futures followed. On 25 June 1992, CME launched Globex, moving futures and options toward nearly round-the-clock electronic trading.12 Prices were rebuilt as well. In June 2000, the SEC ordered exchanges and Nasdaq to phase in decimal pricing,13 and by 9 April 2001, US shares traded in cents rather than sixteenths of a dollar.14 Spreads—the gap between the best buying and selling prices—narrowed sharply. That benefited investors, but reduced the profit available on each trade. The advantage shifted to firms that could trade faster and route orders more efficiently.
Rules that split the market
Regulation then made competition possible by making the market more complex. The SEC’s 1997 Order Handling Rules required better display of customer limit orders and opened the door to electronic rivals.11 In June 2005, Regulation NMS went further, establishing order protection, fair access and updated rules for consolidated market data.15 Brokers had to protect the best displayed price, while venues had to admit competing participants.
The result was a fragmented market: a dozen or more exchanges, alongside private venues, all connected. Fragmentation weakened any single exchange’s control over trading, and Europe followed a similar path when Instinet launched Chi-X Europe in 2006 and gained share from national exchanges by combining fast technology with sufficient liquidity.11 It also increased the value of the systems that connected the pieces: routing, data feeds, connectivity and speed.
The pattern was clear. May Day ended the fixed commission, but not the toll. Revenue shifted into spreads, routing, data, financing and scale.
By the early 2000s, finance was electronic, fragmented and dependent on shared infrastructure. The next shock would test whether clearing and liquidity were merely convenient—or whether the system could function without them.
The toll booth moves inside the machine
On 23 December 2008, after Lehman Brothers had failed and AIG had been rescued, the SEC approved temporary exemptions allowing credit-default swaps to be cleared through a central counterparty.16 Until then, these insurance-like contracts had largely been private promises between dealers. When a major participant weakened, the market had limited visibility into who owed what to whom. The crisis recast central clearing as a public-interest function: a place where exposures could be measured, collateralised and, if necessary, unwound.
Dodd–Frank, signed on 21 July 2010, made that approach law in the United States. Standardised over-the-counter derivatives were pushed toward regulated trading, reporting and central clearing.17 The policy reduced bilateral exposures by concentrating them in fewer, better-capitalised utilities. It also sharpened the commercial question: if safety depended on centralisation, who would collect the fees?
Much of the answer was the exchanges and clearinghouses that already controlled the relevant rulebooks. CME cleared products traded on its venues. Intercontinental Exchange $ICE, which had grown from energy futures into the owner of the NYSE, also built clearing into its business. Regulation intended to reduce systemic risk therefore created, or reinforced, mandated flows of business for established infrastructure providers.
The consumer turn
At the retail end of the chain, another disruption was taking shape. Vlad Tenev and Baiju Bhatt saw a gap between what professionals paid to trade—often very little—and what ordinary investors paid. They founded Robinhood in 2013,18 and in 2015 the company began offering commission-free stock trading through a phone app.19
The customer paid no commission, but the trade still generated revenue. Robinhood relied heavily on payment for order flow: a market maker paid a broker for the opportunity to execute its customers’ orders. Retail orders were generally small and less informed than institutional orders, which could make them attractive to fill. The legal limit was best execution. A broker could not simply sell orders to the highest bidder; it had to seek the most favourable terms reasonably available for the customer.20
Robinhood expanded into options and crypto, and its growth forced established brokers to respond.
The day the price hit zero
On 7 October 2019, Charles Schwab $SCHW cut its online commission for US stocks, ETFs and options from $4.95 to zero.21 Rivals followed within days. The company that had helped turn May Day’s commission competition into a business model now removed the charge altogether.
Schwab could do that because commissions were not its only source of revenue. Customers left cash in their accounts, which the company swept into its bank and then lent or invested. It also earned fees from advice and funds, and interest from margin lending. Zero commissions served primarily as a way to attract and retain assets. The visible toll disappeared; revenue shifted elsewhere in the customer relationship.
The stress test
January 2021 demonstrated that those other tolls were tied to market infrastructure. As GameStop’s share price rose during a wave of retail buying, the clearinghouse increased the collateral brokers had to post against their customers’ unsettled trades. Some brokers, including Robinhood, restricted purchases of the most volatile shares. Customers who had never heard of a clearinghouse learned that its collateral requirements could affect whether a free trading app allowed them to buy. The SEC later connected the episode to its effort to shorten settlement.22
On 28 May 2024, the United States moved from settling most securities two business days after a trade to one, a change known as T+1.23 Shorter settlement reduces the period during which a trade remains an unsecured promise and can lower the collateral tied up in the system. It also leaves back offices less time to correct errors—the old paperwork crisis in a new form.
The scrutiny
The replacement revenue remained subject to regulatory challenge. In 2021, FINRA, the brokers’ self-regulator, reminded firms that routing decisions involving payments still had to satisfy best-execution obligations.20 The SEC chairman told Congress that payment for order flow and gamification raised conflicts that warranted examination,24 and, when Robinhood filed to go public, the SEC required the company to explain the importance of those payments and the related regulatory risks.25
The record did not show payment for order flow being banned in the United States. It showed a revenue stream whose durability depended on regulation, execution quality and market structure. Zero commissions broadened participation, but the revenue replacing them was neither automatic nor guaranteed.
Information becomes workflow
As trading became cheaper, information became more deeply embedded in financial work. The telegraph service founded by Paul Julius Reuter had become a global news and data business that marked its 175th year in 2026.26 In 1981, Michael Bloomberg founded the company whose terminal combined real-time data, analytics and messaging in a subscription used by financial professionals.27 MSCI turned benchmarks into licensed products. Vendors such as FactSet, FICO and London Stock Exchange Group—which bought the Refinitiv data business that grew from Reuters—sold information inside the systems used for decisions, trades and compliance checks.28 A price quote had become part of a workflow.
By 2024, a customer could see a free app while relying on a chain of market makers, exchanges, clearinghouses, custodians, banks, data vendors and regulators. The next step is to follow one order from the moment a thumb touches the screen and identify who gets paid at each stage.
Follow one order, and you find seven toll roads
A household in Ohio or Pune taps “buy” on a phone. The action looks singular, but the order passes through a chain of platforms, intermediaries and utilities. Each layer earns revenue differently.
Where the money comes from
The chain begins with the owners of the capital: households, pension funds and asset managers. OECD pension assets reached a record $69.8 trillion at the end of 2024,29 while the World Bank’s 2025 Findex survey found that 79% of adults worldwide had a financial account in 2024.30 Those assets and accounts supply the orders that keep the system moving.
The largest pools are managed by firms such as BlackRock $BLK, Vanguard, T. Rowe Price $TROW, Amundi, Invesco $IVZ and private-market firms such as Blackstone $BX. They are important customers of the toll roads, but usually do not own them. They pay for execution, custody, indices and data, while their scale gives them leverage to negotiate. In Empor’s scorecard, 22 listed capital providers generated about $159 billion of revenue in their latest fiscal years, up 18.2%. Much of that growth reflected market levels, fundraising and performance fees. The links table shows the exposure: for BlackRock, T. Rowe Price and Invesco, revenue growth moved closely with the S&P 500 in the same quarter. These firms ride asset prices; they generally do not own the road.
The front door
Wealth platforms. The order begins in an account at a wealth platform such as Schwab, Robinhood, Morgan Stanley $MS Wealth Management, India’s Groww or LPL Financial $LPLA, which serves independent advisers. These firms gather household assets and often provide advice. Schwab reported $11.90 trillion of client assets and $519.4 billion of core net new assets in 2025.31 Trading can attract customers, but cash balances, advice, fund distribution, lending and asset-based fees generate the recurring revenue. The sibling story on wealth platforms follows who ultimately gets paid to manage the money.
Brokers. The broker converts the order into market access. Its role overlaps with wealth platforms, but centres more narrowly on execution, margin lending, securities lending and account custody. Schwab, Interactive Brokers, Robinhood, Fidelity and Morgan Stanley’s E*TRADE compete in this layer. Robinhood ended 2025 with 27.0 million funded customers and $68.1 billion of net deposits for the year.32 Those figures illustrate a model built around customer balances and activity rather than commissions. The sibling story on brokers asks which firms can still earn adequate returns when the visible trading charge is zero.
The market
Market makers. The order is often filled by a market maker: a firm that continuously quotes prices to buy and sell, earning the spread while managing the risk between them. Virtu Financial $VIRT is the largest listed example. Citadel Securities and XTX Markets are larger in some flows but privately held, while Flow Traders focuses on ETFs. Virtu’s 2025 operating margin was 33.8% in Empor’s scorecard, and its return on equity rose from about 12% in 2023 to 36.6% over the latest twelve months. The economics remain cyclical: the links table shows Virtu’s margin rising with the VIX volatility index in the same quarter, though only loosely, before falling as markets become calmer.
Exchanges. If the order reaches a public venue, it meets an exchange such as ICE, CME, Nasdaq $NDAQ, London Stock Exchange Group or Cboe Global Markets $CBOE. These companies sell matching, listings, derivatives, clearing, indices, data and connectivity. ICE reported $9.9 billion of 2025 net revenue and a 50% adjusted operating margin across the group; its exchanges segment posted a 74% margin.33 Those margins show what control of regulated venues and scarce liquidity can be worth. The sibling story on exchanges asks which operators have the strongest roads and whether new venues can challenge them.
The back office
Clearing and settlement. After execution, the post-trade layer takes over. DTCC clears, nets and settles US securities trades,34 while the Options Clearing Corporation stands behind every listed US option.35 Euroclear and Clearstream, part of Deutsche Börse $DB1.DE, settle and hold securities across Europe. Custodians such as BNY Mellon $BK and State Street $STT safeguard assets for funds, while Broadridge $BR processes trades and investor communications for brokers. Euroclear alone held more than €43 trillion in custody in 2025.36
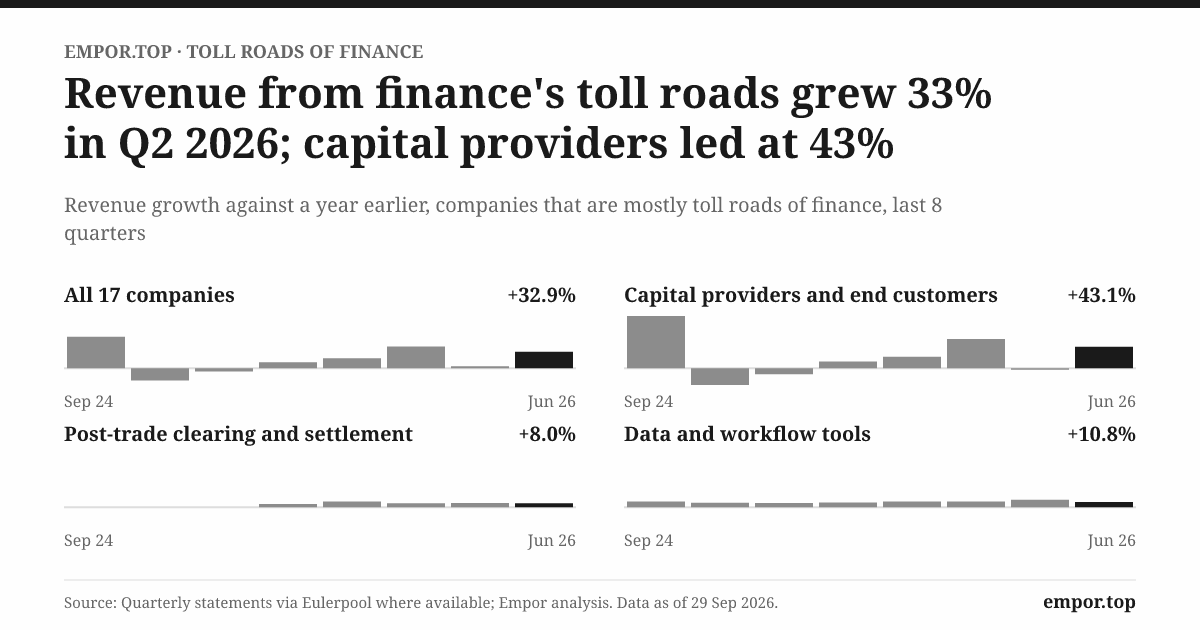
The reported figures need context. Empor’s pulse table showed combined post-trade revenue falling 23.2% in the quarter to June 2026, but that result was driven largely by one company: BNY Mellon’s quarterly revenue in the dataset fell by nearly half while its operating margin rose. That pattern points to a change in accounting presentation rather than a collapse in settlement demand. The median post-trade company grew about 10%.
The information
Data and workflow. Every layer of the relay depends on shared information. MSCI licenses indices; FactSet $FDS sells the analyst’s workstation; S&P Global $SPGI provides financial data; FICO $FICO scores credit; Morningstar $MORN rates funds; SS&C $SSNC and SEI $SEIC run fund accounting and processing; and Nomura Research Institute $4307.T operates core systems for many Japanese securities firms. MSCI recorded a 54.7% operating margin in 2025 in the scorecard, placing it among the highest-margin businesses in the chain.
Two kinds of toll
Following the order back through the system reveals two broad kinds of toll. Some are charged when activity occurs: a trading fee, a spread or a clearing charge. Others recur because the customer cannot easily switch: an index licence, a custody contract or a fund-accounting system. The first group rises and falls with activity; the second can compound over time.
The chain is also a loop rather than a straight line. Assets generate orders, orders generate records, records generate data, and data can attract more assets. A firm positioned at a junction can collect revenue each time the loop turns.
Customer power limits that advantage. Asset managers can use several brokers, brokers can route orders to multiple venues, and banks can consolidate software vendors. The strongest tolls therefore arise where switching could disrupt legal records, collateral, benchmark continuity or regulatory approval. The central question is which layer controls the part that cannot easily be replaced.
The contests are decided by what customers cannot easily replace
Two trades can look free to the customer and still rest on very different economics. A share bought through a Schwab or Robinhood app depends on cash balances and order routing; the broker could lose that customer to a rival in an afternoon. An interest-rate futures contract on CME depends on open interest—the stock of outstanding contracts—and a clearinghouse already trusted by participants. Moving that business would require thousands of hedgers to move at once.
That difference shapes each contest.
Exchanges: who keeps the liquidity
Each large exchange group has built its position around a different form of scarcity. ICE combines venues, listings, data and mortgage technology. CME combines benchmark derivatives with its own clearing. Nasdaq combines exchanges with software, reporting more than $5.2 billion of 2025 net revenue and $3.1 billion of annual recurring revenue from its solutions businesses.37 LSEG links venues, clearing, data and workflow, reporting £9.0 billion of 2025 income and a 50.3% adjusted EBITDA margin.28 Cboe has built its position around options and volatility.
No group leads every part of the category. ICE is the most diversified, CME is strongest in listed derivatives with clearing, Nasdaq has attached software revenue to its venues, and LSEG is concentrated across data and workflow. The key question is whether customers continue to concentrate liquidity and risk under the same rulebook. That position can be durable without being permanent: Chi-X took share from European incumbents, and Nasdaq itself began as an upstart. New entrants tend to gain ground first in niche products, not benchmark contracts.
There is also a valuation risk. ICE’s diversification makes it less pure as an exchange, while group-level multiples can obscure which business actually collects the toll. CME’s volumes remain exposed to interest-rate and commodity cycles.
Brokers and wealth platforms: who keeps the assets
Schwab combines scale, trust and customer cash. Robinhood competes through product speed and a younger customer base. Interactive Brokers focuses on price and global reach; Fidelity competes on breadth and private ownership; Morgan Stanley combines E*TRADE’s self-directed accounts with advisers; and LPL serves independent advisers. In India, Groww’s parent, Billionbrains Garage Ventures, listed on the NSE and BSE on 12 November 2025,38 after its active NSE clients rose from 5.37 million in March 2023 to 12.58 million in June 2025.39
The more useful measure is the quality and durability of fee-earning assets, not downloads or trade counts. Robinhood reported about 4.2 million Gold subscribers in 2025, providing a revenue stream less dependent on trading,32 but its results remained sensitive to options and crypto activity. Groww’s customer growth demonstrates acquisition, not yet durable margins: its revenue still relies heavily on transaction-based broking under Indian rules that may change. Schwab’s advantage is substantial but exposed to interest rates, because falling rates reduce what it earns on customer cash.
Market makers: who survives the cycle
Virtu is the clearest public-market benchmark. Citadel Securities and XTX disclose too little for a like-for-like comparison. Flow Traders illustrates the cyclicality: its revenue fell 39.7% in 2025 before rebounding. Dealer banks—including Goldman Sachs $GS, JPMorgan $JPM, Citigroup $C, Bank of America $BAC, Barclays $BARC.L, Deutsche Bank, UBS $UBSG.SW, BNP Paribas $BNP.PA, Société Générale $GLE.PA and Macquarie—bring larger balance sheets and established client relationships. Citigroup’s markets revenue was about $21.9 billion in 2025 in Empor’s estimate, far above Virtu’s, but markets are only one part of the bank, so its shares are not a pure play on market making.
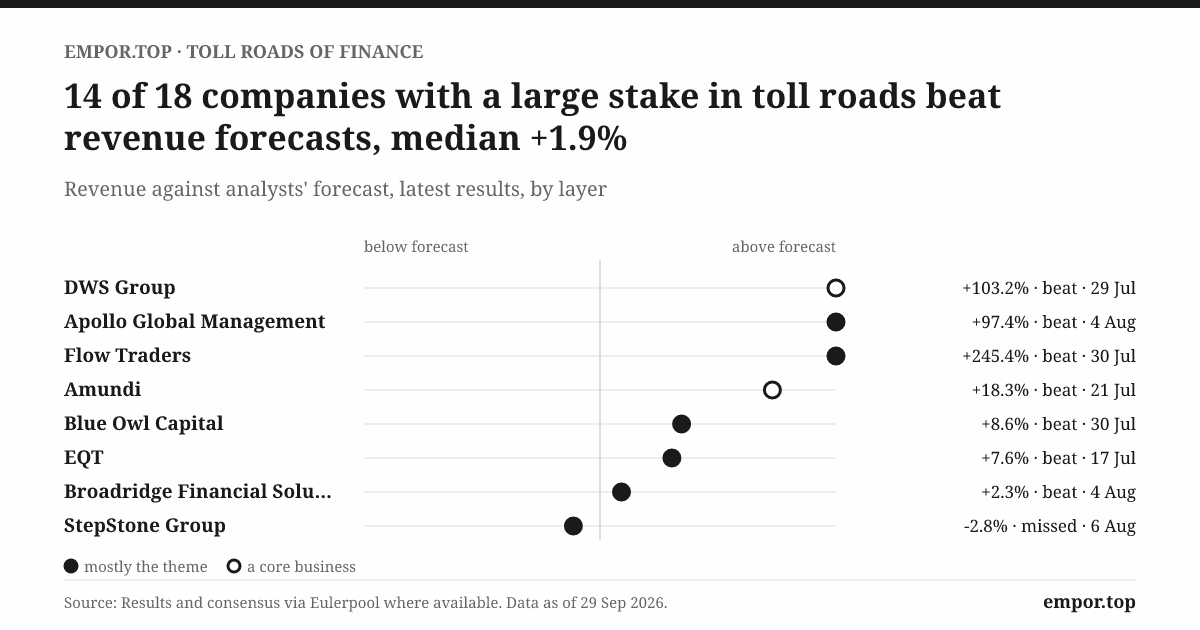
The relevant test is profitability across a full cycle, not one strong quarter. Market makers in Empor’s pulse table grew revenue 76.8% in the quarter to June 2026, while consensus expected a 19.1% decline the following year. That gap suggests the market was distinguishing a strong recent period from expectations of normalization.
Post-trade: who holds legal finality
DTCC, Euroclear and OCC occupy central positions in settlement and risk management; they are user-owned or member-governed rather than publicly traded. BNY Mellon, State Street, Northern Trust and HSBC combine custody with servicing. Broadridge, Computershare $CPU.AX, and India’s CDSL $CDSL, KFin Technologies $KFINTECH and CAMS $CAMS.NS earn fees from records, processing and investor administration.
The developed and developing markets show different economics. In the scorecard, BNY Mellon and State Street traded at 17.3 and 14.6 times earnings. CDSL, one of India’s two depositories under the Securities and Exchange Board of India,40 traded at 57.9 times earnings and a 49.5% operating margin, while KFin grew revenue 26% in its latest year. The Indian firms benefit from expanding investor participation, but their valuations imply more growth and they have greater exposure to decisions by one regulator. Post-trade shares returned 24.6% over the past year, even as the broader theme fell 15.9%.
One relationship is less intuitive. BNY Mellon’s and State Street’s revenue growth moved against the S&P 500 in the sample rather than with it. Interest income, acquisitions and accounting mix may have outweighed the direct effect of higher asset values. Custodians therefore are not simply a bet on rising markets.
Data: whether AI helps or hurts
MSCI’s index licences, FICO’s credit scores, S&P Global’s data, FactSet’s workstation, Morningstar’s ratings and LSEG’s integrated data-and-workflow platform each defend a different form of scarcity. Clearwater Analytics, Intapp, Linedata, SS&C, SEI and NRI sell embedded workflow.
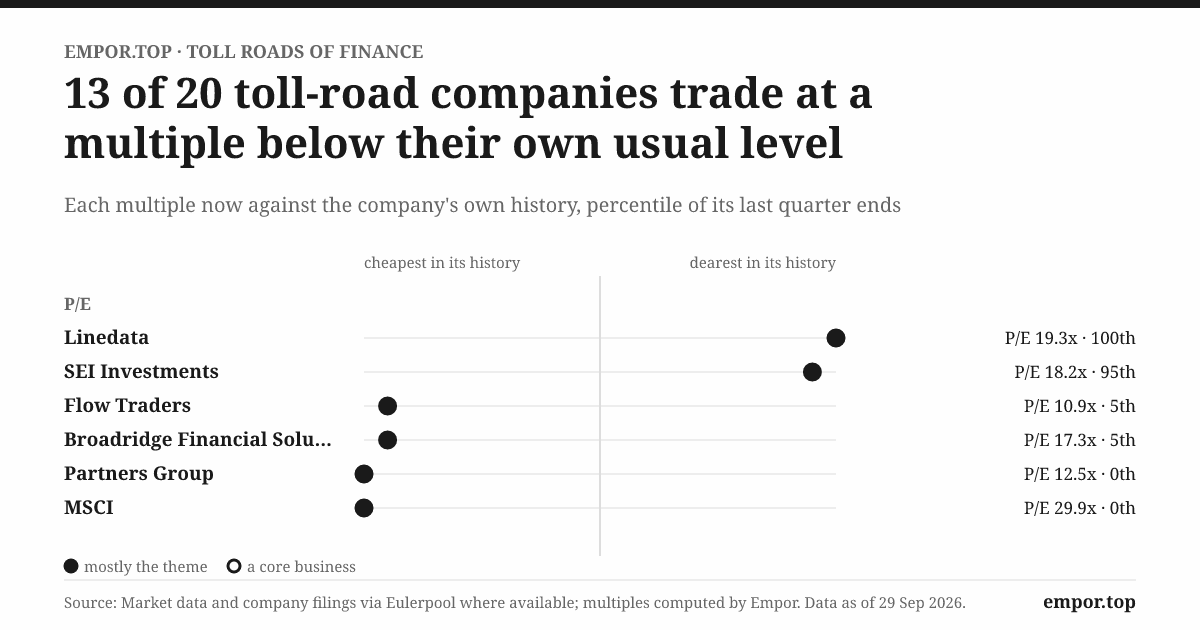
The data layer grew 12.4% in the latest quarter and reported a 34% operating margin. Empor’s links table found no consistent relationship between its revenue and market volatility, which is consistent with subscription-based businesses. Share prices nevertheless moved lower: FactSet’s market value fell 46% and Morningstar’s 50% in the year to June 2026, even as both companies grew revenue. Investors were pricing in the possibility that AI could make financial data more interchangeable. The evidence does not yet resolve that question; customer retention, pricing and renewal performance will be the more useful tests. A theme can therefore identify the right layer while still producing disappointing returns if the entry price is too high.
What the links show, and what they don’t
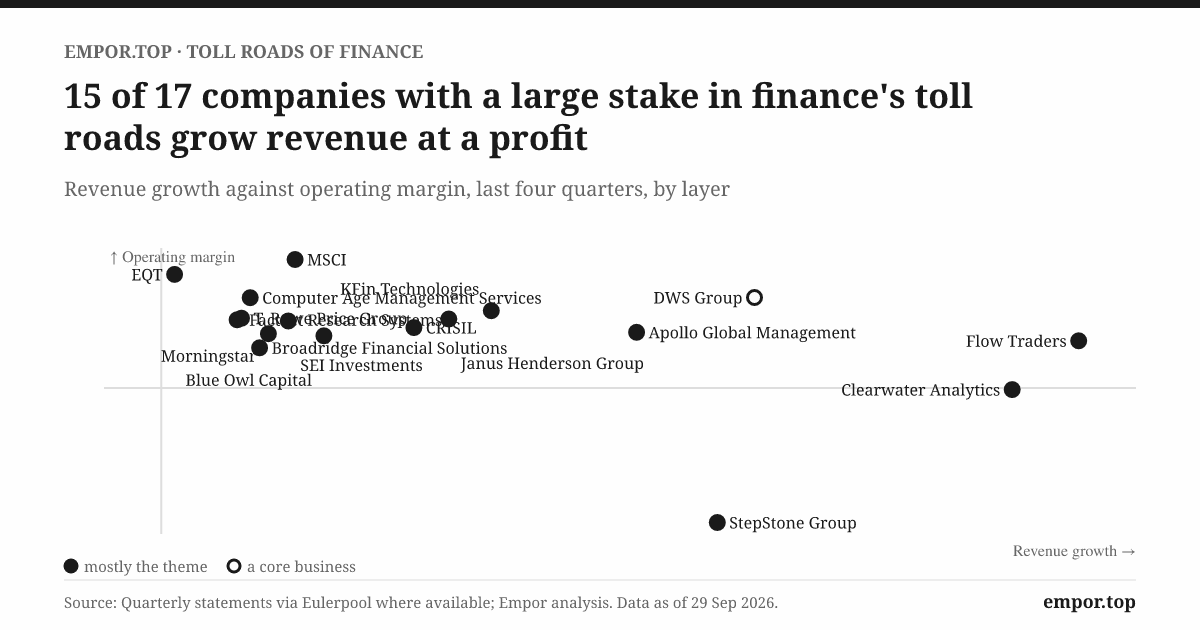
Across the chain, Empor’s links table shows a consistent pattern. Rising stock prices reached asset managers quickly, in the same or following quarter. Volatility supported market makers’ margins in the same quarter, but only loosely, and showed no consistent lift in post-trade or data revenue. For several post-trade firms, the relationship ran in the opposite direction. Some private-market managers, including Apollo, KKR and Brookfield, moved against the market because their revenue depended on when they sold assets. These observations cover roughly six years, so they are evidence rather than proof. They do challenge one simple assumption: volatility does not benefit every toll road.
The contest is therefore not simply old technology against new technology. It is about whether a new system removes a bottleneck—or transfers control of it to another owner.
The next toll road may be programmable—but it will still need a gatekeeper
Picture a tokenised bond—a claim recorded on a shared digital ledger—changing hands at 3 a.m. on a Sunday. Cash and securities move in seconds, without clerks, a netting run or a traditional settlement cycle. The Bank for International Settlements has described a unified ledger in which messaging, reconciliation and asset transfer occur in one step.41 The practical questions remain: Who confirms that the seller owns the bond? Who holds the collateral? Which regulator recognises the settlement as final? If the ledger conflicts with a custodian’s records, whose data prevails?
Each question represents a function, and each function can support a toll.
Four popular beliefs, tested
Zero commissions mean finance has become free. The screen may show a zero price, but Schwab’s and Robinhood’s results show where revenue shifted: cash balances, margin, subscriptions, securities lending and order-routing payments. The charge moved from a visible line item to less visible parts of the customer relationship. Those sources are harder for customers to compare and remain subject to regulatory change.
Tokenisation will eliminate intermediaries. The strongest case is real: shared ledgers can reduce reconciliation, the costly process of making two sets of records agree. But regulators have favoured controlled experiments over wholesale replacement. The UK’s Digital Securities Sandbox allows firms to issue, trade and settle digital securities under supervision,42 while Europe’s securities regulator has recommended amendments that would make its DLT Pilot Regime permanent.43 Both retain regulated custody, identity and settlement rules. Tokenisation may therefore reduce some processing fees while increasing demand for trusted custody, interoperability and compliance. Earlier blockchain waves produced many pilots, but limited settled volume; the commercial promise remains unproven.
More volatility helps every financial-infrastructure company. The links table points to a more selective effect. Market makers can benefit, while post-trade and data vendors show no consistent benefit or the reverse. Brokers and asset managers can face funding pressure and falling asset values. Investors who treat the theme as a volatility trade may therefore own the wrong layer.
More accounts automatically mean more profit. The Findex shows broader access, but an account is not an investment portfolio.30 Account ownership can expand quickly through a phone; profitable investing still depends on income, trust, advice and suitable products. Groww’s client growth demonstrates access, not yet durable margins.
Two ways the story can go
In an optimistic scenario, more households, pensions, ETFs, private assets and derivatives would generate additional orders and more complex collateral needs. Regulated digital securities would reduce manual processing without eliminating trusted operators. Exchanges, custodians, clearinghouses and workflow vendors could absorb the new rails and earn recurring fees from a larger base.
In a pessimistic scenario, retail trading would become commoditised faster than assets compounded. AI would make data more interchangeable. Tokenisation would fragment liquidity across incompatible ledgers. Regulators would limit routing economics, new venues would force price cuts, and incumbents would spend more on resilience and cybersecurity than they recovered. Activity could rise while revenue per transaction fell.
Empor’s consensus data showed analysts forecasting a 1.2% decline in the theme’s combined revenue the following year, compared with annual growth of 16.2% from 2020 to 2025. The theme’s shares had fallen 15.9% over the previous year after rising 36.6% over three years. Operating progress and share returns had diverged.
Developed and developing markets
Developed markets offer deep liquidity, established custody networks and mature regulators, so their toll roads tend to grow more slowly and predictably. Developing markets can expand faster from a smaller base, as India’s depositories and fund registrars illustrate. Currency swings, concentrated markets, governance concerns and regulatory change make the economics harder to forecast. An Indian infrastructure company can compound in rupees and still disappoint a dollar-based investor.
Numbers to watch
Four signals should lead revenue.
Net new assets. This measures money customers actually add, separate from market gains. It matters because assets can generate fees for years after they arrive and helps distinguish genuine platform growth from rising prices. Companies publish the figure monthly or quarterly; Schwab reported $519.4 billion of core net new assets in 2025.31 Broad growth in flows and fee-earning balances for four consecutive quarters would support the thesis. Assets rising only because markets rose would weaken it.
Derivatives contracts traded. This measures demand for risk transfer, which reaches exchanges and clearinghouses before it appears in their results. FIA reported 11.44 billion exchange-traded futures and options contracts worldwide in December 2025.44 Sustained growth across several product families would suggest lasting demand; volume that collapsed after each bout of volatility would point to a cyclical trade.
Custody and settlement activity. This measures the complexity that post-trade utilities charge to process. Euroclear’s custody exceeded €43 trillion in 2025,36 while DTCC, Euroclear and OCC publish activity in annual and periodic reports.35 Rising instructions, collateral and fee income together would support the embedded-toll thesis. Automation that reduced revenue per activity without creating new services would weaken it.
Financial account usage. This measures whether access becomes saving and investing, the raw material for every other layer. The World Bank’s Findex, published every few years, put account ownership at 79% of adults in 2024.30 Increased use of accounts for saving and investing in the next survey would support the sector’s long runway. Rising ownership alongside stagnant usage would show that access had not yet become a business.
Who owns the road
After trading commissions fell to zero, ownership of finance’s toll roads did not disappear; it became less visible. The Buttonwood brokers charged for trust at the front door. Today, revenue is collected further back: by the clearinghouse that holds collateral, the depository that maintains the record, the exchange that owns a benchmark contract, the index against which performance is measured and the software a bank cannot easily replace.
The durable owners are those controlling a function that customers, regulators and counterparties cannot readily substitute: liquidity, collateral, legal finality, trusted data or embedded workflow. The app where a trade begins is the most visible part of the road and often the easiest to replace.
Glossary
Exchange: A regulated venue that matches buy and sell orders, lists securities or contracts, and sells access, data and connectivity.
Broker: A firm that executes or arranges customers’ trades, earning revenue from commissions, interest, lending and related services.
Wealth platform: A firm that gathers household assets and may provide advice, earning much of its revenue from those assets.
Market maker: A firm that continuously offers to buy and sell, earning the spread while managing the risk between the two sides.
Liquidity: The ease of buying or selling something quickly without moving its price substantially.
Payment for order flow: Money a market maker pays a broker for the opportunity to execute the broker’s customers’ orders.
Best execution: A broker’s duty to seek the most favourable terms reasonably available for a customer’s order.
Clearinghouse: An institution that stands between the two sides of a trade, calculates obligations and collects collateral.
Central counterparty: A clearinghouse that becomes the buyer to every seller and the seller to every buyer, backed by margin and a default fund.
Central securities depository: An institution that maintains the official electronic record of securities ownership and supports transfers at settlement.
Custody: Safekeeping investors’ assets and handling income, taxes and corporate actions on their behalf.
Netting: Offsetting multiple obligations so that only the remaining balance must be paid or delivered.
T+1 settlement: Completing a trade one business day after it is made.
Benchmark index: A basket of securities used to measure performance. Funds that track it direct capital toward its constituents, and its owner can charge licence fees.
Tokenisation: Recording ownership of a financial asset on a programmable digital ledger.
References
-
The Continuous Process of Optimizing the Equity Markets — U.S. Securities and Exchange Commission ↩↩
-
Interim Reflections on Mayday — U.S. Securities and Exchange Commission, 1975 ↩
-
Brokerage Commissions and Research After May Day — U.S. Securities and Exchange Commission, 1975 ↩
-
SEC Orders Securities Markets to Phase In Decimal Pricing — U.S. Securities and Exchange Commission, 2000 ↩
-
New Millennium, New Market — U.S. Securities and Exchange Commission ↩
-
Regulation NMS — U.S. Securities and Exchange Commission, 2005 ↩
-
SEC Approves Exemptions for Central Counterparty CDS Clearing — U.S. Securities and Exchange Commission, 2008 ↩
-
Statement at SEC Open Meeting on Section 765 of the Dodd–Frank Act — U.S. Securities and Exchange Commission, 2010 ↩
-
A Letter from Robinhood Co-Founder and Co-CEO Vlad Tenev — Robinhood ↩
-
Schwab Eliminates U.S. Stock, ETF and Options Commissions — Charles Schwab, 2019 ↩
-
Modernizing Equity Markets: Remarks before SIFMA — U.S. Securities and Exchange Commission, 2024 ↩
-
SEC Statement on T+1 Settlement — U.S. Securities and Exchange Commission, 2024 ↩
-
Testimony Before the House Committee on Financial Services — U.S. Securities and Exchange Commission, 2021 ↩
-
Innovating a Modern Icon: How Bloomberg Keeps the Terminal Cutting-Edge — Bloomberg ↩
-
Robinhood Reports Fourth Quarter and Full Year 2025 Results — Robinhood Markets ↩↩
-
Intercontinental Exchange Reports Strong Full-Year 2025 Results — ICE, 2026 ↩
-
Billionbrains Garage Ventures Board Outcome — National Stock Exchange of India, 2026 ↩
-
Depository market material — Securities and Exchange Board of India, 2025 ↩
-
The Next-Generation Monetary and Financial System — Bank for International Settlements, 2025 ↩
-
ESMA Suggests Amendments to the DLT Pilot Regime to Make It Permanent — European Securities and Markets Authority ↩
 LinkedIn
 WhatsApp
 Reddit
 Hacker News
 Email
Email Kindle
 RSS Feed
 Spotify
 Apple Podcasts
 Amazon Music
 Audible
 YouTube