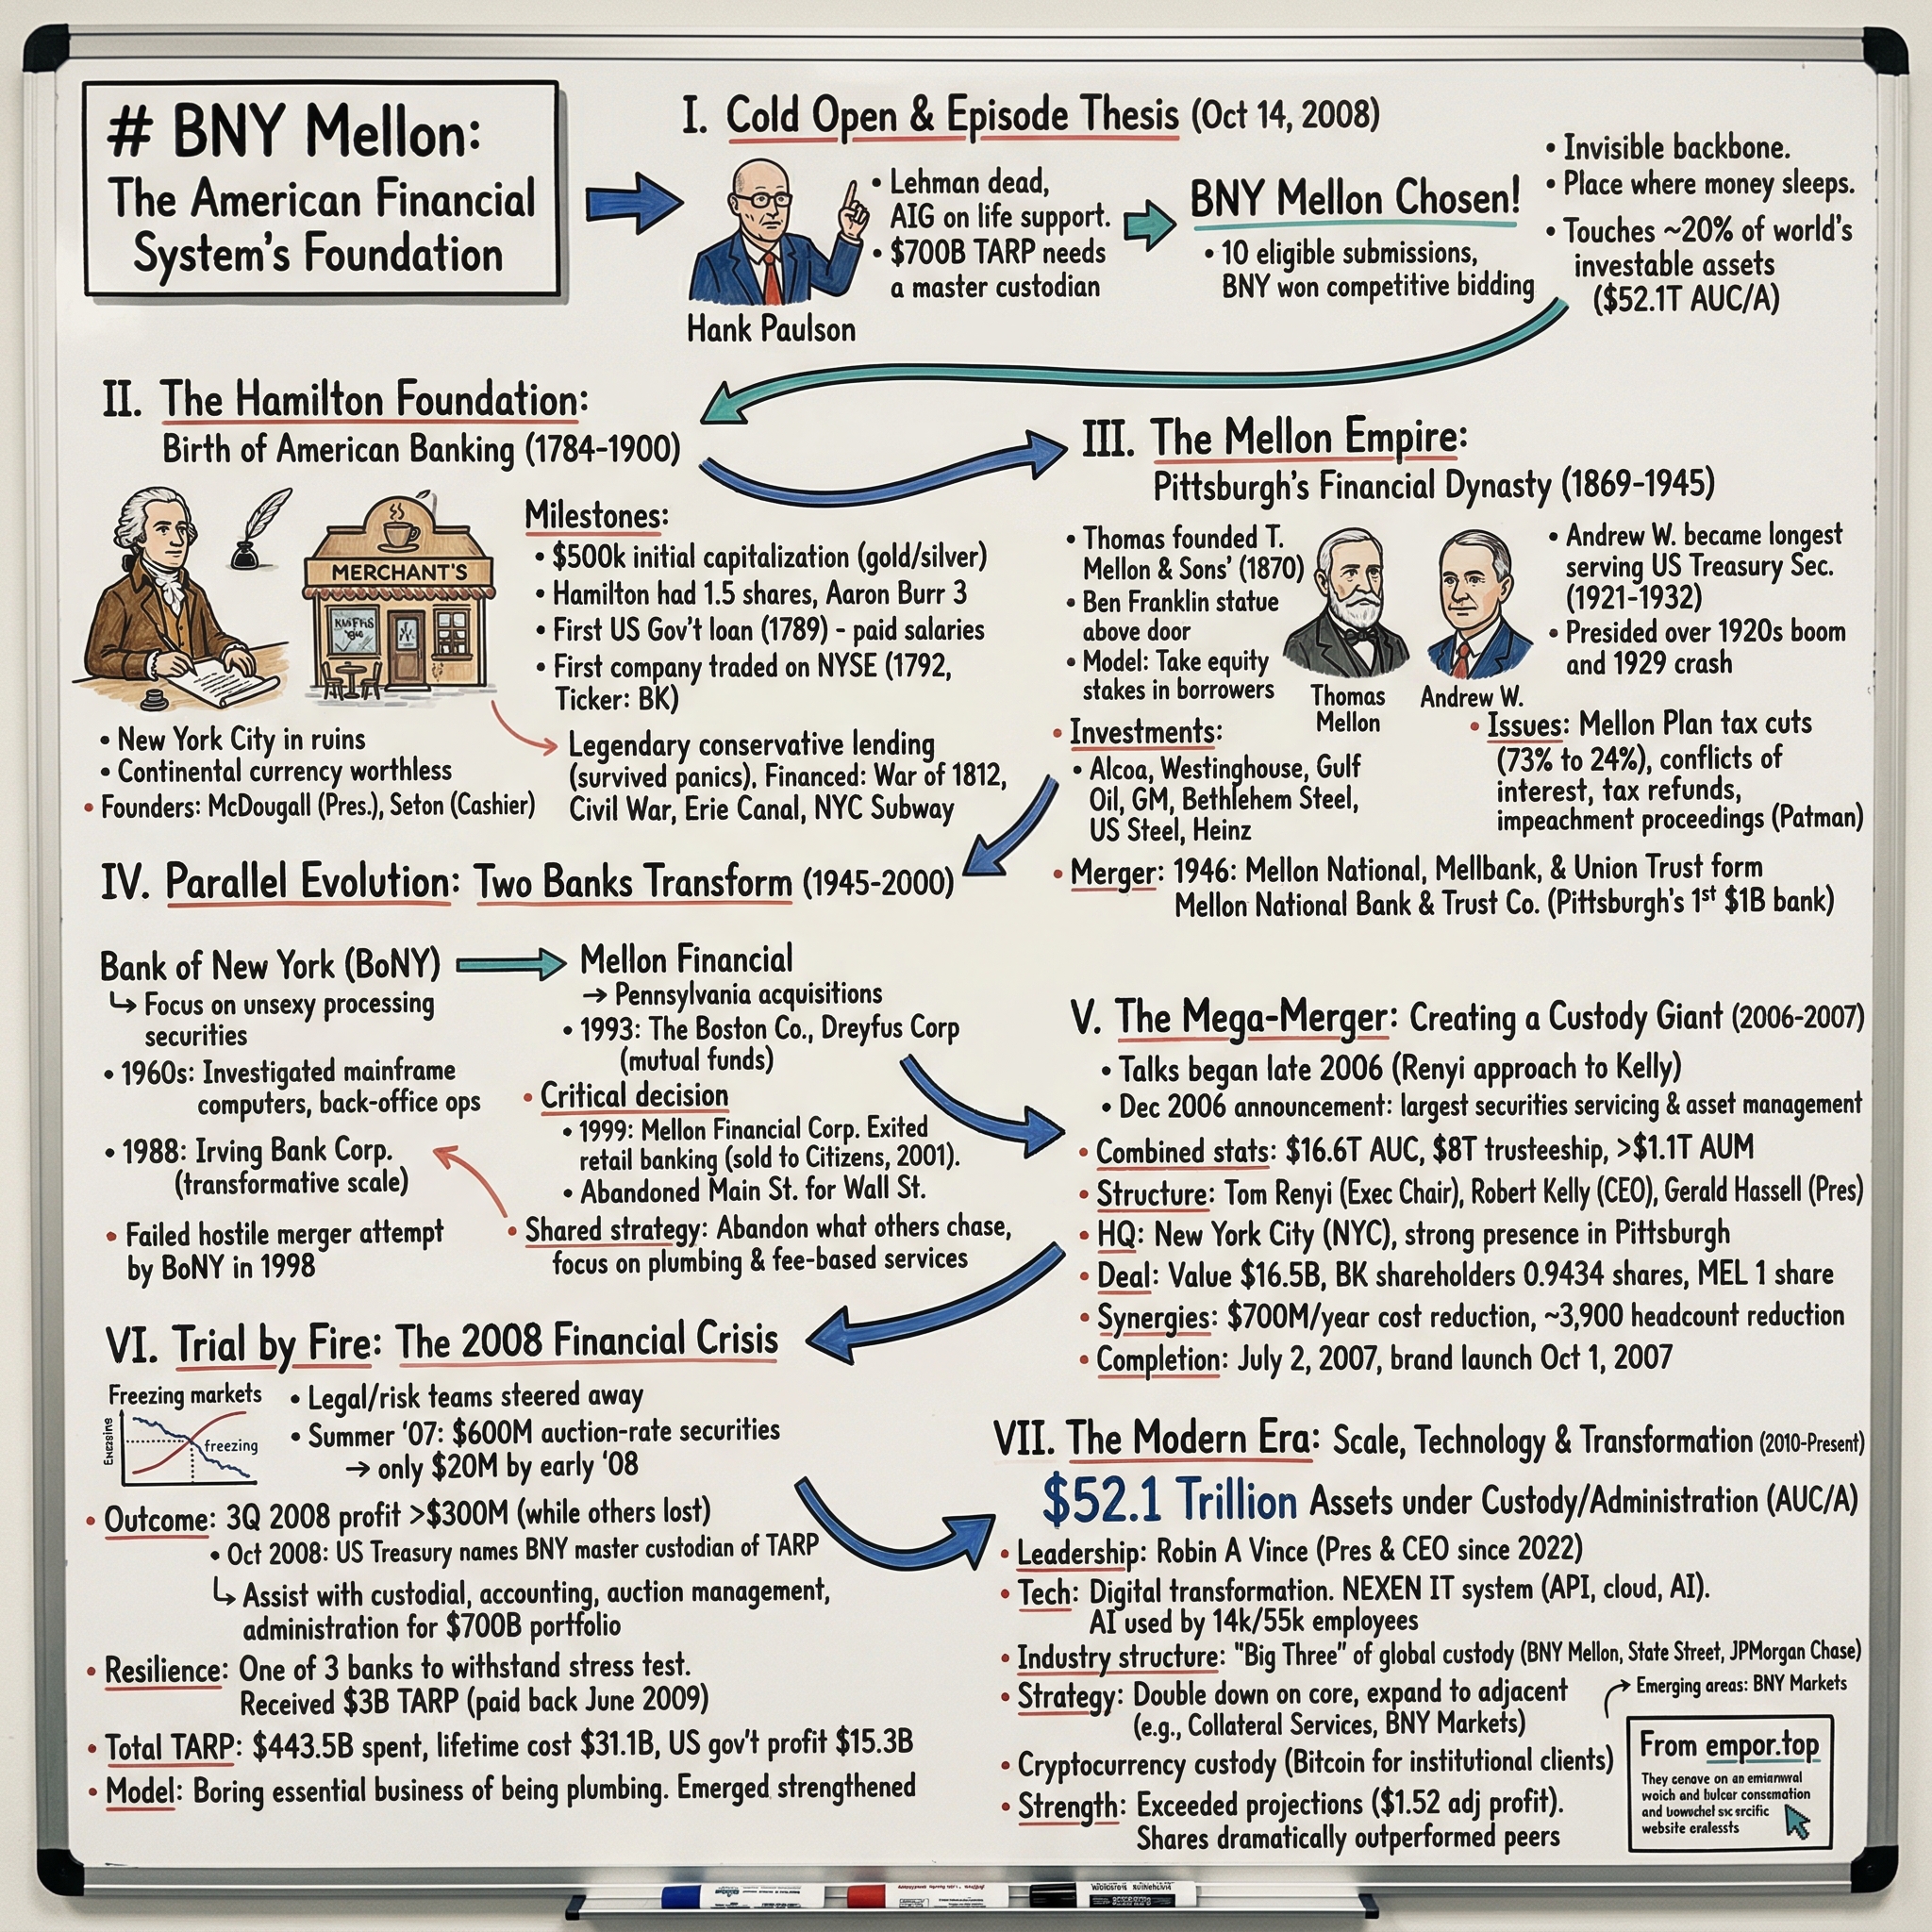
BNY: The American Financial System's Operating System
I. Cold Open & Episode Thesis
In the second week of October 2008, the plumbing of the American financial system was leaking from every joint. Lehman Brothers had failed, the Reserve Primary Fund had broken the buck, and commercial paper issuance had stalled. Congress had just authorized $700 billion of emergency purchasing power under the Emergency Economic Stabilization Act, presenting the U.S. Treasury Department with an urgent operational challenge: an institution had to hold the assets, price them, account for them, run the auctions, keep the records, and maintain a ledger that the Government Accountability Office could audit.
Treasury did not assign that role to Wall Street's most profitable bank. On October 14, 2008, following a competitive bidding process, it named The Bank of New York Mellon as financial agent and master custodian for the Troubled Asset Relief Program.12 The firm selected was not the one most adept at taking risk, but the one specialized in risk mitigation—recordkeeping, settlement, and verifying asset ownership for institutional clients.
That mandate reflects the core business model of BNY. It is not a bank in the traditional retail or commercial sense, as it does not primarily generate earnings from loan spreads. Instead, it safekeeps assets, settles trades, calculates fund valuations, executes money transfers, and finances overnight securities inventories. Its business model resembles essential toll infrastructure more than speculative risk-taking.
The scale of these operations is immense. As of June 30, 2026, BNY reported $62.6 trillion in assets under custody and/or administration, up 12% year over year, and $2.2 trillion in assets under management.3 Global annual gross domestic product represents roughly one percent of that custody figure. On a typical day, approximately $3.1 trillion in repurchase agreements settle on BNY's tri-party platform, excluding centrally cleared volume—the overnight financing market that keeps primary dealers, money market funds, and the Treasury market itself liquid.45
What a custodian actually does
Understanding BNY's investment thesis requires examining the core functions of global custody.
When an institutional fund in Ontario buys shares in a Japanese manufacturer, a series of complex operational steps must occur beyond stock selection. A custodian must receive the shares in Tokyo and hold them in a segregated account to ensure ownership remains protected if the fund's broker fails. The custodian must collect foreign dividends, process treaty withholding tax reclaims, execute currency conversions, process corporate actions, vote proxy ballots per client instruction, calculate daily portfolio valuations, and deliver audited financial records across sixty markets, dozens of currencies, and multiple legal regimes every business day.
That custodian operates much like a specialized technology infrastructure provider paid through asset-based custody fees, transaction fees, and ancillary service charges. Institutional clients choose custodians based on operational reliability and risk controls, as the financial cost of an operational failure far outweighs potential fee savings.
The central question is how a commercial bank founded in 1784 by a group of New York merchants under Alexander Hamilton's leadership6 became the underlying operating system for global capital markets—and whether that position remains as defensible as its market share suggests.
BNY's history is not an uninterrupted record of compounding growth. Between 2010 and 2021, BNY delivered modest returns on tangible common equity, absorbed a $714 million settlement for systematically mispricing foreign exchange trades for its custody clients, took a $680 million goodwill write-down on its asset management franchise, faced activist investor pressure, and experienced a vendor software outage that disrupted net asset value calculations for roughly 1,200 funds. Performance shifted starting in 2022 under a chief executive officer brought in from Goldman Sachs. For full-year 2025, the company reported record revenue of $20.1 billion, record net income applicable to common shareholders of $5.3 billion, ROTCE of 26.1%, and its eighth consecutive quarter of positive operating leverage.7 By the second quarter of 2026, the pre-tax margin had reached 39.8% and ROTCE 31.3%.3 In May 2026, the company retired the ticker "BK" in favor of "BNY."8
The roadmap
The bullish case contends that BNY's franchise moat remained durable while management improved monetization. The bearish case suggests that recent performance gains largely reflect favorable interest rate tailwinds and equity market appreciation. This analysis tests both perspectives against the company's historical execution record and financial commitments.
 Subscribe on LinkedIn
II. The Hamilton Foundation: Birth of American Banking (1784–1900)
In the winter of 1784, lower Manhattan was recovering from the British evacuation a year earlier. The city's economy struggled under confiscated Loyalist property, worthless Continental currency, and a severe credit shortage driven by the lack of any state-chartered financial institution. On February 23, 1784, a group of merchants and lawyers met at the Merchant's Coffee House and agreed to form a bank. Alexander Hamilton—then twenty-nine, a lawyer, and not yet Treasury Secretary—was named a director, and over the following three weeks he drafted the bank's constitution.69
This operational foundation proved crucial. Hamilton was not simply launching a financial venture; he was designing an institution built on binding governance rules. The document specified lending procedures, acceptable collateral, director rotation schedules, and accounting standards. Conservative lending, short maturities, and strict governance were necessary mechanisms to convince a skeptical public that paper issued by a private institution in a country without a central bank held reliable value.
Governance as product
The approach succeeded, establishing the bank as one of the earliest securities traded in New York's nascent stock market following the Buttonwood Agreement of 1792.6 The Bank of New York became an original blue chip, maintaining its public listing continuously for over two centuries—one of the longest unbroken runs in financial history.
What the long history really bought
The standard narrative attributes the firm's competitive moat to a two-century conservative risk culture. That argument warrants scrutiny. Culture is not a balance sheet asset, and financial institutions inevitably experience changes in ownership, charters, and leadership over long horizons. Instead, BNY's history provided two tangible structural advantages. First, the bank navigated the Panics of 1837, 1857, 1873, and 1893—crises that destroyed numerous American banks—by focusing on trade finance and transaction settlement rather than speculative land and railroad lending. Second, it built an operational and legal franchise: charters, correspondent banking networks, custody appointments, and corporate trust mandates that compound over decades through long-term contracts and indentures.
This legal embedding represents the primary structural asset. When an institution is named trustee on a bond indenture or custodian in a pension fund's investment management agreement, it does not need to re-compete for that business annually. The arrangement persists by default. Over a century of accumulating these contractual roles, the bank became embedded across corporate and institutional agreements that counterparties rarely seek to replace.
A second structural advantage stems from nineteenth-century clearing mechanics. Banking in early New York centered on clearing transactions: merchants presented drafts drawn on distant correspondents, banks netted obligations, and institutions settled daily balances. The New York Clearing House, established in 1853, formalized clearing practices the city's banks had conducted for decades. The Bank of New York operated within a financial ecosystem focused primarily on settlement reliability rather than speculative risk expansion. Developing large-scale clearing expertise established the foundational capabilities for its modern role as a global market utility.
Throughout the nineteenth century, however, the firm remained a regional New York commercial bank. Its eventual transformation into a global financial infrastructure provider required industrial-scale asset management and trust capabilities—a framework being developed concurrently four hundred miles west by a family closely tied to American industrial expansion.
III. The Mellon Empire: Pittsburgh's Financial Dynasty (1869–1945)
The judge who preferred balance sheets
In 1869, Thomas Mellon, an Irish-born magistrate, left the Allegheny County Court of Common Pleas to open T. Mellon & Sons' Bank on Smithfield Street in Pittsburgh. The city was rapidly becoming one of the most concentrated industrial centers in the world. Steel, coke, glass, aluminum, and rail converged there, creating an appetite for capital that traditional financing structures could not satisfy.
The Mellons operated differently from conventional commercial banks. Thomas, along with his sons Andrew and Richard, used the bank's balance sheet as a venture capital vehicle long before the term existed. Rather than merely lending against collateral, they took equity stakes, board seats, and in several instances helped launch companies directly. Mellon capital financed the founding and scaling of Alcoa in aluminum, Gulf Oil in petroleum, Koppers in coke by-products, and Carborundum in abrasives—a portfolio of businesses that shaped American heavy industry for decades.
This strategic approach established an institutional orientation that became central to BNY a century later. Where The Bank of New York specialized in process—settlement, recordkeeping, and conservative underwriting—the Mellon enterprise focused on ownership and asset stewardship: holding, managing, and compounding assets on behalf of wealthy families through trust arrangements. One institution developed as a ledger; the other developed as a fiduciary. The 2007 merger combined two distinct capabilities rather than simply scaling a single business model.
When an industrial entrepreneur sought capital, Andrew Mellon often evaluated the factory and technology directly rather than relying on a formal credit committee. The firm then structured deals combining debt, equity, and direct governance. Successful investments yielded interest, dividends, and capital gains while securing exclusive commercial banking relationships. If an enterprise struggled, conservative collateral terms protected the bank's downside. This concentrated, relationship-driven strategy closely resembled modern private equity, establishing the Mellons among the wealthiest families in the United States.
However, this approach introduced a risk that global custodians typically avoid: concentrated correlation. The Mellon fortune, the bank's loan portfolio, and the Pittsburgh regional economy all represented an overlapping bet on heavy industry. That strategy generated tremendous wealth for decades, but exposed the institution to severe cyclical downturns.
Andrew Mellon in Washington
Andrew Mellon went on to become one of the most influential and controversial figures in American economic policy. Appointed Secretary of the Treasury by Warren Harding in 1921, he served continuously under Harding, Coolidge, and Hoover until February 1932—a tenure of nearly eleven years, making him the third-longest-serving Treasury Secretary in U.S. history.10 His policy framework, known as the Mellon Plan, reduced top marginal tax rates, prioritized national debt reduction, and established a template for supply-side tax policies in subsequent decades.
The era ended in economic turmoil. Mellon's insistence on balancing the federal budget through spending cuts and tax increases as the economy collapsed after 1929 is widely judged to have deepened the Great Depression, damaging his public reputation.11 This history highlights an enduring tension within the institution: the core Mellon philosophy—protecting the balance sheet, prioritizing solvency, and enduring downturns rather than risking capital on speculative recovery—underpins the risk discipline of a global custodian, even as it can restrain aggressive top-line growth.
The 1946 consolidation and the trust inheritance
Commercial results during the Depression validated this conservatism. While thousands of American financial institutions collapsed, Mellon National Bank survived and absorbed distressed competitors. Its 1946 merger with Union Trust Company established a dominant Pittsburgh institution combining commercial lending with a substantial trust and fiduciary business.12 Managing assets under a strict legal duty of care laid the foundation for Mellon's expansion into institutional administration.
By the end of World War II, two distinct entities were evolving along parallel tracks: The Bank of New York specialized in trade settlement and custody, while Mellon in Pittsburgh specialized in fiduciary management and administration. Over the following decades, both institutions faced structural shifts that made traditional spread-based commercial lending increasingly challenging.
IV. Parallel Evolution: The Pivot to Securities Services & Custody (1945–2000)
The postwar decades brought a structural transformation of traditional American banking. Deposit rate deregulation, the growth of money market funds and the commercial paper market, disintermediation by capital markets, and the savings-and-loan crisis continuously compressed net interest margins—the spread between what a bank pays for funding and what it earns on loans. By the 1980s, mid-sized commercial banking had become a capital-intensive, credit-cyclical business yielding returns that barely covered the cost of equity.
The Bank of New York and Mellon responded to these pressures through distinctly different strategies.
Two answers to the same problem
The Bank of New York's strategy focused on subtraction. Rather than trying to compete against money-center peers like Citicorp and Chase in retail and corporate lending, the bank systematically shed capital-intensive, credit-sensitive operations to double down on fee-based administrative services: custody, corporate trust, transfer agency, and American Depositary Receipts (ADRs). ADRs allowed domestic investors to purchase foreign equities through U.S. securities, with the bank serving as intermediary to issue receipts, handle currency conversions, distribute dividends, and process corporate actions. None of these processing businesses were glamorous, but all offered annuity-like fee streams with favorable operating leverage, as the marginal cost of administering additional programs declined sharply with scale.
The culminating move arrived in January 2003, when The Bank of New York agreed to acquire Pershing from Credit Suisse First Boston for approximately $2 billion in cash—a premium of roughly $1.4 billion over book value.13 Pershing operated as the back office for the independent brokerage industry, providing clearing, settlement, custody, margin lending, and technology to broker-dealers and registered investment advisers (RIAs). At the time of the transaction, Pershing handled roughly 10% of New York Stock Exchange trading volume and held around $400 billion in customer assets.13 Although paying nearly 3.5 times book value appeared expensive, the deal secured a critical distribution pipeline into independent wealth management, which subsequently grew into one of the fastest-expanding segments of the market.
Mellon's strategy relied on acquisition. Under Chief Executive Officer Frank Cahouet and his successors, Mellon expanded directly into active investment management. In 1993, it acquired The Boston Company, an institutional asset manager and servicer, from American Express for approximately $1.45 billion.12 In December 1994, Mellon agreed to acquire The Dreyfus Corporation—then the sixth-largest U.S. mutual fund company—for $1.85 billion in stock, marking the largest acquisition of a mutual fund complex by a bank up to that point.12 The deal instantly transformed Mellon into the largest bank manager of mutual funds in the United States.
Testing the cross-sell thesis against thirty years of evidence
A thirty-year assessment reveals that the two strategies produced markedly different long-term results.
The custody and clearing model compounded effectively. Its underlying economics proved highly durable: clients paid basis-point fees on assets held and transaction fees on volume processed. Serviced assets expanded automatically with broader market appreciation, operational and contractual switching costs bound clients to the platform, and fixed technology overhead yielded high incremental margins as transaction volume grew.
By contrast, active asset management faced severe secular headwinds. Within years of the Dreyfus acquisition, low-cost index funds from Vanguard and exchange-traded funds from BlackRock's iShares began eroding fee structures across retail active funds. Industry capital flowed toward passive strategies, fee margins compressed, and distribution power migrated toward digital platforms. Furthermore, the strategic premise that a bank could cross-sell investment management into existing custody accounts proved flawed. Custody mandates were awarded by institutional operations executives focused on risk and efficiency, whereas asset management mandates were selected by chief investment officers evaluating performance—making custody relationships largely irrelevant to manager selection.
The long-term friction in active asset management eventually surfaced directly on the balance sheet. In the third quarter of 2022, BNY Mellon recorded a $680 million non-cash goodwill impairment within its Investment Management unit, attributing the charge to lower market valuations and a higher discount rate.14 On November 1, 2022, the company completed the sale of BNY Alcentra Group Holdings—a credit manager with approximately $32 billion in assets under management at the end of October 2022—to Franklin Resources.15 Management noted at the time that the impairment reflected external market inputs rather than a shift in corporate strategy.14 While defensible under standard accounting mechanics, that rationale highlighted a broader capital allocation lesson: an acquisition whose carrying value erodes under higher interest rates decades later did not deliver the durable compounding originally envisioned.
The historical record supports a clear strategic distinction rather than a blanket indictment of bank mergers. BNY's acquisitions created durable value when buying infrastructure with contractual stickiness and near-zero marginal cost, but destroyed value when buying fee streams exposed to the secular repricing of active management. That distinction remains a primary framework for evaluating the firm's strategic moves.
This strategic evolution faced an immediate test under extreme market stress, as the two institutions prepared to combine on the eve of the 2008 global financial crisis.
V. The 2007 Mega-Merger & Financial Crisis Trial by Fire (2006–2009)
The trade that came first
Before the merger came an asset swap that revealed more about strategic intent than the deal itself.
On April 8, 2006, Bank of New York and JPMorgan Chase announced a reciprocal transaction. JPMorgan acquired Bank of New York's consumer, small-business, and middle-market banking franchise—338 branches and roughly $14.5 billion in deposits. In exchange, Bank of New York acquired JPMorgan's corporate trust business, plus $150 million in cash.[^16] The transaction closed on October 1, 2006.16
The transaction highlighted the divergent priorities of both institutions. JPMorgan sought retail deposits and consumer relationships to build a universal bank. Bank of New York sought corporate trust mandates to expand its fee-based utility model. Through a single transaction, the 222-year-old commercial bank formally exited retail banking, leaving itself without a branch network to cushion earnings if its transaction-processing model faltered.
The merger, and the luckiest timing in modern banking
Nine months later, on July 1, 2007, The Bank of New York Company and Mellon Financial completed their merger to form The Bank of New York Mellon Corporation. Mellon shareholders received one share of the new company for each Mellon share, while Bank of New York shareholders received 0.9434 shares. Robert P. Kelly, who had led Mellon, became chief executive officer, and Thomas Renyi of Bank of New York became executive chairman. The combined institution launched with more than $1 trillion in assets under management and more than $18 trillion in assets under custody or administration, making it the largest asset servicer in the world upon closing.17
The timing was, whether viewed as luck or strategic foresight, notable. Two months after closing, the asset-backed commercial paper market stalled. Within a year, Bear Stearns collapsed, and within fifteen months, Lehman Brothers failed.
BNY Mellon's experience during the crisis was more nuanced than popular memory suggests. The widespread narrative holds that custody banks emerged entirely unscathed. The financial record indicates a more complex outcome.
On one hand, the fee business demonstrated durability. BNY Mellon reported net income applicable to common shareholders of $1.4 billion for 2008, or $1.20 per diluted share—down from $2.0 billion and $2.18 per share in 2007, yet solidly profitable during a period of widespread banking losses.18 This performance reflected structural mechanics: while asset-based custody fees declined alongside falling market valuations, processing revenue rose as heightened volatility drove higher transaction settlement volumes.
On the other hand, the investment portfolio faced credit stress. The 2008 results absorbed roughly $1.6 billion in pre-tax securities write-downs, primarily on residential mortgage-backed securities held in the investment portfolio—representing approximately $0.85 per share.18 Because custody banks accumulate large client cash balances that must be deployed, investment portfolio credit quality remains an ongoing sensitivity across market cycles.
BNY Mellon also participated in federal support programs. In October 2008, the company received $3.0 billion under the Treasury's TARP Capital Purchase Program alongside other major financial institutions. It repurchased the preferred stock in June 2009 and bought back the associated warrant later that year, returning roughly $3.2 billion to the Treasury across preferred principal, warrant redemption, and dividends.1920 While rapid repayment at a profit to taxpayers demonstrated capital strength, the capital injection highlighted that trust banks were not fully insulated from systemic liquidity pressures.
The mechanics of market panics affect custody banks in counter-intuitive ways. Falling asset valuations depress asset-based custody fees, but market turmoil triggers sharp increases in transaction settlements, securities lending, collateral transfers, and foreign exchange execution. Furthermore, institutional flight to safety inflates client deposit balances, supporting net interest income. In 2008, BNY Mellon's deposit base expanded as institutional clients sought conservative balance sheets. Consequently, the business model combines a resilient operational revenue mix with balance-sheet exposure in its investment portfolio.
The mandate that defined the franchise
The crisis validated the strategic rationale behind the transaction-utility pivot. When the Treasury Department required an administrator for its emergency purchasing program, the selection turned on operational capabilities—auditable recordkeeping, asset segregation, valuation infrastructure, and freedom from underlying asset conflicts—rather than trading balance sheets.1 BNY Mellon secured the master custodian role through a competitive bidding process.2 The Federal Reserve Bank of New York similarly relied on the firm's clearing and administrative infrastructure to execute the Term Asset-Backed Securities Loan Facility.
For investors, the crisis highlighted the fundamental investment trade-off of global custody: fee revenue tied to market mechanics demonstrates far greater resilience during a credit shock than net interest income tied to traditional lending, but the investment portfolio funded by client deposits remains vulnerable to balance-sheet impairment.
As central banks responded to the crisis by cutting interest rates toward zero, the business model soon encountered a different operational challenge.
VI. The Post-Crisis Stagnation: Rate Drag, Regulatory Capital & M&A Underperformance (2010–2021)
Here is a strange thing about being a custodian: you make a great deal of money on money doing nothing.
Custody clients park enormous operational cash balances with their custodian — margin, dividends awaiting distribution, unsettled trade proceeds, subscription cash. The custodian pays little or nothing on those balances and invests them in Treasuries, agency securities, and reserves at the Fed. In a world with 5% short rates, that is a magnificent business. In a world with 0% short rates, it is a rounding error.
From 2009 through 2015, and again through 2020 and 2021, the federal funds rate sat effectively at zero. The consequences for BNY Mellon were direct and brutal in two separate ways. Net interest revenue on the deposit base collapsed. And — the second-order effect that outsiders consistently underestimate — the company had to waive fees on its own money market funds. When a money fund's gross yield falls below its expense ratio, the manager must either waive fees or let investors post a negative return and watch the assets leave. Across the industry, managers waived. For a firm running a large money fund complex, that meant handing back hundreds of millions of dollars of contracted revenue a year with no offsetting expense relief.
The result was a decade of returns that no shareholder enjoyed. Pre-tax operating margin in 2024 — well into the recovery — was still only 31%, and adjusted ROTCE was 23.8%.721 The 2010s were meaningfully worse. Meanwhile, designation as a Global Systemically Important Bank22 brought stress testing, a supplementary leverage ratio that penalizes the very low-risk, high-volume balance sheet a custodian runs, and capital requirements calibrated for institutions taking risks BNY does not take. A leverage ratio treats a Treasury security and a subprime loan identically. For a bank whose balance sheet is largely Treasuries and central bank reserves, that is an expensive accident of regulatory design.
But rate policy is an excuse, and excuses are not analysis. The genuinely damaging events of this period were self-inflicted, and they cut directly at the central claim in the BNY investment case.
The FX scandal, and what it revealed about pricing power
The claim: custody switching costs give BNY pricing power across the services it wraps around custody.
The disconfirming evidence: the standing-instruction FX scandal.
When a global pension fund holds Japanese equities, its dividends arrive in yen and must be converted to dollars. Most funds do not want to staff a currency trading desk for this housekeeping, so they give the custodian a "standing instruction" — convert it automatically, and we will trust you on price. It is the definition of a low-attention, high-trust, bundled service. It is exactly the kind of peripheral revenue that a switching-cost moat is supposed to protect.
On March 19, 2015, BNY Mellon agreed to pay $714 million to resolve claims brought by the U.S. Attorney for the Southern District of New York, the New York Attorney General, the SEC, the Department of Labor, and private class actions over its standing instruction FX product.232425 The admitted conduct was not a pricing dispute. The bank had represented that it would give clients the best interbank rates of the day, and had instead systematically assigned prices at or near the worst rates at which the currency had traded during the relevant period — while leading clients to believe otherwise.2325
Sit with the strategic implication rather than the moral one. The bank was, in effect, running an experiment on how much of its clients' inattention it could monetize. The experiment ran for years. And it ended not because a client switched custodians — almost none did — but because litigation and regulators forced disclosure. Institutional clients then repriced the product permanently. The honest conclusion is that the switching-cost moat is real but narrower than usually described: it protects retention, and it does not protect opaque pricing once the opacity is removed. The forward test for investors is not customer counts. It is whether ancillary revenue per unit of custodied assets — FX, securities lending, collateral, financing — holds up when clients can see what they are paying.
One weekend, 1,200 funds, and the limits of scale
The second claim tested in this decade: scale guarantees operational resilience.
On the weekend of August 22–23, 2015, SunGard performed an operating system upgrade on the InvestOne fund accounting platform that BNY Mellon used to strike net asset values. Both the primary and backup environments became corrupted. The bank was unable to calculate August 24 NAVs for roughly 1,200 funds and share classes belonging to approximately 66 clients — on a day, as it happened, of extreme market volatility.[^27]26 Funds resorted to manual and estimated pricing. Some clients received information late and inconsistently.
In March 2016 BNY Mellon paid $3 million to settle a Massachusetts Securities Division investigation, which found the firm had no adequate backup plan and had not given fund boards sufficient time to decide how to price, and agreed to changes in internal controls and supervisory procedures.26 The fine was trivial. The finding was not. Scale in this business concentrates operational risk as surely as it spreads fixed costs. One vendor, one upgrade, one weekend, and a meaningful slice of the U.S. fund industry could not tell investors what its shares were worth. Every argument about BNY's technology scale advantage has to be held simultaneously with this: the same centralization that produces the cost advantage produces the blast radius.
The activist arrives
By late 2014 the market had noticed the underperformance. Trian Fund Management, Nelson Peltz's activist firm, built a roughly $1 billion position, and after pressure BNY Mellon gave Trian co-founder Edward Garden a board seat in December 2014, with a mandate that was essentially "your margins lag your peers, fix them."27 Trian's diagnosis — an over-complex, over-bureaucratic organization that did not convert its structural position into profit — would prove to be the correct one. It would just take another eight years, and a different CEO, for the fix to arrive.
VII. The Modern Era: Robin Vince, "One BNY," & Technological Transformation (2022–Present)
The risk officer who became a CEO
Robin Vince became chief executive officer on August 31, 2022.28 He brought an unusual background for the role: twenty-six years at Goldman Sachs, serving as chief risk officer, treasurer, and head of global markets operations. Rather than a traditional custody executive, Vince was a risk and operational specialist who spent his career on the client side of custody and clearing services—arriving with direct insight into institutional client pain points.
His initial priority was addressing structural inefficiencies directly. On early earnings calls, Vince characterized the bank's performance over the prior decade as disappointing, acknowledged shortfalls in expense control, and made "bending the cost curve" the central objective for 2023.2930 While initial resetting of expectations is standard for an incoming chief executive, it established a measurable commitment: sustaining positive operating leverage, where revenue growth consistently outpaces expense growth.
Judged on that commitment, initial execution proved strong. By the fourth quarter of 2025, BNY had delivered eight consecutive quarters of positive operating leverage. For full-year 2025, the company generated 507 basis points of reported operating leverage and 411 basis points on an adjusted basis, with record revenue of $20.1 billion, net income applicable to common shareholders of $5.3 billion, diluted earnings per share of $7.40—up 28%—a pre-tax margin of 35%, and a return on tangible common equity of 26.1%.7 Performance continued into 2026: by the second quarter, the firm reported 606 basis points of operating leverage, a 39.8% pre-tax margin, and a 31.3% ROTCE on record quarterly revenue of $5.7 billion.3
Breaking the silos
The strategy, decoded. Under the banner of "One BNY," management restructured the company's operating architecture. Historically, the institution functioned as a collection of independent product silos—asset servicing, corporate trust, Pershing clearing, and treasury services—each operating separate sales forces, technology platforms, and profit statements with minimal cross-business coordination. A client utilizing six BNY services often managed six distinct account teams and onboarding workflows. The reorganization consolidated operations onto a shared platform model featuring unified technology, standardized client onboarding, and incentive structures tied to total client relationships.
Evaluating the commercial impact requires examining disclosed cross-sell data. On the fourth-quarter 2025 earnings call, management reported that the number of clients using three or more BNY services expanded 64% over a two-year period.31 On the second-quarter 2026 call, Chief Financial Officer Dermot McDonogh stated that more than half of asset servicing clients had awarded additional mandates to other BNY business lines, marking a fourteenth consecutive quarter of year-over-year sales growth and an increase in average deal size of over 20%.32 While these metrics represent self-selected management disclosures lacking independent audit, their consistent reporting aligns with an acceleration in organic fee growth from roughly flat to approximately 4.5%.32
Digital employees, and what they have and have not proven
The AI layer, described honestly. BNY has integrated production artificial intelligence more aggressively than many peer institutions. Through an internal platform named Eliza, the firm had deployed over 130 "digital employees" by the fourth quarter of 2025—software agents handling specialized operational workflows including payment exceptions, reconciliation breaks, and code review under human supervision.31 By March 2026, that deployment expanded to approximately 140 agents alongside 220 enterprise AI solutions under development, with roughly half the workforce utilizing AI tools daily.33 Management noted on the second-quarter 2026 earnings call that AI assistance generated approximately 40% of newly written software.32 Vince has framed AI primarily as an operational capacity enhancer rather than a direct job elimination initiative.3233
Headcount metrics provide additional context. BNY reported approximately 53,400 employees at year-end 2023, 51,800 at year-end 2024, and 48,100 at year-end 2025—a nearly 10% decline over two years even as total revenue expanded.34 Labor efficiencies have clearly contributed to positive operating leverage.
Assigning precise financial returns to AI deployment remains complex. When asked on the second-quarter 2026 call to quantify the return on AI capital expenditure, Vince declined to isolate a specific figure, stating that returns are integrated into broader operating results rather than separately tracked.32 Notably, BNY's operating leverage expansion preceded large-scale agent deployment, indicating that structural reorganization and cost management represent substantial drivers of margin improvement alongside technological adoption.
Vince's standing in technology governance expanded in July 2026, when OpenAI appointed him to the boards of the OpenAI Foundation and OpenAI Group PBC.35 However, for governance-focused investors, the appointment adds external responsibilities to an executive who also assumed the board chairmanship of BNY in September 2025, with Joe Echevarria transitioning to lead independent director.28 Combining the chairman and CEO roles marks a departure from prevailing governance recommendations among institutional shareholders, occurring during a period of strong operating performance.
The transformation strategy has also depended heavily on Chief Financial Officer Dermot McDonogh, who joined in 2022 from Goldman Sachs after serving as chief operating officer of its international business. McDonogh's detailed communication style—quantifying cost savings, outlining guidance assumptions, and highlighting difficult year-over-year comparisons—has built credibility as reported metrics met expectations. At the same time, relying on two senior leaders recruited from the same institution creates key-person concentration risk for the investment thesis.
Branding updates further reflected the corporate restructuring. In June 2024, the firm simplified its core brand identity from BNY Mellon to BNY, updating its logo and aligning business units under BNY Investments, BNY Wealth, and BNY Pershing, while retaining The Bank of New York Mellon Corporation as its legal entity.3637 In May 2026, the company retired its longstanding stock ticker "BK" in favor of "BNY."8 While branding changes are cosmetic, they reinforce the operational consolidation away from a decentralized structure.
Promises versus outcomes
On management credibility. Evaluating executive accountability requires comparing operational targets against actual performance. On January 13, 2026, alongside its full-year 2025 financial results, BNY raised its medium-term through-the-cycle targets by 500 basis points each, establishing goals of a 38% pre-tax margin and a 28% ROTCE over a three-to-five-year horizon.3138 By the second quarter of 2026, results surpassed those milestones, with the firm reporting a 39.8% pre-tax margin and a 31.3% ROTCE.3 When questioned on the July 2026 call regarding the target overshoot, McDonogh characterized the medium-term metrics as "miles and not endpoints."32 While reasonable during favorable cyclical conditions, the response leaves official guidance less informative; investors must assess whether future target revisions establish a higher structural performance floor rather than merely reflecting peak-cycle upside.
Executive compensation incentives closely track these operating priorities. Performance share units vest based on three-year average adjusted ROTCE, weighted at 70%, and relative total shareholder return, weighted at 30%, while the annual incentive scorecard directly incorporates adjusted operating leverage and adjusted pre-tax margins.21 For the 2023–2025 performance cycle, PSUs vested at 125% for the ROTCE metric and at 200% for relative shareholder return, reflecting a top-percentile finish relative to the designated peer group.21 Vince's total direct compensation awarded for 2025 performance reached $48.85 million, with SEC-reported total compensation of $83.5 million—yielding a CEO-to-median-employee pay ratio of 1,018 to 1 relative to the median employee total of $81,987.21 Advisory say-on-pay votes received 94.4% shareholder approval in 2025 and averaged approximately 95% over three years.21 Although equity holders have strongly supported compensation outcomes tied to outperformance, the pay ratio sits near the upper bound for large financial institutions, and ROTCE metrics remain mechanically sensitive to capital reduction via share buybacks.
VIII. Business Model & Segment Economics Deep Dive
Beyond its 242-year history, modern BNY operates across three primary business segments with distinct economic profiles, alongside a corporate division. Disaggregating these segments reveals which units drive the firm's ongoing margin expansion.
Securities Services: the ledger business
Securities Services represents the historical core, encompassing asset servicing (custody, fund accounting, net asset value calculation, fund administration, and securities lending) alongside issuer services (corporate trust and depositary receipts). In the second quarter of 2026, the segment generated $2.83 billion in total revenue and $1.11 billion in pre-tax income, operating at a 39.3% pre-tax margin across more than $43 trillion in custodied assets.3 Functioning as an institutional ledger, the business earns basis-point fees to maintain authoritative ownership records, calculate nightly valuations, and settle cross-border trades. The segment's pre-tax margin expanded notably from 35.3% a year earlier3 and 28% in the fourth quarter of 2024,7 demonstrating that operating leverage gains extended into the firm's foundational asset-servicing operations.
Market and Wealth Services: the crown jewel
Market and Wealth Services represents the firm's highest-margin franchise. In the second quarter of 2026, the segment delivered $1.97 billion in revenue and $1.02 billion in pre-tax income, operating at a 52.0% pre-tax margin.3 The division comprises three distinct business lines:
Wealth Solutions, which houses Pershing, generated $806 million in quarterly revenue.3 Pershing provides clearing, settlement, and custody infrastructure for independent broker-dealers and registered investment advisers (RIAs). Its central technology initiative is Wove, a unified wealth management platform launched by Pershing X on June 6, 2023, that integrates financial planning, reporting, billing, and multi-custodian rebalancing into a single adviser workstation.[^41] By embedding its software into daily adviser workflows, BNY seeks to strengthen custody retention. However, because BNY does not publish granular adviser adoption metrics, Wove remains a strategic initiative whose market share gains relative to Charles Schwab and Fidelity are unquantified.
Payments and Trade—formerly Treasury Services—processes funds and provides liquidity management for corporate and institutional clients, generating $571 million in quarterly revenue.3
Clearance and Collateral Management produced $593 million in quarterly revenue, up 16% year over year.3 The unit operates the primary infrastructure for the U.S. tri-party repurchase (repo) market. In a repurchase agreement, a securities dealer sells Treasury securities to a cash provider—such as a money market fund—overnight, agreeing to repurchase them the following day at a specified rate. The tri-party custodian holds the collateral, calculates daily valuations, manages haircuts, and settles transactions across counterparties.
Historically, two clearing banks managed U.S. tri-party repo transactions. In July 2016, JPMorgan Chase announced its exit from government securities settlement for most dealers, fully winding down its tri-party clearing role in 2018 and transferring client volume to BNY.39 BNY had already held more than 80% of the market prior to JPMorgan's departure.40 As a result, BNY operates as the sole tri-party clearing bank for overnight U.S. Treasury financing, with approximately $3.1 trillion settling daily on its platform outside of central clearing.4 This market structure provides fee stability and pricing power, while concentrating systemic operational and regulatory tail risk within a single institution.
Investment and Wealth Management: the unresolved question
Investment and Wealth Management remains the smallest and lowest-margin segment. In the second quarter of 2026, the division generated $863 million in revenue and $182 million in pre-tax income, achieving a 21.1% pre-tax margin—an improvement from 10.9% in the prior quarter.3 Assets under management reached $2.23 trillion.3 Compared with State Street's $6.28 trillion in AUM,41 BNY competes as a mid-sized asset manager in an industry where scale heavily influences profitability. Operational headwinds persisted through 2025: the segment posted a 17% pre-tax margin in the fourth quarter of 2025, with revenue declining 2% year over year as cumulative net outflows offset market appreciation.7 Housing the legacy Dreyfus mutual fund franchise, the unit continues to face secular pressure from low-cost index and passive products.
The revenue architecture. Across all divisions, fee revenue accounted for $4.04 billion of BNY's $5.70 billion total revenue in the second quarter of 2026, while net interest income (NII) reached $1.45 billion—representing a split of approximately 71% fee income to 25% NII, with investment and other revenue composing the remaining 4%.3 NII expanded 20% year over year, driven by higher reinvestment yields on maturing portfolio securities and balance sheet growth, partially offset by deposit margin compression as institutional clients demanded higher yields on cash.3 This reliance underscores that a portion of recent earnings expansion reflects favorable short-term interest rates, which could moderate if deposit costs rise or monetary policy shifts.
Tokenization: optionality, not yet revenue
Digital asset optionality. BNY has positioned itself among traditional custody banks expanding into digital asset infrastructure. The firm has served as a primary custodian for Circle's USDC reserve assets since 2022, and on June 29, 2026, expanded the partnership to allow institutional clients to hold USDC directly in BNY digital asset custody wallets and issue instructions to mint or burn tokens.4243 Additionally, BNY received a regulatory no-objection from the SEC permitting the firm to safeguard digital assets without recording them as balance-sheet liabilities, enabling expansion into crypto exchange-traded fund custody.44
Currently, digital asset initiatives represent strategic positioning rather than a material revenue contributor. BNY does not break out standalone digital asset revenue, and major U.S. spot bitcoin ETFs continue to utilize Coinbase as their primary crypto custodian, with BNY providing traditional cash custody and fund administration services.44 While regulatory approvals and infrastructure partnerships establish capability in tokenized settlement, commercial monetization across these emerging lines remains unproven.
IX. Industry Structure, Moat Analysis & Competitor Benchmarking
Evaluating BNY's competitive position requires distinguishing between structural economic powers and market misconceptions.
Myth versus reality
Four consensus beliefs about the company require re-examination when evaluated against financial disclosures:
-
Myth: BNY is the dominant custodian, in a class of its own. Reality: BNY leads the market, but the gap reflects a tight duopoly rather than a monopoly, and its primary peer has expanded faster. As of June 30, 2026, State Street's assets under custody and administration grew 18% year over year, compared with BNY's 12%.413 Custody scale alone does not fully explain BNY's economic model.
-
Myth: BNY is a major active asset manager. Reality: Its investment management arm remains sub-scale relative to top peers, managing a fraction of State Street's assets while experiencing cumulative net outflows.417 Asset management functions more as an earnings headwind than a core growth driver.
-
Myth: Custody operations function as a rate-insensitive utility. Reality: Net interest income earned on client deposits generates roughly one-quarter of total revenue, expanding 20% year over year in the second quarter of 2026.3 Low short-term interest rates served as the primary drag on profitability during the 2010s, underscoring that BNY remains highly sensitive to monetary policy cycles.
-
Myth: The tri-party repo clearing platform represents the core of the business. Reality: Tri-party clearing is the firm's most defensible competitive franchise, yet it generates a modest share of total revenue within Market and Wealth Services.3 Valuing the entire enterprise as a toll utility risks overstating the financial contribution of its clearing monopoly.
The seven powers, tested
Applying structural competitive frameworks clarifies where BNY's economic moat holds and where it faces limitations:
-
Scale economies — dominant and verifiable. Global custody and clearing require extensive fixed spending on technology and compliance infrastructure. BNY spreads its multi-billion-dollar operating overhead across $62.6 trillion in custodied assets,3 allowing additional assets to be serviced at low incremental cost. This operating leverage is evident in Securities Services, where pre-tax margins expanded roughly eleven percentage points from the fourth quarter of 2024 to the second quarter of 2026 without requiring fee-rate increases.37
-
Switching costs — high for retention, weak for pricing power. Transferring custody, fund accounting, and administrative mandates involves significant operational friction and risk, discouraging institutional clients from changing providers. However, historical litigation surrounding standing-instruction foreign exchange services demonstrated that switching costs preserve client retention rather than pricing power; once hidden fee spreads were exposed, institutional clients successfully renegotiated terms.
-
Cornered resource — real, but concentrated. BNY's tri-party clearing platform for U.S. government securities represents its clearest cornered resource, protected by Federal Reserve operational requirements, deep dealer integration, and the exit of its primary competitor.3940 However, this structural advantage remains concentrated within a single business line that accounts for less than 11% of total corporate revenue.3
-
Process power — an evolving operational advantage. The "One BNY" initiative aims to integrate historically siloed product operations onto a unified technology platform. If executed effectively over a full market cycle, this integrated architecture could create an operational efficiency advantage over peers operating federated unit models.
Five forces, run properly
A competitive analysis using Porter's Five Forces highlights the structural dynamics of the global asset servicing industry:
-
Threat of new entrants: Minimal. Establishing a global custody bank requires systemically relevant capital reserves, direct central bank clearing access, multi-decade operational track records, and extensive technology infrastructure. Consequently, de novo entrants face virtually insurmountable barriers to entry.
-
Threat of substitutes: Low near-term, evolving long-term. Distributed ledger technologies have not disrupted high-volume institutional settlement due to legal finality requirements, corporate actions processing, and regulatory compliance standards. The primary substitution risk involves emerging tokenized settlement networks operating independently of traditional custodians, underscoring the strategic rationale for BNY's partnership with Circle.42
-
Bargaining power of suppliers: Low overall, with operational vulnerabilities. Custodians exercise significant commercial leverage over software and data vendors. However, vendor centralization creates operational concentration risk, as demonstrated by the 2015 InvestOne platform outage that temporarily disrupted fund valuation processing.[^27]
-
Bargaining power of buyers: High and persistent. Custodial clients—including major asset managers, pension funds, and sovereign wealth funds—consistently press for lower asset-servicing fee schedules. On the July 2026 earnings call, Chief Financial Officer Dermot McDonogh stated that clients are willing to pay for premium integrated services, citing accelerated organic fee growth.32 While recent sales momentum supports management's position, secular fee compression across standardized custody services remains an ongoing structural factor.
-
Competitive rivalry: Segment-dependent. Competition remains intense across standard asset servicing and institutional custody, whereas tri-party repo clearing operates as a single-provider utility.
The peer picture
Benchmarking BNY against its primary peers clarifies its relative market positioning:
As of June 30, 2026, State Street reported $57.86 trillion in assets under custody and/or administration—within 8% of BNY's $62.6 trillion—while expanding AUC/A by 18% year over year compared with BNY's 12%.413 Northern Trust reported $20.0 trillion in AUC/A, up 11%, alongside $2.0 trillion in assets under management.45 In active asset management, BNY remains secondary to State Street, whose $6.28 trillion in AUM—driven by its SPDR ETF franchise—is nearly three times BNY's $2.23 trillion.413
BNY's valuation premium over State Street relies less on total custody volume—where the two firms operate as a duopoly—and more on its specialized adjacent franchises: Pershing's wealth management clearing platform and the tri-party repo clearing business. Meanwhile, universal banks such as JPMorgan Chase compete in global custody with significantly larger balance sheets and cross-selling opportunities across corporate banking lines, presenting a durable competitive alternative.
X. Historical Falsification Layer: Testing Moat & Strategy Claims
Every investment case for BNY rests on four structural claims. Each has been tested by the company's own history over multi-decade horizons. Here is where each claim lands after that empirical testing—offering a clear verdict and a forward test rather than a restatement of the evidence.
Claim one: switching costs protect custodial pricing power. Narrowed, not rejected. The evidence from 2011 to 2015 shows that clients accept high operational friction to leave while simultaneously enforcing pricing discipline the moment fees become transparent. Client retention survives; premium pricing on bundled ancillary services does not. What would confirm this narrowed claim is ancillary revenue per unit of custodied assets—from foreign exchange, securities lending, and financing fees—holding firm or expanding as a share of Securities Services revenue over several years, rather than total fee revenue rising simply because market valuations appreciated. What would falsify management's more expansive view is organic fee growth reverting toward zero the moment equity market appreciation ceases.
Claim two: asset management acquisitions create structural synergy with servicing. Rejected in its original form. Thirty-one years after acquiring Dreyfus, the Investment and Wealth Management segment carries the lowest operating margin in the company, has absorbed a $680 million non-cash goodwill impairment, has been trimmed through divestitures like Alcentra, and continues to post net outflows offset only by market appreciation. Note carefully what is not rejected: infrastructure acquisitions. Pershing has compounded for twenty-three years. The discipline this history demands is that any future BNY acquisition be judged on whether it purchases contractual infrastructure or fee streams exposed to secular repricing. The critical benchmark to watch is organic net new assets under management excluding market movement—a metric that has remained negative and must turn positive to validate growth.
Claim three: the fee-based model insulates BNY from rate volatility. Narrowed sharply, and management's own disclosure bounds it. The 2010s established that during periods of zero short-term interest rates, the business model suffers twice—losing net interest income while absorbing money market fund fee waivers—and generates returns below the cost of equity. The firm's second-quarter 2026 return on tangible common equity of 31.3% is being earned in a historically favorable interest rate environment. Nothing in the record supports describing today's margin structure as permanent or structural, and BNY's own second-quarter 2026 disclosure names deposit margin compression as an active offset already reducing the benefit.3 The forward test is straightforward: tracking net interest income and deposit betas through the next full easing cycle. If net interest income declines materially while fee revenue holds firm, the fee moat will be validated in a way it never was during the 2010s. If both compress, recent earnings gains reflected a cyclical rate trade rather than structural transformation.
Claim four: scale guarantees operational and technological resilience. Narrowed. Scale demonstrably delivers unit cost advantages, as evidenced by Securities Services pre-tax margin expansion. Scale did not, however, prevent a single vendor upgrade from disabling net asset value production for roughly 1,200 funds in 2015, where regulators found that no adequate backup plan existed. The concentration that creates the cost advantage also expands the operational blast radius, and the tri-party repurchase clearing franchise concentrates that risk further than traditional custody functions. Key metrics to monitor include technology and operations spending as a share of total expenses, alongside the absence of material operational disruptions in clearing and government securities settlement. This claim can only ever be falsified, never permanently proven; a decade without a system failure demonstrates an absence of incidents, not proof of absolute resilience.
One meta-observation worth stating plainly: three of the four claims survive in narrowed form, and the direction of that narrowing is consistent. In every case, the structural advantage protects the company's market position more than its pricing power, and shields it against competitive displacement more than against macroeconomic shifts. That represents a genuine moat—around asset volume rather than profit margin. Consequently, the valuation multiple the market assigns to BNY should remain more sensitive to interest rates and broader financial market levels than a pure utility framework implies.
XI. Bear vs. Bull Case, Activist Stress Test & Valuation Framework
Why BNY wins from here.
Operating leverage reflects structural gains rather than an accounting artifact. Headcount declined by roughly 10% across 2024 and 2025 even as total revenue expanded, while pre-tax margins widened across both legacy Securities Services and higher-growth Market and Wealth Services.3437 Management reported on its fourth-quarter 2025 call that the firm harvested approximately $500 million in repeatable annual expense savings.31 These operational improvements represent recurring efficiency gains rather than passive market momentum.
The corporate reorganization under "One BNY" has begun to show commercial momentum. Management reported fourteen consecutive quarters of year-over-year sales growth, a greater than 20% increase in average deal size, and adoption of at least one additional service line by a majority of asset servicing clients.32 Sustaining these cross-sell gains through a neutral market would validate the operational integration strategy.
Additionally, if short-term interest rates remain well above zero, the company avoids the money market fund fee waivers that severely constrained earnings during the 2010s. Meanwhile, the tri-party repo clearing monopoly and Pershing wealth infrastructure provide BNY with two highly defensible, leading franchises that its closest peer lacks at comparable scale.
What could break the case.
Rate reversal is the largest single risk. Net interest income expanded 20% year over year in the second quarter of 2026, driven by higher reinvestment yields on maturing securities.3 However, monetary policy easing would mechanically reverse these gains, while client demands for higher cash yields are already compressing deposit margins. On the July 2026 earnings call, Chief Financial Officer Dermot McDonogh noted that the third quarter presented a challenging comparison and emphasized that forward guidance assumed interest rate curves remained at June 30 levels.32 Consequently, current margin levels may reflect cyclical rate tailwinds rather than permanent structural transformation.
Fee compression remains an ongoing headwind. Institutional asset managers retain substantial bargaining power, and custodial fee schedules have trended downward for decades. A single year of 4.5% organic fee growth offers encouraging momentum, but it does not yet establish a permanent break from historical pricing trends.
Operational and cyber disruptions present major tail risks. A significant failure within tri-party settlement or U.S. Treasury clearing would extend far beyond quarterly earnings, triggering systemic financial risks, legal liabilities, and regulatory intervention. The 2015 InvestOne software outage illustrated how operational failures disrupt client workflows even at a minor fraction of that scale.
Investment and Wealth Management continues to weigh on overall margins and corporate narrative, generating the lowest pre-tax margins across the firm without a clear path to competitive scale.
Governance structure has consolidated control with the recombination of the chairman and chief executive officer roles under Vince in September 2025, departing from institutional governance recommendations during a period of cyclical outperformance.28
What a skeptic would attack today
Evaluating BNY from an activist perspective in 2026 highlights a shifted landscape. While management successfully expanded margins, flattened expense growth, and returned substantial capital, critical strategic questions remain:
First, portfolio coherence remains questionable. An infrastructure-focused processing bank continues to operate a mid-sized active asset management unit that generated a 21.1% pre-tax margin in the second quarter of 2026, compared with 52.0% in Market and Wealth Services.3 Although the 2022 sale of Alcentra demonstrated a willingness to divest non-core operations, management maintains that investment management supports wealth and clearing distribution—a premise challenged by persistent cumulative net outflows.
Second, return metrics warrant careful examination. BNY returned $5.0 billion to shareholders in 2025 through a 94% payout ratio—including $3.5 billion in share repurchases—and distributed an additional $1.5 billion during the second quarter of 2026.73 Large buybacks reduce tangible common equity, which mechanically boosts return on tangible common equity (ROTCE)—the exact metric accounting for 70% of performance share unit incentives.21 Concurrently, the firm's Common Equity Tier 1 ratio declined from 11.9% at year-end 2025 to 11.0% by mid-2026, while its Tier 1 leverage ratio edged down from 6.0% to 5.9%.73 Returning capital faster than internal generation represents a deliberate balance-sheet choice for a custody bank, but part of the ROTCE expansion reflects capital reduction alongside operational performance.
Third, artificial intelligence disclosures lack financial specificity. Management publishes digital agent counts and employee usage rates while explicitly declining to quantify the standalone financial return on AI investments.32 Without audited cost savings or direct revenue attribution, technology metrics remain difficult to evaluate independently.
Fourth, executive compensation structure invites scrutiny. Total direct compensation of $48.85 million awarded to the chief executive officer for 2025 performance yielded a CEO-to-median-employee pay ratio of 1,018 to 1, while the relative total shareholder return component of long-term incentives vested at the maximum 200% payout, measured against a baseline valuation established prior to recent performance gains.21
Valuation framework. BNY occupies a distinct position between traditional custody banks and technology processors. Evaluated against trust-bank peers such as State Street and Northern Trust, key metrics center on ROTCE, organic fee growth, and interest rate sensitivity. Evaluated against transaction processors such as Broadridge or Fiserv, the focus shifts to recurring revenue stability and operating leverage; however, market processors do not carry systemic balance-sheet capital requirements, deposit beta sensitivities, or investment portfolio risks. Historically, the market valued BNY at a low-teens forward earnings multiple, pricing it as a rate-sensitive bank rather than a pure infrastructure utility. The primary valuation debate is whether recent operational momentum justifies a re-rating toward market processing multiples—a question that depends on whether fee growth can offset margin pressure if interest rates decline. Share price data remains accessible through standard market data services.46474849
The three KPIs
The three key performance indicators. Long-term execution depends on three core operational metrics:
-
Operating leverage — The quarterly spread between revenue expansion and expense growth. Maintaining positive operating leverage through a flat or declining revenue environment will demonstrate whether expense controls represent structural efficiency rather than temporary outperformance during a favorable rate cycle.
-
Organic net new business, excluding market appreciation — Net growth in assets under custody/administration and management, combined with organic fee growth. Because custodied assets expand automatically during market rallies, organic asset and fee growth provide the clearer measure of competitive market share gains.
-
Net interest income together with deposit dynamics — The trajectory of net interest revenue alongside client deposit costs, establishing how much of current profitability reflects favorable monetary policy versus underlying operational improvement.
XII. Lessons & Legacy
A historical symmetry connects BNY's origins to its modern role: the institution Alexander Hamilton chartered to establish trust in a new republic's paper currency now safeguards $62.6 trillion in global assets. Hamilton's insight was that credible recordkeeping and governance are not operational overhead—they are the core product. Every transaction across the financial system ultimately relies on an institution maintaining an authoritative, defensible record of asset ownership.
Three broader lessons emerge for evaluating institutions with similar infrastructure models.
Infrastructure compounds; fee streams facing secular repricing do not. BNY's history provides a clear natural experiment in capital allocation. Facing similar market pressures, the firm pursued two distinct acquisition strategies at comparable scale. Buying Pershing secured embedded technology workflows with high contractual switching costs, compounding over two decades. Buying Dreyfus acquired a branded active management franchise that encountered secular pressure from passive indexation, eventually resulting in goodwill write-downs. The key determinant was not deal execution or integration speed, but whether the acquired capability sat inside institutional operational workflows or merely alongside them.
A moat around volume is not a moat around margin. BNY's experience refines standard switching-cost assumptions. High operational switching costs protect institutional client retention, but they do not preserve opaque pricing power once fee structures are exposed, nor do they guarantee returns above the cost of equity during periods of zero short-term interest rates. A dominant structural position protects market share; it does not insulate profit margins from macroeconomic conditions or managerial inertia.
Scale without cost discipline is inert. BNY's market positioning in 2026 remains broadly consistent with its position in 2015—built on the same core franchises, clients, and market share. Yet over that span, its pre-tax margin expanded from the low 30% range to nearly 40%, while return on tangible common equity roughly doubled. The primary driver of that performance shift was organizational restructuring and expense control rather than an expanding competitive moat. Operating leverage can be unlocked by disciplined execution, but it can erode just as quickly if operational focus wanes.
Whether BNY's recent performance represents a permanent structural evolution or the cyclical peak of an expense turnaround remains an open question. The ultimate test will occur when interest rates decline and equity market appreciation moderates, with the outcome becoming visible first in the trajectory of operating leverage.
XIII. Primary Earnings Call & Transcript Lead Guide
For readers seeking to evaluate primary sources directly, four sets of company disclosures provide essential analytical context.
The third-quarter 2022 earnings materials establish Chief Executive Officer Robin Vince's baseline: a $680 million goodwill impairment in Investment Management, a candid assessment of the previous decade's disappointing performance, and the initial pivot toward expense discipline.1429 Comparing these documents against subsequent management statements provides a baseline for evaluating narrative consistency.
The June 2023 Pershing X launch materials for Wove outline the firm's wealth technology strategy, partner architecture, and competitive positioning against incumbent adviser custodians.[^41] They represent a statement of strategic intent whose commercial adoption metrics remain unquantified.
The fourth-quarter 2025 results and transcript from January 13, 2026, document record full-year results, an eight-quarter streak of positive operating leverage, and management's decision to raise medium-term targets by 500 basis points for both pre-tax margin and return on tangible common equity.73138 The question-and-answer session offers critical context, as analysts questioned whether a 3% to 4% expense growth target was realistic alongside a 5% projected revenue increase in a flat market, and whether 3% organic fee growth in 2025 adequately supported the 2026 outlook.31
The second-quarter 2026 earnings release and transcript from July 15, 2026, detail recent operating data: record quarterly revenue, 606 basis points of operating leverage, updated full-year guidance, and the expanded custody partnership for Circle's stablecoin reserves.332 Three analyst exchanges in the transcript warrant specific attention: management's explanation of exceeded medium-term targets, the explicit reliance on a static interest rate curve in forward guidance, and the executive team's decision not to isolate standalone financial returns on artificial intelligence investments.32
Beyond transcript materials, the annual Form 10-K provides audited disclosures covering segment performance, risk factors, capital and liquidity metrics, and legal proceedings,345051 while the annual proxy statement details the executive compensation incentives shaping leadership decisions.21
References
-
New York Mellon Named Custodian for TARP — HousingWire, 2008-10-14 ↩↩
-
The Bank of New York Mellon Corporation Form 8-K — SEC EDGAR, 2008-10 ↩↩
-
BNY Reports Second Quarter 2026 Earnings Per Common Share of $2.45 — BNY, 2026-07-15 ↩↩↩↩↩↩↩↩↩↩↩↩↩↩↩↩↩↩↩↩↩↩↩↩↩↩↩↩↩
-
Sizing the U.S. Repo Market — Office of Financial Research, 2025-12-04 ↩↩
-
Tri-Party Repo Infrastructure Overview & Market Data — Federal Reserve Bank of New York, 2026-01-01 ↩
-
The Founding of the Bank of New York — NYC Landmarks Preservation Commission, NYC Archaeological Repository ↩↩↩
-
BNY Reports Fourth Quarter 2025 Results — BNY, 2026-01-13 ↩↩↩↩↩↩↩↩↩↩↩
-
BNY Announces Planned Change of Stock Ticker Symbol to "BNY" — BNY, 2026-05-11 ↩↩
-
From the Vault: Alexander Hamilton, banker — ABA Banking Journal, 2025-07 ↩
-
Andrew W. Mellon (1921–1932) — U.S. Department of the Treasury ↩
-
Andrew W. Mellon — Federal Reserve History, Federal Reserve System ↩
-
BoNY "Clears" Pershing Purchase — PLANSPONSOR, 2003-01-08 ↩↩
-
BNY Mellon's 3Q profits dragged down by $680 million charge — American Banker, 2022-10-17 ↩↩↩
-
The Bank of New York Mellon Corporation Form 10-K for FY2022 — SEC EDGAR, 2023-02-27 ↩
-
In Brief: JPM, Bank of N.Y. Set to Close Swap — American Banker, 2006 ↩
-
The Bank of New York Mellon Corporation Form 8-K12G3, Exhibit 99.1 — SEC EDGAR, 2007-07-02 ↩
-
The Bank of New York Mellon Corporation 2008 Annual Report (Form 10-K Exhibit 13.1) — SEC EDGAR, 2009-02-27 ↩↩
-
BNY Mellon Pays $135 Million For TARP Warrant — Global Custodian, 2009 ↩
-
The Bank of New York Mellon Corporation 2026 Proxy Statement — BNY, 2026-02-27 ↩↩↩↩↩↩↩↩
-
2024 List of Global Systemically Important Banks (G-SIBs) — Financial Stability Board, 2024-11-26 ↩
-
SEC Announces $714 Million Settlement with Bank of New York Mellon Over Foreign Exchange Pricing — U.S. Securities and Exchange Commission, 2015-03-19 ↩
-
Manhattan U.S. Attorney Announces $714 Million Settlement With Bank Of New York Mellon For Fraudulent FX Trading — U.S. Department of Justice, 2015-03-19 ↩↩
-
BNY Mellon to Pay $3M to Settle Probe of System Outage — American Banker, 2016-03-23 ↩↩
-
BNY Mellon gives activist investor Trian Fund a board seat — Pittsburgh Post-Gazette, 2014-12-02 ↩
-
Robin Vince Elected Chairman of BNY's Board of Directors — BNY, 2025-06-12 ↩↩↩
-
BNY Mellon's new CEO vows to hold the line on expenses — American Banker, 2023-01-13 ↩↩
-
BNY Mellon's CEO Robin Vince Targets Operational Efficiency and Growth — American Banker, 2023-01-13 ↩
-
BNY Mellon (BK) Q4 2025 Earnings Call Transcript — The Motley Fool, 2026-01-13 ↩↩↩↩↩↩
-
BNY (BNY) Q2 2026 Earnings Call Transcript — The Motley Fool, 2026-07-15 ↩↩↩↩↩↩↩↩↩↩↩↩
-
BNY CEO says AI is a jobs creator, not a destroyer — American Banker, 2026 ↩↩
-
The Bank of New York Mellon Corporation Form 10-K for FY2025 — SEC EDGAR, 2026-02-25 ↩↩↩
-
David Vélez and Robin Vince join the boards of the OpenAI Foundation and OpenAI Group PBC — OpenAI, 2026-07-21 ↩
-
The Bank of New York Mellon Corporation Introduces Updated Brand: BNY — BNY, 2024-06-11 ↩
-
BNY rebrands with new logo but no Mellon — Banking Dive, 2024-06-11 ↩
-
BNY raises profit target as CEO Robin Vince says 'turnaround' is taking hold — CNBC, 2026-01-13 ↩↩
-
JPMorgan to Stop Settling Government Securities for Dealers — Bloomberg, 2016-07-21 ↩↩
-
Repo Traders Fret about Market Monopoly — Treasury & Risk, 2017-09-18 ↩↩
-
State Street Corp Q2 2026 Form 10-Q quarterly earnings report — StockTitan, 2026-07 ↩↩↩↩↩
-
BNY Expands Relationship with Circle and Adds to Institutional-Grade Stablecoin Enablement Services — BNY, 2026-06-29 ↩↩
-
BNY and Circle expand partnership, adding mint and burn capabilities for USDC — The Block, 2026-06-29 ↩
-
BNY moves closer to offering crypto ETF custody services — The Block, 2024-09-25 ↩↩
-
Northern Trust Corp Q2 2026 results, Form 8-K — StockTitan, 2026-07 ↩
-
The Bank of New York Mellon Corporation Stock Quote & Company Overview — Reuters, 2026-08-31 ↩
-
The Bank of New York Mellon Corp Financials & News — The Wall Street Journal, 2026-08-31 ↩
-
BNY News & Financial Analysis — Financial Times, 2026-08-31 ↩
-
BNY SEC Filings & Annual Reports (CIK 0001390777) — SEC EDGAR, 2026-01-01 ↩
 LinkedIn
 WhatsApp
 Reddit
 Hacker News
 Email
Email Kindle
 RSS Feed
 Spotify
 Apple Podcasts
 Amazon Music
 Audible
 YouTube