Blue Owl Capital: The Permanent-Capital Promise Meets Its First Storm
I. The Money That Couldn't Leave
Picture a retiree who put part of their savings into a private-credit fund a few years ago. The pitch was attractive and easy to understand. Her money would be lent to mid-sized American companies at floating interest rates, the fund would pay a steady income, and once a quarter the investor could ask for some of her money back. The fine print said that window had limits, but in calm years nobody read the fine print. Then, in the first weeks of 2026, a lot of people who had bought funds like that one read it at the same time.
On February 18, 2026, Blue Owl Capital announced that several of the business development companies it manages, including the non-traded fund known as Blue Owl Capital Corporation II, or OBDC II, would sell about $1.4 billion of loans to institutional investors.1 Alongside the sale came a change that mattered more to OBDC II's shareholders than any price: the fund would stop relying on regular quarterly tender offers and would instead return capital as its loans were sold or repaid.1 For an investor who had thought of the quarterly window as a near-promise, the message was blunt. The money would come back, but on the portfolio's timetable, not the investor's.
That moment captures the strange beauty, and the strange fragility, of the company at the center of this story. Blue Owl ended 2025 managing about $307 billion of other people's money.2 Much of that money sits in vehicles designed never to hand it back on demand: listed funds, long-dated institutional funds and perpetual vehicles whose capital can stay invested for years or decades. Wall Street calls this "permanent capital," and Blue Owl built its public identity on it. Permanent capital is, from a manager's point of view, the closest thing finance has to a subscription that cannot be cancelled.
But permanence belongs to the manager's fee stream, not always to the investor's patience. Some of the funds Blue Owl manages are "semi-liquid." They are long-lived in structure, yet they offer individual investors a limited, periodic way out. When those investors asked for more money back than the funds wanted to pay, the gap between the two meanings of "permanent" stopped being a footnote and became the story.
The distinction is worth holding onto, because it runs through everything that follows. Blue Owl the listed company does not own the $330 billion of assets it reported at the end of September 2026.3 It is not a bank. It does not hold those loans on its own balance sheet, and if a borrower defaults, the fund's investors absorb the loss, not Blue Owl's shareholders directly.
What Blue Owl owns is the right to manage that money and charge fees for doing so. Its corporate balance sheet, by comparison, totaled about $12.5 billion at the end of 2025, and much of that was goodwill, intangible assets from acquisitions and receivables rather than a mountain of loans.2
So the question is not whether Blue Owl's funds will blow up. The question is subtler and, for a shareholder, more important. If the people who put money into those funds start wanting it back, how much of the fee stream survives, and how much of the growth story survives with it?
The first half of 2026 tested that question in public. Redemption requests rose at some of the firm's wealth-channel vehicles, the share price fell hard, and critics began asking whether private credit's retail boom had been sold on liquidity it could not deliver. By the third quarter the tone had changed. Management told analysts on October 29, 2026 that inflows from private-wealth clients had risen 14% from the prior quarter and that redemption requests at its flagship non-traded credit fund had declined for a second straight quarter.4 Those are real improvements. They are not yet a verdict.
Three questions will carry this story from the founders' first meeting to tonight's share price. Can Blue Owl keep growing fees now that fundraising, especially from individual investors, has become harder? If it can, does that growth turn into durable value for public shareholders after the company pays its people in stock, issues new shares and distributes most of its cash? And how much should an outside investor worry that the founders control the company, and that its biggest customers are funds it manages itself?
To answer them, the story has to go back to a merger that, on paper, joined two firms that did very different things.
 Subscribe on LinkedIn
II. Two Businesses That Needed Each Other
In 2016, three men who had already made fortunes elsewhere started a lending business in New York. Doug Ostrover had co-founded GSO Capital Partners, the credit firm that Blackstone bought and turned into one of the largest credit managers in the world. Marc Lipschultz had spent more than two decades at KKR, where he helped lead its energy and infrastructure business. Craig Packer came from Goldman Sachs, where he had run leveraged finance for the Americas.5 They called the firm Owl Rock.
Their timing was deliberate. After the 2008 financial crisis, regulators pushed banks to hold more capital against risky corporate loans, and banks pulled back from lending to mid-sized companies, particularly those owned by private-equity firms. Someone had to fill the gap. Owl Rock's bet was that a large, disciplined non-bank lender could offer private-equity sponsors something banks no longer could: a single counterparty that would write a big loan, hold it, and not syndicate it out to dozens of strangers. The borrower got certainty and speed. The lender got a higher interest rate than a public bond would pay.
Ostrover was the dealmaker and fundraiser, a credit veteran who understood that the scarcest input in direct lending is not loans but patient capital. Packer was the underwriter, the person who turned a pile of financial statements into a yes or a no. Lipschultz, who became co-CEO, brought the institutional relationships and the private-equity mindset of someone who had spent his career buying companies rather than lending to them. The trio built Owl Rock quickly, raising money through business development companies, a form of investment fund that lends to private companies and passes most of its income through to shareholders.
Meanwhile, inside Neuberger Berman, Michael Rees had built something more unusual. Dyal Capital Partners bought minority stakes in alternative asset managers themselves: not in the companies those managers invested in, but in the management firms. A private-equity or hedge-fund partnership might sell Dyal a slice of its future fee and carry income in exchange for cash it could use to fund its own commitments, buy out a retiring founder or expand into new strategies.5 Dyal became one of the pioneers of what the industry calls "GP stakes," short for stakes in general partners.
On paper the two businesses had little in common. One lent money to companies. The other bought pieces of investment firms. Why put them together?
The answer was the kind of capital each one had. Both earned most of their income from long-dated or perpetual vehicles. When the combination was presented to investors in early 2021, the merged company reported $52.5 billion of assets under management, and 91% of it was classified as permanent capital.5 Neither firm alone had the scale to compete for the attention of large institutional allocators and wealth platforms against Blackstone or Apollo. Together they could offer two distinct, fee-generating products, share distribution and present public investors with a story built on recurring income rather than lumpy performance fees.
There was a second, quieter logic. Dyal's stakes gave the combined firm a window into dozens of other alternative managers. Owl Rock's lending business gave those managers' portfolio companies a potential source of financing. The pitch implied a network, though whether that network would produce better economics than two firms simply sharing a ticker was something the merger could promise but not prove.
The deal also carried a conflict that announced itself almost immediately. Dyal owned a minority stake in Sixth Street Partners, a large credit firm that competed directly with Owl Rock in lending. Sixth Street objected, arguing that the merger would hand a competitor access to its sensitive information and that Dyal needed its consent.5 It sued in the Delaware Court of Chancery to block the transaction. The court declined to stop the deal, and the combination went ahead.5
The legal outcome was a win for Blue Owl, but the episode taught a lesson the firm carried with it. A GP-stakes portfolio is not a passive bundle of financial claims. It is a set of relationships with proud, independent firms, some of which compete with each other and some of which may one day compete with their own minority owner. Consent rights, information walls and reputational goodwill are part of the asset. Sixth Street was a reminder that those relationships can turn adversarial precisely when the owner wants to do something big.
So the merger, viewed honestly, was a strategic bet. It combined two complementary fee sources and gave the new company a scale neither had alone. It did not, by itself, prove that the combination would earn more for shareholders than the sum of its parts. That test started the day the stock began trading, and the founders chose an unconventional route to get there.
III. A Public Listing Built for Scale
In late December 2020, at the height of the special-purpose acquisition company boom, Owl Rock and Dyal agreed to combine with Altimar Acquisition Corporation, a blank-check company that had raised money from public investors with the promise of finding a business to buy.5 The announced pro forma equity value of the combined company was about $12.5 billion.5 Investors were also asked to commit $1.5 billion in a private investment in public equity, known as a PIPE, at $10 a share.5
For most SPAC targets in that era, the blank-check route was a way to go public with a story rather than a record. Blue Owl was different in one respect: it had a large, profitable fee base and an institutional investor list that a traditional IPO could have reached. The SPAC offered speed and certainty of price. Rather than waiting for a roadshow and an IPO window, the founders could negotiate a valuation with a sponsor and lock in a large PIPE from institutions that had done their own diligence.
The deal was not a routine shell merger. Owl Rock managed business development companies, and each of those funds had an advisory agreement with its manager. A change of control of the adviser generally triggers a requirement under U.S. investment-company law for fund boards and shareholders to approve new agreements.
Dyal's funds, in turn, needed investor consents. The proxy statement laid out a web of approvals that had to fall into place before the merger could close: Altimar's own shareholders, the BDCs' boards and shareholders, and the Dyal fund investors.5 Every one of those approvals was also a referendum on whether the people whose money the firm managed were comfortable with their manager becoming a public company.
They were. In May 2021, the combination closed and Blue Owl Capital began trading on the New York Stock Exchange under the ticker OWL.5 The valuation at closing, before earnout shares, was about $12.2 billion.5
It is worth being precise about what the listing did and did not establish. The $10 PIPE price and the headline valuation were negotiated numbers. They reflected what sophisticated investors were willing to pay in a hot market for a fast-growing fee business. They were not a public market's verdict on the quality of Blue Owl's earnings. That verdict would come later, quarter by quarter, and the market would swing hard in both directions.
A second transaction that autumn is often confused with the listing. In October 2021, Blue Owl filed a Form S-1 registering the resale of about 29.7 million Class A shares by existing holders.6 This was not a capital raise. The prospectus stated plainly that Blue Owl would receive no proceeds from those sales.6 It was plumbing: a way to let investors who had received shares in private transactions sell them in the public market.
The structure the founders chose at listing would shape every later debate about the stock. Blue Owl adopted what bankers call an "Up-C." Public investors bought Class A shares in Blue Owl Capital Inc. The founders and other insiders held economic units directly in the underlying operating partnerships, plus high-vote Class B and Class D shares that carried voting power without separate economic rights.2 Over time, insiders could exchange their units for Class A shares. The arrangement gave insiders tax advantages and kept voting control concentrated, and it created a tax receivable agreement under which Blue Owl would pay insiders a share of certain tax savings that the exchanges generated.2
The Up-C has a practical consequence for anyone reading Blue Owl's income statement. Because much of the operating partnerships' income belongs to the insiders' units, it appears as income attributable to "noncontrolling interests," not to Class A shareholders. That is why Blue Owl's consolidated net income and its net income attributable to the listed company can look like they belong to different businesses. In 2025, consolidated net income was about $306 million, while net income attributable to Blue Owl Capital Inc. was only about $79 million.2 Hold that gap in mind; it will matter a great deal when the story reaches the share price.
The ownership has also shifted since 2021. Exchanges and acquisitions paid in stock steadily added Class A shares, which rose from about 608 million at the end of 2024 to about 667 million a year later, while the founders' Class D shares fell from about 317 million at the end of 2023 to about 304 million at the end of 2025.2 Economic ownership is slowly migrating toward public holders. Voting control has not moved: the principals still hold about 80% of the votes.7
The listing, then, gave Blue Owl a fast route to public currency, and that currency would soon be spent. The founders had sold investors on a platform built for scale. The next step was to buy more of it.
IV. Buying a Real-Estate Engine
Marc Zahr had spent more than a decade building a business around one of commercial real estate's least glamorous ideas. Oak Street Real Estate Capital, the Chicago firm he led, specialized in net-lease investing: buying properties occupied by a single, creditworthy tenant on long leases in which the tenant pays most of the property's taxes, insurance and maintenance.8 The returns looked less like a speculative real-estate play and more like a long-dated corporate bond with a building attached.
Oak Street's favorite transaction was the sale-leaseback. Imagine a retailer or manufacturer that owns its distribution centers. The company would rather have cash than bricks, perhaps to pay down debt, fund an acquisition or invest in its business. So it sells the buildings to an investor and signs a lease, often for fifteen or twenty years, to keep using them. The company gets a lump sum and keeps operating exactly as before. The investor gets a steady rent check from a known tenant, usually with built-in increases. In plain terms, it is a loan disguised as a property deal, secured by a building the tenant cannot easily do without.
On October 18, 2021, only five months after listing, Blue Owl agreed to buy Oak Street.8 The logic fit the founders' pitch. Net-lease funds raise long-dated capital, charge management fees on large pools of assets and generate the kind of recurring income that public investors in Blue Owl were paying for. Oak Street also opened a door to the same institutional and wealth investors who already bought Owl Rock's credit products, now with a real-estate flavor.
The transaction closed in December 2021 at a price of about $950 million, paid in a mix of cash and Blue Owl common units, with additional earnout payments of up to roughly $656.5 million if Oak Street hit future performance targets.9 The earnout structure was the interesting part. It meant Blue Owl was not paying the full price up front for growth that had not yet happened; Oak Street's team would have to deliver it. It also meant the true cost of the deal would only be known years later, and that some of that cost would be paid in Blue Owl equity, diluting existing shareholders.
Oak Street was the first of several acquisitions, and each extended the platform into a new kind of asset. In January 2025, Blue Owl completed its purchase of IPI Partners, a digital-infrastructure fund manager with more than $11 billion of AUM, for about $1 billion; IPI's managing partner took charge of Blue Owl's digital-infrastructure strategy, reporting to Zahr, who had become co-president and head of real estate.10 In July 2024, Blue Owl announced that it would buy Atalaya Capital Management, a specialty-credit firm focused on asset-based finance, for $450 million, adding roughly $10 billion of AUM.11
Asset-based finance is lending secured by pools of things rather than by a company's overall cash flow: consumer loans, equipment, receivables, royalties. It is one of the fastest-growing corners of private credit, because banks have retreated from it for the same capital reasons they retreated from middle-market lending. Atalaya gave Blue Owl a team and a track record in a market it had not served directly.
Did Blue Owl pay too much? This is the question every acquisitive asset manager invites, and the honest answer is that the public record does not settle it. A price of $450 million for $10 billion of AUM is about 4.5% of assets, but that ratio is only a rough scale marker. What matters is how much fee-related earnings the acquired manager produces, how fast those earnings grow and how much of the price was paid in stock that later traded at very different values.
Blue Owl does not disclose stand-alone fee earnings or margins for Oak Street, IPI or Atalaya after integration, and there is no clean set of comparable manager transactions on a like-for-like basis. Without those figures, any confident claim of overpayment, or of a bargain, would be speculation.
What can be followed is where the acquisitions show up in the financial statements. They brought new strategies and new streams of management fees, and they helped real assets grow into a meaningful share of AUM. They also brought acquired intangible assets that must be amortized, equity consideration that added to the share count, and compensation arrangements for the new teams.
In 2025, Blue Owl recorded about $359 million of intangible-asset amortization and about $674 million of equity-based compensation.2 Not all of that relates to acquisitions, but acquisitions are a major reason both lines are large. Its auditor, KPMG, singled out the valuation and recoverability of acquired investment-management intangibles as a critical audit matter in its 2025 report, not because anything was wrong, but because the judgments involved are significant.2
And yet, for all the new platforms, credit remained the core. In 2025, Blue Owl's credit platform generated about $1.75 billion of revenue, roughly 61% of the total.2 The real-estate engine and its siblings had broadened the catalogue. They had not replaced the machine that paid most of the bills.
So the acquisition spree leaves a balanced and slightly frustrating verdict. It deepened the platform, extended its reach into net lease, digital infrastructure and asset-based finance, and gave the company more ways to raise money. It also added amortization, stock compensation and dilution that public shareholders absorb. To judge whether the trade was worth it, an investor has to look past the headline AUM and into the fee engine itself, and to understand exactly what Blue Owl charges for.
V. The Fee Engine: AUM Is Not the Same as Revenue
Every quarter, in the back office of a fund Blue Owl manages, an invoice is calculated. It is not dramatic. A percentage is applied to a number, and the result is paid to the manager. But which number, and which percentage, is the whole business. A listener who wants to understand Blue Owl has to understand that invoice better than the headline AUM figure that appears in every press release.
The headline figure is large and growing. At the end of September 2026, Blue Owl reported about $330 billion of assets under management, up 12% from a year earlier.3 That is the number that tells you how big the platform is. It is not the number the invoice is based on.
The invoice is calculated on something called fee-paying AUM, and the base varies by product. Depending on the fund, Blue Owl's management fee may be charged on assets, on net asset value, on the cost of investments, on capital that investors have committed but not yet drawn, or on the face value of loans in a collateral pool.2 Fees are generally paid quarterly. Some funds have finite fee-paying lives; some agreements allow investors to end the relationship.2 On top of management fees sit performance fees and carried interest, which depend on investments clearing return hurdles and, often, on assets actually being sold.
Here is the first puzzle. Total AUM grew 12% over the year to September 2026. Fee-paying AUM grew only 5%.3 Management fees, measured over the last twelve months, grew 9%.3 Why would the platform grow more than twice as fast as the base on which the invoice is calculated?
Part of the answer is timing. A great deal of capital that Blue Owl has raised has not yet been put to work. Some direct-lending and real-asset funds charge fees only on invested capital, so money that investors have committed but the manager has not yet deployed into loans or buildings does not yet earn a fee. At the end of the third quarter, Blue Owl reported $36.3 billion of AUM not yet paying fees.3 Management estimated that, once deployed, that pool would generate about $402 million a year in management fees, which would contribute to fee-related earnings.3
That is a meaningful number. It is roughly 15% of the $2.66 billion of management fees Blue Owl earned over the past twelve months.3 Think of it as an order backlog at an industrial company: work that has been contracted but not yet billed. And like any backlog, it deserves a skeptical eye.
It is not revenue until it converts, and conversion depends on finding enough attractive loans and assets to deploy into. If competition for deals intensifies, or if credit conditions make deployment unwise, the backlog can sit idle longer than management expects. The right way to treat the $402 million is as a pipeline to track quarter by quarter, not as earnings already in hand.
The other part of the answer is less flattering. Some of the AUM growth comes from asset appreciation, leverage within funds and products whose fee base is calculated differently from their headline AUM. AUM is a measure of reach; fee-paying AUM is closer to the economics; management fees are the economics. When those three numbers diverge, the closest one to the invoice is the one that matters.
Now to the second piece of the engine, the word Blue Owl uses most proudly. Over the twelve months to September 2026, management fees made up about $2.66 billion of Blue Owl's $3.07 billion of GAAP revenue, and 85% of those management fees came from products the company classifies as permanent capital.3 That is an unusually high share for an alternative asset manager. For most of the industry's history, large firms depended on closed-end funds that returned capital after a decade, forcing them to raise successor funds over and over. Each fundraising cycle was a referendum, and a bad cycle could cut fee income sharply.
Permanent capital changes that rhythm. A listed BDC, a perpetual non-traded fund or a long-dated insurance mandate keeps paying fees year after year without a new fundraising campaign. When fundraising slows, as it did in 2026, the fee base does not fall off a cliff; it simply stops growing as fast. That cushion is real, and it is the single most important reason Blue Owl's revenue held up during a year of redemption headlines.
But the label promises more than it can deliver. "Permanent" describes the fund structure, not the investor. A non-traded BDC is permanent capital in Blue Owl's classification, yet it may still offer quarterly repurchases to its shareholders, and if repurchases exceed new subscriptions, the fund shrinks and so does the fee. A listed BDC is permanent in the sense that its shareholders sell shares to each other rather than redeem from the fund, but its fee base can still decline if loan values fall or if the fund returns capital. Permanent capital cushions fundraising cycles. It does not make every fee stream perpetual or every product liquid, as the first half of 2026 showed.
The next step is the one investors most often skip: the journey from fee revenue to earnings that belong to Blue Owl's public shareholders. Three costs sit in the way.
The first is people. Asset management is a talent business, and Blue Owl pays much of its talent in stock. In 2025, equity-based compensation was about $674 million, roughly 23% of revenue.2 Management's preferred profit measures, fee-related earnings and distributable earnings, exclude much of that cost, on the argument that it is non-cash. It is non-cash in the period. It is not costless to shareholders, because every share issued to employees is a share that dilutes everyone else's claim on future earnings.
The second cost is the acquisitions. The $359 million of intangible amortization recorded in 2025 is an accounting charge for the customer relationships and fund contracts Blue Owl bought.2 It does not drain cash today, but it reflects real money and real stock spent in the past.
The third cost is structural. Because of the Up-C, a large share of the operating partnerships' income belongs to the insiders' units and is reported as noncontrolling interests. Net income attributable to Blue Owl Capital Inc. was about $79 million in 2025 and about $95 million over the twelve months to September 2026.23 Those figures are small against $3 billion of revenue, and they are the denominator the market uses when it calculates a GAAP price-to-earnings ratio.
None of this means Blue Owl is unprofitable in an economic sense. Operating cash flow in 2025 was about $1.26 billion.2 The company generates substantial cash, and it collects most of its receivables within a quarter. What the gap means is that a shareholder must choose which measure of profit to believe, and must understand why the measures differ.
One last boundary keeps the analysis honest. Blue Owl reports a single operating segment.2 It discloses revenue and AUM by platform, credit, real assets and GP strategic capital, but not separate profits for each. So when the story turns to competition and diversification, platform revenue and AUM can show where the business is growing; they cannot show which platform earns the best margins. That limitation matters most in the arena where Blue Owl began: lending money to companies, against some of the largest and most aggressive firms in finance.
VI. The Credit Machine Meets Its Rivals
Imagine the chief financial officer of a mid-sized software company owned by a private-equity firm. The company needs a $1 billion loan to fund an acquisition. Ten years ago, the CFO would have called a handful of banks, who would have arranged the loan and sold it in pieces to institutional investors, with all the delay and price uncertainty that involves. Today the CFO has options. A bank syndicate is still possible. So is a club of direct lenders, each taking a slice. Or a single large manager might write the whole check.
That is the market Blue Owl's credit machine was built for. The economics are straightforward once laid out. Investors, whether pension funds, insurers or individuals in a non-traded BDC, supply the capital. Blue Owl's team finds borrowers, negotiates the loan terms, monitors the company and works out problems if the borrower struggles. The loan's interest flows to the fund. Blue Owl earns management fees on the fund's assets and, in some vehicles, incentive fees on its income. Crucially, the fund bears the credit risk. If the software company defaults, the fund's investors lose money; Blue Owl loses fees on the impaired assets and some reputation, but not the principal.
Credit is still the heart of the company. In 2025, the credit platform produced about $1.75 billion of revenue, roughly 61% of the total.2 By the second quarter of 2026, Blue Owl reported about $158 billion of credit AUM, with direct lending its largest single strategy.12
The Federal Reserve has described private credit as loans made by non-bank lenders, mostly to mid-sized companies, typically at floating interest rates and usually held to maturity rather than traded.13 Borrowers tend to be smaller and more leveraged than those that borrow from banks or in the public bond market.13 The floating-rate feature was a gift during 2022 and 2023, when the Fed raised short-term rates sharply. As base rates rose, so did the interest every borrower paid, and fund income climbed with it. Investors in direct-lending funds earned higher yields than they had in a decade, and that attracted a flood of new capital.
The same feature has a sting. A borrower whose loan rate jumps from 7% to 11% has to pay that extra interest out of the same cash flow. Interest coverage, the ratio of a company's operating profit to its interest bill, shrinks. Companies that looked comfortably financed at low rates can become strained at high ones, and those that need to refinance face a tougher market. Higher rates help the lender's income in the short run and raise the odds of borrower trouble in the long run. The question for a direct lender is always which effect wins over a full cycle.
Blue Owl does not fight this battle alone. Blackstone, Apollo, KKR and Ares are all larger diversified alternative managers, and each has built a formidable private-credit business.14 Comparing them, though, requires care. Each firm defines AUM differently, includes different products under "credit" and counts insurance balance sheets, leverage and committed capital in different ways. Total-company AUM is not private-credit market share. What the peer comparison can establish is that Blue Owl operates among a small group of firms with the scale to write very large loans and to raise capital from both institutions and wealthy individuals. It cannot establish that Blue Owl is the leader.
The product mix shows where Blue Owl is placing its chips. Direct lending to sponsor-backed companies is the core. Alternative credit, strengthened by Atalaya, lends against pools of assets. Investment-grade credit, often aimed at insurers that need high-quality yield, offers lower returns with lower risk. Liquid credit, including collateralized loan obligations, extends the platform into more traded markets.3 Each line widens the range of investors Blue Owl can serve, and each puts it up against a different set of rivals.
So why should a borrower or an investor choose Blue Owl? Management's answer, repeated across calls and presentations, is scale, incumbency and the ability to hold large loans. Those are genuine advantages. A sponsor that needs certainty values a lender that can commit the whole loan. A lender that has already financed hundreds of companies has data on how similar borrowers behave. And a manager with both institutional and retail capital can keep lending when one channel slows.
The harder test is whether those advantages produce durable economic results. A moat in direct lending would show up in a few measurable places: retaining borrowers when their loans refinance, winning mandates at better terms than rivals, maintaining pricing as competition intensifies, and suffering lower losses than peers through a downturn.
Blue Owl does not disclose borrower retention, win rates or customer concentration in its annual report or quarterly filings.2 What it does disclose, fee-paying AUM growth, fundraising and deployment, has slowed. Fee-paying AUM growing at 5% in a year when total AUM grew 12% does not suggest a firm with unusual pricing power; it suggests a firm whose recent capital has been harder to deploy at its preferred terms.
That does not reject the claim of competitive strength, but it narrows it. The evidence supports a credible, scaled position in a crowded market. It does not yet establish a durable edge through lower losses, better pricing or stickier relationships. The test that would confirm or falsify the stronger claim is a full credit cycle: if Blue Owl's funds report materially lower defaults and higher recoveries than peers when the next serious downturn arrives, the moat argument gains real evidence. Until then, it rests on scale and reputation.
Fitch Ratings offered an outside view in October 2026. It affirmed Blue Owl Capital Inc. at BBB+ with a stable outlook, citing the firm's permanent fee-earning capital, improving product diversity, investment performance, fee-related earnings margins, liquidity and leverage in line with expectations.15 Its list of constraints was just as telling: leverage, scale below higher-rated peers, relatively low capacity for incentive fees, high payouts to shareholders, and key-person, reputational and regulatory risks.15 Fitch also flagged macroeconomic pressure, borrowing costs, the risk of a credit bubble and the danger of overinvestment in AI infrastructure.15
Read carefully, Fitch's view matches the narrower claim. Blue Owl is a solid, investment-grade manager with a sticky fee base and real scale. It is not yet among the largest or most diversified firms, it pays out most of what it earns, and it carries risks tied to its founders and its reputation. Its strategy for closing the gap with the giants has been to build second and third engines beyond direct lending.
VII. Diversification Beyond Direct Lending
In late October 2025, Meta Platforms announced a joint venture with funds managed by Blue Owl to finance the Hyperion data-center campus in Richland Parish, Louisiana. Blue Owl's funds would own 80% of the venture and Meta 20%, with roughly $27 billion of total development costs to be funded by the partners.16 Meta would build and operate the campus and lease it back.16 For a firm that had started life lending to middle-market companies, it was a striking image: Blue Owl capital sitting underneath one of the largest AI infrastructure projects in America.
The Hyperion deal captured what Blue Owl had been building outside credit. By the second quarter of 2026, AUM stood at about $319 billion.12 Direct lending accounted for roughly 36% of it, net lease about 17%, and GP strategic capital about 5%, with the remainder spread across other credit strategies and real assets such as digital infrastructure and real-estate credit.12 On the AUM chart, Blue Owl no longer looked like a lender with a few side businesses. It looked like a diversified alternatives firm.
GP strategic capital is the heir to Dyal, Blue Owl's business of buying minority stakes in other alternative managers.2 The managers keep running their own firms. For Blue Owl, the attraction is long-dated, fee-generating capital from investors who want exposure to the industry's growth. For the managers, the attraction is cash without surrendering control. The Sixth Street dispute from the merger years remains the clearest reminder that these are relationships, not passive bonds.
The real-assets business has two different characters. Net lease, the Oak Street engine, is an established platform with a long record and a steady flow of sale-leaseback deals. Digital infrastructure, accelerated by IPI, and real-estate credit broaden the offering into newer, faster-growing markets. The digital business rides one of the largest capital-spending booms of the decade, as hyperscale technology companies race to build data centers for AI.
That boom deserves both excitement and caution. Data centers need enormous amounts of capital, and tech companies have shown they are willing to share ownership with financial partners to keep the projects off their own balance sheets. Blue Owl's funds can provide that capital, and managing it earns fees. But a growing investment opportunity is not the same as a demonstrated earnings contribution. Blue Owl does not disclose stand-alone profits for its digital-infrastructure business, and Fitch has explicitly named AI-infrastructure overinvestment as a risk.15 If the AI build-out slows, the leases signed today will still pay, but the pipeline of new deals and the fees they bring could shrink.
For perspective, credit still produced roughly 61% of revenue in 2025.2 Revenue diversification remains partial, and Blue Owl reports as one segment, so profit contributions cannot be measured from the outside.
What would confirm the diversification thesis? Sustained growth in fee-paying AUM and revenue outside credit, at a pace that steadily lowers credit's share of the total. Evidence that acquired platforms such as Oak Street, IPI and Atalaya are growing their fee base faster than the stock and earnouts issued to buy them. And enough disclosure for an outside investor to judge returns on that capital. Until then, the honest description is that Blue Owl has built promising second engines that broaden its catalogue and its investor base, while the original machine still does most of the work.
That original machine then faced a test that had nothing to do with loan losses, and everything to do with the investors who had lent it their money.
VIII. When Semi-Liquidity Became the Story
The trouble began not with a default but with a merger that never happened. In 2025, Blue Owl proposed combining OBDC II, a non-traded BDC sold to individual investors, with Blue Owl Capital Corporation, the large listed BDC that trades under the ticker OBDC. The plan made sense on a spreadsheet: one bigger, cheaper-to-run fund instead of two.
But it collided with the reality of what OBDC II's shareholders thought they owned. A listed BDC trades at whatever price the market sets, which can be below the value of its loans. Investors who had bought a non-traded fund at net asset value faced the prospect of exchanging into shares that might trade at a discount. In November 2025, the two funds terminated the merger.17
The episode passed quickly, but it planted a question in investors' minds. If the manager's preferred route to liquidity for one fund had been abandoned, what was the plan for investors who wanted out?
By early 2026, that question was spreading across private credit. Redemption requests rose at several non-traded BDCs across the industry, including at Blue Owl's vehicles. Fears were feeding on each other: concerns about the quality of loans to software companies as AI threatened their business models, worries that marks on private loans were too generous, and simple momentum as headlines about withdrawals prompted more withdrawals.
Blue Owl's February 18 response brought that question into focus.1 The loans were sold at 99.7% of par, meaning buyers paid almost exactly the face value of the debt.1
That price was the most important number Blue Owl could put in front of the market. If the loans were badly overvalued, a sale to sophisticated institutions would have revealed it. Instead, buyers paid nearly full value. That is genuine evidence that, at least for the loans sold, the marks were reasonable.
It is also limited evidence. A sale at 99.7% of par says that one set of loans, chosen by the seller and priced in one market environment, held its value. It does not say that every loan in every fund would fetch the same price, and it is not a full-cycle test of loan losses, which arrive when borrowers actually fail. Nor does it answer the liquidity question. Selling assets to meet redemptions works when buyers are willing; it is a different matter when many funds try to sell at the same time.
For OBDC II's shareholders, the move made the gap between the fund's structure and investor expectations concrete.
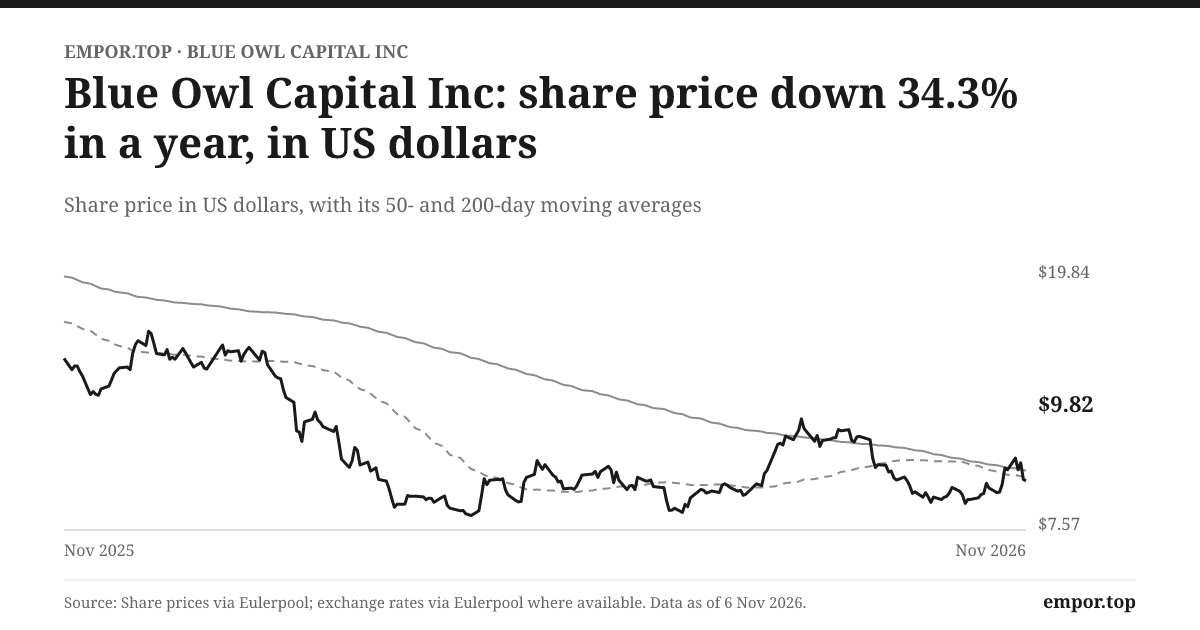
The stock fell hard through the first half of 2026. By the end of October it traded around $9.67, about 42% below its 52-week high of $16.67 and not far above its low of $8.23. Over five years, the largest fall from peak to trough was about 69%.
By the third quarter, the tone had shifted. In early October, Reuters reported that withdrawal requests at Blue Owl's flagship non-traded credit fund had slowed as private-credit turmoil eased.18 On the October 29 call, management said more than 90% of OCIC's roughly 90,000 shareholders remained invested.4
The prepared remarks emphasized recovery. The analyst questions probed its breadth. Management acknowledged that flows differed product by product, and that some vehicles were recovering faster than others.4 That is a more candid answer than a blanket all-clear, and it matters. A recovery in the flagship fund does not mean every semi-liquid product has stabilized, and an improving trend over two quarters is not the same as a durable one.
The 90% retention figure deserves its own scrutiny. It is impressive that the vast majority of OCIC's shareholders did not ask for their money back during a period of intense headlines. It also means that up to one in ten did, or at least that some meaningful fraction of the fund's investors made a choice to leave. In a vehicle designed for long horizons, that is not trivial. The right measures to track are redemption requests by vehicle, net flows after redemptions, proceeds from asset sales, and whether new wealth capital is replacing what leaves.
The AI story runs through all of this, and it cuts both ways. Blue Owl's funds lend to many software and technology companies, a sector that had been a favorite of private-equity sponsors for its recurring revenue. If AI disrupts those companies' products, their cash flows could weaken, leading to defaults and lower loan marks. Blue Owl itself flags AI-related investment and regulatory risks.2 On the other side, the same AI boom drives demand for the data centers that Blue Owl's digital-infrastructure funds finance.
It is tempting to say the two exposures hedge each other. They do not, at least not automatically. They sit in different funds, with different investors, and are measured in different ways. A loss in a credit fund is not offset by a gain in a data-center fund from the point of view of the credit fund's investor, and the manager's fees from each depend on each product's own flows.
So the 2026 liquidity test ended its first chapter with improving evidence and an open file. The firm sold loans near par, kept most investors in its flagship fund and saw wealth inflows recover. It also revealed, painfully, the gap between fund structures that permit limits and investors who expected cash. The harder question now is who decides how these funds are run and priced, and on whose behalf.
IX. The People Who Control the Fee Stream
In April 2026, Blue Owl mailed its shareholders a proxy statement that, read carefully, described two different companies. One was the public company most investors know: a listed asset manager with a growing fee base and a 9% dividend yield. The other was a controlled company, with the founders retaining their roughly 80% voting control, only four of ten directors were independent, and there was no separate compensation committee.7 Blue Owl relies on the New York Stock Exchange's controlled-company exemptions, which allow it to skip governance requirements that most listed companies must meet.7
At the same time, a quieter set of disputes was unfolding. By mid-2026, shareholders of affiliated funds had filed four derivative actions, one involving OBDC and three involving Blue Owl Technology Finance Corp., known as OTF, alleging that Blue Owl subsidiaries had charged excessive advisory fees.19 Blue Owl's subsidiaries are defendants. The cases remain unresolved, and allegations are not findings.
To understand why those two documents belong together, start with where the money comes from. Blue Owl says that substantially all of its management fees come from products it manages that are classified as related parties.2 In 2025, management fees were about $2.52 billion, roughly 88% of total revenue.2 The funds that pay Blue Owl are overseen by boards, many with independent directors, and their fee agreements are approved under investment-company rules. But the economic relationship is unusual by the standards of most listed companies: Blue Owl's largest customers are entities it created, manages and in many cases advises on how to grow.
The balance sheet reflects that relationship. At the end of 2025, about $694 million was due from related parties, covering management fees, administrative fees and costs Blue Owl had paid on the funds' behalf.2 Within that, management-fee receivables were about $448 million.2 Blue Owl says substantially all receivables are collected in the following quarter.2
That is reassuring, and consistent with a business that bills quarterly. It does not provide an ageing schedule, a history of write-offs, or a separate disclosure of contract assets, so an outside investor must take the collection cycle largely on trust. The growth in amounts due from related parties, which used about $103 million of operating cash in 2025, is worth watching for that reason.2
The money then flows to people, and here the 2025 numbers are revealing. The two co-CEOs, Doug Ostrover and Marc Lipschultz, each reported about $29.2 million of total compensation, almost all in stock awards.7 Each had reported about $18.5 million in 2023 and $23.9 million in 2024.7 Over the same three years, net income attributable to Blue Owl Capital Inc. went from about $54 million to $110 million and then back down to $79 million.2 Compensation rose steadily while GAAP earnings attributable to public shareholders did not.
There is a fair defense. Executive pay at Blue Owl is designed around the fee-based measures management uses to run the business, not around GAAP net income, which is distorted by amortization and the Up-C structure. Paying in stock also ties the executives' wealth to the share price, which fell sharply in 2026. But the defense depends on one premise: that the measures management favors genuinely capture value for public shareholders. That premise is exactly what is under examination.
The cash-flow statement makes the point concrete. Operating cash flow in 2025 was about $1.26 billion.2 The stock compensation and intangible amortization discussed earlier were also substantial.2 Neither is a cash cost in the year, but both are economic costs over time. The stock compensation dilutes public holders; the amortization reflects money and stock spent to buy the platforms that produce today's fees.
The dividend shows the same tension from another angle. In 2025, Blue Owl paid about $547 million of dividends to Class A shareholders against $79 million of net income attributable to them, a payout of roughly 701%.2 Taken alone, that ratio would suggest a dividend wildly beyond the company's means. It is better read as a warning about the earnings measure: GAAP net income attributable to Class A holders is depressed by amortization, equity compensation and the TRA, none of which consume the cash that pays the dividend.
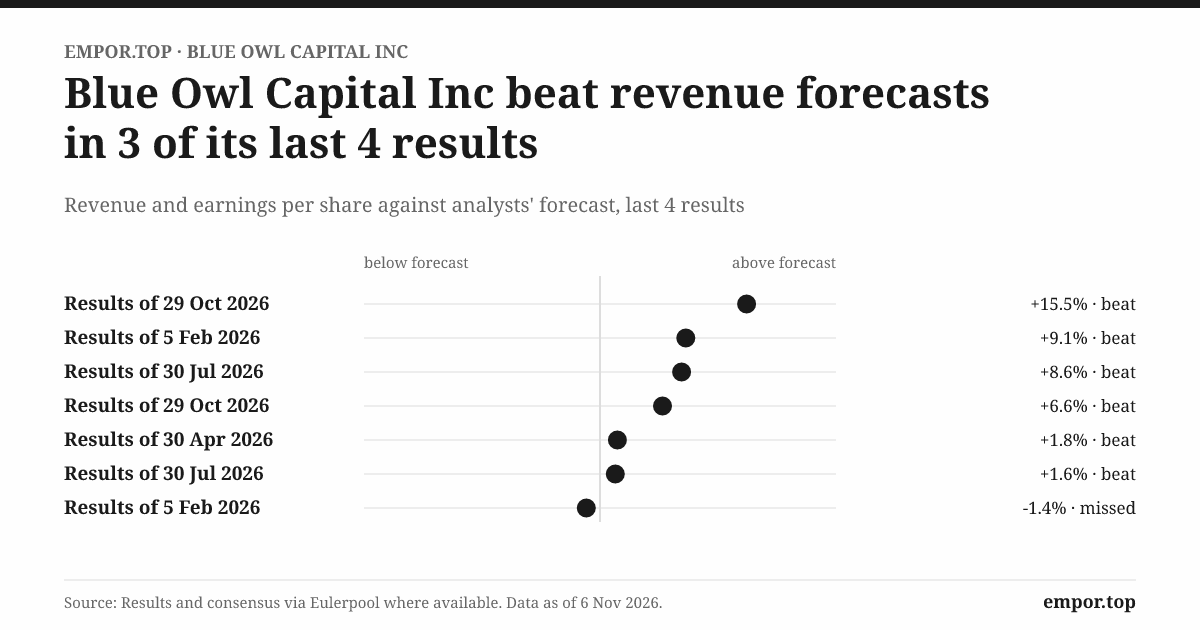
Management's preferred measure tells a calmer story. In the third quarter of 2026, distributable earnings were $0.24 per adjusted share, slightly above the $0.23 quarterly dividend, and management said it expected to exceed the dividend again in the fourth quarter.4
Neither ratio is the whole answer. Distributable earnings exclude the cost of the stock paid to employees, so a payout that looks comfortable on that measure may be funded, economically, partly by dilution. GAAP earnings, meanwhile, overstate the cash burden of past acquisitions. The honest reading sits between them: the dividend is supported by cash generation today, with a thin cushion, and its long-term sustainability depends on fee growth outpacing share issuance.
There is also a long-tail obligation. Under the tax receivable agreement signed at listing, Blue Owl estimated potential future payments to insiders at about $1.8 billion at the end of 2025, revising the estimate to about $1.7 billion by mid-2026.219 Those payments are tied to tax savings, so they are partly self-funding, but they represent a real claim on future cash that public shareholders do not share.
The control record adds a final layer. At the June 2026 annual meeting, all directors were elected, but the votes against were substantial: about 183 million shares opposed independent director Claudia Holz, about 148 million opposed Marc Lipschultz and about 147 million opposed Michael Rees.20 With the principals controlling most of the votes, those numbers could not change an outcome. They did send a message. A meaningful share of outside holders was willing to vote against the founders themselves.
So can outside shareholders trust this structure? Founder ownership does align the principals with long-term equity value; they hold enormous stakes and have every incentive to see the share price recover. But concentrated control and related-party fee dependence raise the bar for independent oversight and transparent disclosure. The derivative suits, whatever their outcome, are a direct challenge to whether fund-level fee approvals are working as intended.
Management's credibility now rests on a handful of measurable tests: deploying the fee backlog, delivering the acceleration in fee growth it has signaled for 2027, managing redemption pressure without forcing asset sales at poor prices, and making shareholder economics, including dilution, clearer. Those tests lead straight to the question the market is asking every day.
X. Analysis & Bear vs. Bull Case
On October 30, 2026, a share of Blue Owl Capital closed at $9.67. The market valued the whole company at about $15.1 billion and its enterprise value, including debt, at about $19.3 billion. A shareholder who had bought at the peak was down roughly two-thirds. A shareholder who had bought the PIPE at $10 in 2021 had collected years of dividends and was roughly back where they started on price.
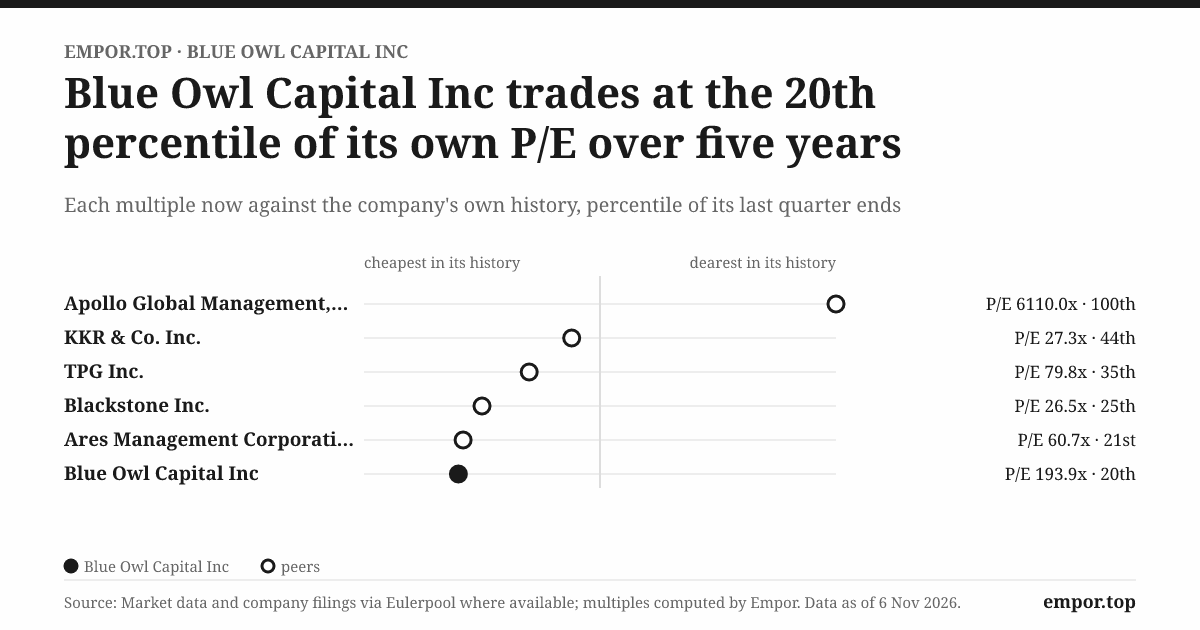
The valuation numbers that screen services publish are, for this company, more puzzle than answer. The trailing price-to-earnings ratio was about 191 times, against a five-year median of about 381 times. The dividend yield was about 9.4%. The free-cash-flow yield was about 8.8%.
Begin with the strange P/E. It appears to compare the market value of the entire economic company, including the units held by insiders, with net income attributable only to Class A shareholders, about $79 million in 2025.2 Consolidated net income, which includes the insiders' share, was nearly four times larger.2 So the P/E is less a measure of how expensive Blue Owl is than a measure of how small one slice of its accounting income is.
A screen built on forward earnings tells a very different story: in mid-October 2026, one market comparison showed Blue Owl at about 9.5 times forward earnings, against roughly 15.5 times for Blackstone, 12.3 times for KKR, 11.1 times for Apollo and 16.6 times for Ares.14 That comparison uses a different earnings basis, likely closer to distributable earnings, so it is descriptive rather than definitive. It does suggest that, on management-style earnings, the market prices Blue Owl at a meaningful discount to its larger peers.
What does the price appear to assume? A discount of that size implies investors expect slower growth, more dilution, more risk to the wealth channel, or a combination. The 9.4% dividend yield points the same way: either the market expects the dividend to be cut, or it doubts the dividend can grow, or it applies a high discount rate to fee streams it no longer fully trusts.
The case for the business starts with the fee base. Permanent-capital products generated 85% of management fees.3 Those fees do not depend on raising a new fund every few years, so even a hard fundraising year does not collapse revenue. The $36.3 billion of AUM not yet paying fees represents roughly $400 million of potential annual management fees once deployed.3 The platform is broader than ever, spanning direct lending, alternative and investment-grade credit, net lease, digital infrastructure and GP stakes. And the third quarter brought evidence of stabilization: stronger wealth inflows and declining redemption requests at the flagship fund.4
The case against begins with the gap between growth and fee growth. Fee-paying AUM grew 5% while AUM grew 12%.3 Revenue growth slowed from about 25% in 2025 to about 7% year over year by mid-2026.19 The redemption stress of 2026 exposed a structural mismatch between fund liquidity terms and investor expectations, and that mismatch does not disappear because one or two quarters improved. Meanwhile, equity compensation and a rising Class A share count complicate per-share value, and the dividend absorbs most of the cash.
The case for the platform adds that credit and real assets give Blue Owl multiple places to deploy capital. When direct lending is crowded, it can push investment-grade or asset-based credit; when real estate is slow, digital infrastructure can grow. Floating-rate loans support fund income while rates stay elevated.
The case against counters that higher rates weaken borrowers over time; technology exposure concentrates risk in a sector AI may reshape; and competition from Blackstone, Apollo, KKR, Ares and dozens of other lenders can squeeze loan terms and fundraising. Leverage at the corporate level has also risen. Total debt reached about $3.7 billion by September 2026, after the company issued $750 million of 6.75% notes due 2036 and expanded its revolving credit facility to about $3.2 billion with maturity extended to 2031.3
The refinancing lengthened maturities, but at a coupon that shows the rising cost of unsecured borrowing. Debt to equity rose from about 0.8 at the end of 2021 to about 1.75 at the end of 2025.2
Now the moat, argued once and in full. Porter's five forces give the industry view. Buyer power is the critical force, and it sits in two places. Institutional investors can negotiate fees and spread money across many managers; wealth investors, it turns out, exercise their power through redemptions. Supplier power rests with talent, which is why so much compensation is paid in stock, and the cost of keeping that talent is visible in the $674 million of equity compensation.
The threat of new entrants is moderate: starting a small credit fund is easy, but building a platform that can hold billion-dollar loans and sell through national wealth platforms is not. Substitutes are real and cyclical; when banks and the syndicated loan market are open, borrowers have alternatives to private credit, and when public markets offer better yields, investors do too. Rivalry is intense, and it is intensifying as every major manager pushes into the same wealth channel and the same direct-lending deals.
Hamilton Helmer's seven powers sharpen the firm-level question. Scale economies exist: a larger platform spreads compliance, technology and distribution costs and can write larger loans. Blue Owl has them, but its larger peers have more. Switching costs are Blue Owl's strongest power, embodied in permanent capital: investors in a listed BDC or a perpetual fund cannot easily move their money elsewhere without selling or redeeming, and the fee keeps flowing in the meantime.
The 2026 redemption episode showed the limits of that power in semi-liquid products. Counter-positioning was part of Owl Rock's original edge against banks, but it has faded now that every major manager does direct lending. Brand matters in the wealth channel, where advisers favor names they trust, and brand is exactly what the redemption episode tested. Network economies, cornered resources and process power are hard to find. The GP-stakes network offers some informational advantage, but Blue Owl has not demonstrated that it produces superior economics.
The weighed conclusion is that Blue Owl's most defensible power is switching cost in its permanent-capital vehicles, supported by meaningful but not leading scale. The history of 2026 narrows that power rather than rejecting it: the fee base held while some products leaked capital. The stronger claim, that Blue Owl has a durable edge over its large peers in pricing, retention or credit outcomes, remains unproven.
The governance test sits across both cases. The founders' 80% voting control preserves strategic continuity and protects the company from short-term pressure. It also limits outside shareholders' ability to change course if the strategy fails, and it makes the derivative suits and fee oversight more consequential than they would be at a widely held company.
Three measures will tell investors more than any valuation multiple. The first is fee-paying AUM growth relative to total AUM growth, which stood at 5% against 12% in the latest quarter, a gap that needs to narrow.3 The second is the conversion of the $36.3 billion of AUM not yet paying fees into fee-earning assets. The third is distributable earnings per adjusted share relative to the dividend, which stood at $0.24 against $0.23, a thin margin, alongside redemption requests at the major semi-liquid funds.4 The 191 times P/E and the 9.4% yield are prompts to reconcile earnings with distributions; neither alone establishes that the stock is cheap or that the dividend is safe.
XI. Playbook: Business & Investing Lessons
Go back to the founders' decision in 2020. Two firms with different engines and the same kind of capital chose to become one, list through a SPAC and build a platform for scale. Six years later, the $52.5 billion of AUM at listing had grown to about $330 billion.53 By that one measure, the bet worked spectacularly. By the measures that matter to a shareholder, the story is more complicated, and the lessons live in the complication.
The first lesson is that a merger proves its worth in the economics, not on the AUM chart. Owl Rock and Dyal fitted together neatly in 2021, and the combined platform has grown more than sixfold. Yet net income attributable to public shareholders remains tiny relative to revenue, and the share count keeps rising.
For founders, the lesson is that combining complementary capabilities buys a chance, not a result. For investors, it is that a merger's success should be measured per share, years later. In Blue Owl's case, the platform has plainly compounded; whether the public share has compounded with it is still the open question. Size is the scoreboard the manager keeps; per-share value is the one the shareholder lives with.
The second lesson concerns the price of acquisitions. Blue Owl's acquisitions broadened the platform, but without fee-related earnings and margins for each, price-to-AUM tells you almost nothing. The rule for anyone judging an asset-manager acquisition is simple: buying AUM is not the same as buying earnings, and an earnout is a promise the seller makes with your shares.
The third lesson is the one 2026 taught in public. Permanent capital smoothed Blue Owl's fundraising cycle, exactly as advertised, but the liquidity episode showed that “permanent” and “liquid” are different promises. Any firm selling long-dated assets to short-patience investors should remember that the gate is in the documents, but the run is in the headlines. Permanent describes the fund. Trust is renewed one redemption window at a time.
The fourth lesson is about control. Founder ownership can lengthen a company's horizon, and Blue Owl's principals have clear incentives to rebuild value. But concentrated voting power and fees from affiliated funds raise the bar for oversight. The June 2026 votes against two founders, which changed nothing in the count, still told management something about how outside holders felt. When the people who control the company also control its biggest customers, transparency stops being a courtesy and becomes the product.
The final lesson is the one every investor in asset managers should carry into the next deck they read. The question is not only how much a firm manages. It is how much of that earns fees, how long those fees will last and what remains for each share after the people, the acquisitions and the founders take their cut. At Blue Owl, those measures have drifted apart: AUM has grown faster than fee-paying AUM, while net income attributable to Class A shareholders remains small. Assets under management is a measure of trust lent; earnings per share is a measure of trust repaid.
XII. Epilogue
Tonight, Blue Owl sits in a strange equilibrium. Its funds hold about $330 billion of capital.3 Its flagship non-traded credit fund has seen withdrawal requests fall for two quarters in a row.4 Its share price is about 42% below its 52-week high, and its dividend is covered, on management's measure, by a margin of one cent a share.4 Fitch has just affirmed its investment-grade rating.15 Nothing about the company is in crisis. Nothing about the story is settled.
The next moment that will decide it is the fourth-quarter report, expected early in 2027. It will bring fresh readings of fee-paying AUM, fundraising and redemptions, and it will show whether management's expectation of exceeding the dividend again proves correct. A strong quarter, with fee-paying AUM growth closing the gap with total AUM and the fee backlog converting into fee-earning assets, would begin to answer the first central question: yes, Blue Owl can keep growing fees even when wealth fundraising is harder. A weak one, with fee-paying AUM flat and deployment slow, would suggest that the 2026 shock left a lasting mark on how much new capital the firm can raise and invest.
The second test runs through 2027 itself. Management has signaled that fee growth should accelerate next year as committed capital is deployed. Watch how much of that acceleration comes from deployment of money already raised, which is lower-risk and largely in management's control, versus fresh fundraising, which depends on the confidence of investors who have just lived through the redemption scare. If fee growth accelerates mostly through deployment while fundraising stays muted, the backlog will eventually run down; the platform needs both engines.
The third test belongs to OBDC II. Its shareholders are now receiving capital on the portfolio's schedule. Each update on the pace and size of those returns, and on the prices at which assets are sold to fund them, is a referendum on whether the firm can honor its liquidity commitments without damaging the value of what remains. Smooth returns near par would quietly vindicate the February decision. Slow returns or sales at discounts would revive every question the episode raised.
The fourth test is about public shareholders. Each quarter, investors should compare distributable earnings with GAAP income, track share issuance and stock compensation, and measure how much cash actually reaches Class A holders after distributions to insiders and TRA payments. If distributable earnings per adjusted share rise faster than the share count and the dividend, the shareholder's share of growth becomes visible. If they do not, the platform will have grown for its fund investors and its insiders more than for its public owners.
And then there are the courts and the fund boards. The derivative suits over advisory fees will eventually produce rulings, settlements or dismissals. Any finding against Blue Owl subsidiaries, or any voluntary change to how fund boards approve fees, would touch the heart of the related-party relationship. A dismissal would remove an overhang but not the structural question of who watches the watchers.
So the story remains open on its two deepest uncertainties: whether wealth investors will keep lending Blue Owl their patience, and whether public shareholders will capture enough of the resulting growth. The third quarter offered encouragement on the first and a thin margin on the second. The next few calls will show whether the storm of 2026 was a test the model passed or the first sign of its limits.
XIII. Outro
Return to that retiree, holding a statement from a fund that once offered a quarterly way out and now returns capital when the portfolio allows. On the other side of that statement sits a manager explaining, correctly, that the capital was always meant to be long-term. Both are telling the truth. That is the whole difficulty.
References
-
Certain Blue Owl BDCs to Sell $1.4 Billion of Assets to Institutional Investors — Blue Owl Capital, 2026-02-18 ↩↩↩↩
-
Blue Owl Capital Inc. 2025 Form 10-K — SEC, 2026-02-19 ↩↩↩↩↩↩↩↩↩↩↩↩↩↩↩↩↩↩↩↩↩↩↩↩↩↩↩↩↩↩↩↩↩↩↩
-
Blue Owl Capital Inc. Q3 2026 Earnings Presentation — SEC, 2026-10-29 ↩↩↩↩↩↩↩↩↩↩↩↩↩↩↩↩↩
-
Blue Owl Capital Inc. Q3 2026 Earnings Call Transcript — Stock Analysis, 2026-10-29 ↩↩↩↩↩↩↩↩
-
Altimar Acquisition Corporation S-4/A Proxy Statement and Prospectus — SEC, 2021-04-22 ↩↩↩↩↩↩↩↩↩↩↩↩
-
Blue Owl Capital Inc. S-1 Resale Prospectus — SEC, 2021-10-18 ↩↩
-
Blue Owl Capital Inc. 2026 Proxy Statement — SEC, 2026-04-17 ↩↩↩↩↩
-
Blue Owl Capital Announces Agreement to Acquire Oak Street Real Estate Capital — Blue Owl Capital, 2021-10-18 ↩↩
-
Blue Owl Capital Completes Oak Street Acquisition, Form 8-K — SEC, 2021-12-17 ↩
-
Blue Owl Capital Completes Acquisition of IPI Partners Business — Blue Owl Capital, 2025-01-06 ↩
-
Blue Owl Capital Significantly Expands Alternative Credit and Asset-Based Finance Capabilities with Atalaya Acquisition — Blue Owl Capital, 2024-07-16 ↩
-
Blue Owl Capital Inc. Q2 2026 Earnings Presentation — SEC, 2026-07-30 ↩↩↩
-
Private Credit: Characteristics and Risks — Federal Reserve, 2024-02-23 ↩↩
-
Alternative Asset Managers and Private Credit Deep Dive — The Closing Print, 2026-10-12 ↩↩
-
Fitch Affirms Blue Owl Capital Inc. at BBB+; Outlook Stable — MarketScreener reproducing Fitch Ratings, 2026-10-06 ↩↩↩↩↩
-
Meta Forms $27 Billion Joint Venture with Blue Owl to Fund Gigawatt-Scale AI Data Center Campus in Louisiana — DatacenterDynamics, 2025-10 ↩↩
-
Blue Owl Capital Corporation and Blue Owl Capital Corporation II Terminate Merger — Blue Owl Capital Corporation, 2025-11-19 ↩
-
Blue Owl Flagship Fund Withdrawal Requests Slow as Private-Credit Turmoil Eases — Reuters, 2026-10-02 ↩
-
Blue Owl Capital Inc. Q2 2026 Form 10-Q — SEC, 2026-07-31 ↩↩↩
-
Blue Owl Capital Inc. 2026 Annual Meeting Voting Results, Form 8-K — SEC, 2026-06-04 ↩
 LinkedIn
 WhatsApp
 Reddit
 Hacker News
 Email
 Kindle
 RSS Feed
 Spotify
 Apple Podcasts
 Amazon Music
 Audible
 YouTube