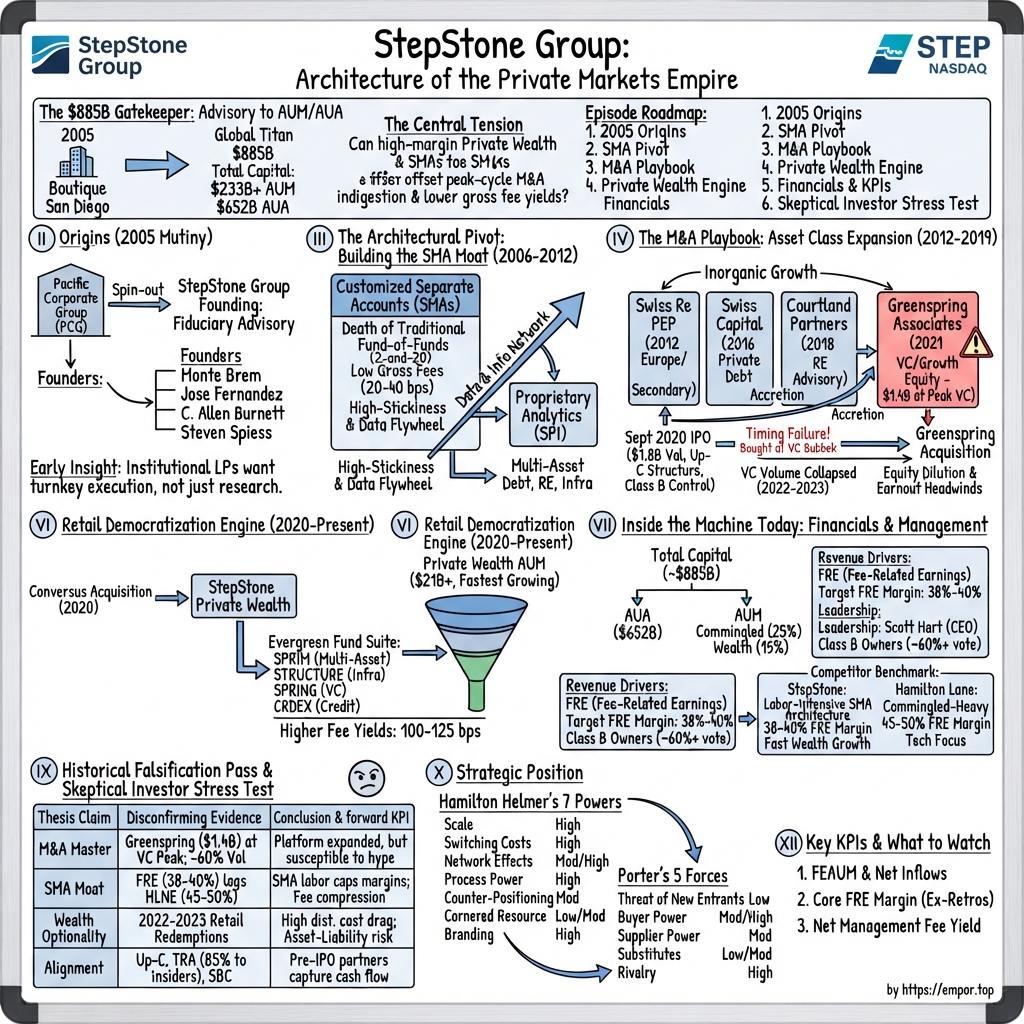
StepStone Group: Architecture of the Private Markets Empire
I. Introduction & Episode Roadmap
On the morning of July 2, 2026, a research note landed on the desks of alternative-asset analysts in New York with a title that needed no decoding: "Problems At StepStone." The short seller behind it, Hunterbrook, targeted not StepStone's investment portfolios — the typical target in asset-manager short reports — but a specific contract. Namely, Hunterbrook focused on a profits interest held by CH Equity Partners, an entity controlled by executives running StepStone's fast-growing retail division. Hunterbrook estimated StepStone could owe that entity roughly $2.3 billion, compared with StepStone's cash on hand of $213 million.12
The stock, already under pressure, drifted toward $38.85 — its low for the year and roughly half its trading level from twelve months earlier.3
Five weeks later, on August 6, 2026, the company reported its strongest quarterly results to date. Fee revenues rose 27% to $270.9 million, while fee-related earnings grew 30% to $105.6 million, generating a 39% FRE margin. Private wealth funds attracted a record $2.8 billion in new subscriptions over ninety days, lifting that platform past $21 billion — approximately double its size from a year earlier.49 Management raised the dividend by 18%, and the shares recovered.6
Both dynamics occurred simultaneously. That contrast highlights the central challenge of evaluating StepStone Group Inc. (STEP, NASDAQ), and why the firm warrants close examination.
The $913 billion gatekeeper. As of June 30, 2026, StepStone was responsible for approximately $913 billion of client capital. This total comprised $245.4 billion in assets under management, where StepStone makes investment decisions, and $667.9 billion in assets under advisement, where clients retain final discretion.4 For context, the firm did not legally exist until January 2007, when five founders departed a La Jolla consulting practice with zero dollars under management.7
The core thesis. StepStone differs fundamentally from buyout giants like Blackstone or KKR. It does not primarily acquire companies directly, nor does it act merely as a passive advisor. Instead, it functions as an architecture provider for private markets — designing, building, and operating private equity, private credit, real estate, infrastructure, and venture capital portfolios for institutional clients and wealthy individuals. Its mandates range from managing a bespoke $5 billion sovereign wealth account to co-investing alongside buyout sponsors or distributing monthly-subscription evergreen funds through wealth advisors.
The central tension. StepStone's business model relies on labor-intensive advisory mandates at its base and fee-rich products at its top. Its customized separately managed accounts — the core engine of its early growth — generate approximately 39 basis points on fee-earning assets. By contrast, its commingled vehicles, particularly retail evergreen funds, earn roughly 101 basis points.8 The core investment question is whether the expansion of these higher-margin products can continuously lift blended economics, without exposing the firm to liquidity mismatches from retail redemptions or share dilution from equity issued during past team acquisitions.
This analysis unfolds across several chapters. It starts with the departure of the founding team from their previous firm and the operational strategy that distinguished StepStone from traditional advisory peers. It traces the transition from pure advisory work to customized mandates, followed by the acquisitions that expanded a single-asset private equity firm into a four-asset-class platform. It examines the 2020 initial public offering and the 2021 venture acquisition — often viewed as a peak-market mistake, though evidence indicates a stronger strategic outcome. The analysis then details the retail distribution model, financial performance, compensation structures, and recent earnings call debates. Finally, it tests the key claims underpinning the investment case, applies strategic evaluation frameworks, and highlights the primary metrics for tracking future performance.
The founding story begins with a rift and a departure.
 Subscribe on LinkedIn
II. The Origins: The 2005 Mutiny & The Blueprint for Modern PE Advisory
La Jolla, California, in the early 2000s was an unlikely capital of institutional private equity. It offered better surf than Greenwich and less deal flow than Menlo Park. But it was home to Pacific Corporate Group (PCG), one of the first American firms to build a business advising public pension funds on which private equity managers to back.
PCG advised institutional investors on roughly $15 billion in private market commitments, operating long before alternative assets became a standard allocation in institutional portfolios.7 Monte Brem joined PCG as a managing director and served as president between 2002 and 2005. Jose Fernandez served as managing director and general counsel from 2004 to 2006, while Thomas Keck served as a managing director from 2005 to 2006.7
What was actually broken. The traditional advisory model of that era faced a structural bottleneck. A consultant wrote a report, and the client read it. The client then had to handle execution: negotiating side letters, managing legal work, monitoring positions, and reporting back to a board of trustees across dozens of managers and hundreds of underlying commitments. Providing advice was straightforward; handling the operational burden was difficult, particularly for understaffed pension funds.
Meanwhile, the economics of a pure advisory shop remained constrained. Advisory fees were small and subject to negotiation, whereas discretionary asset management fees were larger and more durable. Any growing advisory firm eventually faced a choice about whether to cross into discretionary management—a shift that risked creating conflicts with clients who hired the firm specifically for its independence.
The break. The founders departed PCG and, in January 2007, formed StepStone Group with Steve Mitchell and Robert Waldo alongside Brem, Fernandez, and Keck.7 The frequently cited 2005 date reflects when the founders began leaving PCG rather than StepStone's formal launch. StepStone itself dates its founding to 2007, establishing the firm roughly nine months before global credit markets froze.
That timing reshaped the firm's launch trajectory. StepStone opened in San Diego with no assets, no firm track record, and a core proposition—helping institutions build private markets programs—that faced immediate testing in a contracting market. The startup competed against established advisory firms such as EnnisKnupp, Cambridge Associates, and Mercer, all of which held deep institutional relationships. Then Lehman Brothers collapsed.
While such timing might appear disastrous, it proved advantageous for the firm's model. The global financial crisis exposed structural vulnerabilities among pension funds, which found themselves overcommitted, understaffed, illiquid, and tasked with explaining complex positions to trustees. Demand for outsourced operational support increased as a result. The 2009 through 2012 investment vintages that StepStone helped clients navigate ultimately proved to be among the highest-performing of the post-crisis era.
The founding insight. Brem and his partners recognized a gap that pure consulting firms had overlooked: institutional limited partners required operational execution rather than quarterly research. They sought a provider positioned between a traditional fund-of-funds—which added a second layer of fees while excluding clients from portfolio decisions—and a fully in-house investment team, which only the largest institutional funds could afford to maintain.
That positioning established StepStone's operational template. Subsequent developments—including acquisitions, data platforms, and retail funds—stemmed from this decision to bridge the gap between funds-of-funds and internal teams.
What it means. StepStone's advisory origin shaped its operational model. Coming from advisory rather than direct dealmaking, the founders established disclosure practices, low-fee advisory services, and a cost structure centered on client service rather than transaction execution. This service-intensive model also explains why the firm's margins have historically lagged behind peers with lighter operating models. Whether that trade-off benefits shareholders remains a question this analysis will evaluate with empirical evidence.
First, however, the firm had to design its core investment product.
III. The Architectural Pivot: Building the Customized Separate Account (SMA) Moat (2006–2012)
In 2008, institutional investors facing steep portfolio losses confronted the compounding costs of traditional fund-of-funds structures. Underneath primary asset performance sat multiple fee layers: underlying buyout managers collected management fees alongside a 20% profit share, while fund-of-funds managers added another tier of management fees and carried interest. Clients were effectively paying twice for a single allocation process. As private market portfolios dropped during the financial crisis, these multi-layered fee arrangements evolved from a quiet friction into a major governance concern.
The unbundling. StepStone's response was the customized separately managed account (SMA)—a single-client vehicle built to specific institutional mandates, incorporating the client's geographic, sector, and risk parameters directly into its governing documents. Rather than purchasing shares in a pooled fund, institutions received bespoke portfolios managed by StepStone, with fees charged once and at a substantial discount to traditional commingled vehicles.
The fee disparity remains significant. StepStone's separately managed accounts generated a weighted-average management fee of approximately 0.39% of average fee-earning assets in recent fiscal years, compared with 1.01% to 1.06% for its focused commingled funds.8 In effect, SMA clients pay roughly a third of the fee rate charged to investors in traditional commingled vehicles for broadly similar market exposure.
Building a business around lower fee margins offers two distinct strategic advantages:
First, scale. Institutional investors commit significantly larger sums to accounts they directly control than to pooled blind funds. A $3 billion separate account earning 39 basis points generates roughly $11.7 million in annual fees, exceeding the $7 million produced by a $700 million commingled fund earning 100 basis points—while managing a single institutional relationship rather than dozens of limited partners.
Second, retention. A separate account cannot be easily redeemed. It is governed by multi-year contracts integrated directly into the client's investment policy, custodial structure, board reporting framework, and tax setup. Replacing a provider requires restructuring internal governance and re-negotiating terms across dozens of underlying fund managers. Consequently, high switching costs create one of the most durable structural protections in StepStone's model.
The data asset behind the platform. Executing SMAs and advisory mandates across an expanding institutional client base produced a secondary advantage. StepStone conducted extensive due diligence on thousands of private funds, evaluating data rooms, modeling portfolio companies, and tracking realized performance. Over two decades, these cumulative reviews formed a proprietary repository of private market fund performance, deal structures, and company metrics that new entrants could not easily duplicate.
StepStone subsequently developed research and reporting technology around this information, now structured as the SPI platform. Management has sought to commercialize the dataset directly through index partnerships with FTSE Russell, a private credit benchmarking tool with Kroll, and a deal-level performance analytics product with PitchBook.5 During the August 2026 earnings call, Head of Strategy Mike McCabe noted that these initiatives remain in their early stages; while adoption rates are gradually increasing, revenue is not yet sufficient to report as a distinct line item, though management indicated it could become visible by the end of the fiscal year.9 Despite two decades of data collection, direct commercialization remains unproven and should be viewed as long-term optionality rather than an immediate earnings driver.
The multi-asset expansion. By the early 2010s, StepStone faced the limitations of operating exclusively within private equity. Institutional investors were increasingly segmenting alternative allocations into distinct buckets: private credit, real estate, and infrastructure. These asset classes were often managed by separate internal pension teams relying on specialized consultants. Relying solely on private equity threatened to reduce StepStone to a niche manager rather than a primary institutional partner across an entire private market program.
Rather than spending over a decade building internal expertise across each asset class organically, StepStone turned to targeted acquisitions.
IV. The M&A Playbook: Asset Class Expansion & Transaction Benchmarking (2012–2019)
Acquisitions in the private markets industry frequently suffer from key-person attrition once founders vest and clients follow departing executives. StepStone's record between 2012 and 2019 largely diverged from that pattern.
Parish Capital (announced November 2011, closed January 2012). The initial transaction set the template. Parish Capital Advisors was a North Carolina firm founded in 2003 with roughly $2 billion under management, specializing in niche and emerging managers—smaller funds with focused strategies that institutional investors found costly to evaluate relative to their commitment size.1011 Financial terms were not disclosed. Parish managing partner David Jeffrey became a StepStone partner who went on to lead European operations, complementing StepStone's existing London office.10
Through Parish, StepStone acquired specialized diligence capabilities in a labor-intensive segment of manager selection. In this area, information asymmetries are high, allowing proprietary data advantages to compound rapidly.
A correction worth making. Industry accounts occasionally misstate that StepStone acquired Swiss Re Private Equity Partners in 2012. In fact, BlackRock agreed to purchase that European private equity and infrastructure fund-of-funds franchise—with roughly $7.5 billion in commitments as of May 2012—from Swiss Re that year.12 Correcting this detail clarifies the firm's expansion history: StepStone built its European footprint primarily through Parish Capital and, later, Swiss Capital, rather than through a large fund-of-funds transaction.
Clairvue Capital Partners (June 2014). StepStone absorbed the Clairvue team to launch StepStone Real Estate.13 Clairvue focused on real estate secondaries and recapitalizations—purchasing existing fund stakes and restructuring property investments needing liquidity. While this appeared to be a modest bolt-on during the post-crisis real estate recovery, it established capabilities that became vital a decade later when commercial property owners required rescue equity.
Swiss Capital Alternative Investments (announced May 2016, closed December 2016). The acquisition of Swiss Capital Alternative Investments proved particularly well timed. The Zurich-based alternative manager held more than $5 billion under management, and the transaction established StepStone Private Debt and StepStone Hedge Funds.1415
In 2016, private credit remained a niche institutional allocation. While direct lending funds existed, the asset class had not yet absorbed the substantial capital flows redirected from bank balance sheets following post-crisis regulatory capital rules. By the mid-2020s, private credit became a dominant segment across alternatives. StepStone secured its entry before the sector crowded, executing a transaction small enough that public financial disclosure was not required.
Operational metrics reflect the expanded platform: in the quarter ending March 2026, StepStone raised approximately $3 billion in new private debt capital over ninety days, distributed across managed accounts, the final close of an opportunistic lending fund, the initial close of a direct lending fund, and evergreen credit vehicles serving institutional and individual investors.5 Private debt is now one of three asset classes where StepStone holds a 65% economic interest while repurchasing the remaining minority stakes.9
Courtland Partners (announced January 2018, closed April 2018). StepStone expanded its real estate reach by acquiring Courtland Partners, a Cleveland-based institutional real estate advisory firm founded by Michael Humphrey in 1995. Courtland had advised on more than $100 billion in client investment commitments, with nearly half originating outside the United States. Following the transaction, StepStone Real Estate oversaw approximately $100 billion in capital allocations, though just over $3 billion represented discretionary assets under management.1617
This ratio illustrates an important structural distinction: Courtland brought high transaction volume at low fee density. Advisory assets generate advisory fees, which represent a fraction of discretionary management fees. Management's strategic rationale assumed that advisory relationships could be converted into discretionary mandates over time. That conversion thesis has received partial support: StepStone's assets under advisement reached $651.8 billion by March 2026, up 25% year over year, with leadership citing advisory-to-discretionary transitions as a key growth channel.18 However, because StepStone has never publicly disclosed conversion rates, the conversion funnel remains an unverified management assertion rather than a proven operational mechanism.
Capital allocation discipline in context. Throughout this period, StepStone maintained a consistent acquisition structure: modest upfront cash, meaningful equity or partnership units, and multi-year vesting schedules to align incentives. Principals from Parish, Clairvue, Swiss Capital, and Courtland became StepStone partners rather than exiting sellers. None of these transactions resulted in disclosed goodwill impairments or high-profile partner departures. Furthermore, the asset classes established through these acquisitions—private debt, real estate, and infrastructure—are the same areas where StepStone has subsequently repurchased minority economic interests at a premium.
Even so, designating this strategy as disciplined capital allocation requires nuance. Every deal during this period was small enough that a failure would not have produced visible financial distress. The true test of StepStone's M&A model would depend on larger commitments—a test that arrived with its major acquisition in 2021.
V. The Wall Street Debut & The $725M Peak-Tech VC Trap: Greenspring Associates (2020–2022)
In the final week of August 2020, amid a broader market recovery, StepStone filed to go public.19 Three weeks later, on September 16, the offering priced at $18 per share—above its initial target range of $15 to $17.2021 Trading began the same day on the Nasdaq Global Select Market under the ticker STEP. When underwriters exercised their option in full, the company had sold 20,125,000 Class A shares, closing the offering on September 18 with net proceeds of $337.8 million.22 At the midpoint of the original range, StepStone carried an initial fully diluted equity value of roughly $1.6 billion.21
The corporate architecture underlying the offering followed a standard alternative-asset manager structure that carries long-term financial consequences for public shareholders.
The Up-C, in plain English. The operating business was structured as a partnership, with the public company serving as the managing member. Pre-IPO partners retained partnership units rather than converting to public shares, preserving a distinct tax advantage. When partners subsequently exchange those units for Class A stock, the transaction increases the tax basis of the company's assets, reducing future taxable income. Under Tax Receivable Agreements, StepStone remits 85% of these cash tax savings back to the exchanging partners, retaining 15% for public shareholders.23
While common across asset management IPOs, this mechanism represents a material and durable transfer of value: public Class A holders fund the majority of tax benefits generated by the firm's asset base while receiving a minor share. Financial models that omit Tax Receivable Agreement obligations overestimate the net cash available to public shareholders.
The governance structure was initially more concentrated. Each Class B share carried five votes prior to a contractual sunset provision. Immediately following the IPO, Class B holders controlled 92.8% of combined voting power, a figure that moderated to approximately 70.3% by mid-2022.24 Subsequent corporate changes later altered this control dynamic.
Then they bought a venture firm at the top. On July 7, 2021, StepStone announced the acquisition of Greenspring Associates, a Baltimore-area venture capital and growth equity specialist founded in 2000 with more than $17 billion of assets under management.2526 The transaction closed on September 20, 2021.27
Transaction terms warrant precision, as secondary summaries frequently misstate the total purchase price. StepStone paid approximately $185 million in cash, roughly 12.6 million Class A common shares, and roughly 3.1 million Class C partnership units—a package valued at about $725 million—alongside up to $75 million of potential cash earnouts.2628 Figures near $1.4 billion reported in secondary coverage conflict with primary regulatory disclosures.
The acquisition timing proved challenging. Global venture funding peaked in 2021 before contracting sharply through 2022 and 2023. Late-stage technology valuations compressed, and the IPO window closed. StepStone acquired a major venture franchise at the height of a market bubble, funding the transaction primarily with equity that diluted existing shareholders.
So did it fail? Evaluating the transaction requires distinguishing between short-term earnings drag and long-term strategic capabilities.
In the near term, financial returns lagged original projections. Carried interest from legacy Greenspring vintages slowed as industry realization activity contracted. As late as May 2026, Chief Executive Scott Hart informed analysts that full exit activity had not returned to historical averages, noting that deal liquidity relied heavily on partial realizations through continuation vehicles, minority sales, or stock distributions requiring gradual liquidation.5 Industry-wide write-downs also reduced valuations across 2021-vintage venture positions.
However, the acquisition provided core operational infrastructure. It brought specialized investment talent, extensive general partner relationships, and the capability to execute venture secondaries at scale. StepStone's venture secondaries strategy raised more than $3 billion in its preceding vintage, and a successor vehicle completed a $1 billion first close in the quarter ending June 2026.59 Crucially, these capabilities enabled the launch of StepStone Private Venture and Growth Fund (SPRING)—a retail vehicle that became a primary engine of organic growth, gathering nearly $1.7 billion of subscriptions in a single quarter while generating returns of 39% in calendar 2025 and 23% net through the first half of calendar 2026.59
In February 2023, during the venture downturn, Head of Strategy Mike McCabe described Greenspring on an earnings call as an integration success that accelerated the firm to $22 billion of venture assets under management.29 While management commentary during a downturn requires scrutiny, subsequent operating results substantiate the strategic benefits.
The calibrated conclusion. Claims that StepStone flawlessly times market entries across asset classes are undermined by the timing of the Greenspring deal. Conversely, arguments framing the acquisition as a value-destroying peak-market error are contradicted by operational results. StepStone paid a high price for a cyclical asset—legacy fund carried interest—while acquiring a structural capability in venture sourcing and secondaries. The firm then monetized that capability through retail wealth channels that were virtually non-existent in 2021. Although equity dilution was immediate, the strategic capabilities acquired yielded long-term platform value.
The key financial metric remains whether fee-related earnings per share grows faster than total share count over time. Since issuing equity for the Greenspring transaction, StepStone's weighted average diluted share count expanded from roughly 53.6 million in fiscal 2022 to approximately 80.3 million in fiscal 2026—a 50% increase.3018 Because fee-related earnings grew faster than share dilution over that span, per-share economics improved. Maintaining that balance remains essential as StepStone continues to expand its platform.
VI. The Retail Democratization Engine: Private Wealth & Evergreen Funds (2020–Present)
Bob Long had previously built an early model for retail private markets access before joining StepStone.
Long and Tim Smith had co-founded Conversus Capital, which grew into the largest publicly traded fund of private equity funds—a vehicle that allowed individual investors to purchase private equity exposure on a public stock exchange. Although Conversus sold its portfolio in 2012, the team retained the brand. On September 25, 2019, StepStone hired Long and Smith alongside Neil Menard, as president of distribution, to launch a wholly owned platform under the Conversus banner. The objective was to bring institutional private markets capabilities to high-net-worth and mass-affluent investors.31
Rather than purchasing an established retail distribution network, StepStone built the platform internally. Jason Ment, currently president and co-chief operating officer, reasoned that investment tools designed for institutional clients could be adapted for individual investors.31 At the time of the announcement, StepStone managed approximately $52 billion in assets out of $260 billion in total capital allocations, while its new retail division had no assets under management.31
Why the wrapper mattered more than the assets. Expanding private markets access to retail investors had long been hindered by structural friction. Traditional private equity funds drawdown capital over several years, return cash over an extended horizon, and lock up investor capital for a decade—a framework incompatible with individual wealth accounts and advisor reporting platforms.
StepStone addressed this operational barrier using evergreen fund structures. These open-ended vehicles accept monthly investor subscriptions at net asset value, maintain continuous capital deployment to limit cash drag, and offer periodic liquidity through capped tender offers. SPRIM, the firm's flagship multi-asset vehicle, caps quarterly redemptions at 5% of net asset value, while SPRING, the venture and growth fund, limits quarterly tenders to 2.5%.29
These redemption caps form the primary liquidity architecture. While they protect funds from sudden capital runs by capping periodic outflows, they also mean investors facing acute liquidity needs may have redemption requests prorated or deferred during market downturns.
How StepStone filled the funds. Managing continuous monthly inflows into illiquid assets creates immediate reinvestment risk if capital remains idle. Primary private equity funds call capital gradually, whereas secondary markets permit rapid deployment. By purchasing existing, fully invested fund stakes, StepStone established diversified portfolio exposures across hundreds of underlying companies and multiple vintages within months of launching new funds. During a May 2026 presentation, Ment noted that this portfolio cash flow profile allows StepStone's equity evergreen funds to absorb maximum quarterly redemptions for roughly 18 months without selling underlying assets, backstopped by a credit facility.5 However, because broader market conditions have remained stable, this liquidity buffer remains untested in a prolonged downturn.
The ramp. Platform growth was initially gradual. The first evergreen vehicle completed its initial closing in October 2020.32 By November 16, 2022—when StepStone retired the Conversus brand and renamed the unit StepStone Private Wealth, rebranding CPRIM and CSPRING as SPRIM and SPRING—total platform assets crossed $1 billion.33
Growth subsequently accelerated. By the quarter ending June 30, 2026, private wealth assets under management exceeded $21 billion—having roughly doubled in a year—supported by $2.8 billion in quarterly subscriptions and platform-wide redemptions below 2% of net asset value.9 Product offerings expanded beyond the original funds to include STRUCTURE for infrastructure, which recorded its first $100 million subscription month in April 2026; STEPX for private equity; CRDEX, a credit interval fund; and SCRED, a non-traded business development company that reached $2.8 billion in assets.59
Read the distribution data, not the AUM. Beyond total asset growth, distribution breadth indicates platform shelf-space retention. By mid-2026, StepStone worked with more than 800 distribution partners. Among platforms offering StepStone products for at least one year, the average partner distributed two distinct funds, with over half adopting two or more, and a growing segment offering three, four, or five funds.9
This multi-fund adoption rate offers a structural measure of advisor retention and platform integration. Adding multiple strategies from a single manager reflects institutional expansion patterns, where 45% of managed account additions in the June 2026 quarter originated from existing clients expanding into new strategies or creating new account setups.9
The economics, and their costs. The financial rationale for retail expansion centers on fee realization. Retail evergreen funds sit in the commingled category, earning management fee rates roughly three times higher than institutional separately managed accounts and generating substantially higher fee revenue per dollar of assets under management.
However, retail distribution requires ongoing expenditure. Certain distribution partners charge trailing fees on private wealth net asset value, which ran at approximately $5 million quarterly by mid-2026.9 Chief Financial Officer David Park confirmed that these trailing fee expenses scale directly with platform assets, creating a permanent offset to gross management fee margins.
Portfolio concentration presents another monitoring area. SPRING holds positions across more than 2,000 private companies, yet roughly 75 companies account for 75% of total net asset value. Additionally, a single commercial space enterprise previously represented an outsized share of fund assets before moderating to the mid-teens percentage range.9 Chief Executive Scott Hart stated that excluding that single holding, SPRING generated net returns in the mid-to-high 20% range for the fiscal year ending June 2026.9 While this performance reflects broader asset gains, it underscores the valuation sensitivity of semi-liquid retail funds holding concentrated stakes in late-stage private companies valued at infrequent intervals.
What the next leg depends on. StepStone has identified U.S. defined contribution plans as a primary long-term growth opportunity. In May 2026, the firm hired its first head of defined contribution solutions following a March 2026 Department of Labor proposal establishing a process-based safe harbor for incorporating private market investments into 401(k) menus.5 Ment highlighted that a process-oriented regulatory framework offers greater structural durability than asset-class-specific rules.5
While regulatory changes create optionality, institutional adoption within retirement plans remains subject to conservative fiduciary standards and operational review. Furthermore, when asked during the August 2026 earnings call regarding potential constraints on quarterly retail inflows, Ment answered that management saw no limiting factor.9 Evaluating the durability of these capital flows will ultimately depend on market conditions and ongoing redemption activity through full market cycles.
VII. Inside the Machine Today: Financial Mechanics, Segments, & Management
StepStone's fiscal 2026 income statement opens with a striking contrast: a GAAP net loss of $743.3 million on total revenues of $1.99 billion.18 The subsequent quarter added another $116 million loss, or $1.41 per share.4
Understanding how a firm generating record operational fees reports a nine-figure net deficit requires examining the specific accounting mechanisms driving these reported numbers.
Why GAAP does not reflect operating economics. StepStone's GAAP income statement is distorted by two primary factors. On the revenue side, GAAP rules require the firm to consolidate certain investment funds and record unrealized carried interest, which fluctuates with private market valuations that the firm does not control; in fiscal 2026, performance fees of $1.07 billion consisted largely of non-cash accounting accruals.18 On the expense side, GAAP requires StepStone to mark to market the changing fair value of its private wealth profits-interest buy-in obligation through the income statement each quarter. As the retail division has expanded, the estimated cost of buying out that interest has increased, resulting in non-cash accounting charges.54
Consequently, the reported GAAP deficit is mechanically linked to the growth of the retail platform. However, the underlying buy-in obligation remains a real liability that will eventually be settled in cash and stock, requiring separate evaluation below. Evaluating StepStone's ongoing profitability requires focusing on non-GAAP operating metrics.
The metrics that describe the core business. Fee-related earnings (FRE) serves as the primary metric for core profitability, measuring management and advisory fees minus operating expenses, while excluding performance fees and performance-linked compensation. FRE represents the firm's recurring earnings from its core platform services. In fiscal 2026, StepStone generated $354.4 million in FRE on a 38% margin, while adjusted net income reached $264.6 million, or $2.16 per share.18 By the quarter ending June 30, 2026, the firm operated at an annualized run rate exceeding $1 billion in management and advisory fees and more than $400 million in FRE.9
Underlying this fee generation is fee-earning assets under management, which stood at $144.0 billion at fiscal year-end, accompanied by $40.1 billion in undeployed fee-earning capital.18 This undeployed capital represents committed client funds that have not yet begun generating management fees, providing a clear view into the firm's organic revenue pipeline. Combined fee-earning capital reached approximately $193 billion by June 2026, up $37 billion year-over-year, representing a 19% compound annual organic growth rate since fiscal 2022.9
The management fee-rate trajectory. StepStone's blended management fee rate reached 65 basis points for the twelve months ending June 30, 2026 — flat compared with fiscal 2025 and up from 64 basis points in fiscal 2026, as an expanding mix of higher-margin evergreen funds offset lower retroactive fees.9 This compares with 54 basis points reported in the December 2022 quarter, reflecting a clear upward structural shift over the multi-year period.29
However, near-term fee-rate expansion experienced a temporary pause due to product design decisions. StepStone adjusted the fee structure on its flagship private equity secondaries fund to charge lower fees during the initial investment period and higher rates thereafter, reducing the upfront J-curve burden for institutional clients while creating an estimated three-to-four basis point initial headwind to the commingled fee rate.5 Chief Financial Officer David Park informed analysts in August 2026 that this adjustment accounted for the flat blended fee rate, forecasting that upward expansion should resume once fundraising for those vehicles completes.9 This commitment offers a clear benchmark for evaluating future fee realization.
Margin trajectory and operational execution. In February 2023, when StepStone's FRE margin stood at 33%, Head of Strategy Mike McCabe noted that the firm had expanded margins from the mid-20% range at its IPO and targeted "comfortably in the mid-30s" over the long term without committing to a specific timetable.29 By fiscal 2026, the full-year core margin reached 38%, with individual quarters touching 39% and 40%.1845
This expansion demonstrated operational leverage as the platform scaled. Park has maintained a cautious forward tone, advising analysts that while additional margin expansion remains achievable, the future trajectory may not be strictly linear.5
Executive leadership and compensation alignment. Chief Executive Officer Scott Hart represents a career-internal succession model. Hart joined StepStone in 2007, following analyst and associate roles at Morgan Stanley and TPG Capital. He helped establish the firm's London office in 2011, co-headed private equity co-investments from 2013, and led the private equity division until 2025. Hart served as co-CEO alongside co-founder Monte Brem starting in August 2019 before becoming sole CEO in January 2022.3536 Brem remained executive chairperson until stepping into an executive advisor role in August 2023.35 The leadership transition proceeded without disrupting operational growth.
Hart leads an executive team with defined functional roles, including Jason Ment overseeing operations and private wealth, Mike McCabe managing strategy and capital markets, and David Park serving as CFO.
Executive compensation structures emphasize long-term investment performance over fixed pay. Of Hart's $6,091,776 in total fiscal 2026 compensation, base salary accounted for $500,000, supplemented by a $1,031,135 cash bonus, $1,249,985 in equity grants, and $3,310,656 in other compensation, consisting primarily of carried interest distributions.34 Performance-linked investment distributions accounted for more than half of total executive earnings. Across the firm, over two-thirds of employees hold equity stakes, and more than 200 participate in the carried interest program.8 With a median employee compensation of $170,000, StepStone's CEO-to-median worker pay ratio stood at approximately 36 to 1, a relatively modest spread among publicly traded asset managers.34
Corporate governance shift. Public market governance has undergone a structural transition. The Class B multi-vote equity structure reached its contractual sunset on September 18, 2025 — five years post-IPO — reducing all Class A and Class B shares to a single vote per share. As a result, StepStone ceased to qualify as a "controlled company" under Nasdaq rules, initiating a mandatory transition toward full board independence by September 18, 2026.34
The board of directors is restructuring accordingly, contracting from nine members to seven following the 2026 annual meeting, with independent directors holding four seats while co-founder Jose Fernandez and Mike McCabe step down from board roles.34 With 80.7 million Class A shares and 38.6 million Class B shares outstanding as of May 2026, Class B voting power decreased from over 70% at the IPO to approximately one-third.34 This transition aligns voting power with economic ownership on the scheduled timeline.
Benchmarking against Hamilton Lane. Hamilton Lane (HLNE) provides the primary public peer comparison, having completed its IPO in 2017 while pursuing a similar expansion from institutional advisory services into retail wealth management. In fiscal 2026, Hamilton Lane generated $584.2 million in management and advisory fees, earned $344.5 million in fee-related earnings on a 50% FRE margin, and reported $759 million in total revenue and $388 million in GAAP net income, managing $141.8 billion in discretionary assets and $905.3 billion in non-discretionary assets.37
Comparing the two platforms highlights contrasting operational profiles:
First, scale. StepStone generates higher total management and advisory fees and higher absolute fee-related earnings than Hamilton Lane, reflecting faster asset growth across its multi-asset platform.
Second, margin efficiency. Hamilton Lane converts revenue to operating profit at a significantly higher rate, maintaining a 50% FRE margin compared with StepStone's 38% — a 12 percentage point margin differential that expanded as Hamilton Lane added two percentage points of margin year-over-year. StepStone management attributes its lower margin to deliberate upfront investment in specialized investment teams to capture market share. While this reinvestment strategy has supported top-line growth, StepStone continues to operate with a higher cost structure than its closest peer, making ongoing margin convergence a key metric for evaluating long-term operational efficiency.
VIII. Earnings Call & Transcript Evidence: Prepared Remarks vs. Analyst Q&A
StepStone’s quarterly earnings calls follow a distinct pattern: structured, slide-supported prepared remarks delivered by senior executives, followed by analyst questioning that zeroes in on the firm's most complex operational and financial challenges. Sell-side analysts—including Ken Worthington at JPMorgan, Ben Budish at Barclays, Michael Cyprys at Morgan Stanley, Brennan Hawken at BMO, Mike Brown at UBS, John Dunn at Evercore, and Alex Blostein's team at Goldman Sachs—routinely probe four primary themes during these sessions.
Theme one: Retroactive fee adjustments. When commingled funds complete subsequent closes, incoming limited partners pay management fees backdated to the fund's inception. These catch-up payments land in a single quarter without corresponding incremental operating costs, creating lumpiness in quarterly revenues and margins that historically complicated financial analysis.
To address this variance, management introduced a "core" margin metric that excludes retroactive fees, reporting the measure consistently regardless of whether the adjustment enhanced or reduced headline figures. In the quarter ending March 31, 2026, retroactive fees contributed $4.4 million, down from $15.7 million in the prior-year period; excluding catch-up fees, core fee-related earnings grew 28% compared with the reported 12% growth rate.5 In the June 2026 quarter, retroactive fees fell to $1.1 million from $2.9 million a year earlier, yielding core FRE growth of 33% versus the reported 30%.9 Chief Financial Officer David Park has consistently emphasized that rolling twelve-month figures provide a more accurate picture of operating performance because quarterly margins fluctuate with the timing of revenues and expenses.5
By establishing a symmetrical disclosure practice, StepStone provided sell-side analysts with a standardized baseline, making core fee-related earnings the primary benchmark for tracking underlying performance.
Theme two: Private wealth fund architecture. As StepStone's retail platform expanded, analyst inquiries shifted from initial distribution traction to technical mechanics and portfolio valuation.
On the May 2026 earnings call, Barclays analyst Ben Budish cited industry criticism regarding private equity secondaries, specifically whether purchasing discounted fund stakes generates artificial day-one valuation markups in semi-liquid retail vehicles.
Under standard accounting rules, secondary buyers purchase existing fund interests at a discount to reported net asset value, but record the assets at fair value—typically aligned with the underlying fund manager's marks. This accounting treatment can generate an immediate unrealized gain upon transaction closing before any operational improvements occur in the underlying portfolio companies.
Head of Strategy Mike McCabe addressed the critique directly, distinguishing transaction price under seller liquidity constraints from ongoing fair value, stating that "an immediate gain might be unrealized, but that does not make it unreal."5 To support this distinction, management cited fund performance attribution: for the year ending March 31, 2026, SPRIM generated an 11% net return, with approximately nine percentage points driven by post-acquisition asset appreciation; over the same period, SPRING recorded a 37% net return, with roughly 33 percentage points stemming from post-purchase gains.5
While these management-reported attributions are not independently audited, they indicate that reported returns have been driven primarily by ongoing asset growth rather than initial entry discounts. When JPMorgan analyst Ken Worthington asked whether secondary markups raised concerns among wealth advisors or primarily among public equity investors, President Jason Ment acknowledged that media coverage generated client inquiries, but stated that management's explanations had satisfied distribution channels.5
Theme three: Addressing short seller claims. During the August 2026 earnings call, Worthington directly addressed the short-seller report published by Hunterbrook, asking management to clarify cash requirements and potential share dilution associated with buying out the CH Equity Partners profits interest.9
In response, McCabe detailed StepStone's cash funding options: existing cash reserves, ongoing operating cash flow, borrowing capacity under an investment-grade rating from Kroll supporting private debt placements and credit facilities, and potential access to capital markets. He noted that incremental fee earnings from the acquired retail assets enhance borrowing capacity, while acknowledging that discretionary capital uses—such as share repurchases and supplemental dividends—would be re-evaluated against settlement obligations.9 This capital allocation approach indicates that funding internal buy-in liabilities could take priority over discretionary shareholder returns.
Regarding equity dilution, Chief Executive Scott Hart emphasized that up to 75% of the transaction consideration can be settled in stock, with 30% immediately tradable and the remainder vesting over three years—aligning with lock-up structures utilized in prior transactions, including the IPO, Greenspring acquisition, and minority asset-class buy-ins.9 While this precedent reflects historical deal structuring, the scale of the retail buy-in presents a larger potential dilution footprint.
Theme four: Realization timing and accrued carried interest. Analysts have repeatedly questioned when StepStone's accumulated performance fees will convert into cash, pointing to $935 million in net accrued carry as of June 30, 2026, with over 70% tied to fund programs older than five years.9
Hart's commentary across multiple quarters has emphasized market constraints over near-term monetization. In February 2023, he cautioned that exit activity would moderate.29 By May 2026, he noted that broader macroeconomic uncertainty, geopolitical tensions, and sector disruptions continued to delay public exits.5 On the August 2026 call, Hart described an industry disconnect: while exit activity has increased, transactions have increasingly taken the form of partial realizations—such as continuation vehicles, minority stake sales, and stock distributions—which typically do not trigger carry distributions under European-style waterfalls until fund cost and preferred returns are fully returned to limited partners.9
By refraining from setting exit targets, management has framed accrued carried interest as a long-term option tied to broader market liquidity rather than guaranteed near-term cash flow.
However, portfolio disclosure questions periodically encounter procedural responses. When Evercore analyst John Dunn inquired about the specific timing of the most recent valuation update for a major private holding in SPRING, Ment noted that the portfolio undergoes monthly valuation reviews—addressing the policy cadence rather than the specific asset's valuation date.5
IX. The Historical Falsification Pass & Skeptical Investor Stress Test
Every investment case rests on a set of underlying claims. The useful analytical exercise is not merely listing those claims, but testing them against the company's actual record. Four central claims carry the weight of the StepStone thesis.
Claim one: StepStone is a disciplined acquirer that times its entries into new asset classes.
The historical record splits cleanly. From 2011 through 2018, StepStone acquired smaller specialized firms, paid partly in equity, retained key principals, and established positions in private debt and real estate before those markets grew crowded. The firm experienced no disclosed goodwill impairments or high-profile partner departures, and the asset classes seeded during that period are the same ones it is now paying up to consolidate.
However, StepStone subsequently acquired a venture capital manager near the peak of the tech market cycle, funded the purchase primarily with equity, and spent years waiting for exit activity to normalize. The empirical evidence therefore rejects the strong version of the timing claim. Management does not consistently time market cycles. What the firm has demonstrated instead is a narrower capability: acquiring investment expertise and operational relationships that endure beyond the cycle in which they were purchased.
A second capital allocation decision receives less attention but warrants equal scrutiny. StepStone has systematically repurchased minority economic interests in its infrastructure, private debt, and real estate businesses from the team leaders managing those units. The third tranche, effective April 1, 2026, required $11 million in cash and $166 million in equity—representing 3.4 million shares—bringing StepStone's ownership of those asset classes to 65%. The purchase price is calculated via a formula linked to StepStone's own trading multiple, with this specific tranche executed at an average 14% discount to that baseline.59
Acquiring earnings below a firm's own valuation multiple is accretive on paper, and management describes the structure as capital-efficient with minimal integration risk. While both assertions are accurate, the process involves recurring purchases of assets from insiders at a formula-derived price, funded predominantly by issuing new equity to those same insiders. While each individual tranche is defensible, the recurring pattern requires ongoing monitoring.
What would confirm or falsify the narrowed claim: Fee-related earnings per share consistently growing faster than the fully diluted share count across successive transaction tranches.
Claim two: The customized separate account model produces peer-leading margins.
This claim is contradicted by the data. Hamilton Lane's 50% fee-related earnings margin compared with StepStone's 38% margin reveals a twelve-percentage-point gap that has persisted for years and widened slightly in the most recent fiscal year.3718 The root cause is straightforward: bespoke mandates require customized underwriting, tailored reporting, and dedicated client service. StepStone's executive team has acknowledged building senior investment and operational teams ahead of revenue realization.
The analytical conclusion is not that StepStone's model is inherently inferior, but rather that the two firms chose different strategic paths. StepStone traded higher margin efficiency for greater absolute scale, generating higher total management and advisory fees as well as larger absolute fee-related earnings than its higher-margin peer. Whether that trade proves advantageous long-term depends on whether StepStone's FRE margin expands as higher-margin retail wealth products scale, or whether higher operating overhead represents a permanent cost of its service-intensive model.
What would confirm or falsify: Core FRE margin excluding retroactive fees tracked on a rolling twelve-month basis. Sustained expansion toward the low 40% range would validate the scale trade-off. A prolonged plateau between 38% and 40% while private wealth assets expand would indicate that operational cost structures, rather than product mix, represent the primary margin constraint.
Claim three: Evergreen wealth funds are friction-free margin boosters.
This claim requires substantial qualification across three operational mechanisms.
First, distribution expenses offset gross margins. Platform trailing fees scale directly with private wealth assets, returning a meaningful portion of the higher gross management fee rate to wealth distributors as platform assets expand.9
Second, paper gains diverge from realized cash flows. A short-seller report by Hunterbrook highlighted that within SPRING over the prior fiscal year, net unrealized gains reached $1.87 billion compared with net realized gains of roughly $3 million, noting that most underlying holdings resided in vehicles without independently observable market prices.1 StepStone responded that fund valuations undergo regular reviews by external auditors, an independent board, and a third-party valuation firm.2 Both observations describe real aspects of the structure: independent review constrains valuation bounds, but it does not convert unrealized appreciation into liquid cash. Investors in funds charging annual performance fees that crystallize each December against marked asset values are effectively paying incentive fees on estimated valuations.9
Third, the retail liquidity model remains unproven in a severe downturn. Redemption caps, liquidity credit facilities, and modeled projections of eighteen months of redemption buffer represent deliberate structural protections, but they remain untested by a prolonged private markets contraction accompanied by a freeze in new subscriptions.
What would confirm or falsify: Quarterly redemption rates during periods of declining asset valuations. Private wealth redemptions have remained below 2% of net asset value per quarter against contractual caps that allow higher outflows.59 A sustained surge in redemption requests toward those caps, particularly within SPRING, would signal structural stress.
Claim four: Public Class A shareholders are aligned with pre-IPO partners.
The historical record delivers a split verdict on alignment.
Regarding corporate governance, alignment has improved. The Class B multi-vote share structure sunsetted on schedule five years post-IPO, and the company voluntarily relinquished its controlled-company status.34 This transition stands in contrast to practices where founding groups extend super-voting control, representing a tangible governance improvement.
Regarding economic distribution, structural frictions persist. Tax Receivable Agreements direct 85% of realized tax savings to exchanging partners rather than the corporate treasury.23 Equity has been issued repeatedly to acquire teams and consolidate asset-class stakes. Furthermore, the largest capital commitment remains the pending private wealth profits-interest buy-in.
The underlying mechanics explain much of the equity volatility in mid-2026. When StepStone established its retail platform in 2019, key executives received a profits interest through CH Equity Partners alongside an option to repurchase the business—an arrangement omitted from the IPO prospectus, consistent with its immateriality at the time. In 2022, the contract was restructured into a put option exercisable starting April 1, 2026, requiring StepStone to acquire the interest.1 StepStone recorded a GAAP carrying value for this obligation of approximately $2.3 billion at March 31, 2026, against $213 million in corporate cash on hand.12 Hunterbrook estimated that this carrying value priced the stake at roughly 43 times its prior-year recurring fee-related earnings of $53 million—a valuation multiple well above StepStone's public trading multiple.1
StepStone characterized that valuation comparison as fundamentally flawed, asserting that the contractual formula incorporates projected asset growth and applies a discount to StepStone's public trading multiple.2 The debate centers on forward projections: because the buy-in price reflects future private wealth economics, evaluating the price against trailing earnings yields an elevated multiple, while defending the valuation requires underwriting continued high growth in retail subscriptions.
Strong first-quarter fiscal 2027 results alleviated immediate liquidity concerns, supporting a recovery in the stock price.6 Nevertheless, structural capital requirements remain. Management indicated that it expects to fund up to 75% of the transaction using equity to maintain alignment, while utilizing debt capacity within its investment-grade rating parameters.59 Consequently, shareholders face prospective equity dilution from insider share issuance, increased debt leverage, and potential constraints on discretionary share buybacks or supplemental dividends.
What would confirm or falsify: The final settled transaction value, the cash-versus-stock composition, and whether adjusted net income per share continues to grow following share issuance.
The activist's brief. A skeptical investor would structure a short thesis around four core arguments. First, roughly three-quarters of StepStone's total client capital resides in advisory or low-fee separate accounts, meaning total asset metrics overstate the firm's core fee-generating engine. Second, organic growth has become concentrated in retail wealth channels, where performance relies heavily on late-stage venture valuations. Third, consecutive GAAP net losses driven by insider buy-in liabilities obscure underlying operating performance and create headline volatility. Fourth, recurring minority interest buy-ins, Tax Receivable Agreement obligations, and the private wealth buyout mechanism direct a substantial portion of platform value creation to internal executives.
The counter-arguments center on operational performance: fee-earning capital grew 27% year-over-year, FRE margins expanded six percentage points over two years, multi-vote governance overhangs eliminated on schedule, and fiscal 2026 dividends increased 23% alongside active share repurchases.4185 Both perspectives reflect underlying facts. StepStone presents a case where operating expansion and capital structure obligations move in contrasting directions, requiring investors to weigh operational growth against structural dilution.
X. Strategic Position: Hamilton Helmer's 7 Powers & Porter's 5 Forces
Strategic evaluation frameworks are useful only when permitted to yield uncomfortable conclusions. Applied to StepStone Group, several of them do.
Hamilton Helmer's 7 Powers Analysis
Scale economies — real, but narrower than advertised. The genuine version of this operational advantage stems from fixed due diligence costs. Evaluating a buyout fund requires similar analytical work whether an institution commits $50 million or $500 million, allowing StepStone to amortize diligence overhead across a massive capital base spanning five asset classes. However, the limit to this scale benefit is that the firm's largest expense line is human capital, which is repriced annually rather than fixed. Adjusted cash compensation accounted for 43% of fee revenue in the quarter ending June 30, 2026, with the sequential expense increase driven by the annual merit compensation cycle that took effect on April 1.9 Scale in this business delivers operating leverage across systems and administrative overhead, rather than senior investment talent.
Switching costs — the strongest power in the portfolio. A separately managed account is deeply embedded within a client's investment policy, board reporting, custodial arrangement, and tax infrastructure. While StepStone does not publicly disclose a client retention rate — making frequently cited "90%-plus" estimates unverified — behavioral evidence demonstrates substantial stickiness. Of the $20 billion in managed account additions over the twelve months ending June 30, 2026, $9 billion originated from new accounts or existing clients expanding into new asset classes.9 Clients extending existing mandates rather than re-tendering them reflects low switching-cost pressure in practice.
Network effects — moderate, and mediated rather than direct. StepStone's primary fund commitments generate information and market access. That access enhances its secondaries and co-investment deal sourcing, while superior sourcing attracts incremental institutional capital. Chief Executive Scott Hart has described this feedback loop explicitly as the primary driver of the firm's venture secondaries position.5 However, this mechanism does not constitute a direct network effect: adding a new client does not automatically increase platform value for existing clients. Instead, it represents a scale-driven informational advantage — more durable than a market trend, but less defensible than a network marketplace.
Process power — the most cited and least proven. Two decades of diligence reviews have built a substantial proprietary dataset. However, despite years of framing this data as a strategic asset, StepStone has not yet converted it into a material standalone revenue stream. Commercial partnerships with FTSE Russell, Kroll, and PitchBook remained pre-revenue as of August 2026.9 While the underlying data enhances internal investment underwriting, treating the platform as a commercialized data business remains aspirational rather than demonstrated.
Counter-positioning — historically decisive, now largely spent. Unbundling the traditional fund-of-funds fee structure served as a decisive counter-positioning strategy in the mid-2000s, as legacy incumbents could not match lower-fee separate accounts without eroding their own business models. That strategic transition has fully played out, and competitors across the industry now offer customized separate accounts. Counter-positioning represents a strategic advantage a firm can deploy only once.
Cornered resource — weak, by design. StepStone does not own scarce physical or intellectual assets; its platform relies on human capital and general partner relationships. The firm addresses key-person risk through broad equity distribution across its workforce: more than two-thirds of employees hold equity interests, and over 200 participate in carried interest.8 While this structure aligns internal incentives, it does not constitute a cornered resource. Furthermore, the ongoing cost of employee retention contributes directly to the operating margin gap relative to peer firms.
Branding — real on both sides, unequal in maturity. Two decades of institutional pension advisory work established a recognized brand that cannot easily be duplicated by new entrants. By contrast, the retail private wealth brand is roughly four years old, with its public profile tied heavily to recent performance in venture capital funds. Brand equity built primarily on short-term fund performance remains inherently vulnerable to market cycles.
Porter's 5 Forces Analysis
Threat of new entrants — low, and the barrier is time. A newly formed asset manager can recruit investment professionals and raise a fund, but it cannot rapidly replicate twenty years of historical diligence records or established relationships with public pension trustees. Consequently, the primary competitive threat originates not from startups, but from large, diversified asset managers expanding their solutions platforms.
Bargaining power of buyers — high, and it is the defining constraint. Large institutional investors negotiate separate account fee rates down to roughly a third of traditional fund levels, a structural reality StepStone cannot alter.8 Management demonstrated this dynamic directly by reducing fees on its flagship secondaries fund during the investment period to align with market practice.5 Asset managers possessing pricing power do not make such concessions. StepStone's strategic response has been to expand into retail private wealth channels, where individual investors possess structurally lower negotiating leverage.
Bargaining power of suppliers — moderate and asymmetric. Access to top-tier general partners is allocated rather than purchased, as premier buyout and venture managers ration co-investment and fund capacity. StepStone counters this supplier power by providing solutions to general partners, including secondary liquidity for limited partners and rapid execution on co-investments. This structure provides genuine leverage, but only in specific transactions where a general partner requires external execution capacity.
Threat of substitutes — moderate, and rising for the largest clients. The primary substitute for StepStone's services is internal management. Major sovereign wealth funds and large public pensions in Canada and Australia have constructed in-house investment teams, reducing reliance on external fund architects for core asset allocations. This ceiling explains why StepStone's incremental growth increasingly centers on mid-sized institutions and retail wealth investors. Nevertheless, sophisticated allocators continue to select StepStone for specialized mandates, as demonstrated by Australian infrastructure separate accounts, which represented one of the strongest institutional growth areas in the quarter ending June 30, 2026.9
Competitive rivalry — high and intensifying in the newest channel. Hamilton Lane serves as StepStone's primary public peer, operating at a higher profit margin, while firms like GCM Grosvenor, HarbourVest, Pantheon, and Neuberger Berman compete across institutional solutions. However, competitive rivalry is most intense within retail private wealth distribution, where StepStone competes for advisor shelf space against firms like Blackstone and Apollo, which possess significantly larger marketing budgets and broader retail brand recognition. Management asserted that credit inflows in 2026 resulted from advisors reacting to redemption pressures at competing direct-lending vehicles.5 While this distinction highlights StepStone's multi-manager positioning, maintaining advisor shelf space against larger peers remains an ongoing competitive challenge.
XI. The Playbook: Business & Investing Lessons
Lesson 1: Unbundling wins market share, but locks in lower long-term economics. StepStone captured market share by charging once where incumbents charged twice. But low fee rates attract large, sophisticated, price-sensitive clients who continue to negotiate pricing. The margin gap relative to higher-priced peers like Hamilton Lane represents the deferred bill for that strategy, arriving fifteen years later. The broader lesson: the pricing structure that wins initial market share can establish a ceiling on long-term profit margins. Escaping that constraint requires targeting new customer segments rather than attempting to raise prices on established accounts.
Lesson 2: Byproduct data assets are inexpensive to accumulate but difficult to monetize directly. StepStone's proprietary private markets dataset emerged as a natural byproduct of institutional diligence, strengthening internal underwriting. Yet a decade of framing that information as a commercial asset has yielded external partnerships that remained pre-revenue in mid-2026. Proprietary data that provides an internal analytical advantage does not automatically translate into external commercial software or benchmark revenue. Monetizing data requires distinct products, buyers, and sales channels.
Lesson 3: Acquiring a structural capability can offset a poorly timed purchase price. The 2021 Greenspring Associates acquisition was timed near the peak of the tech market cycle and funded with substantial equity dilution. Measured strictly by cyclical assets—such as legacy fund carried interest—the transaction underperformed expectations. But evaluated as a structural capability—providing venture sourcing, secondaries execution, and the architecture for retail vehicles like SPRING—it became a primary engine of platform growth. For acquirers, distinguishing between a target’s cyclical cash flows and its structural capabilities is essential, as market valuations frequently misprice the long-term value of underlying platform infrastructure.
Lesson 4: Expanding into a new distribution channel alters the underlying business model, not just product design. Building a private wealth platform did more than introduce higher fee rates. It shifted StepStone's liability profile by offering periodic investor redemptions, introduced permanent trailing distribution expenses that scale with assets, invited valuation scrutiny from retail advisors, and created internal profit-share liabilities large enough to impact the public equity valuation. High-margin retail fees were straightforward to forecast; the operational, liquidity, and capital structure complexities that accompanied them were far more difficult to anticipate.
Lesson 5: Deferred compensation structures are cheap when a business is small and expensive when it succeeds. The profits interest granted to the private wealth leadership team in 2019 appeared immaterial at the time of the 2020 IPO. Seven years later, the buyout obligation represents one of the largest single claims on StepStone's capital structure. Founders and corporate boards routinely grant equity participation in new initiatives under the assumption that outcomes will be modest. Capital allocation models must account for the compounding scenario, which is precisely when deferred liabilities come due.
XII. Key Performance Indicators & What to Watch
Three core metrics carry most of the weight in evaluating whether StepStone's business model is operating as intended.
1. Private wealth net flows — subscriptions less redemptions, and the redemption rate itself. This series provides the primary indicator of platform health. Gross subscriptions measure distribution traction, while redemption rates test whether the fund liquidity architecture holds. Redemptions have remained under 2% of net asset value per quarter against tender caps of 5% for the multi-asset fund and 2.5% for the venture fund.5929 The key signal is not a single record subscription quarter, but whether redemption rates stay safely below contractual caps during a market downturn when asset valuations fall and gross inflows slow — a scenario the platform has not yet experienced.
2. Core fee-related earnings margin, excluding retroactive fees, on a rolling twelve-month basis. This metric directly tests whether trading high service intensity for scale generates durable operating leverage. Having reached its initial target in the mid-30% range, management has declined to set a higher benchmark, noting only that future margin expansion will not follow a linear path.5 The full-year core margin reached 38% in fiscal 2026.18 Sustained movement into the low 40% range would signal that expanding higher-margin retail products is fundamentally reshaping StepStone's cost structure. Conversely, a margin plateau alongside expanding private wealth assets would indicate that operating overhead remains a permanent constraint.
3. Blended management fee rate in basis points. This figure compresses the central revenue thesis: higher-fee evergreen funds expanding against lower-fee institutional mandates and advisory assets, with the flagship secondaries fee restructure temporarily capping near-term upside.9 The blended fee rate rose from the mid-50s in late 2022 to the mid-60s before leveling off.299 Management has forecast that fee-rate expansion will resume once secondaries fundraising concludes and post-investment-period rate step-ups take effect. Because leadership has outlined a specific timeline for this re-acceleration, the metric provides a clear test of management execution and product-mix dynamics.
References
-
Problems at StepStone ($STEP) — The Bear Cave / Hunterbrook Media, 2026-07-02 ↩↩↩↩↩
-
StepStone Stock Falls After Hunterbrook Short Report Flags $2.3 Billion Liability — Sahm Capital, 2026-07-02 ↩↩↩↩
-
StepStone Group Reports First Quarter Fiscal Year 2027 Results — GlobeNewswire, 2026-08-06 ↩↩↩↩↩↩
-
StepStone (STEP) Q4 Fiscal 2026 Earnings Call Transcript — The Motley Fool, 2026-05-20 ↩↩↩↩↩↩↩↩↩↩↩↩↩↩↩↩↩↩↩↩↩↩↩↩↩↩↩↩↩
-
StepStone shares rebound as first-quarter results ease short-seller concerns — Alternatives Watch, 2026-08-10 ↩↩
-
StepStone Group Inc. Form S-1/A Registration Statement — SEC EDGAR, 2020-09-08 ↩↩↩↩
-
StepStone Group Inc. Form 10-K for the fiscal year ended March 31, 2026 — SEC EDGAR, 2026-05-27 ↩↩↩↩↩
-
StepStone (STEP) Q1 Fiscal 2027 Earnings Call Transcript — The Motley Fool, 2026-08-06 ↩↩↩↩↩↩↩↩↩↩↩↩↩↩↩↩↩↩↩↩↩↩↩↩↩↩↩↩↩↩↩↩↩↩↩
-
StepStone Group acquires Parish Capital — Private Equity Wire, 2011-11-30 ↩↩
-
BlackRock acquires Swiss Re Private Equity Partners — European Pensions, 2012 ↩
-
StepStone Group forms real estate unit with Clairvue Capital Partners — Pensions & Investments, 2014-06-25 ↩
-
StepStone Acquires Swiss Capital: Launches StepStone Private Debt and StepStone Hedge Funds — Business Wire, 2016-05-12 ↩
-
StepStone closes Swiss Capital acquisition — Private Debt Investor, 2016-12 ↩
-
StepStone Real Estate Completes the Acquisition of Courtland Partners — PR Newswire, 2018-04-03 ↩
-
StepStone Real Estate to Acquire Courtland Partners — StepStone Group press release, 2018-01-09 ↩
-
StepStone Group Reports Fourth Quarter and Fiscal Year 2026 Results — StockTitan, 2026-05-20 ↩↩↩↩↩↩↩↩↩↩
-
StepStone Group Files for Initial Public Offering — The Wall Street Journal, 2020-08-26 ↩
-
StepStone Announces Pricing of Initial Public Offering — GlobeNewswire, 2020-09-16 ↩
-
Investment firm StepStone Group sets terms for $280 million IPO — Nasdaq, 2020-09-09 ↩↩
-
StepStone Announces Closing of Initial Public Offering — GlobeNewswire, 2020-09-18 ↩
-
Form of Tax Receivable Agreement (Exchanges) — SEC EDGAR, 2020-08-26 ↩↩
-
StepStone Group Inc. Definitive Proxy Statement (Form DEF 14A) — SEC EDGAR, 2022-07-15 ↩
-
StepStone Group to Acquire Greenspring Associates — StepStone Group press release, 2021-07-07 ↩
-
StepStone to acquire Greenspring for $725 million — Pensions & Investments, 2021-07-07 ↩↩
-
StepStone Group Completes Acquisition of Greenspring Associates — GlobeNewswire, 2021-09-20 ↩
-
StepStone Group Inc. Form 10-Q for the quarter ended September 30, 2021 — SEC EDGAR, 2021-11 ↩
-
StepStone Group Inc. (STEP) Fiscal Third Quarter 2023 Earnings Call Transcript — Seeking Alpha, 2023-02-09 ↩↩↩↩↩↩↩
-
StepStone Group Inc. Fourth Quarter and Fiscal Year 2022 Earnings Release (Form 8-K exhibit) — SEC EDGAR, 2022-05-26 ↩
-
StepStone Launches Private Wealth Solutions Group — PR Newswire, 2019-09-25 ↩↩↩
-
Conversus Launches Conversus StepStone Private Markets Fund (CPRIM) — StepStone Group press release, 2020-10-01 ↩
-
StepStone Conversus Rebranded as StepStone Private Wealth; Surpasses $1 Billion in AUM — GlobeNewswire, 2022-11-16 ↩
-
StepStone Group Inc. Definitive Proxy Statement (Form DEF 14A) for fiscal 2026 — SEC EDGAR, 2026-07 ↩↩↩↩↩↩
-
Scott Hart — Management, StepStone Group Shareholder Relations ↩↩
-
StepStone Group Names Scott Hart as Co-CEO — PR Newswire, 2019-08 ↩
-
Hamilton Lane Incorporated Reports Fourth Quarter and Fiscal Year 2026 Results — Hamilton Lane, 2026-05-21 ↩↩
 LinkedIn
 WhatsApp
 Reddit
 Hacker News
 Email
Email Kindle
 RSS Feed
 Spotify
 Apple Podcasts
 Amazon Music
 Audible
 YouTube