Who makes money when health insurance margins are capped by law?
US health insurance is the meeting point of employer benefits, government budgets, hospitals, drug pricing, claims data and physician groups that take on financial risk. The law generally requires insurers to spend 80 or 85 cents of each premium dollar on care and quality improvement. That leaves premium collection on its own as a thin-margin business, and pushes the better economics toward scale, distribution, pharmacy negotiation, medical-cost control, risk adjustment and administration that needs little capital. It matters now because health spending is still rising while insurer shares have fallen over three years: a growing industry can still reward the wrong owners. The short answer is that insurers still make money. The more durable profits increasingly go to whoever can control the medical dollar, or collect a recurring fee without having to risk it.
The premium is a pie, but the law decides who gets the slices
Picture an employer's benefits manager opening the renewal letter for next year's health plan. The family premium has gone up again. It went up last year too: according to KFF's 2025 employer survey, the average family premium reached $26,993, about 6% more than a year earlier, and the worker's share was $6,850.3 At the same moment, in a separate world, the federal government is setting the terms on which private plans will cover tens of millions of older Americans in 2027. In late September, CMS said it expected Medicare Advantage premiums to fall on average and enrollment to be roughly 34 million.4
Two buyers, two price-setting systems, one industry. An obvious question links them. When the premium goes up, who gets the increase?
It would be natural to assume the insurer does. It collects the money, after all. But since 2011, federal law has drawn a line through every premium dollar. Under the medical-loss-ratio rule, insurers in the individual and small-group markets must generally spend at least 80% of premium on clinical care and quality improvement, and large-group plans at least 85%. Insurers that fall short owe rebates.2 Medicare Advantage works under a similar 85% standard. Think of the premium as a pie: the law reserves the largest slice for care before the insurer cuts its own share for administration, marketing and profit.
The pie analogy has limits, and the limits matter. "Quality improvement" is an accounting category with room for judgment. Rebates are settled long after the year ends. Risk adjustment changes how much a government plan is paid for each member, and that changes the size of the pie before anyone slices it. Each program has its own rules. The slices are real, but they are not cut as cleanly as the image suggests.
Even so, the basic effect is clear. If an insurer can keep at most 15 to 20 cents of a dollar, and most of that pays for claims processing, sales and compliance, then making money by simply charging more is a narrow business. A bigger premium means a bigger slice in absolute terms. It does not mean a fatter one.
A system of separate worlds
This is where the story becomes a theme rather than an industry. The money in a premium passes through many hands, and each of those hands grew out of a different history. Employers and unions buy coverage. CMS and state Medicaid agencies set prices and rules for the largest pools. Insurers pool risk and pay claims. Hospitals and doctors supply care, and in many towns they have more bargaining power than the plans that pay them. Drug makers set list prices. Pharmacy benefit managers sit between drug makers, pharmacies and plans and negotiate the terms. Brokers and consultants decide which plans employers see. More recently, physician groups have started accepting fixed payments for whole populations, and benefit-account companies hold billions of dollars of employee savings.
Each of these participants has its own claim on the same dollar. The scale of that dollar is huge. CMS estimates that private health-insurance spending reached $1.64 trillion in 2024, up 8.8% from the year before.1 Spending in this pool has risen every year since 2018.
The popular belief, tested
The easy conclusion is that if health spending keeps rising, health insurers must be a good place to own. The record does not support it. Empor's listed universe of 23 companies across distribution, underwriting, pharmacy, risk-bearing care and benefit administration grew revenue 4.6% in the quarter to June 2026 at a combined operating margin of 4.7%.5 That is a margin closer to a grocer's than a software company's. The combined shares returned 11.7% over the past year but fell 15.6% over three years.5 Meanwhile the dollars kept flowing to hospitals, specialty drug makers and the people who own those inputs.
So the first answer to the question is a qualified one. Insurers can still earn good money through volume, investment income on reserves, accurate risk coding, the scale to spread fixed costs, and ownership of adjacent businesses that the loss-ratio rule does not touch in the same way. But pure underwriting, taking a premium and paying claims, earns a thin spread by design.
The rest of this story is about how the system got this way, and where the money moves when the law holds one slice fixed. It starts in a Dallas hospital that was struggling to get paid.
 Subscribe on LinkedIn
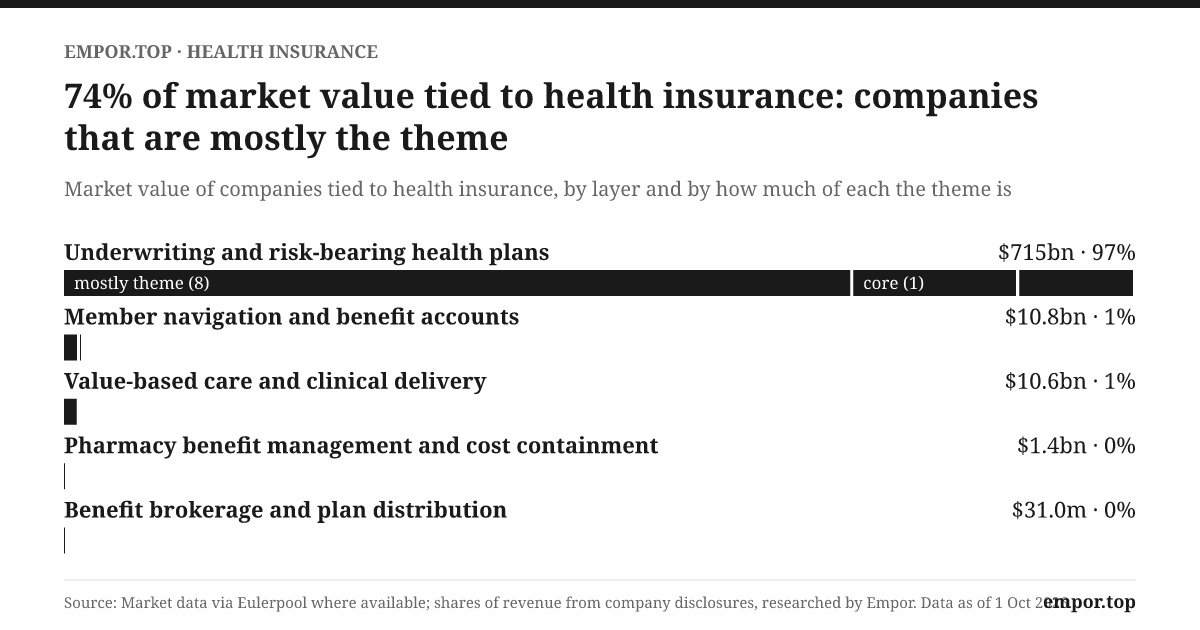
74% of market value tied to health insurance: companies that are mostly the theme
Market value of companies tied to health insurance, by layer and by how much of each the theme is
Underwriting and risk-bearing health plans $715bn · 97%
mostly theme (8) $527bn · core (1) $111bn · meaningful (1) $78.0bn
Member navigation and benefit accounts $10.8bn · 1%
mostly theme (3) $10.6bn · share not known (1) $235m
Value-based care and clinical delivery $10.6bn · 1%
mostly theme (5) $10.6bn
Pharmacy benefit management and cost containment $1.4bn · 0%
mostly theme (2) $1.4bn
Benefit brokerage and plan distribution $31.0m · 0%
mostly theme (2) $31.0m
Market value of the listed companies in each layer, in US dollars, on 1 Oct 2026, split by how much of each company's revenue comes from the theme: mostly theme (75% or more), core (20–75%), meaningful (5–20%) and small part (under 5%).
This is the value of companies associated with health insurance, not the value of the theme: too little of the theme's revenue is disclosed company by company to show that.
Who is left out · 17
- Aon plc – Health Solutions (Benefit brokerage and plan distribution): Not a listed company, or market value not available
- Marsh McLennan – Mercer (Benefit brokerage and plan distribution): Not a listed company, or market value not available
- Arthur J. Gallagher & Co. – Employee Benefits (Benefit brokerage and plan distribution): Not a listed company, or market value not available
- Willis Towers Watson – Health, Wealth & Career (Benefit brokerage and plan distribution): Not a listed company, or market value not available
- Health Care Service Corporation (HCSC) (Underwriting and risk-bearing health plans): Not a listed company, or market value not available
- Kaiser Permanente (Underwriting and risk-bearing health plans): Not a listed company, or market value not available
- Highmark Health (Underwriting and risk-bearing health plans): Not a listed company, or market value not available
- Devoted Health (Underwriting and risk-bearing health plans): Not a listed company, or market value not available
- Blue Shield of California (Underwriting and risk-bearing health plans): Not a listed company, or market value not available
- UnitedHealth Group – Optum Rx (Pharmacy benefit management and cost containment): Not a listed company, or market value not available
- CVS Health Corporation – CVS Caremark (Pharmacy benefit management and cost containment): Not a listed company, or market value not available
- The Cigna Group – Evernorth / Express Scripts (Pharmacy benefit management and cost containment): Not a listed company, or market value not available
- Prime Therapeutics (Pharmacy benefit management and cost containment): Not a listed company, or market value not available
- MedImpact Healthcare Systems (Pharmacy benefit management and cost containment): Not a listed company, or market value not available
- DaVita Inc. – DaVita Integrated Kidney Care (Value-based care and clinical delivery): Not a listed company, or market value not available
- WEX Inc. – Benefits (Member navigation and benefit accounts): Not a listed company, or market value not available
- Amazon.com – Amazon Health Services (Member navigation and benefit accounts): Not a listed company, or market value not available
Source: Market data via Eulerpool where available; shares of revenue from company disclosures, researched by Empor. Data as of 1 Oct 2026.
The figures, and the other charts, in the research dossier →
The first insurance card was a hospital's cash-flow fix
It was 1929, and Baylor University Hospital in Dallas had a problem common to hospitals of the time: patients received care and then could not pay for it. Justin Ford Kimball, a Baylor administrator who had earlier run the Dallas school system, came up with a fix. Local schoolteachers would each pay 50 cents a month in advance, and in return Baylor would cover a defined amount of hospital care if they needed it.8
Look at who designed it. The hospital, not an insurer, created it to stabilize its own cash flow. Prepayment turned unpredictable bad debts into a predictable stream of small payments. The teachers got peace of mind and the hospital got liquidity. The idea spread quickly to other hospitals in the early 1930s, and it became the origin of the Blue Cross tradition: prepaid hospital plans, often nonprofit and closely tied to the hospitals they paid.8
Pooling, explained
Behind Kimball's idea was the oldest logic in insurance. Imagine a neighborhood storm fund. Every household pays a little each month, before anyone knows whose roof will blow off. When the storm hits, the fund pays for the damaged roofs. Most people never collect, and that is the point: they paid for certainty.
The analogy breaks in three ways that shape everything after it. First, medical care is not a rare storm. Many people use some care every year, and chronic illness is ongoing. Second, the price of the repair is not fixed: hospitals and doctors negotiate it, and whoever controls supply has bargaining power. Third, and most important, the "storm" can be partly managed. How care is organized affects how much of it is needed. A storm fund cannot prevent wind. A health plan can, at least in principle, prevent a hospitalization.
That third point gave rise to a different branch of the family.
A surgeon in the desert
In 1933, a young surgeon named Sidney Garfield was treating workers building the Colorado River Aqueduct in the Southern California desert. He had the same problem as Baylor: injured and sick workers, and payments that arrived late or never. Working with Harold Hatch, an insurance agent, he settled on a fixed prepayment. Insurers would pay a set amount per worker per day to cover care, whether or not the worker got sick.9
That change made prevention financially rational. Under fee-for-service medicine, a doctor earns more when patients need more treatment. Under Garfield's fixed payment, a healthy worker was the best outcome for the patient and for the doctor's finances. Garfield started stressing safety and early treatment, because each avoided injury left money in the budget.9
The model moved with the large construction projects. At the Grand Coulee Dam in the late 1930s, Garfield's prepaid care extended to workers' families, and the industrialist Henry Kaiser's companies were the sponsor.9 When Kaiser's shipyards expanded during the Second World War, Garfield built a prepaid medical program for the shipyard workforce.9 Kaiser supplied what the model needed most: a large, steady payroll that could fund prepayment, and enough workers to support doctors and hospitals. In 1945, after the war, the Permanente plan opened to the public, and an industrial experiment became a health system.10
Two models that would keep circling each other
By the end of the war, two answers to the same problem existed side by side. Blue Cross financed care: it pooled payments and paid hospitals. Garfield and Kaiser organized care: they joined payment and delivery so that the people providing care also carried the budget. One treated insurance as a way to pay for care. The other treated organized care as a way to control cost.
It would be tempting to say the integrated model was destined to win. It was not. Fee-for-service medicine stayed dominant for decades because doctors liked their independence, patients liked choice, and the Blue plans were tied to hospitals that preferred being paid per service. Kaiser Permanente grew into a large system, with about $128 billion in revenue in 2025, including its Risant Health business,5 but it stayed geographically concentrated and never became the national template. Integration proved that it could work. It did not prove that it would spread.
Both models had the same weakness: each depended on a large group of people who could be enrolled together and charged together. In the 1940s, the most convenient such group was the workforce of a single employer. Wartime policy was about to make that convenience the norm.
America got its health plan in the factory
Wartime factories needed workers, and they competed for them. The obvious tool was higher pay, but wartime wage controls limited how much employers could raise cash wages. The War Labor Board allowed some fringe benefits, health insurance among them, outside those limits.11 Unable to compete on wages, employers competed on benefits instead.
This was not a deliberate national health policy. It was a side effect of an anti-inflation rule, and it lasted far longer than the war.
How a wartime workaround became a channel
Several later decisions turned the workaround into structure. Unions treated health benefits as a legitimate subject of collective bargaining, and after the war health plans became a standard part of labor contracts.11 The Taft-Hartley Act of 1947 limited union control over welfare funds, which kept administration of benefits closer to employers.11 Then the tax code made the arrangement financially compelling. By 1954, employer contributions to employee health coverage were excluded from workers' taxable income.12 A dollar of health benefit was worth more to an employee than a dollar of taxable wages.
The result is the American system's most distinctive feature: the employer as the main buyer of private health insurance. In the postwar decades, employer coverage became the way most insured Americans got their care paid for.11
That shaped the industry in two lasting ways. First, it gave insurers a wholesale channel. They sold to one company and enrolled thousands of people at once. Distribution, meaning access to the employer's decision, became valuable in its own right. Second, it separated the buyer from the user. The employer chose the plan, the employee used it, and the insurer paid the hospital. That meant everyone had a reason to look past the actual cost of care: the employer saw a premium, the employee saw a deductible, and the hospital saw a negotiated rate.
Critics have long pointed to the costs: workers reluctant to leave jobs for fear of losing coverage, unequal access for people outside large employers, and a market where the people bearing the risk are often not the ones choosing. All of these persist.
ERISA and the quiet move of risk
The next turning point came in 1974. The Employee Retirement Income Security Act, ERISA, set federal standards for employer-sponsored benefit plans.13 It is mostly remembered as a pension law. For health insurance, its biggest effect was quieter: it gave large employers that pay their own claims a single federal framework, largely outside state insurance regulation.
That is the difference between a fully insured plan and a self-funded one. Think of a company holiday party. A fully insured employer buys a fixed-price catering contract: the caterer takes the risk that guests eat more than expected. A self-funded employer buys the ingredients itself and hires someone to run the kitchen. If guests eat more, the employer pays for it.
The analogy stops working because self-funded employers rarely take on all the risk. They buy stop-loss insurance that pays out when an individual's claims or total claims exceed a threshold, and they hire carriers or third-party administrators to process claims under administrative-services-only contracts. The risk is not removed. It is cut up and redistributed.
This matters for anyone trying to follow the money. When a large employer self-funds, the insurer's revenue from that customer is an administrative fee, not a premium, even though the insurer's name is on the member's card. Claims risk sits with the employer. Brokers, consultants, stop-loss carriers and administrators earn fees from structuring the arrangement. The Department of Labor estimates about 135 million participants and beneficiaries in ERISA-covered group health plans in 2023.14 Much of US health risk never shows up as premium on an insurer's income statement.
Congress returned to employer plans in 1996 with HIPAA, which created portability protections and set standards for health data and administrative transactions.13 Standard electronic claims later made it possible to process, analyze and reprice the medical dollar at scale.
The descendants of the employer decision
The employer's purchasing decision created a new set of businesses: advisers who help employers decide. Today the big benefits consultants and brokers include Aon $AON, whose Health Solutions business brought in $3.8 billion in 2025; Marsh McLennan $MMC, whose Mercer unit reported $6.2 billion; Arthur J. Gallagher $AJG, which does not separately disclose its employee-benefits revenue; and Willis Towers Watson $WTW, whose Health, Wealth & Career segment reported $5.3 billion.5 None of them holds medical reserves. They earn commissions and consulting fees by designing plans, running renewals, handling compliance, and telling employers what their claims data means.
Their position depends on relationships, not balance sheets. Clients stay because benefit redesign is complicated and renewal deadlines come every year. For investors, the exposure is diluted: in each case health and benefits is one segment of a larger company, so the parent's share price says little about the health business alone.
The factory channel made the employer the main buyer. It did not make anyone responsible for keeping care cheaper. By the 1970s, rising costs made that gap a political problem, and a Minnesota doctor proposed to fill it.
The insurer learned that prevention could be cheaper than paperwork
By 1970, American health costs were rising fast enough to alarm Washington. Medicare and Medicaid, signed into law by Lyndon Johnson in 1965, had made the federal and state governments permanent large purchasers of care.20 Both mostly paid on a fee-for-service basis, which rewarded volume.
Paul Ellwood Jr., a Minnesota physician who ran a rehabilitation institute, put forward a different idea. He promoted the "health maintenance organization": a plan that would receive a fixed payment per member and be responsible for that member's care, giving the organization a reason to keep people healthy rather than to provide more billable services.15 He took the idea to the Nixon administration, which was looking for a market-friendly answer to rising costs.15 The working example was already operating on the West Coast. Garfield's prepaid group practice, now Kaiser Permanente, was essentially what Ellwood had in mind.
Richard Nixon signed the Health Maintenance Organization Act in 1973, giving federal support and qualification standards to prepaid plans.16
Capitation, explained
The financial engine of the HMO is capitation: a fixed payment per person per month for a defined set of care. Think of it as a household budget. If the family spends less than the budget, it keeps the difference. If an expensive emergency comes up, the family covers it.
The analogy stops working in three places. Quality rules require that care is not withheld to save money, so the budget cannot simply be hoarded. Risk adjustment changes the budget depending on how sick the household is. And catastrophic cases, such as a premature birth or a cancer diagnosis, can cost more than years of monthly payments, which is why capitated organizations buy reinsurance or pass the most extreme risks on to others.
Even with those limits, capitation reversed the incentive that fee-for-service created. That reversal was the whole point.
When the government started buying managed care
The next step brought managed care into Medicare. The Tax Equity and Fiscal Responsibility Act of 1982 created Medicare risk contracts: private plans could receive a fixed payment for each beneficiary and take responsibility for that person's covered care.17 Government money now flowed into private capitated plans.
In 1997 the Balanced Budget Act went further and created Medicare+Choice, effective in 1999, to broaden the private-plan options available to beneficiaries.18 Congress expected the private alternative to grow.
It shrank. The 1997 law also changed how plans were paid, slowing payment growth in many counties. Plans withdrew from markets and enrollment fell in the years around 2000. In a later statement, CMS administrator Tom Scully acknowledged the withdrawals and the damage they did to beneficiaries' confidence.19
This is the first big lesson of government-paid managed care: a payment formula can create a market, and a bad formula can empty it. Demand for private Medicare plans depended less on whether seniors wanted them than on whether the government paid enough for plans to offer attractive benefits and still make a margin.
Congress learned that lesson in the opposite direction. The Medicare Modernization Act of 2003 renamed the program Medicare Advantage, increased payments, and created Medicare Part D, the prescription drug benefit, which took effect in 2006.20 With more generous payment and a new drug benefit administered by private plans, the private side of Medicare began a long expansion. On CMS's annual measure, Medicare Advantage and other private plans grew from about 34% of Medicare enrollment in 2017 to about 48% in 2023.7
The toll booth no one noticed being built
Meanwhile, pharmacy was developing a separate line of descent that would later become one of the most valuable positions in the system.
In 1965, the year Medicare passed, a company called PAID Prescriptions signed what is regarded as the first prescription-benefit contract.21 In 1969, PCS was founded and became one of the first recognizable pharmacy benefit managers.21 Their original job was mundane: process prescription claims for insurers so that pharmacists could be paid and members could pick up drugs with a card instead of paper forms.
The role grew. A company founded in 1979 as Home Health Care of America later became Caremark. Baxter acquired it in 1987, accelerating the electronic claims and pharmacy-management model.21 Medco and Express Scripts grew in the same period. Claims processing led to pharmacy networks: the PBM could choose which pharmacies were in-network and on what terms. Networks led to formularies: the PBM could decide which drugs were covered and at what cost to the member. Formularies led to rebates: drug makers paid PBMs to put their products in favorable positions.
Each step gave the PBM more control over a growing pool of money. When Part D arrived in 2006, private plans and their PBMs gained a large government-funded pharmacy market.20 What had started as paperwork had become a toll booth on the drug dollar, and it was a toll booth the medical-loss-ratio rule, which did not yet exist, would not fully reach.
By the 2000s, private plans managed a large share of government money, PBMs managed the pharmacy dollar, and employers bought most private coverage. What the system still lacked was a set of rules for the individual buyer: the person without an employer plan who could be refused for a preexisting condition. That gap set up the largest rewrite of the rules in half a century.
The law draws a line through every premium dollar
On March 23, 2010, Barack Obama signed the Affordable Care Act.22 Three and a half years later, on October 1, 2013, the online Marketplace opened and people began shopping for coverage that started on January 1, 2014.23 The early weeks of the federal website were famously troubled. The design underneath held up.
The ACA's core idea was to make the individual market work for people insurers had previously avoided. That required several mechanisms that depend on one another. Guaranteed issue meant insurers could no longer refuse applicants or charge them more because of their health. Subsidies made premiums affordable for people with modest incomes, which brought healthier people into the pool. Medicaid expansion covered many low-income adults. And because insurers could no longer avoid sick applicants, the law needed a way to keep them from competing on who could attract the healthiest members.22
Risk adjustment, explained
That way is risk adjustment. Think of it as a handicap system in golf: a plan serving sicker members receives extra money, funded by plans with healthier members, so that a plan is not rewarded simply for attracting healthy people. The goal is to make plans compete on efficiency and service rather than on picking the right customers.
The handicap analogy stops working because the handicap is calculated from diagnosis codes. The more thoroughly a plan's doctors document members' conditions, the sicker the population looks and the more money the plan receives. That creates a lasting tension. Accurate coding is legitimate and necessary. Aggressive coding inflates payments. Audits, benchmarks and coding-intensity adjustments are the government's response, and each change to them moves money between plans. Risk adjustment matters most in Medicare Advantage, where it determines a large share of revenue.
The line through the dollar
The ACA also created the medical-loss-ratio rule described earlier.2 This rule is the central constraint behind the title question.
What it does is clear. It limits the insurer's administrative spread as a share of premium. What it does not do matters just as much. It does not make care affordable: if hospital prices rise 8%, the premium can rise 8%, and the insurer's allowed slice grows in dollars along with it. It does not force providers to accept lower prices. And it creates an awkward incentive. An insurer limited to a percentage of premium has less reason to push premiums down, because a smaller pie means a smaller slice in dollars. That is not proof that insurers act on the incentive, but it explains why critics say the rule protects consumers from overhead without protecting them from cost.
The rule also changed corporate strategy. If the slice is capped as a share of premium, a company can grow in two ways: make the pie larger by enrolling more people, or own businesses whose revenue is not premium at all. The next chapter is about the second route.
Moving risk to the doctors
The ACA also tried to move risk from insurers toward the people delivering care. In December 2011, CMS announced 32 Pioneer accountable care organizations, groups of providers that would take on significant financial risk for Medicare patients' total spending.24 In April 2012, CMS selected the first 27 organizations in the Medicare Shared Savings Program, covering nearly 375,000 beneficiaries.25
The idea was a gentler version of Garfield's model. Instead of full capitation, an accountable care organization would be measured against a spending benchmark. If it spent less while meeting quality standards, it shared in the savings. In the more advanced versions, it also shared in losses.
The early results made the easy story harder to believe. CMS's final evaluation of the Pioneer model found real savings in some years and some organizations, but many participants left the model before it ended, and the evidence for broad savings was mixed.26 Organizations were often happy to share savings and less happy to share losses. The lesson was that moving risk to providers is possible, but providers decide how much of it to accept, and many choose very little.
The individual market, revisited
The Marketplace grew into a large, policy-dependent pool. Enhanced subsidies from the American Rescue Plan in 2021 made coverage cheaper, and enrollment climbed.28 Those enhanced credits expired at the end of 2025.28 For 2026, CMS reported 23.1 million plan selections, close to a record.27
A plan selection is not a paying member. A selection is a choice made during open enrollment. "Effectuated" enrollment counts only people who actually paid their first premium and had coverage take effect. KFF estimated that, after the enhanced subsidies expired, average effectuated enrollment in 2026 could fall toward 17.5 million.28 The gap between those two numbers is a real test of demand. It shows how many people wanted coverage at the subsidized price and how many will actually pay at the new one. It also tests the pool, because the people most likely to drop out when prices rise are often the healthiest.
The ACA settled who could buy and how much of each dollar had to go to care. It left open where everything else could go. The industry's answer, through the 2010s, was to keep buying.
The mergers that turned an insurer into a stack
In late 2018, two deals within a few weeks of each other changed what a health insurer was. CVS Health $CVS, which already owned the Caremark pharmacy benefit manager, completed its purchase of Aetna on November 28 for approximately $78 billion including debt.30 On December 20, Cigna $CI completed its combination with Express Scripts.31 An insurer was no longer just the company paying the hospital bill. It was becoming a stack: insurer, pharmacy manager, pharmacy, clinic, data processor and consumer channel under one owner.
Why buy the adjacent business
The logic follows from the medical-loss-ratio rule. If regulation caps the underwriting spread, look for profit in businesses where the cap works differently. A PBM earns administrative fees, spreads and a share of drug rebates. A clinic earns payments for services. A data and analytics unit earns fees from other insurers and providers. When the insurer pays its own clinic or its own PBM, money that counts as medical spending on the insurer's books can become revenue, and potentially profit, at a sister company.
CVS had begun building its stack earlier. It acquired Caremark in 2007, joining retail pharmacy with pharmacy benefit management.29 UnitedHealth Group $UNH built the largest version through Optum, which combines a PBM, care delivery, data services and analytics alongside the UnitedHealthcare insurer. Optum Rx alone reported $155 billion of revenue in 2025.5 Cigna's Evernorth unit, built around Express Scripts, reported $235 billion, about 85% of the whole company's revenue.5
That last figure shows how far the stack can flip the identity of a company. By revenue, Cigna is now mostly a pharmacy and health-services business that also runs an insurer.
The case against
The opposing argument is serious and should be stated just as plainly. Vertical integration may not lower total medical cost at all. It may simply move revenue between subsidiaries, so that money that leaves the insurer as "medical spending" comes back to the parent as PBM or clinic income. If so, the loss-ratio rule has been met on paper while the group's overall margin stays where it was. Integration also concentrates bargaining power, which draws antitrust and transparency scrutiny.
The limits of scale were already visible in 2017, when federal regulators blocked two horizontal deals, Aetna with Humana and Anthem with Cigna.21 Insurers could not easily get bigger by buying each other, so they grew vertically instead.
The pharmacy layer attracted the most attention. In 2020 the Supreme Court held in Rutledge that ERISA did not preempt an Arkansas law regulating PBMs, which strengthened states' authority to regulate them.21 In 2022 the Federal Trade Commission deepened its inquiry into the largest PBMs. Its staff report found that the three largest manage roughly 79% of prescription claims for about 270 million people.34 That is enormous scale, and it is the scale regulators are now examining.
The case for integration is neither proven nor disproven by the public record. Parent companies disclose segment revenue, but not in a way that lets outsiders compare retained rebates, spreads or how much of a negotiated discount reaches the plan sponsor. Optum Rx, CVS Caremark and Express Scripts each run national networks, and none can reliably be ranked above the others on the profit it keeps. Leadership in this layer is contested. What would settle the question is segment-level disclosure of how much each PBM keeps once employers and regulators extract more pass-through terms.
When a mutual buys the Medicare book
Integration can also be undone. In March 2025, Health Care Service Corporation, the largest customer-owned Blue Cross Blue Shield system, completed its acquisition of Cigna's Medicare and CareAllies businesses. Cigna kept its PBM.32 HCSC serves about 27 million members and reported $66.8 billion of revenue in 2025, along with a net loss of about $1.9 billion.33
The deal says a lot about where Cigna saw value. It kept the pharmacy and services business and sold the government underwriting book. A large nonprofit mutual, which does not answer to public shareholders, took on the Medicare risk. HCSC's 2025 loss shows that the business it bought is no easy source of profit for whoever owns it.
The technology insurers
While the incumbents grew vertically, newcomers bet that better software could beat the old insurance model. Oscar Health $OSCR was founded in 2012 by Joshua Kushner, Mario Schlosser and Kevin Nazemi, with the ACA's new individual market as its main opportunity.35 It promised a consumer-friendly insurer built on technology: easy enrollment, virtual care, clean member experience.
Oscar went public in March 2021.36 Its filings at the time described years of losses and a heavy dependence on the individual market and on risk-adjustment transfers.36 That is the core test for every digital insurer: an elegant app does not change the arithmetic of claims, provider prices and risk transfers. By 2025, Oscar had about 3.0 million members and $11.7 billion of revenue, but still reported a net margin of −3.8%.5 In the first half of 2026 the picture improved: its medical-loss ratio was 79.2% in the June quarter and quarterly revenue was up 70.5% on a year earlier.5 Whether that is a lasting change or a favorable year in a disrupted Marketplace is not yet clear. The answer depends heavily on how many 2026 plan selections become paying members.
In Medicare Advantage, newer entrants made similar bets. Alignment Healthcare built a senior-focused plan around local provider relationships. Clover Health used software to support primary care. Devoted Health, which is private, grew fast among complex seniors. Each is small next to the incumbents, but they test whether specialization can beat scale.
The formula, again
Policy can still change everything in this business within a few months. In January 2026, CMS's advance notice for 2027 Medicare Advantage projected average payment growth of only about 0.09%.37 In April, the final announcement set it at 2.48%.38 For comparison, CMS had finalized a 5.06% average increase for 2026.39 The gap between the January proposal and the April decision moved billions of dollars of expected revenue, and it came from a regulator, not from any plan's execution.
By the mid-2020s, the stack was built, the newcomers were in place, and the government formula was still setting the price of the largest pools. To see who actually keeps the money, follow a single dollar through the stack.
Who keeps the money when the premium arrives
Start with an employer's renewal dollar.
It goes first through a benefits consultant or broker, who helps design the plan, runs the renewal and earns a commission or fee. It then reaches the insurer, either as a premium (fully insured) or, in a self-funded plan, as an administrative fee alongside claims payments funded by the employer. The insurer pays the hospital and the doctors at negotiated rates. The pharmacy part of the dollar goes through a PBM, which pays the pharmacy and collects rebates from drug makers. A slice may go to a physician group that has accepted a fixed payment to manage a population. Some of the employee's own money sits in a health savings account administered by a specialist company that earns fees and interest.
Each stop is a business with different economics. Follow the layers in order.
Distribution: access without reserves
Brokers and consultants earn money by controlling access to the employer's decision, and they hold no medical reserves. Willis Towers Watson is the clearest public example, because it discloses a margin for its Health, Wealth & Career segment. Readings of its second-quarter 2026 report differ, with adjusted margins ranging from roughly 19.5% to 24.1%, depending on the measure used.40 On either figure, the margin is far above what insurers earn on premium. That one number cannot be extended to Aon, Mercer or Gallagher, which do not disclose comparable health-only margins. WTW's segment revenue also fell 9% in 2025,5 which is a reminder that a high margin does not guarantee growth.
Digital brokers show the other end of distribution. eHealth and GoHealth sell individual and Medicare plans online. GoHealth's revenue fell 54.8% in 2025, and its market value on 1 October 2026 was about $9.7 million.5 The idea that digital channels would displace human advisers has, so far, run into commission cuts, high acquisition costs and products complex enough that buyers still want a person. The record narrows that idea sharply.
Underwriting: scale, mix and the loss ratio
This is the largest layer by far: Empor's ten listed underwriters had combined revenue of about $1.7 trillion in 2025.5
UnitedHealth leads on scale: $448 billion of 2025 revenue, about 77% of it from health insurance businesses as Empor defines them, and 48.5 million health-plan members.5 CVS's Aetna and Elevance Health $ELV, a Blue-licensed insurer with large commercial and Medicaid books and 44.9 million medical members, are the next broad-scale public platforms.5 Scale gives UnitedHealth bargaining reach, data and the ability to spread fixed costs. It has not protected the company from medical costs: UnitedHealth's 2025 operating margin was 4.2%, half its 2022 level, and its market value fell from about $480 billion at the end of 2022 to $340 billion on 1 October 2026.5
Humana $HUM is the most concentrated large public Medicare Advantage business. About 95% of its revenue comes from insurance, and it had 7.2 million Medicare Advantage members at mid-2026.5 Its June-quarter benefit ratio was 91.2%, the highest of the large national plans, against 86.7% at UnitedHealth.5 A few points of loss ratio across more than $120 billion of premium make an enormous difference to profit.
Medicare Advantage share data show how quickly positions can change, and why the measuring date matters. In CMS's December contract data, UnitedHealth's share of Medicare Advantage enrollment rose from about 27.6% at the end of 2024 to about 28.9% at the end of 2025, while Humana's fell from about 18.0% to about 16.4%.7 Then the 2026 enrollment season reversed that direction. KFF reported that from March 2025 to March 2026, UnitedHealth lost nearly 647,000 Medicare Advantage members while Humana gained roughly 1.3 million.6 Humana's revenue was up 26.2% in the June 2026 quarter.5 Leadership in Medicare Advantage is clear on size, with UnitedHealth still the largest, and contested on direction. Whether Humana's growth is profitable will depend on loss ratios through 2026, not on the members it gained.
Two different measures of Medicare Advantage penetration are in circulation, and they should not be mixed. CMS's monthly data put Medicare Advantage and other private plans at 51.1% of all Medicare beneficiaries in June 2026.7 KFF reported 55% in March 2026, using as its base only beneficiaries eligible to enroll, meaning those with both Parts A and B.6 Both are accurate. They answer different questions.
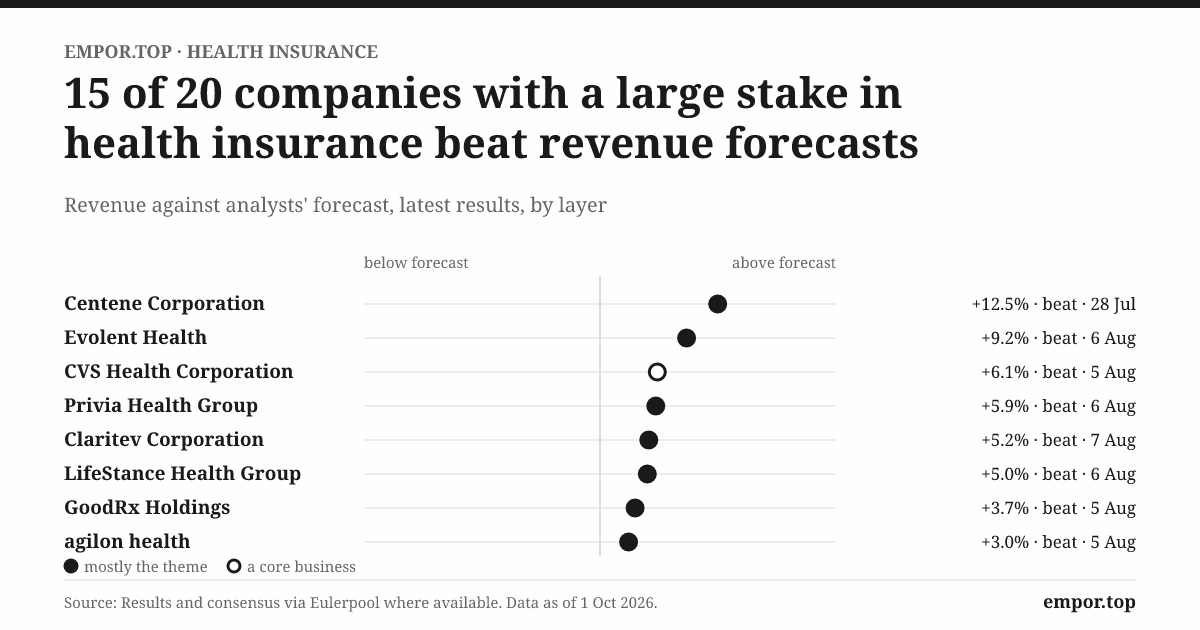
The government-program specialists show how volatile this layer can be. Centene $CNC, the largest Medicaid managed-care company with about 12.1 million Medicaid members, posted a 2025 net margin of −3.4%.5 Molina Healthcare $MOH, a smaller Medicaid, Medicare and Marketplace specialist, had a 92.2% medical-loss ratio in the June 2026 quarter.5 Both depend on states setting rates that keep pace with how sick their members are, and after pandemic-era enrollment protections ended, the members who remained were on average sicker.
The private, nonprofit side tells the same story. Highmark Health, a Blue system with its own hospital network, reported a small loss on $32.4 billion of revenue.5 Owners who do not need to report profits to shareholders still could not escape medical-cost pressure.
Cigna shows a different approach. Its 15.1% return on equity in the latest period was the highest of the large public plans, and its shares traded at about 12 times earnings.5
Pharmacy and cost containment: the toll booth under review
The three big PBMs, Optum Rx, CVS Caremark and Express Scripts, handle most claims. Alongside them are Prime Therapeutics, owned by Blue plans, and MedImpact, a private independent PBM. Smaller listed businesses go around the system: GoodRx offers consumers cash prices on prescriptions, and Claritev reprices medical claims for payers. GoodRx produced an 18.6% free-cash-flow margin in the latest quarter,5 but it does not control the insured pharmacy pool. It works at the edges.
The question in this layer is not size. It is how much rebate, spread and purchasing value the PBMs keep after employers demand more pass-through and regulators demand transparency. Public disclosures do not answer it.
Clinical risk: the doctors who take the bet
Astrana Health $ASTH is the clearest public example of a physician network that takes on insurance-like risk. About 95% of its 2025 revenue came from capitation and risk-pool settlements, it serves about 1.5 million patients in value-based arrangements, and it works with roughly 20,000 clinicians.425 Privia Health aggregates independent physicians and had about 1.6 million value-based attributed lives, but a much smaller share of its revenue is at risk.5 On risk-bearing scale, Astrana leads. On attributed lives with little capital, the two are close.
agilon health shows the danger. It accepted full Medicare Advantage risk for physician partners, grew quickly, then lost money and cut membership. It ended June 2026 with 549,000 members after a 2025 net margin of −6.8%.5 Its medical margin improved in the second quarter, but a single quarter does not reverse years of losses. Taking on risk can move volatility from the insurer to the doctor without removing it.
Specialists are moving in as well. DaVita's Integrated Kidney Care unit manages kidney patients under shared-savings and risk arrangements and reports billions of dollars of medical costs under management.43 LifeStance Health $LFST, a behavioral-health provider with about 8,500 clinicians, improved its operating margin to 7.0% in the June quarter.5 It provides clinical capacity that plans and risk-bearing groups need but often cannot find.
Benefit accounts and navigation: fees without risk
HealthEquity $HQY has some of the cleanest economics in the whole universe. It administers 17.8 million health savings and benefit accounts holding $37.9 billion of assets.41 Its operating margin reached 24.6% and its free-cash-flow margin 34.7% in its fiscal year to January 2026.5 It takes no medical risk. It earns fees, interchange and, importantly, interest on custodial balances, which means part of its earnings depends on interest rates rather than health care. WEX's Benefits business competes in the same market.
Other navigation businesses struggled more. Progyny $PGNY, which manages fertility benefits for employers, remained profitable and said it was moving toward offering a fully insured product. Teladoc Health $TDOC, a virtual-care provider that is not an insurer, saw revenue decline. Alight, a benefits administrator, wrote down much of its value. Amazon $AMZN has built pharmacy, virtual care and One Medical clinics, but it does not disclose their economics, so there is no evidence yet that Amazon earns insurance-like returns. It is better described as a possible channel than a participant.
What is actually scarce
Walk the whole chain and one capability matters most: lowering the medical cost of a population without losing its members or its doctors. The brokers do not need it. HealthEquity does not need it. Everyone in between does, and few have shown they can do it reliably.
Growth is moving downstream, but risk is moving with it
Picture a physician group signing a Medicare Advantage risk contract. Each month it will receive a fixed amount per patient. It has gained a share of the upside, and it has also taken on part of the insurer's job.
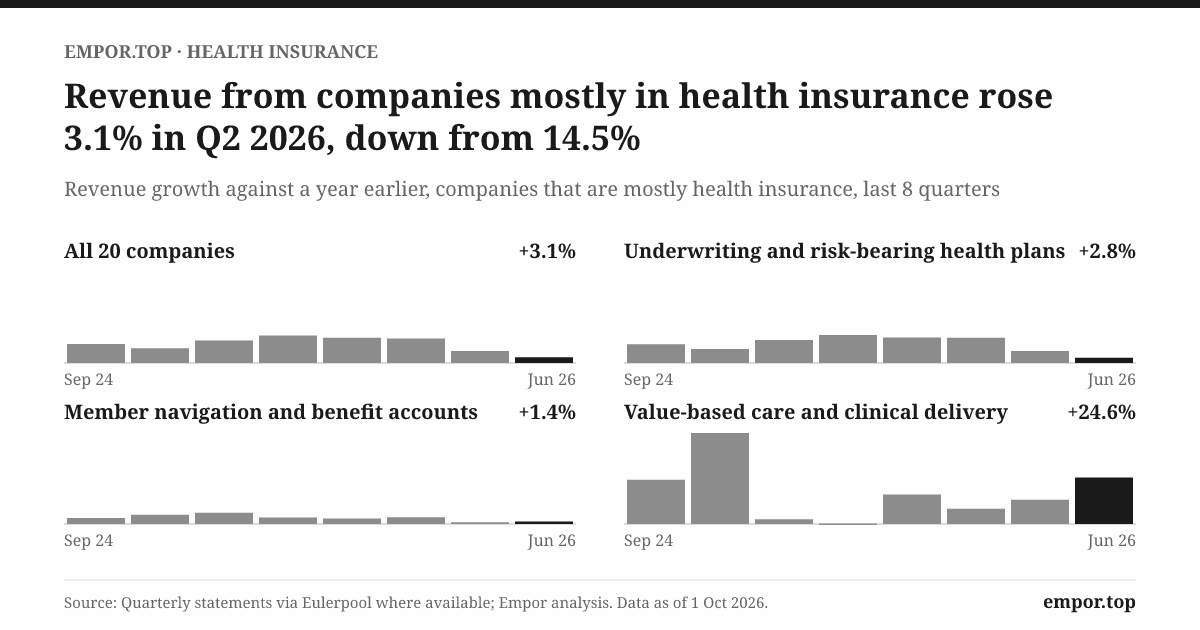
This trade is happening across the industry. In Empor's data, revenue of the value-based care layer grew 24.6% in the June 2026 quarter, more than five times the 4.5% growth of the underwriting layer.5 Growth is moving downstream, toward the people who deliver care.
So is risk. The value-based care layer's combined operating margin was 1.9% in the same quarter.5 It grew fast and earned little. That is consistent with a business taking on risk ahead of scale, and also with one that is simply absorbing insurers' volatility.
Do the layers move together?
Empor tested how moves in one part of the system reach the others, using up to seven years of quarterly results. The results are a pattern, not a law.
Payer revenue and PBM revenue rise and fall together with little delay. That makes sense: more covered lives means more prescriptions processed. Value-based care revenue follows payer revenue more loosely, and the strongest relationship appears about four quarters later, which fits the time it takes for plans to sign contracts and for members to be attributed to physician groups.5 Benefit-account and navigation revenue follows payer revenue loosely with about a two-quarter lag.
The most widely held assumption, that medical-cost inflation hurts insurers' margins a quarter later, is not supported by the data. The medical care services price index rose about 3% in the year to the June 2026 quarter.44 Across ten listed underwriters, Empor found no consistent link between that inflation and net margins a quarter later. Only three of ten companies showed the expected pattern, and Cigna's margins actually moved in the same direction as inflation.5 Repricing at renewal, risk adjustment, member mix and company-specific execution all get in the way of a simple story. A national price index is also a poor stand-in for any one insurer's claims trend.
Some companies break the pattern in revealing ways. Astrana's operating margin rose rather than fell with medical inflation. Its rapid growth and acquisitions appear to outweigh the general industry signal.5 Unemployment produced a split you would expect: Centene's revenue tended to rise when unemployment rose, consistent with Medicaid enrollment growing in downturns, while CVS's revenue tended to slow, consistent with lost commercial membership.5 A few years of results moving together are evidence, not proof. Policy changes, acquisitions and pricing resets often happen at the same time as the driver being tested.
Beliefs that need narrowing
Four popular beliefs do not hold up well against the record.
The first is that more Medicare Advantage members mean more profit. Humana's 2026 membership surge came with a 91.2% benefit ratio and a June-quarter net margin of 1.7%.5 Growth adds value only if the loss ratio on the new members holds. Enrollment growth is the easy part to measure and the easy part to buy, through richer benefits.
The second is that vertical integration creates savings. The evidence remains unsettled; the FTC's scrutiny and employers' growing demands for transparency keep the question open.34
The third is that value-based care produces high margins. The Pioneer results were mixed.26 agilon's losses and pruning, and the value-based layer's 1.9% margin, narrow the claim further. Risk-bearing care can work. It works at thin margins, and only for organizations with enough patients and clinical discipline.
The fourth is that higher health spending benefits every layer. Private insurance spending continued to rise in 2024.1 In the same year, the listed underwriters' combined operating margin slipped, and in 2025 it nearly halved.5 The extra dollars went somewhere. A good share went to whoever supplied the care and the drugs.
Two directions
The optimistic version runs like this. Better data, more clinical capacity and well-run risk contracts reduce avoidable hospital stays and duplicate tests. Lower utilization creates a medical margin that plans and physician groups share. The loss-ratio rule then works as intended: the insurer earns a fair slice of a pie whose growth is slowing, and the organizations that produced the savings earn the rest.
The pessimistic version runs the other way. Hospitals and specialists use their local bargaining power. Specialty drugs and new obesity treatments grow faster than plans can price for them. CMS compresses payment growth or tightens risk adjustment. PBM reforms take away retained rebates. Employers self-fund and keep the savings for themselves. Subsidy cuts push healthier members out of the Marketplace. In that world, money flows toward suppliers, administrators and members, and away from everyone holding the risk in between.
Neither version has won. The next year of evidence will start to show which direction the industry is moving.
The next winner will be the one that can prove the saving
October and November 2026 bring the third-quarter results season. UnitedHealth reports on October 13, Elevance and Molina on October 21, Centene on October 27, Cigna on October 29, CVS on November 4, Humana on November 6 and Oscar on November 9.5 At the same time, plans are setting 2027 benefits under the rates CMS finalized in April, employers are signing renewals, and the Marketplace is heading into its second year without the enhanced subsidies. Investors want to know which moves first, medical costs or prices.
Five signals will move before revenue does.
Five signals
The medical-loss ratio. It measures how much of each premium dollar went to claims and quality improvement in a quarter. It moves early because claims show up within weeks, while premiums reset only at renewal or when the government changes rates. It settles the main disagreement: are medical costs stabilizing before prices catch up, or still running ahead? Companies publish it every quarter. The latest readings for the June 2026 quarter were 86.7% at UnitedHealth, 87.4% at CVS, 89.7% at Elevance and 91.2% at Humana.5 Two quarters of stable or falling ratios would support the case that the industry is recovering from the 2025 cost shock. Three quarters of rising ratios without matching rate increases would undermine it.
Medicare Advantage enrollment by parent company. It measures who is winning seniors, and how quickly. It moves before revenue because enrollment is decided in the autumn and paid for over the following year. It settles whether specialists like Humana are gaining profitable share or buying growth with benefits that will not last. CMS publishes enrollment monthly, and KFF analyzes it each year. In the latest KFF reading, UnitedHealth lost nearly 647,000 members and Humana gained roughly 1.3 million between March 2025 and March 2026.6 The case strengthens if gains continue alongside stable loss ratios. It weakens if enrollment contracts broadly or plans repeatedly exit service areas.
CMS payment and risk-adjustment updates. These set the price of the largest private pool. They move first because each year's advance notice and final rate come months before plans file bids. They settle whether government pricing will cover medical-cost trend. CMS publishes them each winter and spring. The final 2027 increase was 2.48%, after an advance estimate of about 0.09%.3738 CMS's September outlook projected lower average Medicare Advantage premiums and about 34 million enrollees in 2027, which suggests plans largely stayed in their markets.4 The case is confirmed if rates cover cost trend and plans keep their service areas. It weakens if payment growth falls behind costs for several cycles.
Effectuated Marketplace enrollment. It measures how many people actually pay for individual coverage, as opposed to choosing it. It moves early because nonpayment shows up within months of open enrollment. It settles whether the individual market can hold after the enhanced subsidies, and whether the members who leave are mostly healthy ones. CMS publishes effectuated enrollment periodically during the year, and KFF analyzes it. The 2026 selection-to-payment gap is the test.2728 If selections convert into paid coverage, the pool is holding. If the gap widens and loss ratios rise, it is deteriorating.
Risk-bearing lives with medical margin. It measures whether physician groups can take on insurance economics and profit from them. It moves before revenue because contracts and attribution are agreed in advance, and medical margin shows up quarterly. It settles whether value-based care is a profit pool or only a transfer of volatility. Companies report it quarterly. Astrana and agilon provide the current test.5 If lives and margin grow together through two annual contract cycles, the case is confirmed. If growth again requires cutting membership or produces losses, it is not.
The answer
So who makes money when health insurance margins are capped by law?
Insurers still do. But premium collection itself is a thin-spread business. The more reliable profits sit where the cap does not reach in the same way: distribution, pharmacy negotiation, benefit administration and integrated care. Physician groups and specialists can join them when they take on risk and prove savings.
The winners of the next decade will not be those with the most members or the biggest premiums. They will be the ones that can show, with numbers outsiders can check, that they lowered the total cost of care and kept part of the saving.
Glossary
- Premium: The payment for coverage, made before any claims or administrative costs are paid.
- Medical loss ratio: The share of premium spent on clinical care and quality improvement. Federal rules generally require 80% or 85%, depending on the market.
- Risk adjustment: A payment system that gives plans more money for sicker members and less for healthier ones, based largely on diagnosis codes.
- Capitation: A fixed payment per member for a set period and range of care. The organization receiving it keeps savings and bears overruns.
- Health maintenance organization: A managed-care plan built around a network, prepaid care and management of how care is used.
- Medicare Advantage: Private Medicare coverage, paid largely through risk-adjusted government capitation.
- Medicaid managed care: State Medicaid coverage delivered through contracted private or nonprofit plans.
- Pharmacy benefit manager: An intermediary that manages drug formularies, pharmacy networks, rebates and prescription claims.
- Self-funded plan: Employer coverage in which the employer pays its own medical claims and usually hires an administrator.
- Administrative-services-only: A contract under which a carrier processes claims for a fee without taking on insurance risk.
- Stop-loss: Insurance that protects a self-funded employer from unusually large individual or total claims.
- Shared savings: A contract that lets a care organization keep part of any spending below a benchmark, provided it meets quality standards.
- Attributed life: A member assigned to a physician or care organization for performance measurement and financial settlement.
- Effectuated enrollment: Marketplace coverage the member has actually paid for, as opposed to a plan selection.
- Health savings account: A tax-advantaged account paired with an eligible high-deductible plan. Administrators earn fees and interest on the balances.
References
-
National Health Expenditure Data: Historical — Centers for Medicare & Medicaid Services ↩↩
-
Medical Loss Ratio — Centers for Medicare & Medicaid Services ↩↩
-
Medicare Advantage and Medicare Prescription Drug Programs Expected to Remain Stable in 2027 — CMS, 28 September 2026 ↩↩
-
Empor computed tables: health insurance pulse, scorecard, trends, links and results calendar — Empor, 1 October 2026 ↩↩↩↩↩↩↩↩↩↩↩↩↩↩↩↩↩↩↩↩↩↩↩↩↩↩↩↩↩↩↩↩↩↩↩↩↩↩
-
Medicare Advantage in 2026: Enrollment Update and Key Trends — KFF, 5 June 2026 ↩↩↩
-
Baylor University's legacy in medicine through education and innovation — Baylor University, 2025 ↩↩
-
Sidney Garfield: pioneer of modern health care — Kaiser Permanente ↩↩↩↩
-
Opening the Permanente plan to the public — Kaiser Permanente ↩
-
Origins and Evolution of Employment-Based Health Benefits — National Academies Press via NCBI ↩↩↩↩
-
Instructions for Form 1040, 1954 — Internal Revenue Service ↩
-
2026 Report to Congress: Annual Report on Self-Insured Group Health Plans — US Department of Labor, 2026 ↩
-
Honoring health care visionary Paul M. Ellwood Jr. — Health Affairs Forefront ↩↩
-
Statement on Signing the Health Maintenance Organization Act of 1973 — The American Presidency Project ↩
-
Federal Payment Methodology for Medicare Health Plans — CMS ↩
-
Statement of Tom Scully, Administrator, Centers for Medicare & Medicaid Services — CMS ↩
-
History of pharmacy benefit managers — JAMA Health Forum ↩↩↩↩↩
-
Affordable Care Act helps 32 health systems improve care for patients — CMS, 19 December 2011 ↩
-
First Accountable Care Organizations under the Medicare Shared Savings Program — CMS, 10 April 2012 ↩
-
Pioneer ACO Model Final Evaluation Report — CMS Innovation Center ↩↩
-
Exchange coverage remains near record high: 23.1 million enroll for 2026 — CMS, 2026 ↩↩
-
What we know so far about 2026 ACA Marketplace enrollment, premiums and deductibles — KFF, 2026 ↩↩↩↩
-
CVS Health completes acquisition of Aetna — CVS Health, 28 November 2018 ↩
-
Cigna completes combination with Express Scripts — The Cigna Group, 20 December 2018 ↩
-
HCSC completes acquisition of Cigna's Medicare businesses — Health Care Service Corporation, 19 March 2025 ↩
-
Pharmacy Benefit Managers: The Powerful Middlemen — Federal Trade Commission staff report ↩↩
-
Oscar Health 2021 Form 10-K — US Securities and Exchange Commission ↩↩
-
CMS finalizes 2027 Medicare Advantage and Part D payment policies — CMS, 6 April 2026 ↩↩
-
CMS finalizes 2026 payment policy updates for Medicare Advantage and Part D — CMS ↩
-
WTW reports second quarter 2026 earnings — WTW, 30 July 2026 ↩
-
HealthEquity delivers record Q4 and standout fiscal 2026 — HealthEquity, 2026 ↩
-
Astrana Health 2025 Form 10-K — US Securities and Exchange Commission ↩
-
DaVita 2025 Form 10-K — US Securities and Exchange Commission ↩
-
Consumer Price Index: Medical Care Services (CUSR0000SAM2) — FRED, Federal Reserve Bank of St. Louis ↩
 LinkedIn
 WhatsApp
 Reddit
 Hacker News
 Email
Email Kindle
 RSS Feed
 Spotify
 Apple Podcasts
 Amazon Music
 Audible
 YouTube