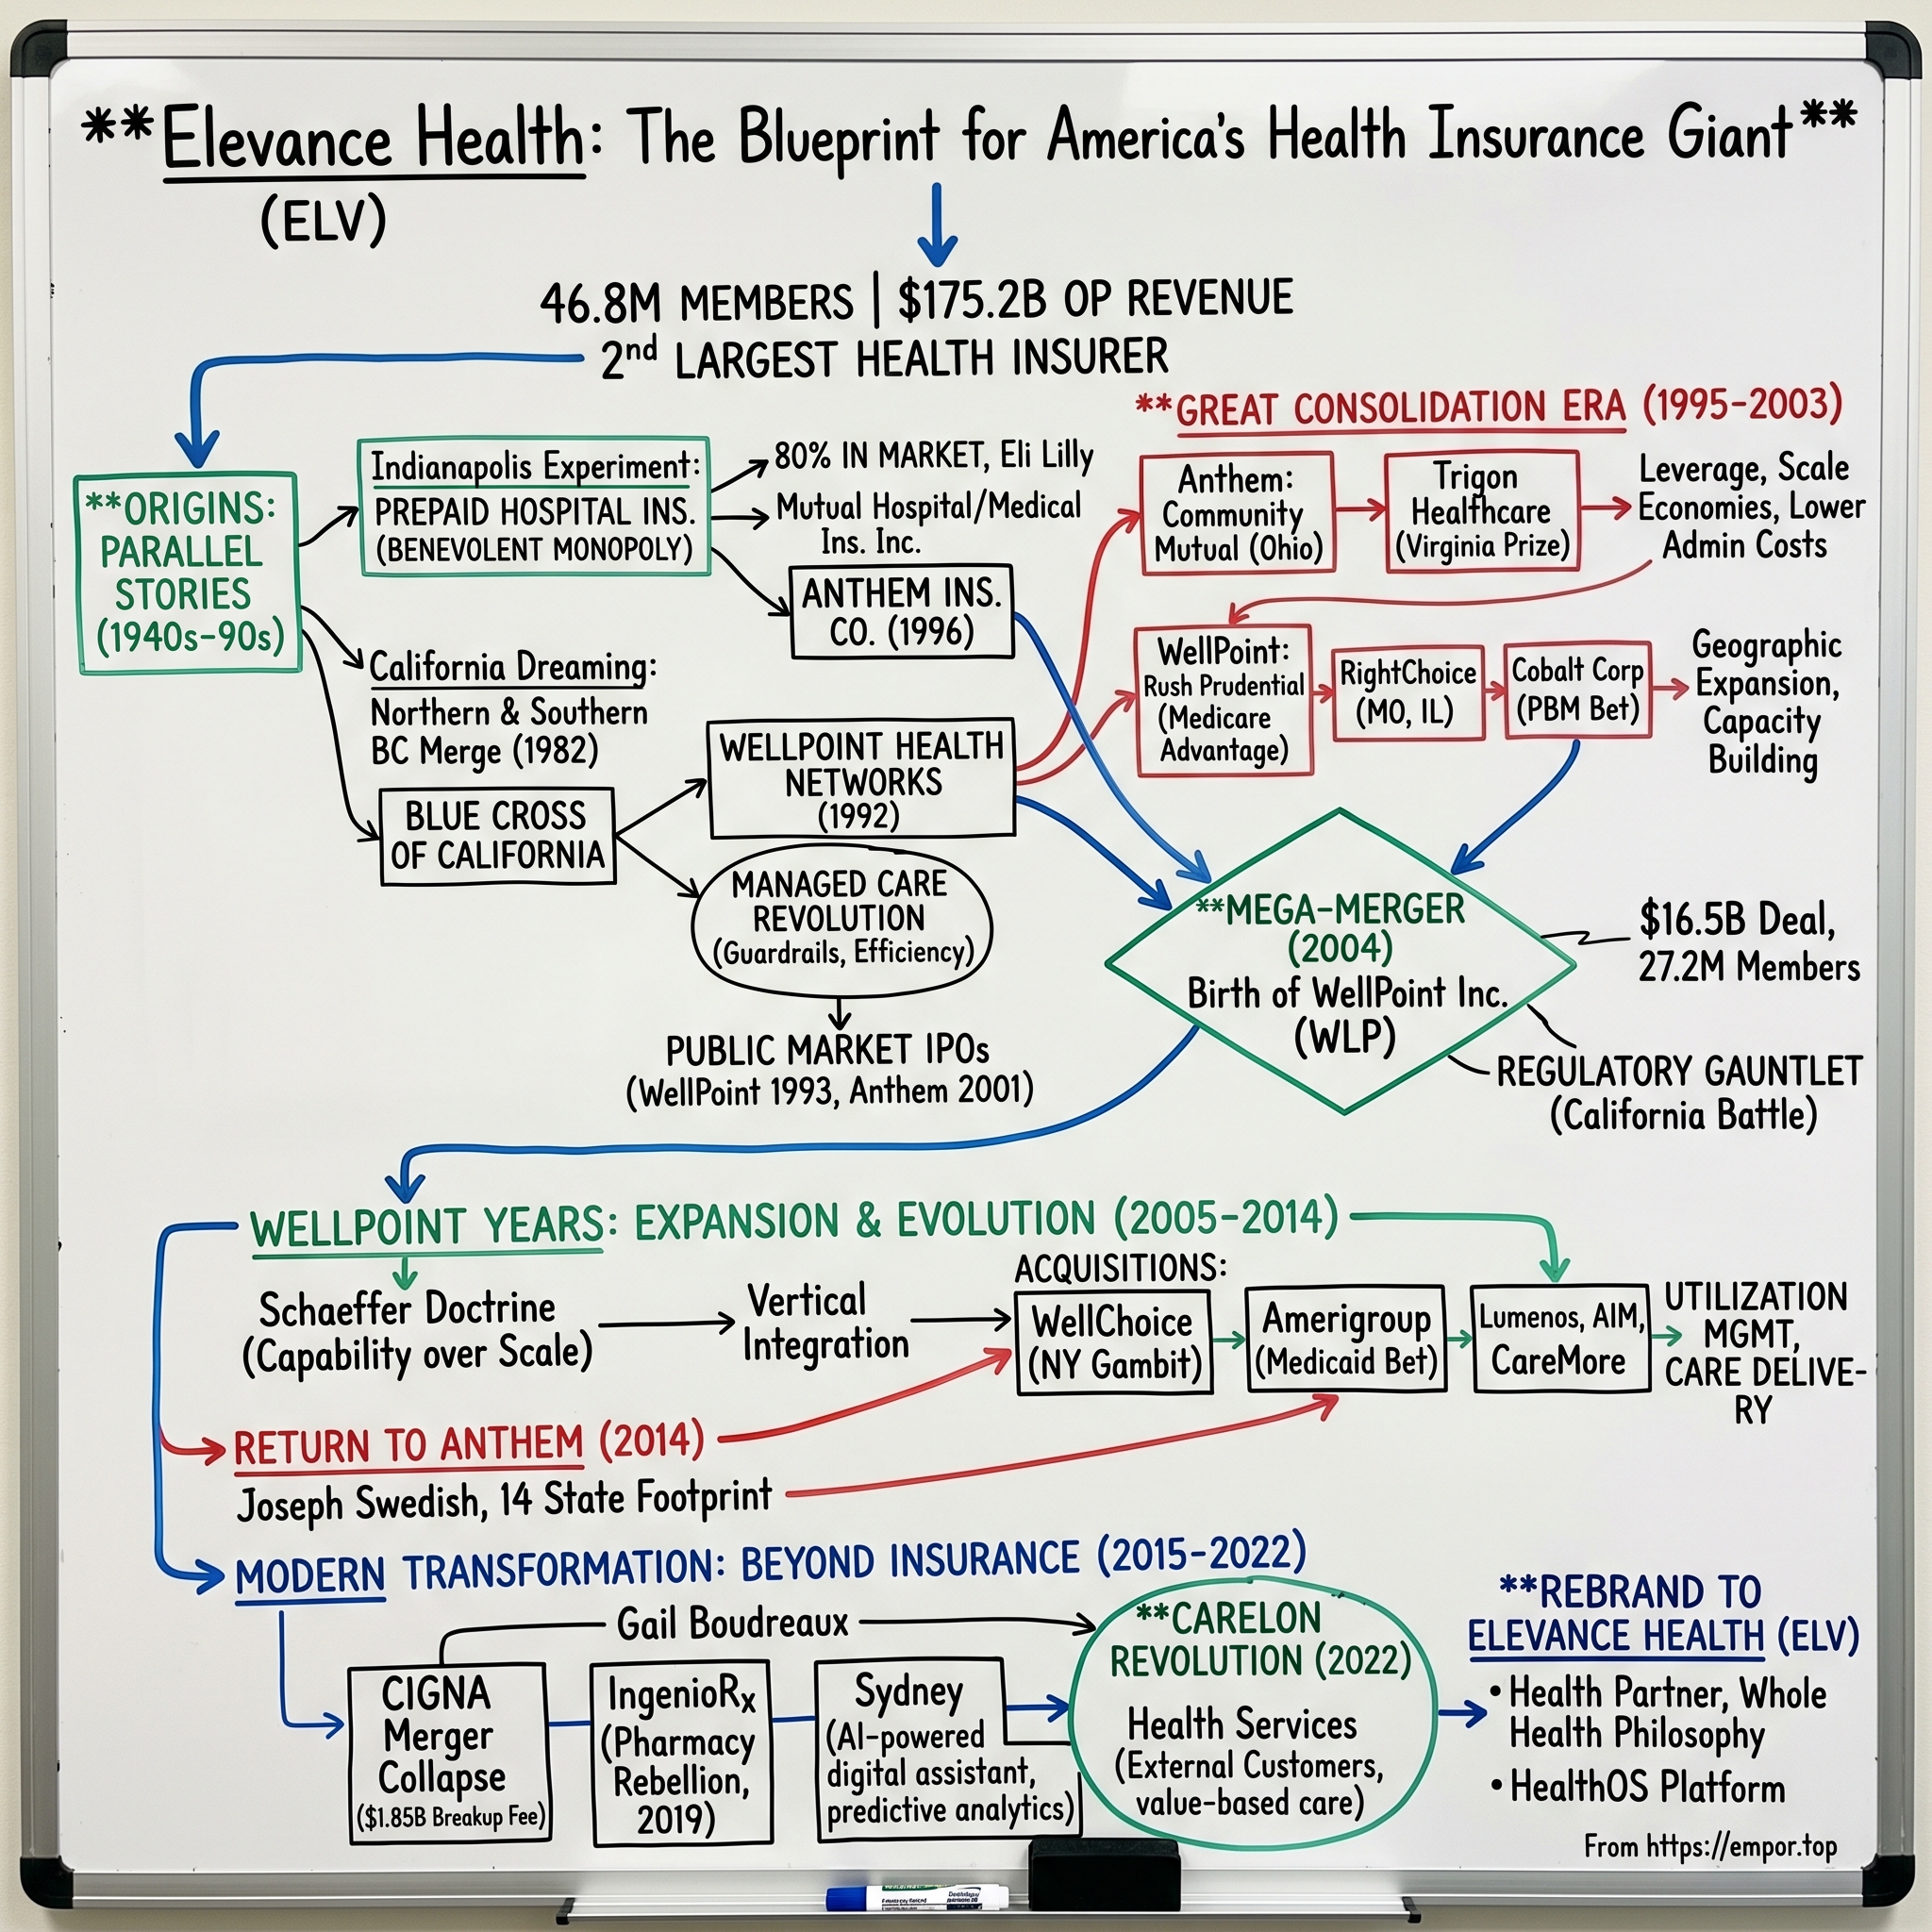
Elevance Health: The Blueprint for America's Health Insurance Giant
I. Introduction & Episode Roadmap
Consider a financial scale that is difficult to grasp at first glance. Elevance Health, which trades on the New York Stock Exchange under the ticker ELV, reported roughly $197.6 billion in operating revenue for fiscal 2025 and covered about 46.8 million medical members.[^1] Placed alongside national populations, its membership roll would sit between Spain and Argentina. Measured against gross domestic product, its revenue would rank among the world's top fifty economies. Yet outside the healthcare industry, few consumers recognize the corporate name, and the brand printed on most of those 46.8 million insurance cards is not Elevance at all—it is Blue Cross Blue Shield, a logo established during the Great Depression by hospitals seeking reliable payment.
That gap between the corporate entity and the consumer-facing brand represents the company's central structural feature. Elevance is the largest for-profit licensee within the Blue Cross Blue Shield Association, holding exclusive rights to market Blue-branded health plans across 15 states.1 Exclusivity is the defining element: across Indiana, Ohio, Virginia, California, New York, Georgia, Kentucky, and its other licensed territories, no competing insurer can sell a health plan under the Blue Cross Blue Shield mark. Together, these licensed territories encompass roughly a third of the U.S. population, with Elevance covering approximately one in ten Americans.
This competitive moat was neither invented in a greenfield venture nor won in open competition. Elevance inherited the structure, then spent three decades consolidating it piece by piece, converting and acquiring non-profit Blue plans from Ohio in 1995 to Louisiana in 2024.[^3] In strategic terms, it functions as a classic cornered resource—a durable asset protected by exclusive territorial rights.
This model creates a central strategic tension. Under one perspective, Elevance operates much like a regulated utility in the guise of a growth enterprise. Because the Affordable Care Act caps the portion of premium revenue an insurer can retain, the core underwriting business remains structurally constrained to mid-single-digit operating margins regardless of operational execution. Under this view, the stock functions primarily as a cash-return vehicle relying on share repurchases, dividend growth, and manageable medical cost trends.
Under an alternative perspective, the insurance licenses serve primarily as customer-acquisition channels, while the primary profit engine becomes Carelon. Assembled by Elevance since 2019, Carelon brings health services and pharmacy management in-house, echoing the strategy UnitedHealth built with Optum. Because Optum drives high profitability and has sustained UnitedHealth's valuation premium over industry peers for a decade, Carelon's ability to replicate even a portion of that model would fundamentally alter Elevance's earnings trajectory.
As of September 2026, empirical evidence has not yet resolved this debate, and recent operational performance presents challenges to the bullish thesis. These challenges are highlighted by the October 2024 guidance reduction, which eliminated roughly $4 in expected earnings per share in a single day, and by a benefit expense ratio that subsequently climbed to 90.0%.[^1] 2
The narrative roadmap traces this evolution in detail. It begins with the dual origins of two distinct Blue lineages in Indianapolis and California that developed on opposite coasts with contrasting corporate cultures. It details the consolidation decade when both entities recognized that health insurance depends on local market density, followed by the 2004 merger that combined them, the failed 2015 mega-merger attempt that strained corporate credibility, and the 2017 leadership transition that shifted focus away from large-scale health plan acquisitions. The analysis then examines the underlying business model—how revenue flows, why the medical loss ratio serves as the critical operational metric, and how Carelon generates its economics. Finally, it evaluates management's track record against historical performance, assesses the competitive landscape and key operational risks, and identifies the core metrics that determine the investment thesis.
 Subscribe on LinkedIn
II. The Dual Origins: Non-Profit Roots to Public Roll-Ups (1930s–1990s)
In 1929, Justin Ford Kimball, an administrator at Baylor University Hospital in Dallas, noticed that his institution faced mounting unpaid bills while local schoolteachers, who had steady salaries but limited savings, were deferring medical care. His solution was straightforward: teachers paid 50 cents a month in exchange for up to 21 days of hospital care at Baylor. The program functioned as a prepayment mechanism rather than actuarial insurance—a hospital selling prepaid service contracts to local workers. Within several years, the model spread nationwide under the Blue Cross symbol, and by 1939 physician groups had created a parallel structure for doctors' services under the Blue Shield emblem.
This origin established the structural dynamics of the health insurance industry. Blue Cross was not created by financiers seeking underwriting spreads; it was established by healthcare providers seeking predictable revenue streams. Consequently, early Blue plans operated as non-profit, tax-exempt entities organized by geographic territory without head-to-head competition. They relied on community rating, charging every subscriber in a region the same premium regardless of individual health status. While socially inclusive, community rating became commercially unsustainable when commercial insurers entered the market with experience-rated policies that offered lower premiums to healthier groups. Commercial carriers drew low-risk populations, leaving the Blue plans with higher-risk members. This adverse selection squeeze over four decades eventually drove regional Blue plans toward corporate conversion, market consolidation, and public capital markets.
Stream one: Indianapolis. In 1946, Indiana chartered two separate entities: Mutual Hospital Insurance Inc. and Mutual Medical Insurance Inc., representing the state's Blue Cross and Blue Shield operations, respectively. Operating with limited direct competition, the combined entity secured roughly 80% of the Indiana market by the 1970s. The organization renamed itself The Associated Group in 1985, and in 1996 completed a legal transformation by demutualizing and converting into a for-profit entity named Anthem Insurance Company.
This corporate conversion proved pivotal to the company's expansion. A mutual insurer owned by policyholders cannot issue common stock, use equity as acquisition currency, or access public capital markets to fund growth. A for-profit stock company can leverage all three tools. On November 2, 2001, Anthem completed its initial public offering on the New York Stock Exchange, raising approximately $1.73 billion in one of the decade's largest insurance IPOs. The transaction was guided by L. Ben Lytle, who led the demutualization, and Larry Glasscock, a former banker who succeeded Lytle as chief executive with a focus on disciplined operational integration. Glasscock recognized that other state Blue plans faced similar adverse selection pressures, that many would eventually require capital and scale, and that Anthem could serve as a primary consolidator.
Stream two: California. The West Coast lineage followed a different trajectory. Blue Cross of Northern California, founded in 1936, and Blue Cross of Southern California, founded in 1937, merged in 1982 to create a single statewide plan. In 1992, under chief executive Leonard Schaeffer—a former administrator of the Health Care Financing Administration, the federal predecessor to the Centers for Medicare & Medicaid Services—the plan carved out its managed care operations into a commercial subsidiary called WellPoint Health Networks. WellPoint completed its initial public offering in 1993.
WellPoint operated with a distinctly different corporate culture than Anthem. While Anthem focused on traditional claims administration, WellPoint pursued an aggressive managed care strategy featuring health maintenance organizations (HMOs), preferred provider organizations (PPOs), narrow provider networks, and assertive rate negotiations with hospitals. Operating in California's highly competitive 1990s managed care environment, WellPoint prioritized cost control and network discipline.
These corporate evolutions were catalyzed by broader regulatory and structural shifts, beginning with the Health Maintenance Organization Act of 1973, which provided federal subsidies and legitimacy to managed care organizations. During the 1990s, the industry adopted capitation models—paying providers a fixed per-member, per-month fee regardless of service volume. Capitation shifted insurers from passive claims processors into financial gatekeepers with direct economic incentives to manage utilization. This transition established the operational power of modern health payors while creating ongoing regulatory and political oversight—setting the stage for the eventual combination of the Indiana and California organizations.
III. The Great Regional Consolidation Era (1995–2003)
By the late 1990s, the Blue Cross Blue Shield Association's annual meetings brought together several dozen independent plans bound by a shared brand and prohibited from competing within each other's territories. Many of these regional non-profits faced mounting financial pressure as reserve requirements climbed and administrative technology spending escalated. Having completed its for-profit conversion, Anthem occupied a distinct position, equipped with public capital and an aggressive acquisition strategy.
Anthem's expansion began in 1995 with the acquisition of Community Mutual Insurance, Ohio's Blue plan, which added approximately 1.9 million policyholders. The geographic rationale was straightforward: Ohio bordered Indiana, hospital networks overlapped along state boundaries, and claims platforms offered opportunities for integration. Between 1999 and 2000, Anthem executed a similar sequence across New England and the Rocky Mountains, acquiring regional Blue plans in Connecticut, New Hampshire, Maine, and Colorado. Collectively, these transactions established an operational template: identify subscale Blue plans facing capital or technology constraints, fund a local charitable foundation to satisfy demutualization requirements, absorb the territorial license, and consolidate back-office operations.
The transaction that validated this model at scale arrived in 2002, when Anthem acquired Trigon Healthcare—Virginia's Blue Cross Blue Shield plan—for approximately $4.04 billion. Priced at roughly 1.4 times trailing revenue, the valuation reflected the strategic asset Anthem was securing: an exclusive, perpetual, geographically defined right to market Blue-branded health plans across Virginia. Because the Association prohibits issuing competing licenses within established territories, no rival could duplicate this franchise. Following the Trigon acquisition, Anthem's membership reached 11.9 million.
Concurrently, Leonard Schaeffer pursued a parallel expansion at WellPoint across the West and Midwest, adopting a faster, more opportunistic approach that extended beyond Blue licenses. WellPoint acquired Rush Prudential Health Plans in Illinois for $204 million in 2001, followed by RightChoice Managed Care—Missouri's Blue plan—for roughly $1.5 billion in 2002. In 2003, WellPoint added Golden West Dental alongside Cobalt Corp, the Blue plan for Wisconsin.
This rapid consolidation generated economic value primarily through local market density rather than broad national economies of scale in underwriting. In commercial health insurance, local density serves as the primary driver of pricing power. Hospitals operate with high fixed costs tied to facilities, equipment, and clinical staffing, making patient volume essential to profitability. If an insurer controls 15% of insured lives in a metropolitan area, a health system can comfortably reject unfavorable contract terms. If that insurer's share reaches 40%, refusing a contract creates a severe volume deficit that competing payors cannot easily offset. Consequently, higher market concentration enables insurers to negotiate larger unit-cost discounts from healthcare providers—often estimated in dominant markets at mid-single to low-double-digit reductions off standard rates, though exact figures remain proprietary.
Lower provider unit costs allow an insurer to price premiums below regional competitors while preserving operating margins. Lower premiums attract additional members, which deepens local market share and yields further bargaining leverage over healthcare providers. This self-reinforcing flywheel operates strictly at the local level; high market density in Indianapolis offers no pricing advantage in Phoenix. Consequently, consolidation required a targeted regional strategy, making the Blue Cross Blue Shield Association's exclusive territorial licenses uniquely valuable.
Secondary cost benefits accrued through fixed-cost leverage, as claims processing platforms, compliance frameworks, actuarial teams, and IT infrastructure were distributed across an expanding member base. By 2003, both Anthem and WellPoint had acquired most available standalone Blue plans in their target regions, leaving one logical next step for further scale.
IV. The Mega-Merger: Creating WellPoint Inc. (2004)
On October 27, 2003, Anthem announced an agreement to acquire WellPoint Health Networks in a cash-and-stock transaction valued at approximately $16.5 billion. The combination created the largest health insurer in the United States, covering roughly 26 million members. Under the deal terms, WellPoint shareholders received $23.80 in cash plus one Anthem share for each WellPoint share. The governance structure reflected a compromise between near-equals: Larry Glasscock served as chief executive of the combined entity, while Leonard Schaeffer assumed the role of chairman.
The strategic rationale was straightforward. Anthem held strong market positions across the Midwest, Northeast, and mid-Atlantic, while WellPoint dominated the West, anchored by California—the nation's largest single commercial health insurance market. Because the two organizations operated in distinct geographic territories, the transaction created virtually no overlap in local market density, neutralizing standard federal antitrust concentration concerns.
That absence of federal antitrust friction highlighted a different regulatory risk. California Insurance Commissioner John Garamendi and the state's Department of Managed Health Care challenged the transaction. Their primary objection centered not on market power, but on executive compensation and public benefit—specifically, roughly $600 million in change-of-control payouts, largely consisting of accelerated stock options for WellPoint executives. State regulators argued that because Blue Cross of California had originated as a tax-exempt community asset, its disposition required explicit public benefit commitments for state residents.
The parties resolved the impasse through targeted financial commitments. Anthem and WellPoint agreed to invest $100 million in underserved California communities and allocate an additional $50 million to nursing education and healthcare clinics. The transaction closed on November 30, 2004, with the combined company taking the WellPoint name and trading under the ticker symbol WLP.
This episode illustrated a recurring structural reality in managed care: the binding constraint on health insurance mergers is often political rather than strictly economic. State insurance regulators exercise broad discretionary authority over local operating licenses, and regulatory approval frequently requires community investments. This dynamic would re-emerge two decades later during the company's expansion efforts in Louisiana.
Testing the synergy claim. Mega-mergers routinely promise substantial cost synergies, and WellPoint delivered on its reported financial targets, capturing roughly $150 million in administrative savings in 2005 and scaling past $250 million annually as back-office systems consolidated. However, management's broader assertion—that combining payors yields immediate administrative efficiency and seamless operational integration—faced significant friction in practice.
Operational integration was delayed by fragmented legacy infrastructure. Each acquired Blue plan relied on its own claims-processing engine, membership database, and provider directory. Consolidating these disparate platforms onto unified IT infrastructure required nearly a decade, far exceeding the two- to three-year timeline outlined at announcement. In California, subsequent premium increases led to policyholder attrition and prolonged regulatory friction. A cultural divide also persisted between Indianapolis's cost-conscious, traditional insurance operation and Thousand Oaks's aggressive managed care model forged in California's competitive provider market.
Ultimately, the merger validated its core strategic architecture: combining non-overlapping Blue territories created an unmatched national footprint protected by exclusive licensing rights. Yet the operational synergy trajectory was slower and more complex than presented to investors. This gap highlights an enduring characteristic of the corporate lineage: a strong capacity for strategic positioning alongside a slower cadence in operational execution—a dynamic that remains relevant when evaluating Carelon's long-term integration.
V. The WellPoint Years, ACA Shock, and the Cigna Disaster (2005–2017)
The decade following the 2004 merger split into two distinct phases: a period of targeted acquisitions of higher-value assets, followed by a failed mega-merger that absorbed four years of executive focus and damaged the company's deal-making reputation.
The expansion began in 2005 with the acquisition of WellChoice, the New York Blue plan, for approximately $6.5 billion. The transaction added roughly 4.8 million members and secured the high-revenue New York metropolitan commercial market. In 2011, WellPoint acquired CareMore, a California Medicare Advantage operator that managed chronically ill seniors through specialized neighborhood clinics. CareMore provided intensive preventive care—including transportation to appointments and specialized diabetic services—on the premise that proactive prevention reduces costly hospitalizations. The purchase marked WellPoint's initial foray into care delivery rather than pure care financing, though the company subsequently scaled the model modestly compared to UnitedHealth's Optum, which rapidly expanded its clinical network into tens of thousands of physicians over the same period.
In 2012, WellPoint acquired Amerigroup for approximately $4.9 billion, adding about 4.5 million members. Valued at roughly a quarter of annual revenue, the transaction reflected the market's cautious view of Medicaid managed care as a low-margin, politically sensitive segment. WellPoint pursued the deal on the thesis that the Affordable Care Act's Medicaid expansion would direct millions of new beneficiaries into state-contracted managed care, rewarding payors with established infrastructure. While that strategy drove volume growth for a decade, it also expanded a business whose pricing is set by state legislatures rather than market forces.
In 2014, the company renamed itself Anthem, Inc., adopting the ticker ANTM to align its corporate identity with the widely recognized Blue Cross Blue Shield brand.
The ACA reset. The Affordable Care Act fundamentally altered industry economics by establishing mandatory medical loss ratio (MLR) floors. Insurers were required to spend at least 80% of premium revenue on medical care for individual and small-group plans, and at least 85% for large-group plans, returning any shortfall to policyholders. In practice, federal regulation capped the gross underwriting margin on health insurance.
This statutory cap reshaped corporate strategy across the payor landscape. With margin percentages legally constrained, insurers faced three paths to profit growth: expanding membership to increase overall premium volume, lowering care delivery costs beneath the spending floor, or generating non-premium service revenue exempt from the MLR cap. Major commercial payors responded by acquiring healthcare service providers, shifting the industry beyond traditional insurance underwriting.
Anthem's early experience on the ACA individual exchanges yielded initial losses, leading to rate adjustments and footprint reductions. While misjudging early exchange risk pools occurred across the industry, the miscalculation highlighted a recurring operational vulnerability: forecasting challenges in government-sponsored programs where reimbursement rates are administratively determined and risk pools can shift unexpectedly.
The $54 billion mistake. In July 2015, Anthem agreed to acquire Cigna for approximately $188 per share in cash and stock, valuing the transaction near $54 billion. Announced weeks after Aetna agreed to acquire Humana, the proposed combination was part of an unprecedented consolidation wave among the nation's five largest health insurers.
The strategic rationale centered on Cigna's commercial national accounts franchise and its health services and international operations, which generated revenue outside MLR caps. However, the transaction faced formidable antitrust obstacles. Large multi-state employers relied on a small group of national payors with multi-state provider networks; consolidating that market from five major carriers to four presented a clear antitrust challenge for the U.S. Department of Justice.
Relations between the two merger partners deteriorated publicly during regulatory review. In February 2017, a U.S. District Court blocked the transaction on antitrust grounds. Cigna immediately filed suit in Delaware Chancery Court to terminate the agreement and collect a $1.85 billion reverse termination fee alongside $13 billion to $15 billion in claimed damages. Anthem countersued for approximately $21 billion, alleging that Cigna leadership under Chief Executive David Cordani had intentionally undermined the regulatory approval process.
In August 2020, Vice Chancellor J. Travis Laster of the Delaware Court of Chancery ruled against both parties, finding that while Cigna had breached its obligation to seek regulatory approval, Anthem was not entitled to damages because antitrust opposition would have blocked the merger regardless. Neither company received financial recovery. The Delaware Supreme Court affirmed the decision in May 2021.
Testing the M&A competence claim. Evaluating this record challenges the assumption that leadership possesses superior deal-making judgment. The Cigna transaction highlighted three major institutional failures. First, regulatory risk was predictable, as federal regulators blocked the parallel Aetna-Humana deal on similar competitive grounds. Second, the opportunity cost proved substantial: while Anthem was entangled in litigation from 2015 to 2019, CVS acquired Aetna and Cigna acquired Express Scripts, reordering the competitive landscape while Anthem lacked a major pharmacy benefit manager or health services platform. Third, four years of public litigation between the merger partners reflected significant deal governance breakdowns.
The historical record differentiates between types of acquisitions. While mega-merger execution proved flawed, Anthem consistently executed regional bolt-on acquisitions of Blue licenses across Ohio, Virginia, and New York. This track record demonstrates an organization effective at acquiring and integrating familiar regional health plans, but vulnerable when pursuing large-scale transformative transactions. Future acquisitions above $10 billion—particularly in non-insurance health services—will indicate whether management has addressed these structural limitations.
Four years of strategic paralysis concluded with a leadership transition.
VI. The Rebirth: Gail Boudreaux, IngenioRx, Carelon, and Rebranding (2018–2023)
In November 2017, Anthem's board hired Gail K. Boudreaux, an executive with direct operational experience at the competitor driving the industry's vertical integration trend. Boudreaux had served as CEO of UnitedHealthcare—the health insurance arm of UnitedHealth Group—and previously held senior executive roles at Aetna and Health Care Service Corporation. Having observed Optum's growth alongside UnitedHealthcare, she brought direct insight into the integrated service flywheel Anthem lacked. Colleagues consistently described her operating style as direct, metrics-driven, and focused on execution.
Her initial assessment focused on addressing accumulated execution debt. Anthem had spent four years and substantial legal resources pursuing a payor merger blocked by antitrust regulators, while major competitors built vertically integrated health services businesses generating revenue exempt from medical loss ratio (MLR) caps. Rather than seeking further health plan acquisitions, Anthem needed to construct its own health services platform.
Getting free of Express Scripts. The immediate focus was pharmacy benefit management (PBM). Anthem had outsourced its PBM operations to Express Scripts under a long-term contract. In 2016, Anthem filed suit, alleging that Express Scripts overcharged by approximately $13 billion annually relative to market rates and failed to pass through negotiated manufacturer rebates. Beyond the legal dispute, the underlying conflict was structural: an external PBM captures economics that an insurer, bearing the ultimate pharmacy expense, seeks to retain.
To capture these economics, Anthem launched an in-house PBM, IngenioRx. In 2019, the company terminated its contract with Express Scripts early and migrated members onto its new platform ahead of schedule. However, IngenioRx relied on a strategic partnership with CVS Health, which supplied back-end claims adjudication, technology, and fulfillment infrastructure. While Anthem retained customer relationships, formulary design, and rebate negotiations, CVS managed core operational infrastructure in exchange for service fees.
This arrangement introduced a key qualification to Anthem's vertical integration strategy. By outsourcing core administrative infrastructure to a subsidiary of CVS Health—owner of competing insurer Aetna—Anthem reduced initial execution risk and capital intensity. However, this structure created ongoing operational dependence on a direct rival and introduced vendor fees that fully integrated peers like UnitedHealth's Optum Rx do not incur.
The rebrand and the reorganization. In June 2022, Anthem, Inc. rebranded as Elevance Health, Inc., changing its ticker symbol to ELV. Derived from "elevate" and "advance," the corporate name was designed for holding-company positioning rather than consumer branding, signaling that the parent corporation extended beyond its Blue Cross Blue Shield insurance franchises.
The business reorganized into two operating segments. Health Benefits encompasses the licensed Anthem Blue Cross Blue Shield plans, non-Blue Wellpoint plans, and government-sponsored Medicare and Medicaid businesses. Carelon consolidates non-insurance services, divided between CarelonRx (formerly IngenioRx) and Carelon Services, which absorbed AIM Specialty Health for specialty utilization management, Beacon Health Options for behavioral health, and CareMore for care delivery.
Bolting on capability. In 2023, the company acquired BioPlus, a specialty pharmacy that gave CarelonRx direct capabilities in high-cost specialty medications—a sector where a tiny single-digit percentage of prescriptions accounts for nearly half of total drug spending. In 2024, Elevance acquired Paragon Healthcare, an infusion therapy provider operating in ambulatory centers and home settings. The transaction targeted site-of-care cost differentials, as outpatient hospital infusions frequently carry significant price markups over non-hospital settings.
Elevance also expanded its insurance footprint in 2024 by acquiring Blue Cross Blue Shield of Louisiana, adding approximately 1.9 million members and expanding its licensed territory count to 15 states. The transaction mirrored earlier Blue plan acquisitions: initial opposition from state regulators and local groups forced Elevance to withdraw the proposal, increase its community financial commitments, and resubmit for approval.
Evaluating this strategic shift highlights a persistent scale gap relative to industry leaders. While Carelon's targeted acquisitions of PBM capabilities, specialty pharmacy, and home infusion reflect a coherent vertical integration strategy, they remain modest bolt-on investments compared to Optum's multi-decade expansion, which built an extensive clinical network of tens of thousands of physicians. Elevance has pursued a similar strategic model, but with significantly less deployed capital and a compressed timeline—leaving unresolved whether this incremental approach represents disciplined capital allocation or insufficient scale.
VII. The Business Model: How Elevance Health Makes Money
Strip away the brands and historical complexity, and money moves through Elevance in a mechanically straightforward manner—which is precisely why minor operational shifts produce dramatic swings in corporate earnings.
The Health Benefits engine. Elevance collects premiums from policyholders and pays medical claims to healthcare providers. The fraction of premium revenue consumed by medical claims is the benefit expense ratio, or BER—Elevance's designation for the industry-standard medical loss ratio. The remaining portion must cover all administrative costs: salaries, technology platforms, broker commissions, marketing, taxes, and operating profit. In fiscal 2024, the consolidated BER reached 88.5%, up roughly 150 basis points year over year, before climbing further to 90.0% in fiscal 2025.[^1] 2
This thin margin structure creates significant operating leverage. When roughly 90 cents of every premium dollar covers medical claims and another 6 cents covers administrative expenses, the pre-tax operating margin sits at approximately 4 cents. A 100-basis-point increase in the BER—representing a single additional penny of medical claims per premium dollar—erases roughly a quarter of that pre-tax margin. Consequently, the core underwriting business operates with the thin margins and operating leverage of a commodity refiner, combined with the regulatory oversight of a public utility. This sensitivity explains why managed care equity valuations can shift significantly following a quarterly disclosure of this single metric.
Within Health Benefits, three distinct lines of business operate under the insurance umbrella.
Commercial risk and fee-based. Large employers frequently choose to self-fund their health plans: the employer assumes the direct medical risk, while Elevance provides provider network access, claims processing, care management, and reporting for an administrative fee. Known as Administrative Services Only (ASO), this fee-for-service model carries attractive economics—generating predictable fee revenue without underwriting risk or statutory capital requirements, while operating outside medical loss ratio mandates. However, ASO plans yield significantly lower revenue per member than fully insured plans, explaining why total membership counts and top-line revenue often diverge. In contrast, fully insured commercial plans require Elevance to collect the full premium and absorb the underwriting risk. The shift in mix between fully insured and fee-based members remains a primary driver of underlying margin stability.
Medicare Advantage. Under Medicare Advantage, the Centers for Medicare & Medicaid Services (CMS) pays a fixed monthly capitation rate per member to private plans that assume financial responsibility for beneficiaries' healthcare. Reimbursement rates are risk-adjusted based on member health status and supplemented by quality bonus payments for plans achieving four or more stars under CMS's Star Ratings system. Consequently, Star Ratings function as a critical financial variable rather than a branding metric: a rating drop from four stars to three-and-a-half on a major contract eliminates quality bonus revenue across every enrolled member in that plan.
Medicaid. State agencies contract with managed care organizations to cover low-income populations through negotiated per-member, per-month rates, established periodically through actuarial reviews. The central structural risk of Medicaid managed care stems from administrative rate-setting: reimbursement rates are set in advance based on historical risk profiles. When member eligibility or healthcare utilization shifts rapidly—as occurred during post-pandemic eligibility redeterminations in 2024—state rate adjustments can lag actual medical costs, temporarily depressing underwriting margins.
The Carelon engine. CarelonRx operates as a full-service pharmacy benefit manager (PBM), generating revenue from administrative claim-processing fees, dispensing margins across mail-order and specialty pharmacies, and retained manufacturer rebates. Pharmaceutical manufacturers offer rebates to PBMs to secure favorable placement on drug formularies. The proportion of these rebates retained by the PBM versus passed through to plan sponsors remains subject to intense regulatory scrutiny and legislative reform proposals. Although Elevance states that it passes substantially all negotiated rebates back to its clients, broader PBM industry profitability remains exposed to potential federal statutory changes governing rebate structures.
Carelon Services represents the broader healthcare services division, comprising behavioral health management, utilization review, payment integrity services, and home and ambulatory infusion care. Among these capabilities, payment integrity serves as a major profit driver. Healthcare providers submit complex clinical coding for claims reimbursement; payment integrity platforms audit these claims to detect billing errors, duplicate submissions, unrendered services, or coding inconsistent with clinical records. Given the massive claims volume Elevance processes annually, identifying and correcting billing discrepancies on even a fraction of a percent of claims yields hundreds of millions of dollars in recovered capital. This data-intensive capability represents one of Carelon's most defensible competitive advantages.
The strategic design of Carelon relies on an intercompany services flywheel: Carelon provides health and pharmacy services to Elevance's Health Benefits segment, converting internal operational expenses into segment revenue while simultaneously marketing services to unaffiliated third-party payors. On a consolidated basis, intercompany revenue and expenses eliminate in financial reporting; consequently, economic value accrues to shareholders primarily when Carelon delivers internal services at lower costs than external vendors, or when it expands market share among unaffiliated health plans. In fiscal 2024, Carelon generated approximately $53.9 billion in total revenue with an operating margin of roughly 5.4%, with external customers accounting for more than 20% of total revenue.[^3]
This operating margin highlights Carelon's current position within the healthcare landscape. While UnitedHealth's Optum division has historically achieved operating margins in the mid-to-high single digits, Carelon's 5.4% operating margin remains closer to traditional insurance underwriting margins than to high-margin healthcare services. Demonstrating whether Carelon can expand margins toward peer benchmarks remains a central test of Elevance's vertical integration thesis.
VIII. Executive Leadership, Ownership & Capital Allocation
Gail Boudreaux, who took over as chief executive officer in November 2017, has now led the company for nearly nine years in the effort to bridge that margin gap.
Her tenure splits into two distinct phases. The first, spanning 2017 through 2023, was marked by steady strategic execution: terminating the pursuit of high-risk payor mega-mergers, launching the in-house pharmacy benefit manager ahead of schedule, consolidating non-insurance services under Carelon, rebranding the corporate parent, and delivering consistent earnings growth that drove valuation multiple expansion. The second phase, from 2024 onward, has proven far more challenging, testing a core requirement of any regulated health insurer: the ability to accurately forecast its underlying medical cost base.
Her compensation reflects both the scale of the organization and standard large-cap executive pay practices, totaling approximately $20.47 million in fiscal 2024 and $22.58 million in fiscal 2025, with more than 80% delivered in long-term equity linked to operating revenue growth, adjusted earnings per share growth, and relative total shareholder return.3 Her direct holding represents roughly 0.067% of outstanding shares—significant in absolute financial value, but minimal as a control position.
From a corporate governance perspective, two features of this incentive design draw scrutiny. First, heavily weighting executive pay toward adjusted earnings per share interacts uncomfortably with a capital allocation strategy centered on share repurchases, as buying back stock mechanically elevates earnings per share regardless of underlying net income growth. Second, measuring relative total shareholder return against a managed care peer group provides a forgiving benchmark during sector-wide downturns, enabling target payouts even when absolute shareholder value contracts.
Chief Financial Officer Mark Kaye joined Elevance in November 2023, arriving from Moody's Corporation rather than the healthcare industry.4 While hiring a financial executive with expertise in credit discipline and reporting rigor brought clear advantages, the largest single-day guidance reduction in recent company history occurred within his first year in the role. This sequence permits two interpretations: a newly appointed CFO unencumbered by legacy assumptions may reset financial forecasts more transparently, but may also have been caught unprepared by inherited cost trends.
Capital allocation. Elevance's capital deployment has followed a consistent pattern: directing $2.0 billion to $2.5 billion annually into share repurchases—totaling approximately $2.3 billion across the 2024 to 2025 window—alongside a steadily growing dividend yielding around 1.5%, and targeted service acquisitions rather than major health plan consolidation.[^1]
Whether this approach demonstrates disciplined capital management or strategic hesitation remains an active debate. Share repurchases represent an efficient use of funds when equity trades below intrinsic value and higher-return internal projects are absent. However, repurchases can prove counterproductive if an organization lags behind key competitors in its designated growth engine and requires capital to acquire physician groups, ambulatory surgical centers, and direct care delivery infrastructure. While Elevance returned capital to shareholders, UnitedHealth's Optum extended its lead in care delivery capabilities. Bullish analysts view Elevance's restraint as prudent capital allocation that avoided an overpriced provider market that subsequently triggered substantial industry write-downs. Bearish observers see it as a familiar structural pattern: operational competence in adjacent services paired with caution toward transformative healthcare delivery.
Ultimately, empirical performance has not yet settled the argument, and the resolution will be reflected in Carelon's long-term operating margin trajectory rather than in strategic management statements.
IX. Strategic Frameworks: Helmer's 7 Powers & Porter's 5 Forces
Evaluating Elevance through standard strategic frameworks reveals a central paradox: the company's strongest competitive power is one it played little role in creating.
Cornered Resource — the primary power. The exclusive Blue Cross Blue Shield license across 15 territories functions not as a standard marketing brand, but as a legally enforced, geographically exclusive asset. No amount of capital or operational competence can replicate it because the Blue Cross Blue Shield Association does not issue competing licenses within established state territories. When a small employer in Richmond or Indianapolis shops for health coverage, the Blue plan serves as a default consideration that rival payors cannot purchase their way into.
However, Hamilton Helmer's framework also highlights the structural constraint embedded within this power. Association rules restrict how a licensee operates non-Blue-branded business in territories assigned to other plans, placing a structural cap on geographic expansion. Elevance cannot enter Texas, Illinois, or Michigan with its primary brand, as those territories belong to other licensees. The Cornered Resource acts as both an asset and a boundary: it secures market position across 15 states while largely foreclosing direct expansion into the remaining 35. Consequently, growth must come from deepening market share within existing territories, expanding government-sponsored programs, offering non-Blue Wellpoint-branded plans within permitted limits, or scaling Carelon—a dynamic that explains the company's corporate strategy.
Scale Economies. Local provider network density translates into unit cost advantages in core territories, supplemented by fixed-cost leverage across claims processing and IT infrastructure. This scale advantage is measurable in Elevance's administrative expense ratio relative to smaller regional payors. However, it provides limited differentiation against UnitedHealth Group, which commands comparable or superior national scale.
Switching Costs. For a national employer, switching payors requires re-mapping employee provider networks, re-integrating eligibility and payroll feeds with human resources systems, re-training staff, and managing widespread operational disruption. Consequently, client retention rates in large national accounts remain high across the industry. However, switching costs protect customer retention rather than pricing power. Corporate benefits consultants regularly solicit competitive bids for administrative fees and pharmacy terms during contract renewals, keeping Administrative Services Only (ASO) margins competitive despite stable account retention.
Process Power. Carelon's utilization management and payment integrity capabilities, refined over billions of claims, represent a distinct operational learning curve advantage. The key qualification is that UnitedHealth's Optum operates similar services at larger scale and with a decade-long head start. As a result, Process Power gives Elevance an advantage over regional plans, but not over its primary national competitor.
Notably absent from Elevance's profile are Network Economies, Counter-Positioning, and Branding in Helmer's technical definitions. Elevance does not possess a capability that competitors are business-model constrained from copying; rather, it holds a license that competitors are legally prohibited from acquiring. That protection remains distinct from operational power and carries inherent vulnerability, as it depends on the governance rules of a trade association navigating ongoing antitrust scrutiny of its territorial licensing structure.
Porter's Five Forces. Supplier power represents the dominant force shaping industry economics. Hospital consolidation and the acquisition of physician practices have concentrated provider bargaining leverage, while high-cost specialty pharmaceuticals—such as GLP-1 therapies and multi-million-dollar cell and gene treatments—have elevated medical costs faster than annual premium cycles can adjust. Buyer power is moderate; large corporate employers benchmark administrative fees aggressively, though high switching costs limit outright churn. The threat of new entrants remains exceptionally low, as statutory capital requirements and the necessity of pre-existing provider networks create high barriers to entry, as demonstrated by the failure of VC-backed insurtech startups over the past decade. The threat of substitutes is modest, primarily manifesting as employers shifting to self-funded ASO plans, which removes underwriting risk while retaining administrative service fees. Finally, rivalry among major national payors is intense and increasingly concentrated in government-sponsored programs, particularly Medicare Advantage.
The structural verdict reveals a competitive moat that is durable within Elevance's 15 licensed states, yet inherently growth-limiting beyond them. That profile mirrors a regulated utility operating under the expectations of a growth enterprise—returning to the central strategic tension established at the outset.
X. Financial Performance, The 2024 Medicaid Crisis & Disconfirming Stress Test
The morning of October 17, 2024, provided a clear test of Elevance's operational resilience, highlighting which of the company's stated strategic strengths held up under stress.
Operating revenue had expanded steadily in prior years: from roughly $156.6 billion in fiscal 2022 to $171.3 billion in fiscal 2023, reaching $175.2 billion in fiscal 2024 with net income around $6.0 billion, before climbing to $197.6 billion in fiscal 2025.[^1] [^3] On the surface, top-line growth resembled a reliable compounding machine.
However, during the third-quarter 2024 earnings call, management lowered full-year adjusted earnings per share guidance from at least $37.20 to approximately $33.00—an 11% reduction announced with only one quarter remaining in the fiscal year.2 The unexpected cut triggered a sharp decline in Elevance's share price and pulled down valuations across the broader managed care sector.
What actually happened, in plain terms. During the COVID-19 public health emergency, federal regulations prohibited states from disenrolling Medicaid beneficiaries. Consequently, enrollment expanded to include millions of individuals who would ordinarily have cycled off the program—many of them younger, healthier, and less expensive to cover. When emergency protections ended, state agencies began eligibility redeterminations, dropping coverage for those no longer qualified. Disproportionately, healthier members exited the risk pool because they held alternative coverage options or faced less immediate incentive to complete recertification paperwork. Chronically ill beneficiaries, whose ongoing care depended on Medicaid, disproportionately remained enrolled.
As a result, the remaining population carried significantly higher average medical costs than the baseline figures used in state contract pricing. Because state Medicaid reimbursement operates on an administrative lag—typically requiring 12 to 18 months for actuarial and budgetary adjustments to catch up with risk shifts—Elevance remained contractually locked into rates established for a risk pool that no longer existed.
The financial impact was immediate: Medicaid medical cost trends surged to three to five times historical averages, pushing Elevance's consolidated third-quarter benefit expense ratio up 270 basis points year over year to 89.5%.2 For full-year fiscal 2025, the consolidated BER reached 90.0%.[^1]
The falsification pass. Testing four central claims of the bullish investment thesis against Elevance's empirical performance yields clear qualifications.
Claim one: Carelon delivers Optum-like vertical integration economics. Operational evidence narrows this premise. Carelon's roughly 5.4% operating margin sits below Optum's historical mid-to-high single-digit margins. This gap reflects structural differences: CarelonRx relies on CVS Health for back-end claims adjudication, relinquishing margin that Optum Rx retains internally, while Carelon Services focuses heavily on utilization management, behavioral health, and payment integrity rather than direct provider ownership. Carelon remains a viable mid-single-digit margin services provider that limits external cost leakage, but it has not demonstrated performance equivalent to Optum. Demonstrating that parity would require sustaining Carelon's operating margin above 6% alongside a growing share of external revenue.
Claim two: payor scale is defensive against macro and regulatory shocks. The 2024 Medicaid crisis directly challenged this assertion. Scale failed to buffer Elevance against administrative cost pressures; instead, the broad footprint of its Amerigroup Medicaid franchise expanded its exposure to state rate-setting delays. While membership density of over 9 million Medicaid lives across multiple states protects against commercial unit-cost competition, it offers no protection against administered pricing lags. Conflating scale advantages in provider negotiations with resilience against regulatory pricing shifts represents a fundamental oversight in payor analysis.
Claim three: M&A is executed with sound antitrust foresight. As established during the 2015 Cigna transaction, large-scale payor consolidation carries severe regulatory hurdles. The 2024 acquisition of Blue Cross Blue Shield of Louisiana reaffirmed this dynamic on a regional scale, where initial local political resistance forced Elevance to withdraw its application and restructure financial commitments before securing approval. The record indicates a recurring tendency to underestimate political and regulatory friction in healthcare transactions.
Claim four: the Blue license is an unconditional growth asset. This claim requires refinement. The exclusive license guarantees a strong competitive position across 15 designated states, but Association rules simultaneously bar direct Blue-branded expansion into the remaining 35 states.
What management said, and how to read it. During the October 2024 earnings call and in subsequent quarters, management emphasized that the Medicaid acuity shift was an industry-wide challenge, predicting that state reimbursement rates would realign through standard contracting cycles while the company applied enhanced utilization controls. This explanation was factually accurate and corroborated by industry peers. However, factual accuracy does not offset the forecasting failure. The timing of federal Medicaid redeterminations was known well in advance, and the resulting adverse selection was predictable from basic actuarial principles. Reaffirming annual guidance late into the fiscal year before cutting expected earnings per share by roughly $4 revealed clear limitations in government-program forecasting—echoing earlier miscalculations during the initial rollout of the Affordable Care Act's individual exchanges.
Management had previously outlined a long-term target of 12% or higher adjusted EPS growth at its 2024 investor day. The subsequent two years tested whether that growth trajectory could withstand a sustained 90.0% benefit expense ratio. By September 2026, the BER had not returned to the high-80s range required to support management's long-term target.
For investors, the 2024 Medicaid stress test offered a fundamental lesson. Elevance's underlying franchise remained intact, its geographic moat persisted, and cash generation continued. What broke was the assumption of predictable earnings growth. In a business operating with roughly four cents of pre-tax margin on every premium dollar, earnings predictability represents a primary component of equity valuation.
XI. Strategic Risk Radar & Key Forward Investment KPIs
Evaluating Elevance's forward trajectory requires focusing on operational risks with a direct transmission mechanism into its narrow four-cent pre-tax operating margin. Four primary risks demand monitoring.
PBM regulation. Federal proposals to restrict rebate retention, eliminate spread pricing, and mandate fee transparency for pharmacy benefit managers have regularly gained bipartisan support despite legislative delays. The economic mechanism is what matters: if regulations require all rebates to pass through to plan sponsors and mandate explicit administrative fee structures, CarelonRx's revenue model will not disappear, but its margin profile will be fundamentally rewritten. Because Elevance operates both the PBM and the underlying health plans bearing pharmacy costs for most of its volume, the parent company is partially hedged—revenue lost at CarelonRx can re-emerge as lower medical costs within Health Benefits. Consequently, Elevance faces less consolidated risk than a standalone PBM, though its external-client growth narrative for Carelon remains vulnerable.
Medicare Advantage rates and Star Ratings. The Centers for Medicare & Medicaid Services has tightened Star Ratings methodologies and scoring thresholds while moderating benchmark rate growth and phasing in risk-adjustment revisions that reduce payments for specific diagnosis codes. Each shift represents a direct headwind to government segment earnings. Furthermore, because Star Ratings operate on a two-year lag—with payment impacts determined by performance two years prior—operational missteps in quality metrics are locked in long before they affect financial results.
Medical cost inflation. High-cost therapeutics present a structural expense category with little historical precedent. GLP-1 weight-loss medications illustrate the challenge: broad patient eligibility, indefinite usage regimens, and annual gross costs reaching five figures per member. Combined with the post-pandemic recovery in elective procedure volume, hospital consolidation driving up unit costs, and an aging member demographic, the critical strategic question is whether the benefit expense ratio's shift into the 88% to 90% range is cyclical or represents a permanent baseline. Management contends the elevation is cyclical, though that position remains a projection rather than an established outcome.
Medicaid rate lag. The structural mismatch highlighted in 2024 has not been permanently solved; it is being addressed state by state through individual contract negotiations. Any future policy shift that alters the Medicaid risk pool—such as revised eligibility rules, work requirements, or changes to federal matching formulas—could reintroduce a similar timing gap. Likewise, state fiscal pressures that delay actuarially sound rate adjustments would recreate the margin compression experienced in 2024.
The three critical performance metrics. These structural dynamics compress into three operational metrics that determine the long-term investment thesis.
Benefit expense ratio. The consolidated benefit expense ratio summarizes overall operational execution. Investors must monitor whether the ratio trends back toward the 87% to 88% historical range necessary to sustain management's earnings algorithm, or whether it remains near 90%, confirming structural cost inflation. Analyzing segment-level trends—across commercial, Medicare, and Medicaid lines—is essential, as consolidated figures can mask underlying divergences.
Carelon operating margin and external revenue share. This pair of metrics provides the cleanest evaluation of Elevance's vertical integration strategy. A health services division earning mid-single-digit margins while primarily serving its parent company functions largely as an internal cost allocation center. Conversely, expanding operating margins beyond 6% alongside a growing revenue share from unaffiliated third-party payors would demonstrate that Carelon possesses a competitive external franchise rather than a captive customer base.
Commercial membership retention and organic growth in core Blue territories. This metric tests the durability of the company's exclusive licensing rights. Sustained commercial membership and strong national account retention within its 15 licensed states confirm the value of the Blue Cross Blue Shield moat. Conversely, if commercial enrollment contracts while government-sponsored membership expands, Elevance will increasingly resemble a state-contracted payor with heightened regulatory exposure and lower valuation multiples.
Tracking these three metrics isolates the fundamental trajectory of the business from quarterly market noise.
XII. Playbook: Business & Investing Lessons
The monopoly nobody designed. The Blue Cross Blue Shield Association created one of the most durable brand structures in corporate history by establishing an arrangement that would be difficult to replicate today: dividing the nation into exclusive territories and granting each licensee a regional monopoly on the brand. Because the structure predated modern antitrust enforcement and originated as a non-profit, provider-sponsored system, it survived regulatory evolution. The broader investing lesson applies across industries: competitive moats rooted in historical legacy structures that could not be created today are often uniquely durable, precisely because the conditions that produced them no longer exist. Yet investors must look equally hard at what the structure forbids—the same Association rules that protect a designated territory also restrict expansion beyond it.
Regulation as a forcing function. The Affordable Care Act's medical loss ratio floor offers a clear example of regulation reshaping an industry's corporate strategy rather than merely imposing compliance costs. By capping gross underwriting margins on core health plans, statutory spending floors forced major payors to acquire adjacent healthcare service providers. Analyzing any regulated industry requires asking not merely what a rule costs, but how it alters incumbent behavior—because second-order strategic responses often dictate where long-term capital flows.
The asymmetry of government revenue. Medicare Advantage and Medicaid provided payors with expansion opportunities that commercial employer plans could never match: demographically guaranteed, federally funded, and massive in scale. The core asymmetry lies in pricing power: the government customer dictates reimbursement. In commercial markets, payors facing elevated medical claims can raise premiums upon renewal. In government-sponsored programs, insurers submit rate filings and wait for administrative adjustments. Elevance's 2024 Medicaid shortfall demonstrated how quickly that asymmetry can convert a primary growth engine into an earnings headwind when rate updates lag actual medical utilization. The broader lesson for businesses reliant on public payors is that buyer bargaining power must be factored directly into moat evaluations, as administered pricing presents a fundamentally different risk profile than market-driven pricing.
Bolt-ons compound; mega-mergers detonate. The historical record across health insurance remains consistent. Transformational payor deals—such as Anthem's proposed $54 billion purchase of Cigna or Aetna's attempted $37 billion acquisition of Humana—were blocked on antitrust grounds, absorbing years of executive focus and substantial capital. By contrast, targeted regional bolt-ons and capability additions—including CareMore, BioPlus, Paragon, and regional Blue plan conversions—encountered manageable regulatory review while building operational capabilities and member density. The structural driver is straightforward: horizontal payor consolidation directly reduces competition in concentrated markets, triggering antitrust intervention, whereas vertical and adjacent service acquisitions typically face lower regulatory scrutiny. When management in a concentrated sector proposes a large-scale horizontal merger, the historically high base rate of regulatory failure should dominate the strategic evaluation.
Finally, on the difference between architecture and execution. Elevance has repeatedly identified sound strategic architectures—converting to for-profit status, consolidating regional Blue plans, launching an in-house pharmacy benefit manager, and expanding health services under Carelon—yet has consistently executed those initiatives on a slower timeline than peers like UnitedHealth Group. This pattern reflects a specific, observable organizational trait: a strong capacity for durable strategic positioning paired with a slower execution cadence. Investors evaluating management's targets should price that historical cadence into any forecast that assumes the company rapidly closes competitive gaps on schedule.
XIII. Analysis & Bull vs. Bear Case
The bull case. At its strongest, the bullish thesis rests on Elevance's exclusive licensing position across 15 states covering roughly a third of the U.S. population—a moat protected from direct competition. The business generates substantial free cash flow across economic cycles, benefiting from pre-collected premiums. Medicaid margin compression represents a contractual timing delay rather than structural erosion, as states are legally mandated to establish actuarially sound reimbursement rates, allowing repriced contracts to phase in over subsequent renewal cycles. Meanwhile, Carelon continues to expand its external customer base, where every incremental point of margin expansion flows directly onto a temporarily depressed earnings base. Finally, management has consistently returned over $2 billion annually to shareholders through repurchases while the equity trades at a valuation multiple reflecting deep market pessimism.
The bear case. At its strongest, the bearish thesis contends that the benefit expense ratio's rise to 90.0% reflects a permanent structural shift rather than a temporary cycle. This shift is driven by persistent headwinds, including expanding GLP-1 utilization, provider consolidation elevating medical unit costs, and an aging subscriber risk pool. Furthermore, Optum's lead in care delivery appears structurally entrenched, as primary care practices and physician networks have largely been acquired or priced at premium valuations, leaving Carelon concentrated in lower-margin service niches. Potential legislative reform targeting pharmacy benefit managers threatens a key profit pool supporting Carelon's growth narrative, while Star Ratings adjustments and Medicare Advantage benchmark rate pressures squeeze the segment with the strongest secular growth potential.
Reconciling the debate. The two cases are not symmetric, and distinguishing between empirical evidence and strategic assertion clarifies the core investment thesis.
The bull case's strongest empirical pillar is the company's exclusive licensing footprint and durable cash generation—both established operational facts. Its weakest element is the projection of Carelon's margin expansion, which after years of development rests on a 5.4% operating margin against management's target above 6% and peer benchmarks in higher ranges. This claim remains unproven rather than false: while no evidence demonstrates Carelon cannot achieve those targets, clear empirical evidence that it will has not yet materialized.
The bear case's strongest empirical pillar is the demonstrated forecasting vulnerability in government-sponsored programs, evidenced by miscalculations during the initial rollout of individual ACA exchanges and the 2024 Medicaid redeterminations. While this pattern spans multiple leadership iterations and warrants caution regarding administrative pricing guidance, it does not prove a structural inability to underwrite risk. Its weakest element is the assumption that elevated medical cost trends are permanent; historically, cost surges have repeatedly mean-reverted as commercial and Medicare premiums reprice to reflect underlying utilization.
What an activist would attack. An activist investor would likely focus on three operational vulnerabilities. First is portfolio complexity: operating a health insurer, a PBM, a behavioral health provider, a home infusion network, and a utilization management business creates a conglomerate discount, while Carelon's limited segment disclosures make independent valuation difficult. Second is capital allocation: directing billions to share repurchases while trailing key peers in physician network ownership invites criticism that leadership prioritized EPS-friendly metrics over essential care delivery infrastructure. Third is executive accountability: an 11% guidance reduction announced late in the fiscal year represents a forecasting failure that typically prompts governance oversight.
The competitive frame. Compared to UnitedHealth Group, Elevance operates at smaller scale with less vertical integration, yet avoids the intense regulatory and reputational scrutiny associated with owning both medical payment and direct care delivery. Compared to CVS Health and Aetna, Elevance maintains a stronger commercial insurance franchise but lacks a retail footprint, while CarelonRx's reliance on CVS infrastructure creates an uncomfortable vendor dependency. Compared to Cigna and Evernorth, Elevance is more insurance-focused and less PBM-weighted—a limitation during pharmacy growth cycles, but an advantage amid heightened regulatory scrutiny of PBMs. Finally, compared to Humana, Elevance offers significantly broader business diversification, avoiding single-segment exposure to Medicare Advantage policy shifts.
The synthesis. Elevance combines the most defensible commercial insurance franchise among the major national payors with its least differentiated health services arm. Whether that combination presents an attractive investment depends on whether the benefit expense ratio normalizes and Carelon expands its operating margins—outcomes that cannot be determined from external disclosures alone, leaving ongoing evaluation of key operational metrics as the primary gauge of forward progress.
XIV. Epilogue & "If We Were CEOs"
Setting aside retrospective analysis, the core question for leadership in Indianapolis centers on how best to deploy the company's operational hand.
The first strategic move involves acquiring care delivery assets at scale. Carelon's margin ceiling is largely defined by its business mix, and operational excellence in utilization management alone cannot match Optum's economics without direct ownership of physicians and ambulatory surgical centers. While critics point out that the physician practice market has been picked over and repriced—causing several acquirers to record substantial write-downs—that valuation reset may present a more viable entry point than existed in 2021. Reallocating share repurchase capital toward care delivery infrastructure would provide a clear signal of commitment to the vertical integration strategy.
The second priority is unwinding CarelonRx's operational dependency on CVS Health. Building internal pharmacy adjudication and fulfillment infrastructure requires a multi-year capital commitment—a key reason the project has been repeatedly deferred. However, a vertical integration strategy that routes a portion of its underlying economics to a direct competitor's subsidiary remains structurally incomplete, particularly as tightening pharmacy benefit management regulations increase the strategic value of an end-to-end technology stack.
The third initiative requires expanding value-based contracting across the commercial Blue book. Industry risk-sharing models have concentrated primarily in Medicare, where financial incentives are straightforward. While commercial populations are younger, healthier, and more challenging to actively manage, Elevance holds its highest market density within these employer groups. That local density provides the necessary leverage to establish alternative provider contract structures. If the exclusive territorial license functions as a true cornered resource, converting that market power into provider alignment beyond unit-price discounting represents its logical test.
Reflecting on Elevance's eight-decade evolution underscores how much of its competitive advantage was inherited and how much of its recent strategy has focused on overcoming the limits of that legacy. A collection of Depression-era hospital prepayment plans transformed through demutualization, a decade of regional consolidation, a failed mega-merger attempt, and a recent pivot into services into an enterprise handling nearly $200 billion in annual revenue. The Blue Cross Blue Shield license established its foundation. The central question—sharpened by the operational challenges of October 2024—is whether the capabilities Elevance builds in-house will ever prove as valuable as the strategic asset it inherited.
XV. Recent News
[Section reserved for latest earnings releases, CMS rate announcements, and M&A developments.]
XVI. Links & Resources
[Section reserved for top long-form references, filings, and transcript links.]
References
-
Elevance Health Investor Relations Portal — Elevance Health ↩
-
Elevance Health Slashes 2024 EPS Guidance on Medicaid Acuity Mismatch — Healthcare Dive, 2024-10-17 ↩↩↩↩
-
Elevance Health Annual Report & Proxy Statement (Form DEF 14A) — SEC EDGAR, 2025-03-20 ↩
-
Elevance Health SEC Filings & EDGAR Database (CIK: 0001156039) — U.S. Securities and Exchange Commission ↩
-
Anthem Rebrands to Elevance Health to Reflect Services Expansion — Healthcare Dive, 2022-06-28 ↩
-
Anthem and Cigna Call Off $54 Billion Merger After Antitrust Block — Reuters, 2017-05-12 ↩
-
In re Anthem-Cigna Merger Litigation Court Opinion — Delaware Court of Chancery, 2020-08-31 ↩
-
Blue Cross Blue Shield of Louisiana and Elevance Health Complete Combination — Elevance Health Newsroom ↩
-
Elevance Health Carelon Segment Strategy and Financial Performance Overview — Healthcare Dive, 2023-11-15 ↩
 LinkedIn
 WhatsApp
 Reddit
 Hacker News
 Email
Email Kindle
 RSS Feed
 Spotify
 Apple Podcasts
 Amazon Music
 Audible
 YouTube