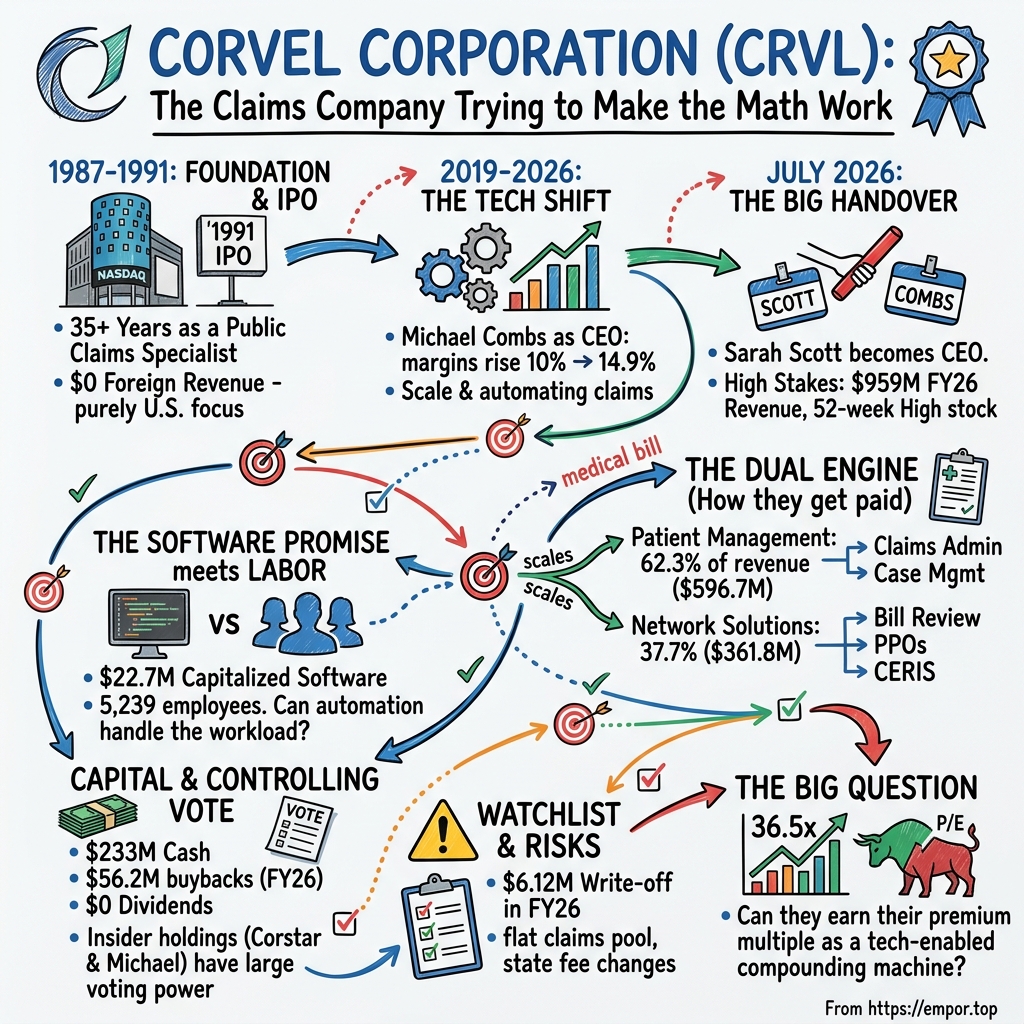
CorVel Corporation: The Claims Company Trying to Make the Math Work
I. The Claims Desk at the Center of a $4.2 Billion Bet
Somewhere in America this morning, a warehouse worker twisted a knee on a loading dock. By lunchtime there was an incident report. By the end of the week there will be an urgent-care bill, maybe an MRI, perhaps a physical therapist, and a question nobody on the dock is thinking about: who decides what that care should cost, who checks the bill, and who makes sure the worker gets better and back to work? For a surprising number of American employers, insurers and public agencies, part of the answer is a company headquartered in Fort Worth, Texas, that most investors have never heard of.
That company is CorVel Corporation. On July 1, 2026, it changed hands at the top. Sarah A. Scott became Chief Executive Officer and President, and Michael G. Combs, who had run the company since 2019, moved up to Executive Chair.3 It was the kind of handover that rarely makes headlines: no activist, no crisis, no outside savior. Scott was promoted from within, Combs stayed in the building, and the board framed the change as continuity. But continuity of what, exactly, is the question this story has to answer.
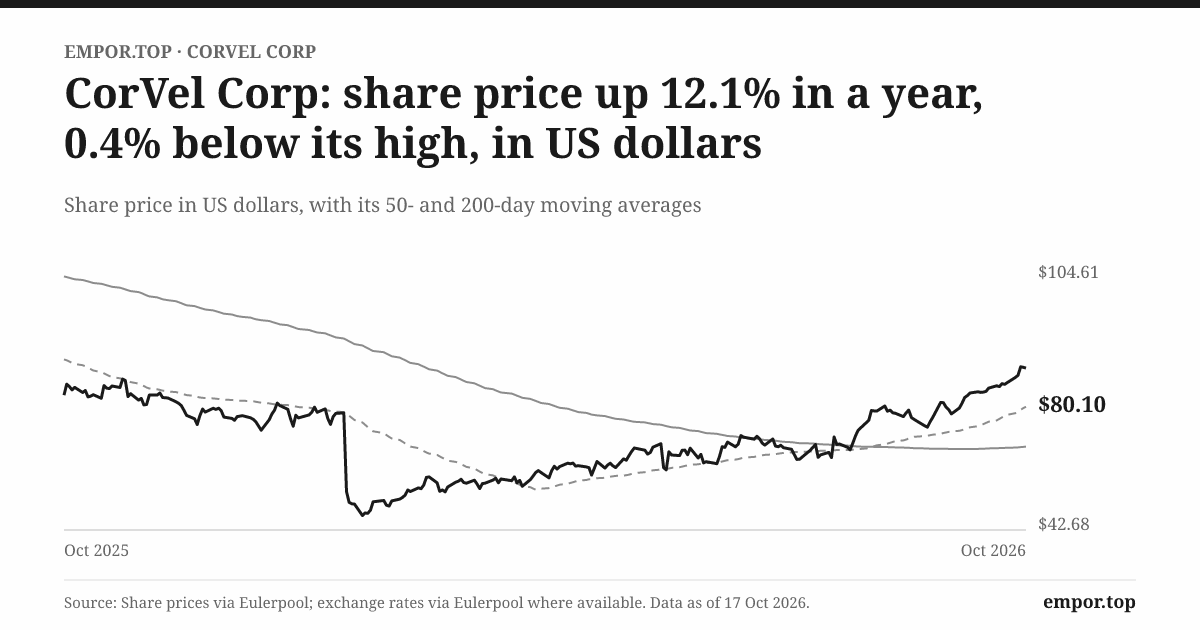
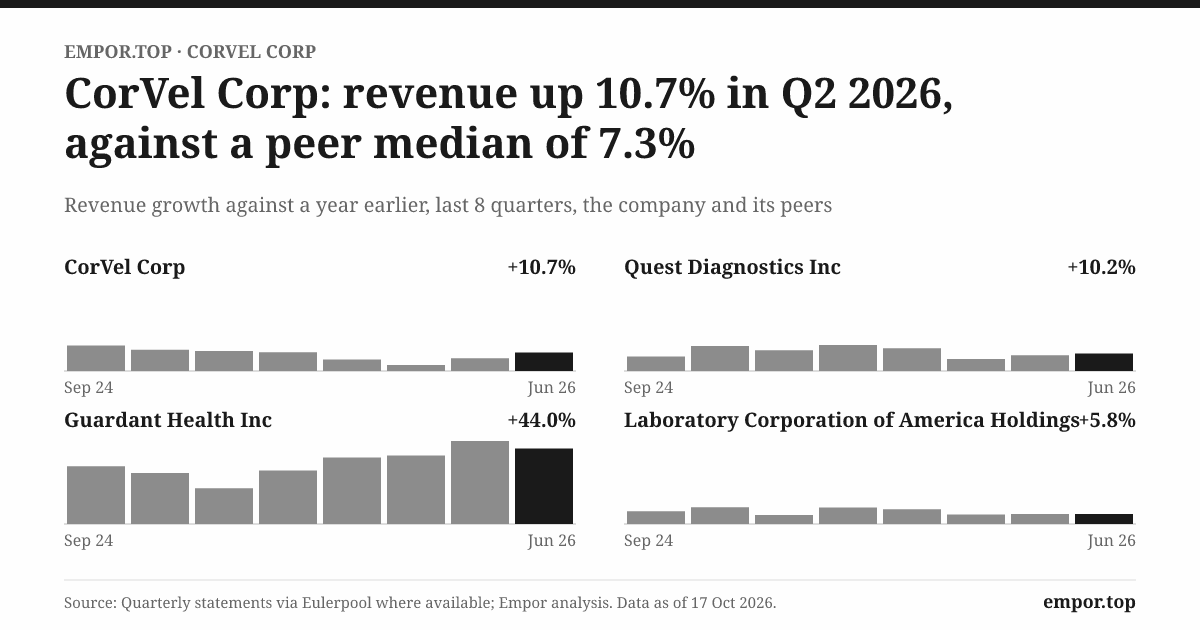
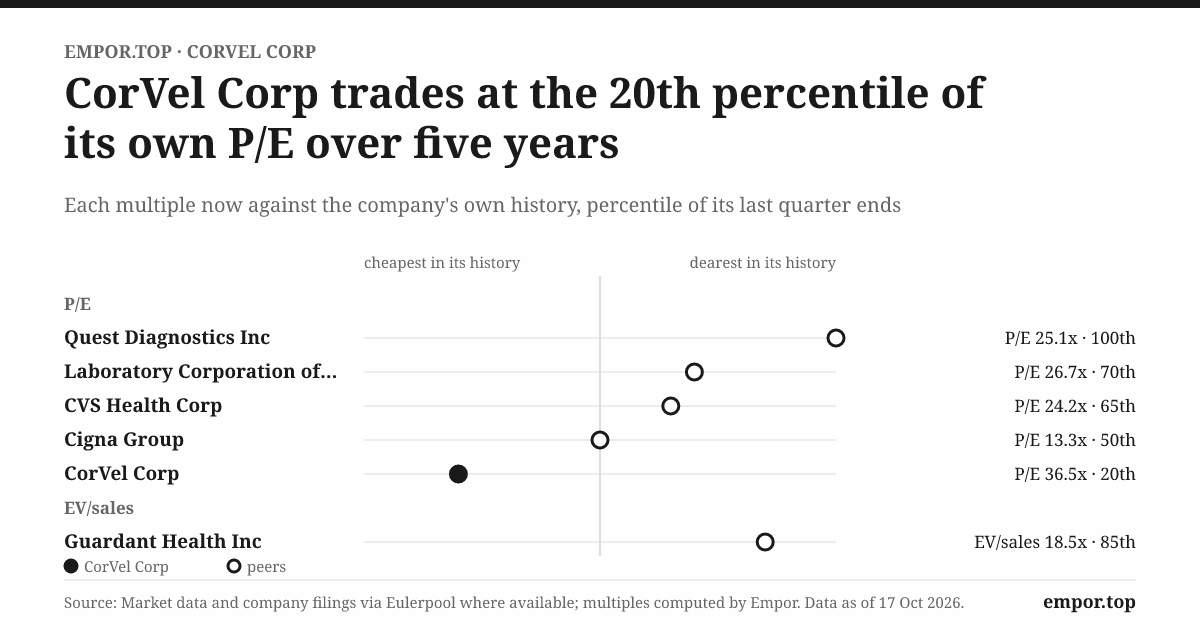
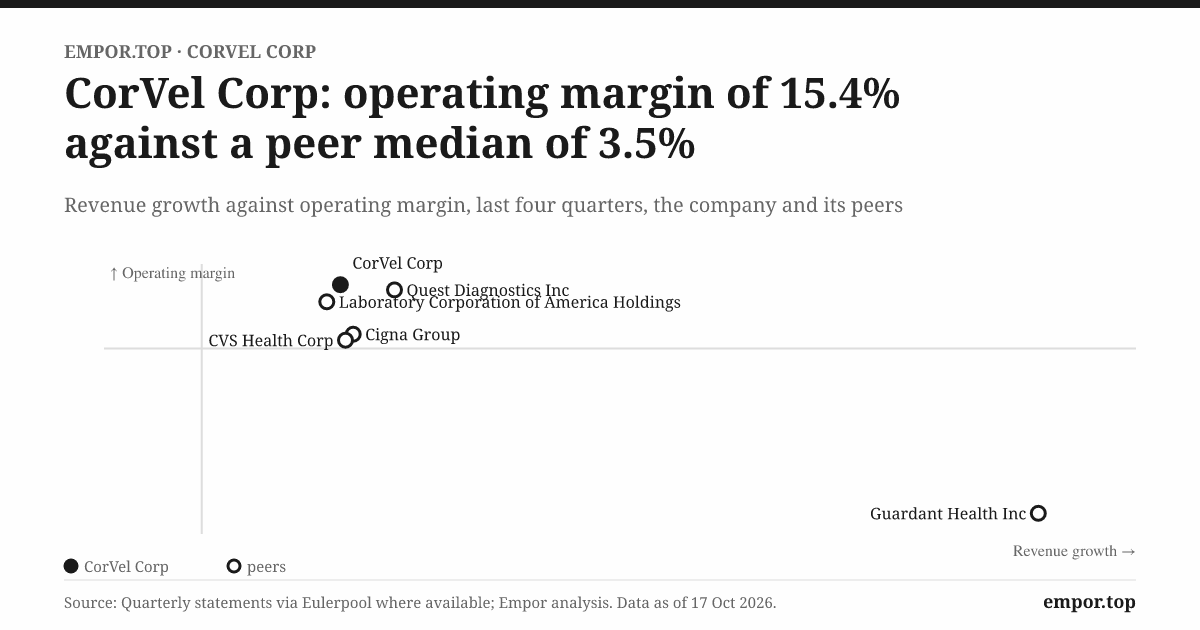
The timing gave the new chief executive both a gift and a burden. The gift was momentum. In the quarter that ended on June 30, 2026, Scott's first full quarter as heir apparent and Combs's last as CEO, CorVel reported revenue of about $260 million, up almost 11% from a year earlier, and an operating margin of nearly 17%, the highest in the company's recent record.2 For the full fiscal year that ended in March 2026, revenue had reached about $959 million.1 The burden was the stock price. On October 17, 2026, CorVel's shares closed at $80.10, just 0.4% below their 52-week high, giving the company a market value of about $4.2 billion and a price of roughly 36.5 times its last twelve months of earnings.
Thirty-six times earnings is not what the market usually pays for a claims administrator. It is closer to what it pays for software. And that is the bet embedded in the share price: that CorVel is not merely a labor business of nurses, adjusters and bill reviewers, but a technology-enabled machine that can handle each new claim a little more cheaply than the last, and so grow profits faster than revenue for years.
The record gives that bet real support. Over ten years, from fiscal 2016 to fiscal 2026, revenue compounded at about 6.7% a year. Over the last five, it compounded at almost 12%, and net profit grew faster still, at about 19% a year.1 Something changed in the last half-decade. Margins that had sat around 9% for years climbed to about 15%. Profit that had been flat for half a decade nearly quadrupled.
So three questions hang over Scott's first year. The first is about demand. Workplace injuries in the United States have drifted lower for years, so CorVel cannot rely on a rising tide of claims; it has to win share, sell more services per claim, or expand into adjacent lines like auto and group health. The second is about technology. CorVel talks about automation, rules engines and artificial intelligence, but does that technology create an advantage customers will actually pay for, or is it simply the cost of staying competitive? The third is about money and control. CorVel has never paid a dividend, it sits on a growing pile of cash, and a single family trust holding company controls a large block of its shares. In August 2026, more than a quarter of the votes cast were withheld from that family's representative on the board.11
The investment case, in plain terms, is that the acceleration is durable. The case against is that a ten-year base rate of under 7% growth is the truer picture, and that a valuation built for compounding leaves little cushion if growth slips back toward it. To see which is more likely, it helps to understand what kind of company CorVel actually is, and how it got here.
 Subscribe on LinkedIn
II. From FORTIS to a Public Claims Specialist
CorVel was born in 1987, in the back offices of the insurance industry, at a moment when American employers were discovering that workers' compensation was quietly becoming one of their fastest-growing costs.4 Medical bills attached to workplace injuries were rising, and the people paying them, mostly employers and their insurers, had few tools to push back. The founders' idea, with the insurer Fortis as an early backer, was not to become another insurer. It was to sell the insurers and employers the tools to manage what they were already paying for. Four years later, in 1991, CorVel listed on Nasdaq, and it has been a public company for 35 years since.4
That original choice still defines the company. CorVel does not underwrite risk. When the warehouse worker's knee needs surgery, CorVel is not the one writing the check for it out of its own balance sheet. Its customers are the organizations that do bear that risk or manage it on someone's behalf: self-insured employers, commercial insurance carriers, third-party administrators and public entities such as cities and counties.1 CorVel sells them services that make each claim cheaper, faster and better documented. It earns fees, not underwriting profits, which is why its balance sheet carries no loss reserves and its fortunes turn on the volume and mix of work rather than the weather of insurance cycles.
That distinction also shapes how to read its ownership. Corstar Holdings, a holding company controlled by director Jeffrey J. Michael, owns a very large block of CorVel's stock, and together with Michael's family trust held about 38% of the shares as of March 2026.3 But Corstar is a shareholder, not a parent. CorVel is an independent Delaware corporation; its financial statements describe CorVel and its own subsidiaries, nothing more.1 Nor is CorVel a global business in disguise: it has no foreign revenue at all, and it serves more than 1,000 clients across the United States.1
For most of its life CorVel was a steady, unspectacular compounder built on two foundations. One was claims administration and case management, the work of handling an injured worker's file from first report to return to work. The other was medical cost containment, chiefly reviewing medical bills against state fee schedules and preferred-provider discounts so that payers did not overpay. Over three decades it stitched those foundations into a national network of local offices backed by central systems.5 The decade before fiscal 2016 left a business doing roughly half a billion dollars of revenue at margins in the high single digits, with no debt and a habit of buying back its own stock.5
The founder era belonged to V. Gordon Clemons, who led the company as chief executive from its founding until 2007 and remained chairman until his retirement in November 2024.3 Clemons built CorVel the way many founder-run service companies are built: frugally, with little interest in Wall Street theater and a strong preference for letting the cash pile up and the share count shrink.
The inflection came later, and it has a name attached to it. Michael Combs, who had become president in 2017, took over as CEO in 2019.1 The years immediately after were not kind. Revenue slipped slightly in fiscal 2020 and fell almost 7% in fiscal 2021 as the pandemic emptied workplaces and depressed new injury claims.1 But margins held up, and when volumes returned, they returned to a business that had been retooled. Operating margins that hovered around 10% at the turn of the decade reached about 15% in fiscal 2026.1 Under Combs, the company leaned harder on software, on automation of bill review, and on larger relationships with national payers who wanted to hand off more of their claims workflow to one provider.
One accounting wrinkle matters for anyone looking at CorVel's history through a data terminal. In December 2024, the company split its stock three-for-one.12 Raw databases that do not adjust for the split show earnings per share collapsing from $3.80 in fiscal 2022 to $1.28 in fiscal 2023, which looks like a disaster. It was not. On a split-adjusted basis, fiscal 2022 earnings were about $1.27 per share, and they have risen every year since, to $2.17 in fiscal 2026.1 The per-share story of the last five years is one of steady growth, not a cliff.
So the CorVel that Sarah Scott inherited is a 35-year-old independent claims specialist that spent its first three decades as a patient cost-containment business and its last five trying to become something more scalable. To judge whether that transformation is real, it helps to follow the money through the two halves of the business, because they are growing at very different speeds.
III. Two Businesses, Two Ways to Get Paid
Go back to the warehouse worker's knee. The claim lands on a desk. A claims professional opens a file, confirms the injury is work-related, sets reserves, and decides what care is appropriate. A nurse case manager might call the worker, coordinate with the treating doctor and plan a return to light duty. That is the first half of CorVel. A few weeks later, the bills start arriving: the urgent-care visit, the imaging center, the physical therapist, a prescription. Each one has to be checked against what the state fee schedule allows, matched against any network discount, and screened for errors or duplicate charges before anyone pays it. That is the second half.
CorVel reports these two halves as service lines. Patient Management covers claims administration, case management, nurse triage and related clinical work. In fiscal 2026 it produced about $597 million of revenue, or 62% of the total.1 Network Solutions covers medical bill review, preferred-provider network repricing, pharmacy management and ancillary services. It produced about $362 million, or 38%.1 The first is the larger engine. The second has been the faster one.
The two halves get paid differently, and that difference explains a lot about how CorVel grows. Patient Management contracts can charge per claim, sometimes as a flat annual or monthly fee; they can bill hourly or by the case for nurse and case-management work; and some use life-of-claim retainers, where CorVel collects a fee up front to handle a claim through its whole life and recognizes the revenue over the expected duration of the work.1 The economics here are those of a skilled service business. More claims, more complex claims, and more services attached to each claim mean more revenue, but also more people.
Network Solutions is more transactional. CorVel earns a fee per bill reviewed, or in some contracts a percentage of the medical savings it produces, meaning the difference between what a provider billed and what the payer ultimately paid after fee schedules and discounts were applied.1 That second pricing unit is powerful when it works, because CorVel's revenue scales with the size of the savings it finds rather than with the hours it spends. It is also exposed to forces CorVel does not control, a point the story will return to when it reaches state regulation.
Put together, the model produces a lot of repeatable work. Contracts typically run annually with automatic renewals, and CorVel describes the large majority of its revenue, more than 85%, as recurring or re-occurring.1 That is a meaningful feature, but it is worth being precise about what it means. Recurring here describes the pattern of work, not a subscription locked in for years. If a client takes its claims elsewhere, the stream stops.
Now look at where growth actually came from. In fiscal 2026, Patient Management grew only about 2.7%, while Network Solutions grew about 15%.1 In other words, the bigger business was barely growing while the smaller one carried most of the momentum. The latest quarter told a more balanced story. In the June 2026 quarter, each service line added roughly $12.5 million of revenue over the prior year.2 Management attributed Patient Management's growth to enterprise third-party-administrator programs and rising claims volume, and Network Solutions' growth chiefly to CERIS, CorVel's payment-integrity business that reviews hospital and facility bills for group health and other payers.7
That pairing is the first real clue in the investment case. If Patient Management is turning back up because large customers are outsourcing whole claims programs, CorVel's bigger engine may be reigniting. If the quarter was a one-off bump while Network Solutions continues to do the heavy lifting, the company's growth rests on a narrower base than its overall numbers suggest.
There are things CorVel does not tell investors that would settle the question faster. It does not report profit by service line, so nobody outside the company can say whether Network Solutions' faster growth comes with higher or lower margins than Patient Management. It does not disclose how much revenue its largest five or ten clients represent. What it does disclose is reassuring on one dimension and cautionary on another: no single customer accounted for 10% or more of revenue in fiscal 2024, 2025 or 2026, but two customers each represented at least 10% of accounts receivable at the end of fiscal 2026.1 Revenue is diversified; the money owed to CorVel at any moment is less so.
One more detail belongs in this part of the story, because it reveals where judgment enters the numbers. CorVel's auditor, Haskell & White, issued a clean, unqualified opinion on the fiscal 2026 statements.1 But it flagged one critical audit matter: revenue recognition for usage-based bill-review contracts and the period-end estimates for directed-care services, where CorVel must estimate revenue for work in progress before all the bills have come in.1 That is not a warning sign so much as a map of where the estimates live. When fees depend on volumes and savings that are not fully known at quarter-end, someone has to estimate them, and that estimate shows up partly as unbilled receivables on the balance sheet.
So CorVel is two businesses wrapped in one workflow, earning money in two different ways, with the faster-growing half paid more by outcomes and the larger half paid more by effort. The obvious question is whether technology is changing the effort part of that equation, which is exactly what CorVel has been telling investors for five years.
IV. The Software Promise Meets a Labor Business
Picture the bill from the imaging center arriving at CorVel. Not long ago, a human reviewer would have read it line by line, looked up the state's fee schedule for each procedure code, checked the network contract, flagged anything unusual and sent it on. Today, much of that happens before a human sees it. CorVel's systems ingest the bill, apply a library of rules covering fee schedules, coding edits, network discounts and duplicate detection, and route only the exceptions to a person. The goal is simple to state and hard to achieve: let the machine do the routine and the people do the judgment.
CorVel's product names map onto that ambition. CareMC is its claims and bill-review platform, the system that connects claims data with clinical and billing workflows for the payers who use it.1 CERIS applies payment-integrity review to complex facility bills. CorVel Connected is the company's pitch for linking claims administration, care management and bill review in one environment, so that what a nurse learns about the injury informs what the bill reviewer allows.1 Management has also described deploying machine learning and generative AI within these systems.6 The fair way to read those claims is as capabilities CorVel is building, not as proof that it has a protected position. Every serious claims competitor is investing in automation; the question is whether CorVel's versions produce measurably better outcomes.
What can be measured is the spending. CorVel does not report a separate research-and-development line. It capitalizes the cost of building internal software, and those capitalized additions rose from about $16 million in fiscal 2024 to about $23 million in fiscal 2026.1 Total capital spending, including property, equipment and software, climbed from about $29 million to about $45 million over the same two years, or from under 4% to nearly 5% of revenue.1 That is a company putting more of its own cash into systems, which fits the story it tells.
The second thing that can be measured is labor productivity. CorVel ended fiscal 2024 with about 4,870 employees and fiscal 2026 with about 5,240, an increase of under 8%.1 Revenue over the same two years rose by about 20%. Revenue per employee therefore climbed from roughly $163,000 to roughly $183,000.1 That is the clearest piece of evidence that something is changing in how the work gets done: CorVel handled substantially more business with only modestly more people, and margins widened alongside.
But the evidence needs a counterweight, and management supplied one itself. On the fourth-quarter call in May 2026, management said staffing had risen to support service delivery and the implementation of new customers, ahead of the automation gains it expected to follow.6 That is a candid admission of how service businesses actually scale. Winning a large account means hiring and training people before the revenue arrives, and the automation dividend comes later, if it comes. Productivity in this business is not a straight line; it moves in steps as new contracts are absorbed.
The longer record also tempers the platform narrative. If CorVel's technology were a self-reinforcing engine, one would expect smoother growth than the company has delivered. Revenue fell in fiscal 2020 and again in fiscal 2021.1 More strikingly, Patient Management revenue declined across fiscal 2023 through fiscal 2025 before its modest rebound in fiscal 2026, even as the company was investing in its systems.1 The technology may well be what kept margins rising through that period, by stripping cost out of the work. It did not, by itself, prevent the larger service line from shrinking. That narrows the claim: the evidence supports technology as a productivity tool, and possibly as a reason customers choose CorVel, but not as a guarantee of uninterrupted growth.
The shape of management's story across the last three calls is worth following, because it shows how the message has evolved. In the February 2026 call covering the December quarter, a quarter in which revenue growth slowed to about 3.5%, management emphasized pipeline and investment.8 By the May call, the emphasis was on enterprise contract wins and a shift in CERIS toward more prepaid work, which changes how and when revenue is recognized.6 On the August call for the June quarter, management cited 8% growth in claims volume and higher bookings.7 That is a consistent narrative, and the June quarter's numbers bore it out. One caveat: the August call had no analyst questions, so there was no live test of how management handles skeptical follow-ups on margins, staffing or the receivables write-off that the story will reach shortly.7
What CorVel does not publish is precisely what a software investor would want first: customer retention, the share of customers using multiple products, price realization on renewals, and a measurement of how much automation has contributed to margins. Without those figures, the honest verdict is that CorVel has shown active reinvestment and rising productivity, and has not yet proven a software moat. Whether its edge is durable depends on how it wins work against competitors many times its size, which is the next stop.
V. The Market Is Fragmented—and the Moat Is Not Yet Measured
Imagine the head of risk management at a national retailer with tens of thousands of employees across forty states. Every year, thousands of workplace injuries flow through the company's claims program. The retailer has a choice. It can hand the entire program to one outside administrator, which handles claims, nurse management and bill review under one roof. It can split the work, keeping claims with one firm and sending bills to a specialist. Or it can keep some of it in-house. Each choice has a price, a service level and a switching cost. CorVel's business depends on how often buyers like that one choose it.
The competition is formidable. Sedgwick, the largest claims administrator in the country, is a private company many times CorVel's size.10 Gallagher Bassett is the claims arm of Arthur J. Gallagher, one of the world's largest insurance brokers. Crawford & Company, a listed peer, runs Broadspire as its third-party-administration business.10 Then there are the large insurers with their own in-house claims operations, regional administrators, and specialist bill-review vendors. Comparing CorVel's revenue to those rivals' total revenue is misleading, because each competes in different mixes of lines and geographies, but the basic point stands: CorVel is a mid-sized player in a fragmented market with some very large neighbors.
Why does it win? CorVel's own case rests on three things. The first is breadth: it can offer claims administration, clinical services, bill review, network access and payment integrity in one connected workflow, which matters to buyers who want fewer vendors and better data across the life of a claim. The second is local delivery backed by national infrastructure: a network of offices staffed by people who know a state's rules, supported by central systems. The third is accumulated know-how embedded in its rules engines and workflows, built up over decades of processing claims and bills. The company disclosed a preferred-provider network of more than 1.2 million providers in fiscal 2024.9
Each of those is plausible. None is proven in the way a moat needs to be. The network figure, for instance, tells investors CorVel has broad provider access; it does not tell them whether CorVel's discounts are deeper, its providers produce better outcomes, or its access is wider than Sedgwick's or Gallagher Bassett's. CorVel simply does not provide that comparison in its filings.9
The structure of the industry explains why advantages are hard to lock in. Buyers are sophisticated and can multi-source; a large insurer can send claims to one firm and bills to another, and can run a formal bid process when contracts come up. That gives buyers real bargaining power. Switching costs exist, because moving a complex claims program means transferring open files, retraining staff and rebuilding data feeds, and nobody does that lightly. But they are not prohibitive, which is why large programs do change hands. On the supply side, medical providers and state regulators set much of the economics: fee schedules cap what providers can charge, which in turn caps the savings a bill reviewer can find. And CorVel's software competes not only with rivals' software but with tools payers build themselves.
The strongest counterevidence to the platform story is the one already seen inside CorVel's own numbers. Patient Management, the larger and more relationship-driven half, slowed and then declined over fiscal 2023 to fiscal 2025 while Network Solutions surged.1 If integrated breadth were a decisive competitive weapon, one would expect the claims-administration side, the anchor of any integrated program, to be gaining share steadily. Instead, CorVel's momentum came largely from its more transactional, more technology-driven bill review and payment-integrity work. That does not reject the claim that CorVel competes well. It narrows it: the clearest evidence of advantage sits in Network Solutions, while the integrated-platform pitch for whole claims programs is only now, with the enterprise wins management described in 2026, producing visible growth.
The diversification of the customer base cuts both ways here. No client supplying even 10% of revenue means no single defection can sink the company.1 It also means the absence of a disclosed anchor customer whose loyalty would demonstrate stickiness. CorVel does not publish market share, retention or win rates, and neither its peers nor the industry produce a clean, comparable market-share series for these services. Any claim that CorVel is gaining share is an inference from its growth relative to a flat claims pool, not a measured fact.
So the competitive verdict is cautious: CorVel has real capabilities and a sensible strategy in a fragmented market, but the moat remains unmeasured. The test that would settle it is growth in the face of that flat pool, which brings the story to the most important number in the case.
VI. Growth Above a Flat Claims Pool
In August 2026, on the first earnings call of the new fiscal year, management delivered two numbers that any growth investor would want to hear. Claims volume, the number of claims CorVel was handling, had grown 8% year over year. And new customer sales in the quarter had risen more than 60%.7 For a business accused of living in a shrinking pond, those were striking claims.
The pond really has been shrinking, or at least not growing. Workplace injuries in the United States have trended down for years, as work has shifted from factories and warehouses toward offices and safety practices have improved, and total claims have remained below pre-pandemic levels. A company that only rode industry volume would struggle to grow at all. CorVel's revenue compounded at almost 12% a year from fiscal 2021 to fiscal 2026,1 which means almost all of its growth had to come from somewhere other than more injuries.
Claims counts are not the only driver, and it is worth naming the others. Severity matters: each claim can cost more as medical prices rise, which means more dollars to review and manage. Outsourcing matters: an employer or insurer that moves its claims program to an outside administrator creates new business for someone without any change in injury rates. State rules matter, because they shape what services are required or allowed. Market share matters most directly. And expansion into auto liability and group health, where CERIS and bill review apply to non-workers'-compensation bills, broadens the pool of dollars CorVel can touch.
Management's evidence for the next leg of growth leans heavily on sales. On the August call, it cited a 40% increase in trailing twelve-month new sales, more requests for proposals and a higher average opportunity value.7 Those are signs of a healthier pipeline. But bookings are not revenue. A contract signed today may take months to implement, may ramp up over a year or more, and may carry lower margins at first while staffing comes ahead of automation, exactly the pattern management described in May.6 The relevant test is whether the sales surge shows up in recognized revenue and in margins over the coming quarters.
The quarterly record is a reminder of how uneven the path can be. Revenue growth, which had run above 10% through most of 2024 and early 2025, slowed to about 7% in the September 2025 quarter and to about 3.5% in the December 2025 quarter.1 Then it bounced back to about 7% in March and nearly 11% in June 2026.2 The recovery is real in the reported figures. But a business that went from double digits to low single digits and back within a year has not settled its growth rate; it has shown that the rate can swing.
Set against the long-run record, the debate becomes clear. The bull reading is that the last five years reflect a new CorVel, more automated, winning bigger accounts, growing faster than its industry, and that the latest bookings set up another stretch of double-digit growth. The bear reading is that the ten-year base rate of under 7% is the more honest guide, that the five-year figure is flattered by starting from a pandemic trough in fiscal 2021, and that the December 2025 slowdown showed how quickly growth can fade.
The evidence leaves the bull reading plausible but unproven. The pandemic-trough point is real: measured from fiscal 2021, the five-year rate starts at a depressed base. But even the three-year figure, from fiscal 2023 to fiscal 2026, ran at about 10%,1 well above the decade's average and without the trough distortion. Something has genuinely improved. Whether it continues depends on a handful of forward tests: the growth of each service line, especially Patient Management; claims volume; the conversion of new sales into revenue; and margins as new implementations mature. A visible shift toward non-workers'-compensation revenue would also widen the opportunity, but CorVel does not disclose that mix in enough detail to say how far it has gone.
If growth does hold up, it will throw off a lot of cash. What CorVel does with that cash is, for many shareholders, the most contentious part of the story.
VII. A Cash Pile, a Buyback Record, and a Concentrated Vote
On August 6, 2026, CorVel's shareholders gathered, virtually, for the annual meeting. Most of the business was routine. The advisory vote on executive pay passed with 96.5% support.11 Then came the director elections. More than 12 million shares, about 26% of the votes cast, were withheld from Jeffrey J. Michael, the director who controls Corstar Holdings.11 About 19% were withheld from R. Judd Jessup.11 Because Michael's own holdings voted for him, the withheld votes represent a much larger share of the votes cast by everyone else. It was a quiet but unmistakable signal from a meaningful slice of outside shareholders.
What were they signaling? A withhold vote does not come with an explanation, and it would be overreading to treat it as a demand for a dividend. It is a governance signal, most plausibly about board independence and the influence of a controlling holder. But it lands against a backdrop that makes capital allocation the natural subject of any shareholder conversation.
Start with where the cash comes from. Over the twelve fiscal years from 2015 through 2026, CorVel generated about $992 million of operating cash flow against about $672 million of net profit.1 That means each dollar of reported profit arrived with nearly a dollar and a half of operating cash, helped by non-cash charges such as depreciation, software amortization and stock compensation, and by the way customer payments and accrued liabilities move through the business. After capital spending, free cash flow over the period totaled about $666 million. Not a dollar of it went to dividends.1 Cash and short-term investments rose by about $198 million over the period, ending fiscal 2026 at about $233 million.1 The rest went overwhelmingly to one place: buying back stock.
CorVel's buyback record is long. Since 1996, it has repurchased about 115 million split-adjusted shares for about $888 million, an average of about $7.70 per share.1 In fiscal 2026 alone, it spent about $56 million on repurchases, up from roughly $38 million the year before.1 With the stock trading near $80, that historical average looks like a triumph. But the average is a record of the past, built largely on shares bought at much lower prices in much earlier years. It says nothing about whether buying at today's prices, at 36 times earnings, creates as much value. The relevant comparison for recent buybacks is the earnings and cash each share actually represents at the price paid, and at a free-cash-flow yield under 3%, every dollar spent on buybacks today buys considerably less future cash than it did a decade ago.
Acquisitions are not the main event. CorVel's disclosed acquisition in fiscal 2026 was about $4.3 million of assets paid for in stock, less than half a percent of annual revenue.1 The company has bought small administrators and service businesses over the years, but it has not published enough consistent detail on prices and results to judge whether it overpaid. That absence matters less than it would at an acquisitive company: CorVel's capital story is about buybacks and retained cash, not deals.
Management pay sits at the restrained end of the spectrum. Michael Combs's total compensation for fiscal 2026 was about $1.29 million, roughly 1.2% of the company's net profit.3 Sarah Scott's appointment came after year-end, with a base salary of $600,000, and Combs's executive-chair salary was set at $300,000.3 Nobody can accuse this board of paying executives as if they ran a software unicorn.
Ownership is concentrated. Corstar Holdings and Michael together held about 38% of the shares, and all officers and directors as a group about 40%.3 Kayne Anderson Rudnick, a long-term growth investor, held almost 10%.3 Concentrated control can cut both ways. It can protect a company from short-term pressure and let it invest patiently; it can also shield a board from accountability. On one important dimension the record is clean: CorVel reported no related-party transactions above $120,000 with directors, officers or major holders since April 2023, and there are no management fees, royalties or loans flowing to Corstar.3 There is no evidence of the controlling holder extracting value from the operating business.
A skeptical activist, looking at all this, would make a pointed argument. CorVel holds a quarter of a billion dollars in bank deposits and money-market instruments earning modest returns, no debt, and a business that throws off more cash than it can reinvest. The company has no bank credit line at all.1 Its cash balances substantially exceed federal deposit-insurance limits, creating some counterparty exposure to the banks that hold them.1 The activist would ask why a business this cash-generative does not pay a regular dividend, run a tender offer while the stock is less expensive, or at least explain what returns the retained cash is waiting for. The board's implicit answer, written in thirty years of behavior, is that it prefers flexibility and steady buybacks. The August vote suggests not every shareholder agrees.
Nothing in the record indicates a pivot is imminent. The things to watch are a change in stated capital policy, a dividend, a tender offer or a material acquisition. Until then, the cash pile is both a cushion and a quiet question. And there is one more place on the balance sheet where a question sits, this time not about how much cash CorVel has, but about money it decided it would never collect.
VIII. The Receivables That Looked Better—Then Needed Explaining
Most investors never read Schedule II. It is a small table near the back of a 10-K, listing the movements in a company's valuation allowances, and it is usually dull. CorVel's fiscal 2026 version was not. It showed that the company wrote off about $6.1 million of receivables during the year, against just $86,000 the year before and about $406,000 the year before that.1 A line item that had been rounding error suddenly became material.
To see why it matters, it helps to know what CorVel's receivables look like. At the end of fiscal 2026, net receivables were about $101 million. That figure included about $38 million of unbilled contract assets, meaning work CorVel had done but not yet invoiced, and was net of an allowance for credit losses of about $4 million.1 Two customers each accounted for at least 10% of those receivables.
On the surface, the receivables picture improved during the year. Debtor days, a measure of how many days of revenue are tied up in receivables, fell from about 42 to about 39.1 Unbilled contract assets shrank by almost a fifth, which the company attributed to improved billing.1 Both point to faster collection and less work sitting in limbo, which is exactly what a skeptic would want to see.
But those improvements do not explain the write-off. A company that writes off $6 million of old receivables will mechanically see its receivables shrink and its debtor days improve, because the uncollectable balances are removed from the books. The write-off also drained the allowance: because the charges to expense during the year, about $2.4 million, were far smaller than the write-offs, the ending allowance fell to roughly half its prior-year level relative to billed receivables.1 So CorVel ended the year with cleaner-looking receivables and a thinner cushion against future losses. CorVel does not publish an aging schedule showing how old its outstanding balances are, which would help separate a one-time cleanup of ancient invoices from a newer problem.
The August call added a relevant piece of evidence. The chief financial officer said one-time items in CERIS had added about $0.07 to earnings per share in the June quarter, primarily from the settlement of legacy receivables.7 That suggests CorVel recovered money on old accounts it had been disputing or carrying, which fits the picture of a business working through a backlog of aged balances. But it does not reveal which balances were written off in fiscal 2026, whether the settlement involved the same customers, or whether the allowance is now adequate.
It is also important to be precise about what is not at risk. CorVel holds client funds used to pay claims in separate fiduciary accounts, and at the end of fiscal 2026 those customer deposits, about $116 million, were exactly matched by customer-deposit liabilities.1 The write-off concerns CorVel's own fees, not the money customers entrust to it for paying claims.
The verdict for now is that the write-off looks more like a bounded cleanup than a sign of spreading customer stress, given improving collections and a reported legacy settlement, but the case is not closed. The test is the next Schedule II: if fiscal 2027 brings large new additions to the allowance, or another year of sizeable write-offs, that would point to something structural. If the allowance rebuilds modestly and write-offs return to their old trickle, the episode will look like what management's account suggests. With that question parked, it is time to weigh the whole case.
IX. Analysis & Bear vs. Bull Case
On October 17, 2026, CorVel's stock sat within half a percent of its 52-week high, having climbed roughly three-quarters from the year's low of about $46. At 36.5 times earnings, it traded below its own five-year median of about 49 times. That comparison tells you how expensive CorVel has been, not how cheap it is now. A free-cash-flow yield of 2.7% means an investor buying at today's price receives under three cents of current free cash for each dollar invested, and is counting on that figure to grow briskly for years.
The bull case has real substance. CorVel has grown revenue at roughly 10% to 12% a year over three- and five-year spans, expanded operating margins by about four to five points, and converted profit into cash at an unusually high rate.1 It has done so with no interest-bearing debt; the roughly $28 million that data providers sometimes label borrowings consists of operating lease liabilities.1 It is investing more in software each year and getting more revenue out of each employee. Its customer base is diversified, its contracts renew automatically, and its June 2026 quarter showed both service lines growing and margins at a recent high.2 A reported return on invested capital above 60% reflects a business that needs little capital to grow. If automation keeps lowering the cost of handling the next claim while enterprise wins and CERIS keep adding volume, CorVel can plausibly sustain double-digit profit growth for some time.
The bear case is equally concrete. The ten-year revenue growth rate is under 7%, and the faster recent rate starts from a pandemic trough.1 Patient Management, the larger half, shrank for three years before its fiscal 2026 rebound. CorVel does not disclose retention, revenue concentration among its largest clients, segment profit or market share, so investors are asked to pay a software-like multiple without software-like disclosure. Growth slowed sharply in late 2025 before recovering. And the receivables write-off, however benign it may prove, is a reminder that aggregate cash conversion can hide specific credit issues.
The industry structure helps explain why the premium is debatable. Buyers, a mix of large insurers, national employers, administrators and public entities, are powerful and sophisticated; they run bids and can split work among vendors. The threat of substitutes is real, because payers can build in-house tools or buy point solutions. Suppliers, in this case medical providers and the states that set fee schedules, shape the savings pool available to bill reviewers. Rivalry is intense among a few very large players and many smaller ones. New entrants face barriers in regulatory know-how, networks and data, but technology vendors can still compete for individual pieces of the workflow. That is a reasonably attractive industry for a well-run scaled player, but not one that hands out monopoly profits.
Running the same evidence through Hamilton Helmer's framework for durable advantage sharpens the point. The strongest candidate power is switching costs: replacing a claims administrator mid-stream is disruptive, and CorVel's integrated offering, if a customer uses it end to end, raises those costs further. But without retention data, that power is an inference. Scale economies exist in rules engines and networks, yet Sedgwick and Gallagher Bassett are larger, so scale is not a CorVel-specific advantage. A cornered resource in proprietary claims and billing data is plausible but unmeasured. Process power, the accumulated ways of working that rivals cannot easily copy, is the most CorVel-specific candidate, and rising productivity is consistent with it. Network effects and brand are weak in this business; buyers choose on service and price, not reputation alone. The honest conclusion is that CorVel shows signs of switching costs and process power but has not published the evidence that would prove either.
Several stress risks matter specifically to this model. State fee-schedule changes can compress the gap between billed and allowed charges, shrinking savings pools and any fees tied to them.1 Cybersecurity and privacy failures would be especially damaging for a company handling sensitive medical and claims data. Wage inflation and implementation costs can outrun automation benefits, as management's own remarks about staffing ahead of automation acknowledged.6 And uninsured bank deposits create a modest but real counterparty exposure.1
On valuation, the cleanest comparison is CorVel against its own history. Precise peer multiples move around and depend on how one defines the peer set; Crawford, a listed claims-services peer, has historically traded at far lower multiples with much thinner margins, while insurance-analytics businesses have commanded premium valuations closer to CorVel's. CorVel's price sits between those worlds, which is the market's way of saying it has not decided which one CorVel belongs to.
Three measures will decide the argument. The first is service-line revenue growth, especially whether Patient Management sustains the momentum of the June quarter rather than reverting to low single digits. The second is operating margin, which reached about 16.7% in June 2026, rising from about 15% a year earlier.2 The third is receivables quality, measured through debtor days, now about 39 and falling, and the allowance schedule.1 For the growth thesis specifically, the conversion of new sales into revenue and the trend in claims volume are the leading indicators.
X. Playbook: Business & Investing Lessons
Return to the bill from the imaging center, moving through CorVel's system while engineers in the background build the rules that will handle the next one automatically. That image contains most of what this company teaches.
The first lesson is about what automation is worth. CorVel's story is full of technology language, from rules engines to generative AI, but the evidence that matters is plainer: revenue per employee rising by about 12% in two years while headcount barely moved. Automation matters when it changes the cost of handling the next claim. Everything else is a press release. For founders building service businesses with software ambitions, the scoreboard is not how many features ship but how much work the systems absorb that people used to do. For investors, the question to ask of any self-described platform is simple: show me the labor it saved.
The second lesson is about averages. CorVel reports one company, but inside it sit two engines running at very different speeds, a larger claims-and-care business that stalled for three years and a smaller bill-review and payment-integrity business that carried the momentum. A broad platform can hide two different growth engines; follow each one. An investor who watched only the consolidated growth rate would have missed both the weakness in Patient Management and the strength in Network Solutions, and would have no way to judge whether the June 2026 rebound in the larger engine is the beginning of something or a single good quarter.
The third lesson is about buybacks. CorVel's thirty-year repurchase record looks magnificent: about 115 million shares retired at an average of under $8, with the stock now above $80. But that average was built when the company traded at a fraction of today's multiple. A low historical repurchase price is a record, not a promise about today's price. Capital allocators earn credit for past buybacks only to the extent that the same discipline applies at the current valuation, and the August 2026 vote suggests some shareholders want that discipline examined.
The fourth lesson is about what cash flow does not tell you. CorVel converts nearly a dollar and a half of operating cash for every dollar of reported profit over a dozen years, a record few service businesses can match. Yet in the same year that cash flow hit a record, the company wrote off more receivables than in the previous several years combined. Strong cash conversion can coexist with a question the aggregate cash number does not answer. The lesson for analysts is to read the small schedules at the back of the filing, because the headline cash number is where problems go to hide, not where they announce themselves.
And beneath all four sits the meta-lesson of CorVel: a service business that wants to be valued like software must eventually prove it like software. The proof will not come from the label. It will come from the work the systems absorb, the labor they save and the cash they return.
XI. Epilogue
Tonight, CorVel stands at an unusually clear crossroads. A new chief executive, Sarah Scott, is a little more than three months into her tenure, with her predecessor still in the building as executive chair. The company has just reported its strongest quarter in years: claims volume up about 8%, quarterly new customer sales up more than 60%, margins at a recent high, and debtor days down to about 39.7 It has settled a legacy receivables item that lifted earnings by a few cents a share. Its stock is at the top of its range.
The next moments that will decide the story are already on the calendar. Each quarterly report through fiscal 2027 will show whether both service lines keep growing, and especially whether Patient Management's revival holds as large enterprise contracts mature. CERIS's shift toward more prepaid work will change the timing of revenue recognition, which could make Network Solutions' growth look lumpier for a while; investors will need to separate timing from trend. If both lines grow at high single digits or better while margins hold, the case that CorVel has reset its growth rate gets much stronger. If Patient Management slips back toward flat while Network Solutions carries the load alone, the old ten-year base rate will start to look like the better guide.
The productivity question will play out in the same reports. Management has said it staffed ahead of automation gains. If those gains arrive, margins should keep rising even as the company absorbs new accounts. If they do not, margins will stall, and the new CEO's execution message will meet its first real test in the numbers rather than on the call.
The governance question will resurface at the next proxy statement and annual meeting. The withheld votes of August 2026 were a warning, not a revolt. Whether the board responds, with more independent directors, a clearer capital policy or a new form of shareholder return, or whether next year's vote shows the dissent spreading, will say a great deal about how a controller-backed company handles pressure.
And the receivables question will be answered, imperfectly, by the fiscal 2027 annual report, due in spring 2027. The allowance schedule and debtor days will show whether last year's write-off was the end of a cleanup or the start of a pattern. Without an aging schedule, those will remain the best available signals.
So the tension that remains is the one this story began with. CorVel's recent record is genuinely strong. Its valuation assumes that record is the new normal. The coming year is when the company will show which of those two facts was doing the talking.
XII. Outro
Go back, one last time, to the warehouse worker and the twisted knee. One injury becomes one claim, and one claim becomes a chain of decisions: which doctor, which therapy, which bill gets paid and for how much, and who keeps track of it all. For most of CorVel's 35 years as a public company, each link in that chain needed a person. The bet behind its revenue of almost a billion dollars, its roughly $156 million of operating cash flow last year and its unbroken record of paying no dividend at all is that fewer and fewer links will.1
That is what makes CorVel unusual. It is not a software company, and it is not a classic claims administrator. It is a human service business trying to teach its systems to handle more of the work, one claim at a time, while investors decide whether that slow transformation deserves a software-like price. The company's next chapter turns on whether the next claim really does get cheaper to handle, and whether shareholders get to see the value.
References
-
CorVel Corporation Form 10-K for Fiscal Year Ended March 31, 2026 — SEC EDGAR, 2026-05-22 ↩↩↩↩↩↩↩↩↩↩↩↩↩↩↩↩↩↩↩↩↩↩↩↩↩↩↩↩↩↩↩↩↩↩↩↩↩↩↩↩↩↩↩↩↩↩↩↩↩↩↩↩
-
CorVel Corporation Definitive Proxy Statement DEF 14A — SEC EDGAR, 2026-06-26 ↩↩↩↩↩↩↩↩
-
CorVel Corporation Form 10-K for Fiscal Year Ended March 31, 2016 — SEC EDGAR, 2016-06-10 ↩↩
-
CorVel (CRVL) Q4 2026 Earnings Call Transcript — The Motley Fool, 2026-05-20 ↩↩↩↩↩
-
CorVel FY2027 Q1 Earnings Call Transcript — Stock Analysis, 2026-08-05 ↩↩↩↩↩↩↩
-
CorVel (CRVL) Q3 2026 Earnings Call Transcript — The Motley Fool, 2026-02-03 ↩
-
CorVel Corporation Form 10-K for Fiscal Year Ended March 31, 2024 — SEC EDGAR, 2024-05-24 ↩↩
-
Competitive Landscape Presentation — Crawford & Company, 2023-06-13 ↩↩
-
2026 Annual Meeting Results, Form 8-K — SEC EDGAR, 2026-08-11 ↩↩↩↩
-
CorVel Corporation Form 10-K for Fiscal Year Ended March 31, 2025 — SEC EDGAR, 2025-05-23 ↩
 LinkedIn
 WhatsApp
 Reddit
 Hacker News
 Email
 Kindle
 RSS Feed
 Spotify
 Apple Podcasts
 Amazon Music
 Audible
 YouTube