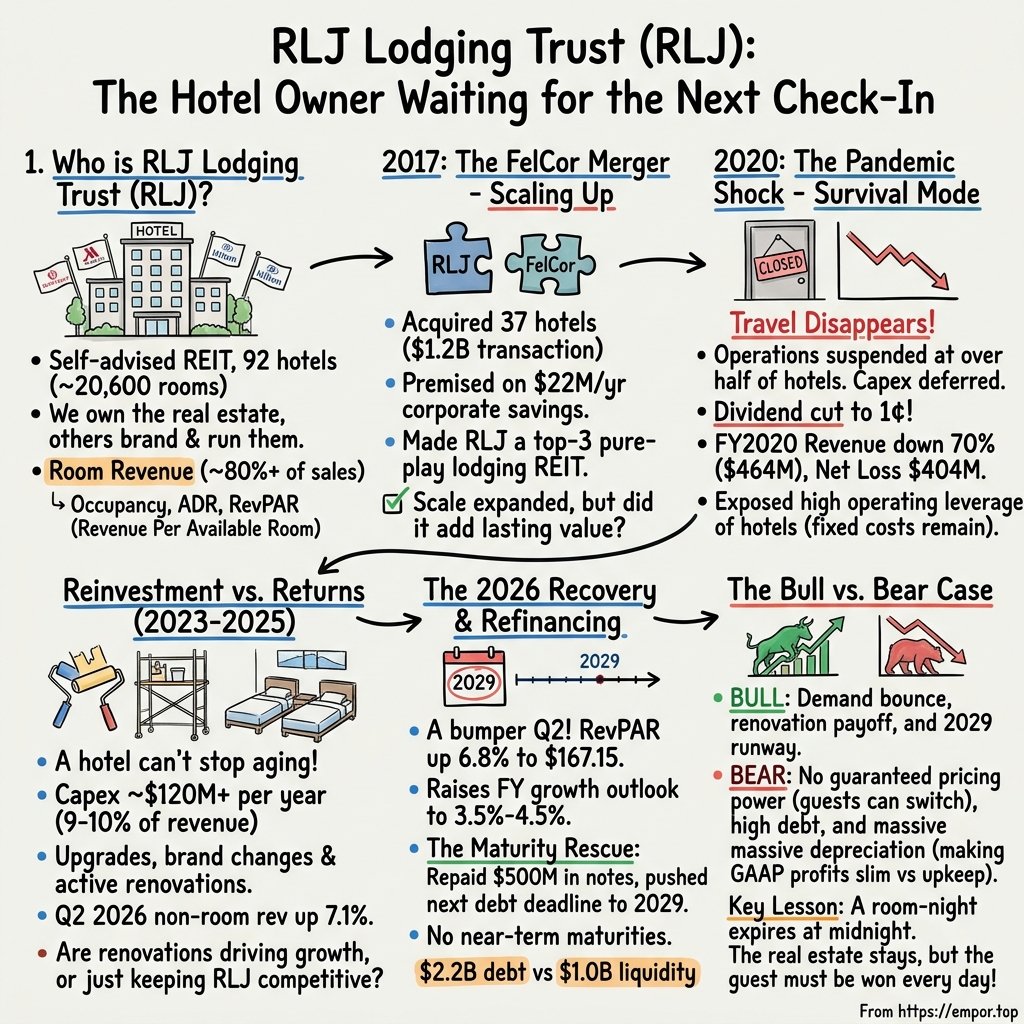
RLJ Lodging Trust: The Hotel Owner Waiting for the Next Check-In
I. The Quarter That Changed the Forecast
Every hotel room in America starts the evening the same way: empty, priced and waiting. By midnight it has either earned its keep or earned nothing at all, and there is no shelf on which an unsold room-night can be stored for tomorrow. Multiply that nightly gamble by about twenty thousand rooms, spread across nearly a hundred hotels in two dozen states, and you have the business of RLJ Lodging Trust.
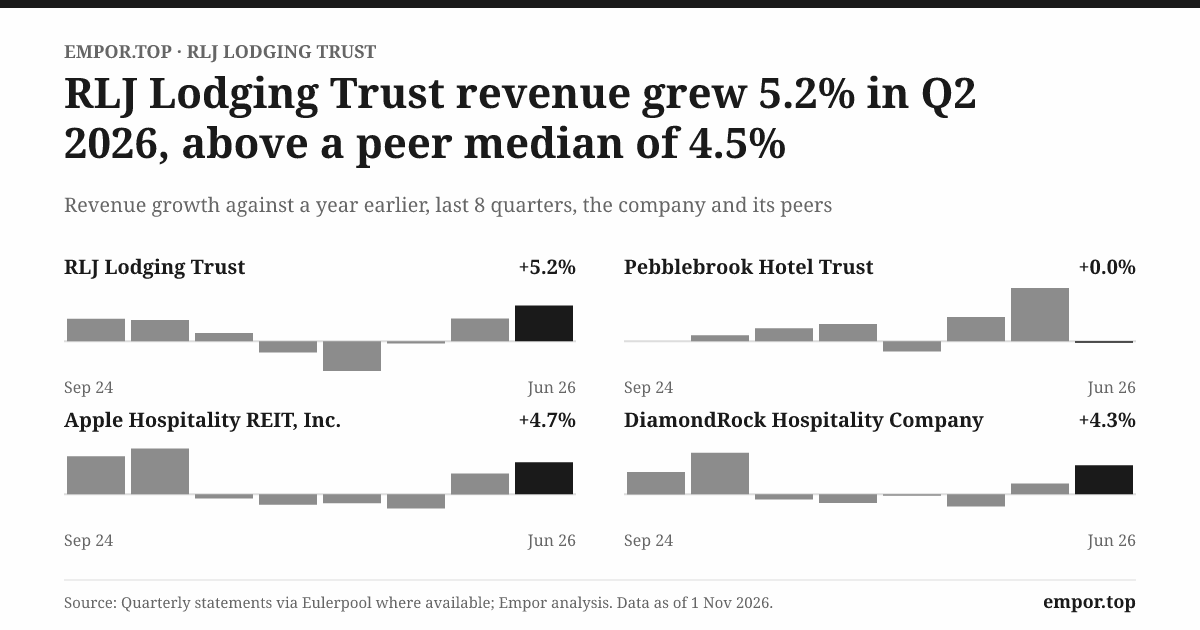
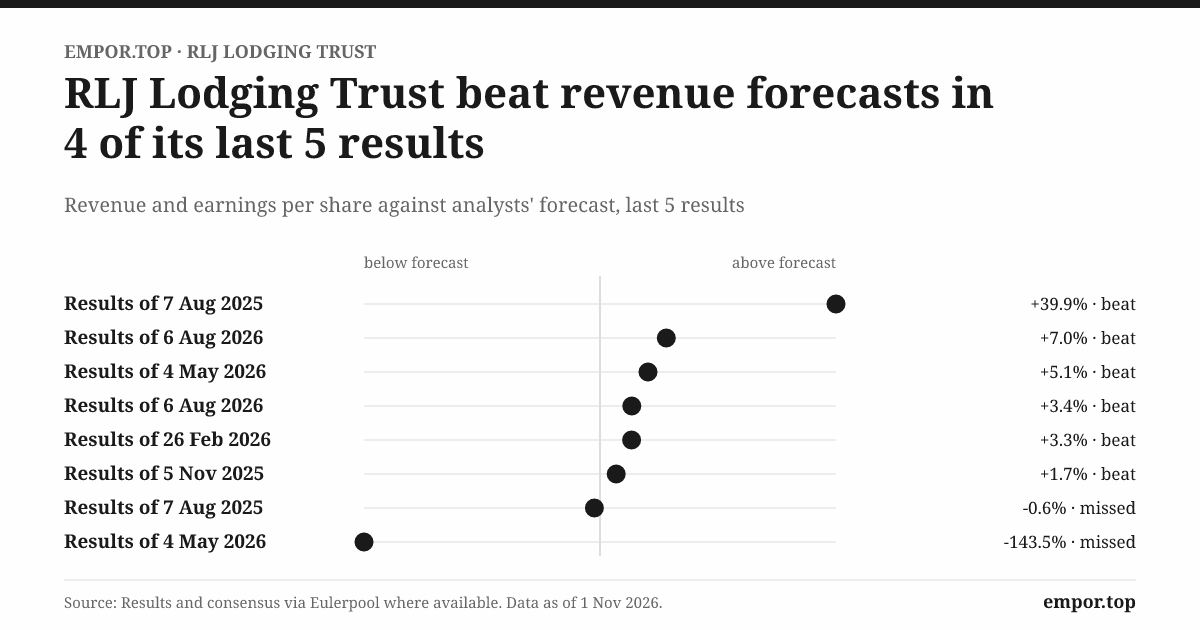
For most of 2025 that gamble was going the wrong way. Fewer rooms were filling, and the ones that did were not selling for more than they had a year earlier. Revenue shrank in three consecutive quarters.1 Then, in early August 2026, RLJ reported a second quarter that looked like a different company. Revenue per available room on its comparable hotels, the industry's master number, had risen 6.8% from a year earlier to $167.15.[^2] Comparable Hotel EBITDA, the cash profit the hotels throw off before corporate costs, interest and depreciation, rose 7.1%.[^2] And management did something it had not done in a long while: it raised its forecast, and not by a little. At the start of the year RLJ had told investors to expect full-year RevPAR growth somewhere between half a percent and three percent. After the second quarter it moved that range to between 3.5% and 4.5%.[^2]
That is the sharpest contrast in this story, and it is worth sitting with for a moment. A company that had spent a year explaining why demand was soft now had to explain why it was strong. On the call that followed, management pointed to business travelers returning in greater numbers, to urban leisure guests filling weekend rooms in the cities, and to hotels that had recently come out of renovation.2 Every one of those explanations is plausible. None of them, on its own, tells an investor whether the summer of 2026 was the start of something durable or a strong three months laid on top of a weak base.
The stakes are easy to state. RLJ is a self-advised real estate investment trust, which means it employs its own executives rather than paying an outside manager, and it is not a subsidiary of anyone. At June 30, 2026, it owned 92 hotels with about 20,600 rooms in 23 states and Washington, D.C.3 Its earnings depend on four things that it controls only partly: the price it can charge for a room, the share of rooms it can fill, where those rooms are, and what it costs to run them. When the first two rise together, a hotel's fixed costs get spread over more revenue and profit jumps faster than sales. When they fall together, the same arithmetic runs in reverse.
That leverage is why the second quarter matters, and why it cannot settle the argument. Three questions run underneath everything that follows. The first is whether this portfolio can recover durable pricing power, the ability to raise room rates year after year without emptying the hotel. The second is whether the money RLJ pours into renovating its hotels earns a real return or merely keeps aging buildings in the game. The third is whether the refinancing RLJ completed in 2026 bought it time to strengthen the balance sheet, or simply moved the deadline further down the road.
It also helps to be clear about what RLJ is not. The company owns hotel real estate. The names on the buildings belong to brands such as Hilton and Marriott, and the people who check guests in, clean the rooms and run the kitchens are employed by independent management companies under contract.1 RLJ shares a name and a founder with RLJ Companies, the investment firm created by Robert L. Johnson, but the listed trust is a separate public company with no parent.1 When a guest books a Courtyard or a Hampton Inn that RLJ owns, three parties share in the night: the brand, the manager and the landlord. RLJ is the landlord, and the landlord is the one who carries the building, the debt and the risk.
So the verdict on the quarter is straightforward, and narrow. The rebound was real, it was broad enough across the portfolio to justify lifting guidance, and it reversed a year of decline. But one quarter cannot erase 2025, and it cannot by itself establish a trend. To understand what would have to happen for the recovery to last, one has to start with what RLJ actually owns, and with the uncomfortable fact that every guest who stayed in one of its rooms last night can choose a different hotel tonight.
 Subscribe on LinkedIn
II. A Hotel Company Built Around Other People's Brands
Picture a business traveler landing in a mid-sized American city on a Tuesday evening. She opens a booking app, filters for hotels near the convention center, and sees a familiar green Hilton Garden Inn logo two blocks away. She books it, earns her loyalty points, checks in, sleeps, and leaves before breakfast. At no point does she hear the words RLJ Lodging Trust. Yet the building she slept in, the land under it, the mortgage on it and the bill for its next renovation all belong to RLJ.
This is the strange shape of the modern hotel business. Decades ago the big brands owned most of the hotels that carried their names. Over time they sold the buildings and kept the logos, the reservation systems and the loyalty programs, which earn steady fees with far less capital. That left a market for owners like RLJ: investors who buy the real estate, sign a franchise agreement with a brand, hire a management company to run the property, and keep whatever profit remains after everyone else has been paid.
RLJ's version of that model is large but not sprawling. At the end of June 2026 it held a controlling interest in 91 of its 92 hotels and owned half of the other one through a joint venture.3 The core of the economics is the room-night. Three measures describe how well a hotel sells it. Occupancy is the share of available rooms that are actually sold. Average daily rate, or ADR, is the average price paid for each room that was sold. Multiply the two and you get RevPAR, revenue per available room, which captures both how full the hotel is and how much it charges. A hotel that is 75% full at $200 a night produces $150 of RevPAR; so does one that is 100% full at $150. Investors watch which of the two is doing the work, because rate growth tends to carry more profit than occupancy growth: a room sold for $10 more costs nothing extra to clean.
The second-quarter numbers show how heavily RLJ leans on that one product. Of about $383 million in revenue, roughly $312 million came from selling rooms.3 Food and beverage added about $44 million and other revenue, which includes parking, resort and amenity fees and similar charges, added about $27 million.3 So something like four-fifths of the money came from the room itself and the rest from what guests spent once they were inside. There is no hidden software business here and no services arm waiting to be discovered. This is hotel property, and the investment case rises or falls with it.
Most of that revenue arrives without any long-term commitment from the customer. A business traveler books a few nights, a family books a weekend, a company books a block of rooms for a conference. The company does not disclose a recurring-revenue share or any minimum commitments from customers, and it reports no named customer large enough to matter on its own.1 That is both a strength and a weakness. No single guest can squeeze RLJ on price, but no guest is locked in either.
Then there are the parties who take a cut before RLJ sees its share. At the end of 2025 RLJ's hotels were run by 16 independent management companies; Aimbridge ran 26 of them and Hilton 21.1 The management contracts generally last between three and 25 years, with base fees usually set at 1.5% to 3.5% of hotel revenue, or 1% to 7% where the agreement also bundles in franchise benefits, plus incentive fees tied to the hotel's operating profit after the owner receives a priority return.1 In 2025, management and franchise fees together came to about $101 million, roughly 7.5% of revenue.1 Think of it as rent RLJ pays for the sign out front, the booking engine that fills the rooms and the staff who run them. It is not optional, and it is paid whether or not the owner earns a return.
What drives demand is a mix of forces almost entirely outside RLJ's control: corporate travel budgets, group conferences, leisure trips, local event calendars, the seasons, the health of the economy and how many new hotels open nearby. In 2025 several of those turned at once. The company attributed that year's slide to softer international, government, corporate and group travel.1 In 2026, the drivers it cited for the rebound were business travel and leisure demand in the cities.2 Demand, in other words, is cyclical and lumpy, and RLJ's job is to be positioned where it shows up.
It helps to place RLJ among its listed peers, with a caveat: there is no single national market in which these companies take share from one another. Pebblebrook Hotel Trust, a West Coast–born owner of urban and resort hotels, ended 2025 with 44 hotels and 11,052 rooms, so RLJ owns roughly twice as many rooms.4 Host Hotels & Resorts, the largest lodging REIT, owned roughly 41,800 rooms, about double RLJ's count, in a portfolio weighted toward luxury and upper-upscale properties.5 Each of them owns a different kind of hotel in a different set of markets. RLJ actually competes hotel by hotel, against the branded and independent properties on the same few blocks.
Where, then, could RLJ earn an advantage? The honest answer lives at the level of the individual building. A hotel in a dense urban core, on land that is expensive to assemble, in a city where construction costs have soared, can be very hard for a rival to replicate. That is a real barrier, and it protects the specific asset. Branding and distribution matter too, but RLJ rents them rather than owns them, and guests can find an equally recognizable logo down the street. RLJ's scale gives it a professional asset-management platform and bargaining weight with managers. What the public record does not show is a company-wide moat: no evidence of customers who pay more because the hotel is RLJ's, and no switching costs that keep them coming back.
That leaves RLJ with a short list of ways to grow revenue on largely transient demand. It can buy better hotels. It can improve the ones it has. Or it can capture more of what each guest spends once through the door. The company has tried all three, and the biggest single attempt at the first one came in 2017, when RLJ decided that getting much larger was itself the strategy.
III. The FelCor Bet That Made RLJ Bigger
On April 24, 2017, RLJ and FelCor Lodging Trust announced that they would combine.[^7] On paper it was a classic REIT consolidation: a larger owner absorbing a smaller, troubled one in an all-stock deal, promising cost savings and a more diversified portfolio. Inside the industry it was a statement of intent. RLJ, only six years after its public listing, was reaching for the top tier of lodging REITs.
The company that made that move had a distinctive origin. RLJ was formed and listed in 2011 by Robert L. Johnson, the founder of Black Entertainment Television, who had built a hotel investment business through RLJ Companies before taking the lodging portfolio public.61 Its niche was specific: premium-branded, focused-service and compact full-service hotels, the kind of Courtyard, Residence Inn, Hampton Inn and Hilton Garden Inn properties that carry big-brand names but run lean, without sprawling ballrooms or full restaurant operations.1 These hotels tend to convert a high share of revenue into profit because there is less to staff. The trade-off is that they compete more directly on location and price, since guests do not choose them for their spas.
FelCor was a different animal. Based in Irving, Texas, it owned upper-upscale hotels, many of them Embassy Suites, along with a scattering of full-service properties in major markets.7 By 2017 its shares had lagged and it had been reshaping its portfolio for years. For RLJ, the attraction was size and reach. The merger brought 37 hotels into the portfolio and was described at announcement as roughly a $1.2 billion transaction, and the combined company was expected to become the third-largest pure-play lodging REIT by enterprise value.[^7]
FelCor shareholders were offered RLJ stock worth $8.54 per FelCor share, a 16.7% premium to FelCor's closing price before the announcement.[^7] Because the deal was stock-for-stock, RLJ paid with its own shares rather than cash, and it took on FelCor's debt and preferred stock along with the hotels.7 That detail matters later in this story. RLJ's preferred dividends, which sit ahead of common shareholders and help explain why its reported earnings per share look so thin, trace in part to this transaction.7
Was a 16.7% premium too much? It is tempting to treat a premium as an automatic verdict, and it would be wrong. Takeover premiums of that size are common, and the right test is what RLJ paid for the hotels' earnings relative to what other buyers paid for similar hotels. The merger documents do not provide a clean purchase-price-to-hotel-EBITDA multiple or capitalization rate that can be lined up against comparable hotel transactions of the period. What can be said is that RLJ paid a real premium, paid in stock, and assumed FelCor's obligations. Whether that price created value depends on what the acquired hotels went on to earn, and RLJ does not report the post-merger returns of the FelCor properties as a group.
The cost savings are easier to follow. Management forecast about $22 million of annualized savings, mostly from eliminating duplicated corporate overhead: two head offices, two boards, two sets of public-company costs.[^7] The deal closed at the end of August 2017.[^10] In a 2018 interview, Leslie Hale, then RLJ's president and who would soon become its chief executive, said a significant portion of those savings had already been realized.8 That is credible on its face, because corporate overhead is the part of a merger a management team controls most directly. Close an office and the expense disappears.
But overhead savings answer a smaller question than the one investors should ask. Twenty-two million dollars a year is meaningful against corporate costs. It is modest against a combined portfolio whose revenue jumped to about $1.8 billion in 2018.[^10] The harder question is whether each acquired hotel earned a return on the capital tied up in it, and here the record is more mixed. In the years after the merger, RLJ sold a large number of hotels, including properties that had arrived with FelCor, and spent heavily renovating and repositioning others.[^10]1 Revenue in 2018 was swollen by the combination, then fell back as hotels were sold. By 2025, with 92 hotels, RLJ was smaller in hotel count than it had been immediately after the merger.1
That pattern supports a narrower conclusion than either fans or critics of the deal usually draw. The merger did make RLJ bigger and more diversified, and management delivered on the overhead promise. It did not launch a period of continuous, acquisition-led growth. Instead it became raw material for years of sales, renovations and portfolio reshaping. Over the decade from 2015 to 2025, which includes the merger, the pandemic and the recovery, RLJ's revenue grew only about 1.7% a year.1[^10] That figure is distorted by asset sales and by 2020, so it is not a clean measure of same-hotel growth. But it does show that the larger platform did not compound into a much larger business.
The lesson that remains is not about whether $8.54 was the right number. It is about what scale can and cannot do in hotel ownership. Scale lowers the cost of running a public company. It may give an owner more weight with brands and managers. It does not, by itself, fill a room or raise a rate. For the FelCor bet to have been a great decision, the acquired hotels needed to earn more than the capital they absorbed, and the public record leaves that question open.
Three years after the merger closed, that capital faced the most brutal test any hotel owner has ever faced.
IV. The Pandemic Turned the Dividend Into a Survival Decision
In the second half of March 2020, hotels across the United States did something almost none of them had ever done: they turned off the lights and locked the doors. Conferences were cancelled, flights were grounded, offices emptied, and in city after city the nightly room count fell toward zero. RLJ moved fast. By early April it had suspended operations at more than half its hotels, cut its quarterly common dividend to a single cent a share, and deferred most of its planned capital projects.[^12]
There is no gentle way to describe what that meant for a business built on nightly revenue. A hotel's costs do not disappear when its guests do. Property taxes, insurance, ground rent, debt interest and the minimum staff needed to keep a building secure all continue. The playbook RLJ laid out in its April 2020 action plan was an exercise in stopping every outflow it could: expense cuts at the hotels and at headquarters, closures where keeping a property open would lose more money than shutting it, and a reduction of more than 80% in planned 2020 capital spending.[^12] The dividend cut was the most visible decision, because for a REIT the dividend is close to the reason for existing. Cutting it to one cent was a statement that survival came first.
The numbers for the year bear that out. RLJ's revenue fell about 70%, to $464 million.9 Operating profit was a loss of about $71 million, and the net loss attributable to shareholders was about $404 million.9 Most telling of all, cash from operations turned negative, at about minus $168 million.9 That is the figure that separates a bad year from a broken one. A hotel REIT can report accounting losses in ordinary times because of depreciation. But in 2020 the hotels were not generating cash at all; they were consuming it. Over the course of the year, 57 of RLJ's hotels temporarily suspended operations, and seven were still closed at year-end.9
What saved the company was liquidity: cash on hand, access to credit and the willingness of lenders to amend covenants while the world waited. RLJ entered 2020 with a large cash balance and exited with roughly $900 million, built in part by drawing on credit lines and holding back on spending.9 It survived. But survival came at a cost visible on the balance sheet for years afterward. Debt rose relative to equity, and shareholders' equity shrank as losses accumulated, from about $3.2 billion at the end of 2019 to about $2.4 billion by the end of 2021.91
It would be unfair to treat COVID as a normal test of a business. It was an extraordinary external shock that hit every hotel owner, and RLJ's response was decisive and, in the narrow sense of keeping the company intact, successful. But it would be equally wrong to treat the pandemic as irrelevant now. The episode exposed, in the starkest possible terms, two features of RLJ's model that still matter. The first is operating leverage: when revenue falls, profit falls much faster, because so many costs are fixed. The second is that the common dividend depends entirely on normal hotel cash flows. When those flows stop, the dividend goes with them.
The dividend was rebuilt gradually after the reopening. Dividends paid rose from about $31 million in 2021 to about $116 million in 2025.1 That is a real recovery, and it reflects hotels that are once again generating cash. But a shareholder buying RLJ today buys into a payout whose history includes an emergency reset, and a board that has shown it will cut the dividend to preserve liquidity when conditions require. That is prudent governance. It is also a reminder that the dividend is a residual, not a promise.
The deeper lesson of 2020 is about the fixed claims that sit ahead of shareholders. Hotels still need maintenance, labor and interest payments even when occupancy or rates weaken, and those claims are larger today in some respects than they were before the pandemic, because the balance sheet emerged from the crisis carrying more debt relative to equity. RLJ does not have to face another 2020 to feel that pressure. A modest decline in RevPAR, like the one in 2025, pushes against the same fixed costs on a smaller scale.
The recovery since then is real in every headline measure. Revenue climbed back above $1.3 billion by 2023.1 But it leaves an awkward question for anyone trying to judge it. If GAAP profit fell so far below cash in normal years, and cash itself turned negative in the worst one, which number actually tells you whether RLJ's hotels are earning their keep? The answer starts with a line item that every hotel owner knows well and every outside investor underestimates: the bill for keeping the rooms worth renting.
V. The Renovation Budget Between a Room and a Return
Walk into a hotel room that has not been touched in a decade and you can feel it before you see it. The carpet is a shade too busy, the bathroom tile is a generation old, the outlets are in the wrong places for a guest with two phones and a laptop, and the lobby looks like a photograph of someone else's idea of modern. The guest may not consciously decide to pay less, but the booking app does it for them: the review scores drift lower, the rate the hotel can command drifts lower, and the brand sends a letter reminding the owner of its standards.
That is the problem RLJ's renovation budget is meant to solve, and it is why hotel capital spending is not discretionary in the way that research and development is for a software company. A software company can choose not to build a new feature this year. A hotel that skips renovation does not stand still; it falls behind, because rooms, mechanical systems and public spaces wear out, brand standards change, and guests compare every property against the newest one in town. Franchise and management agreements usually require owners to set aside reserves for furniture, fixtures and equipment, typically 3% to 5% of hotel revenue, and at the end of 2025 RLJ held about $32 million in such restricted reserves.1
The scale of the spending is what surprises most first-time readers of a hotel REIT's cash-flow statement. RLJ spent about $126 million on property improvements and additions in 2025, about $137 million in 2024 and about $132 million in 2023.1 In each of those years that came to roughly one dollar in every ten of revenue, before any of the ordinary costs of running the hotels. For the 2026 outlook, RLJ set renovation capital spending at $80 million to $90 million, a lower figure than the previous three years.[^2] Put plainly, if RLJ's hotels collect $1.3 billion from guests in a year, more than $100 million of that has in recent years gone straight back into the buildings.
Why so much? Part of it is catch-up. The pandemic-era decision to defer most projects left a backlog, and the years that followed brought a wave of renovations and brand conversions to clear it. Part of it is strategy. RLJ has described its approach as a combination of renovating hotels, converting some of them to different brands or concepts, selling selected hotels, and pushing initiatives to raise what guests spend outside the room, from food and beverage to parking and amenity fees.[^2]2 Converting a hotel can mean swapping one brand for another that commands a higher rate in that market, or turning an underused restaurant into a bar that locals use too. The idea is to improve the existing estate rather than rely solely on buying new hotels, while recycling capital out of properties that no longer fit.
The obvious question is whether any of this pays. Management's case is that it does. In the second quarter of 2026, comparable non-room revenue, meaning food, beverage and other guest spending, grew 7.1%, and management cited renovated hotels among the contributors to the quarter's results.[^2]2 Those are encouraging indicators. A freshly renovated hotel that suddenly sells more rooms at higher rates and gets more guests into its bar is exactly what the strategy promises.
But indicators are not proof, and this is the part of the story where an independent reader has to be precise. RLJ does not disclose portfolio-wide renovation paybacks, project-by-project returns, or the RevPAR and EBITDA uplift of renovated hotels compared with their pre-renovation baseline and with the capital spent. Without those figures, an outsider cannot separate a renovation that earns a strong return from one that merely restores a hotel to where it would have been if it had never aged. A newly refreshed room might command a $20 premium over its tired former self; it might also simply stop a $20 decline. Both look like improvement in a quarterly release. Only one creates value.
The disconfirming evidence in RLJ's own record is worth stating directly. The company spent well over $100 million a year on its properties from 2023 through 2025, and yet comparable RevPAR fell in 2025 and revenue declined.1 Net profit fell sharply that year as well.1 That does not prove the renovations failed, since 2025's weakness was driven by government, international and group demand that no renovation could fix. But it does mean the history does not demonstrate that the capital program has been lifting the portfolio's earnings power over and above the cycle. The claim survives in a narrower form: renovations are clearly keeping RLJ's hotels competitive and may be earning attractive returns on specific projects. A portfolio-wide return above the cost of capital is management's case, not a demonstrated result.
What would settle it is simple to describe and, so far, absent from the company's disclosures: hotel-level post-renovation RevPAR and EBITDA, compared with the capital invested, measured over at least a full operating year after reopening. If renovated hotels consistently gain share against their local competitors and lift their margins, the renovation story becomes evidence. If the gains fade after a year, it becomes maintenance with a better press release.
Every dollar that goes into a renovation is a dollar that does not go somewhere else. It does not pay down debt, does not fund a dividend and does not buy back shares. That competition for cash brings the story to its central financial puzzle: RLJ appears to generate plenty of cash on paper, yet once the hotels have been maintained and the lenders paid, how much is really left for shareholders?
VI. Cash Flow Looked Strong; the Distribution Test Was Harder
Here is a puzzle that has confused more than one investor looking at a hotel REIT for the first time. Add up RLJ's reported net profit over the twelve years from 2014 through 2025, a span that includes the FelCor merger, the pandemic and the recovery, and you get about $451 million. Add up the cash its operations generated over the same years and you get about $3.0 billion, more than six and a half times as much.1[^10] Either the accountants are hiding something, or reported profit is measuring the wrong thing.
It is mostly the second. The biggest reason for the gap is depreciation. When RLJ buys or renovates a hotel, accounting rules require it to spread that cost over the building's useful life, charging a slice against earnings every year. In 2025 depreciation and amortization came to about $186 million.1 That charge reduces reported profit, but no cash leaves the building when it is recorded, so the cash-flow statement adds it back. For a company whose main assets are buildings, that single non-cash line can make GAAP profit look tiny even when the hotels are throwing off plenty of cash. This is why REITs and their investors use measures such as funds from operations, which add depreciation back to earnings.
So far, the story flatters RLJ. The problem is that operating cash is not the same as cash that can be handed to shareholders. Depreciation is a non-cash charge, but the wear and tear it represents is entirely real, and the renovation budget shows what it costs to fix. Operating cash is already net of the interest RLJ pays its lenders, but before common shareholders see a dollar, two more claims come first. One is the renovation and maintenance bill. The other is the dividend on RLJ's preferred shares, a fixed payment that ranks ahead of the common stock and that came into the capital structure partly through the FelCor deal.7
The simplest definition of free cash flow is operating cash less capital spending, and that is a useful first cut. But it depends heavily on how much capital spending is actually captured. Measured over the full twelve years in a way that counts most of the operating cash as free, RLJ produced about $2.9 billion of free cash and paid about $1.6 billion of dividends, so dividends appear to absorb only 55% of the total. The rest went to a mix of property spending, acquisitions, debt reduction and refinancing, share repurchases and a modest increase in cash: RLJ ended 2025 with only about $78 million more cash than it held at the end of 2013, despite all that apparent free cash.1 Where did it go? Into the hotels, into the lenders' hands and back to shareholders, in roughly that order of priority.
The long-run sum is reassuring only when it is paired with the claims that sit ahead of the common dividend. The most recent year shows why. In 2025 RLJ generated about $243 million of operating cash and spent about $126 million on property improvements, which left about $117 million.1 Dividends paid that year came to about $116 million.1 The cushion was almost exactly zero. On top of that, RLJ spent about $29 million buying back its own shares in 2025, money that had to come from somewhere other than the year's free cash, such as the proceeds from the three hotels it sold or the cash already on its balance sheet.1
That thin margin was not the norm. In 2023 and 2024, operating cash was higher and dividends lower, so the same arithmetic left a comfortable surplus.1 What changed in 2025 was a squeeze from both ends: weaker hotel operations reduced operating cash, while the rebuilt dividend kept growing. That is precisely the dynamic that makes a payout look safe in a strong year and stretched in a soft one.
Then there is the number that tends to alarm newcomers: RLJ's dividends in 2025 came to 414% of its reported net profit.1 Taken literally, it suggests a company paying out four times what it earns. As a comparison it is genuinely striking, but it is the wrong comparison for this kind of business. Net profit is depressed by roughly $186 million of depreciation, and the figure available to common shareholders is further reduced by preferred dividends. A lodging REIT should be judged against adjusted funds from operations and against cash after recurring capital spending and financing costs, not against GAAP earnings. On those measures, the 2025 dividend was covered, barely.
The practical test for a shareholder is therefore not complicated, even if RLJ does not present it as a single line. Take the year's operating cash, which already reflects interest. Subtract the recurring capital spending required to keep the hotels competitive, and subtract the preferred dividend. What remains is the pool from which common dividends and buybacks can be paid without selling hotels or adding debt. In 2025 that pool was roughly equal to the dividend and smaller than dividends plus buybacks combined. If the recovery of 2026 holds, and if renovation spending stays at the lower $80 million to $90 million range RLJ guided to, the pool should widen.[^2] If either of those assumptions slips, the dividend will once again depend on asset sales or on the balance sheet.
And the balance sheet, until very recently, had a deadline written on it.
VII. Refinancing Bought Three Years of Room
On July 1, 2026, a $500 million bond came due, and RLJ paid it off.3 In the world of corporate finance it was an unremarkable event, the kind of transaction that shows up in a footnote. But for the treasury team at RLJ it was the final step of a sequence that had begun months earlier, and its completion changed the shape of the company's risk.
The sequence ran like this. In February 2026, RLJ announced a package of refinancing transactions.[^14] It extended its revolving credit facility, the corporate equivalent of a large credit card that can be drawn and repaid, to 2030. It recast and upsized an existing term loan. It added new long-dated term debt maturing in 2031 and 2033.[^14] And it used the proceeds, together with cash it already held, to set up the repayment of the 2026 notes. That is why RLJ's cash balance looked swollen at the end of June: about $938 million sat on the balance sheet, most of it waiting to retire those notes the following day.3 After the July payment, the company reported about $2.2 billion of debt, about $1.0 billion of liquidity, and no debt maturities until 2029, counting extension options it can exercise.[^2]
To see what the refinancing achieved, think of a homeowner whose mortgage is about to balloon. Paying the balloon with a new, longer loan does not reduce what the household owes, but it removes the danger of being forced to sell the house in a bad market. For RLJ, the danger of a 2026 maturity was not insolvency; it was the possibility of having to refinance at a bad moment, on bad terms, or to sell hotels to raise the money. Pushing the next maturity out three years removes that pressure for now.
What it does not do is reduce the debt load itself. At June 30, 2026, before the July repayment, debt net of financing costs stood at about $2.70 billion.3 Separately, RLJ reported about $119 million of lease liabilities, and those deserve their own attention.3 Twelve of RLJ's hotels sit on ground leases, meaning RLJ owns the building but rents the land under it. In 2025 the company paid about $16 million in ground-lease expense, and its future minimum lease payments totaled about $570 million, most of them stretching far into the future.1 Those payments do not appear in the debt line, but they are fixed claims on hotel cash flows all the same. A lender, and a careful shareholder, should count both.
Interest rates add a further layer. At the end of 2025, about $1.2 billion of RLJ's debt, 53.5% of the total, carried variable rates, which means its interest cost moves with market rates.1 The company uses interest-rate swaps, which convert floating payments into fixed ones, and caps, which limit how high the rate can go, to manage that exposure.1 Those tools soften the blow without eliminating it. In 2025 RLJ paid about $112 million in interest expense, partly offset by about $14 million of interest income on its cash.1 Set that against income before tax of about $30 million that year, and it becomes clear how heavily financing costs weigh on what the hotels earn.1 Higher rates can eat into the cash available for renovations and distributions just as surely as a weak RevPAR quarter can.
The counterweight is real and deserves fair weight. At June 30, 2026, RLJ reported that it was in compliance with its credit-facility covenants, which include a maximum leverage ratio of 7.25 times and a minimum fixed-charge coverage of 1.50 times.3 Those thresholds define the box the lenders have drawn around the company, and RLJ was inside it. A rough calculation using the roughly $2.2 billion of post-refinancing debt, the cash left after the July repayment, and the roughly $320 million of EBITDA the company produced in 2025 puts net leverage somewhere in the region of five to six times EBITDA, comfortably inside the covenant ceiling but well above the levels at which hotel REITs are usually considered conservatively financed.[^2]1
The outside credit view points the same way. In a June 2024 summary of its rating components, S&P Global Ratings placed RLJ at a B+ issuer rating, which sits in speculative-grade territory, describing its competitive position as fair, its financial risk profile as highly leveraged and its liquidity as adequate.10 That file is a score summary rather than a full current rating rationale, and it predates the 2026 refinancing. It is evidence of the constraint rather than a verdict on today's balance sheet. But it is a useful reminder that independent analysts have looked at the same numbers and seen leverage as the defining limit on the company's flexibility.
The history adds a further caution. RLJ's debt-to-equity ratio rose from about 0.7 before the pandemic to about 1.07 at the end of 2025, partly because debt held steady while equity shrank with pandemic losses and buybacks.19 The company did not deleverage materially during the recovery; it refinanced. That is not a criticism in itself, because refinancing at acceptable terms is a legitimate tool. But it means the balance sheet today is still being carried by the hotels' earnings rather than by a smaller debt load.
The verdict on the refinancing is therefore clear and limited. It materially reduced near-term maturity pressure, and RLJ was compliant with every reported covenant. It did not erase leverage, floating-rate exposure or lease obligations. Credit risk remains part of the investment case, and the test from here is whether net debt relative to EBITDA, and fixed-charge coverage, improve as the company approaches the 2029 maturity window. That improvement can only come from one place: hotels that earn more. And whether they can earn more depends on a question RLJ has never fully answered, which is how much pricing power its rooms really have.
VIII. A Portfolio With No Guaranteed Pricing Power
Stand in a hotel lobby on a busy weeknight in almost any big American city and you are standing at the front line of a price war that never ends. Two blocks away is another hotel with a recognizable logo and similar rooms. Across the street is a boutique independent with a rooftop bar. On a traveler's phone, all three appear side by side, each with a nightly rate, a star rating and a cluster of reviews. RLJ's hotel wins the booking only if its location, rate, brand and experience together beat the alternatives, and the contest resets the next night.
The forces shaping that contest are worth naming because each one limits pricing power in a specific way. Guests have abundant choice and can see competing prices instantly. Brands and online travel agencies shape access to those guests and take a share of each booking. Managers and their labor costs determine what it costs to deliver the night. New hotels add supply that competes for the same travelers. And travel downturns, whether caused by a recession, a pandemic or a cut in government travel budgets, can weaken pricing quickly. RLJ sits in the middle of all five, which is why the moat question matters so much.
The best real-world test of pricing power is what happens to rate when demand softens. In 2025 that test was run without anyone having to design it. Comparable RevPAR fell from about $146 to about $143, as occupancy slipped from 72.7% to 71.6%.1 The telling figure is ADR, which barely moved, essentially flat at around $200 a night.1 RLJ's hotels did not collapse in price, which suggests some resilience. But neither could they raise rates to offset fewer guests. A business with strong pricing power raises prices even when volumes dip. RLJ's hotels held rate and gave up volume, which is what one would expect in a competitive market with no decisive advantage.
The second quarter of 2026 ran the test in the opposite direction, and here the evidence is more favorable. RevPAR rose 6.8%, and most of that came from rate: ADR climbed 4.9%, while occupancy improved to 77.0% from 75.6%.[^2] When demand returned, RLJ's hotels could charge more. That is meaningful, because rate growth carries more profit than occupancy growth, as the margin improvement that quarter showed. But it is also what most hotels in recovering urban markets experienced. The question is not whether RLJ can raise rates in a rising market; it is whether it can raise them faster than its competitors, over a full cycle.
The advantages that do exist live at the asset level. Hotels in dense urban markets, on scarce land, in cities where building new hotels has become expensive, are costly and difficult to replicate. That protects the individual property against new supply. RLJ's hotels carry strong brands, but the brand and management relationships are rented: they carry fees and they do not guarantee demand, because the same brands also license their names to competing owners down the street.
Comparing RLJ with its peers sharpens the picture without settling it. Host owns roughly twice as many rooms and leans toward luxury and upper-upscale hotels and resorts, which tend to command higher rates and serve more group and high-end leisure demand.5 Pebblebrook is smaller by room count and concentrated in urban and resort markets.4 RLJ's focus on premium-branded, focused-service and compact full-service hotels gives it leaner operations but a more price-sensitive customer. These comparisons are context rather than direct same-store comparisons, because each company owns a different kind of hotel in a different set of cities.
Technology deserves a proportional mention rather than a prophecy. Software, including artificial intelligence, may change how rooms are distributed and priced and how hotels are run, from automated revenue management to digital check-in. But the physical room is the product, and no algorithm can substitute for a bed in the right city. The nearer-term question is who captures the economics of the booking, the owner, the brand or the online platform, and whether automation can offset the steady inflation in labor and operating costs that RLJ's managers face. If brands and platforms take a growing share of each booking, owners like RLJ lose margin even if room rates rise.
So the investor's test of why RLJ wins comes down to this. Better local assets and stronger renovation execution could earn RLJ higher cash returns than its competitors. That is a coherent strategy. But the public evidence, notably flat rates during the 2025 soft patch and the absence of disclosed share gains against local competitors, does not yet show a company-wide moat. The advantage is asset-specific and execution-dependent. And execution, in the end, is a question about the people running the company.
IX. Leslie Hale's Record of Promises, Pay and Portfolio Choices
On the morning RLJ discussed its second-quarter 2026 results, two executives faced analysts with a very different story from the one they had been telling a year earlier. One was Leslie Hale, the chief executive. The other was Nikhil Bhalla, who had become chief financial officer less than a year before.26 After a weak 2025, they could finally point to rising revenue, rising profit and a higher forecast. The analysts' job was to find out how much of the story would last.
Hale's own path to that seat is unusual in American real estate. She studied at Howard University, earned an MBA at Harvard Business School, and worked in investment banking at Goldman Sachs and in real estate and mergers at General Electric before joining Robert Johnson's investment firm in 2005.8 She became chief financial officer of RLJ Lodging Trust around its listing, rose to chief operating officer and then became chief executive in 2018, making her the first African American woman to lead a publicly traded REIT.8 By temperament she comes across as a finance executive first: precise about capital, comfortable with deal structure, and focused on the arithmetic of the portfolio. She was, notably, the executive most closely identified with integrating FelCor.8 Robert Johnson, the founder, remains executive chairman.6
Begin with what she and her team have delivered. Her record includes the FelCor integration, pandemic response and refinancing, as well as a second quarter that beat the expectations management had set at the start of the year and led it to raise guidance.8[^2]
The longer record is more complicated. It includes the emergency dividend cut and capital spending freeze of 2020, decisions forced by circumstance but still part of the record. It includes a 2025 in which comparable RevPAR, revenue and profit all fell.1 Net profit dropped from about $68 million in 2024 to about $28 million in 2025.1 And it includes a decade in which revenue grew far more slowly than the larger platform once promised.
Against that backdrop sits the pay. In 2025 Hale's approved compensation was about $8.85 million, including a cash bonus of about $1.6 million and about $6.35 million in annual and target multiyear equity awards.6 Johnson's compensation as executive chairman was about $2.7 million.6 RLJ says 90% of the CEO's target compensation is at risk, tied to performance and shareholder-return measures.6 Hale owns about 1.4% of the shares, so her personal wealth moves with the stock.6
Set $8.85 million against $28 million of net profit and the ratio looks uncomfortable. But GAAP profit is the wrong yardstick here, because depreciation flattens a hotel owner's reported earnings, and the proxy offers a better one. Over the prior five years, the pay Hale actually realized averaged only about 45% of the amounts reported in the summary compensation table, and it tracked total shareholder return.6 In other words, much of the headline pay is in equity whose value depends on the share price, and it has paid out well below its face value. That alignment is real. It does not change the fact that a company of RLJ's size paid its chief executive a large sum in a year of declining results.
Shareholders appear broadly satisfied, though not unanimously. Say-on-pay received about 92% support in 2025.6 At the April 2026 annual meeting, about 99.1 million shares supported the 2025 compensation program and about 14.0 million opposed it, a meaningful minority.11 Trustees and executive officers together owned about 3.7% of the shares.6 The chairman is not independent, and RLJ uses a lead independent trustee as a counterweight.6
Leadership continuity was tested in 2025. Chief financial officer Sean Mahoney retired in May, and Hale served as interim principal financial officer until Bhalla arrived in September.6 The general counsel also resigned in May and was replaced that month.6 The departures produced a small accounting benefit, about $1.6 million, from forfeited performance units.1 None of this signals a governance problem on its own, but it means the current finance team is new, and its credibility will be built on the quality of its disclosures and its delivery from here.
The capital-allocation pattern deserves the same scrutiny. RLJ sold three hotels in 2025 and repurchased about $29 million of its own shares, after buying back about $76 million in 2023 and about $22 million in 2024.1 In April 2025 the board authorized a new repurchase program of up to $250 million.1 Buybacks look attractive when a stock trades below book value, as RLJ's often has. But each dollar spent repurchasing shares is a dollar not spent reducing a debt load that S&P has described as highly leveraged, and in 2025 the year's free cash was already fully absorbed by dividends. Buybacks should be judged against leverage and per-share value, not counted as an automatic positive.
On guidance, the pattern is cautious and then responsive. RLJ began 2026 with a modest RevPAR outlook of 0.5% to 3.0% growth.[^17] After a strong second quarter it raised that range substantially.[^2] Setting a conservative bar and then clearing it is a familiar management strategy, and it is better than the reverse. But the raised guidance also rests on assumptions about business travel, urban leisure demand and costs that management controls only partly. On the second-quarter call, the explanations offered for the strength, returning business travel, recovering urban leisure and renovated hotels, were plausible, but they were also the same kinds of explanations any hotel owner gives in a good quarter.2 The more revealing tests will come when demand softens again and management has to explain why.
The standard for credibility from here is simple. The next proof is not whether RLJ can tell a convincing recovery story. It is whether hotel-level returns and cash after capital spending improve alongside RevPAR. That brings the story to its reckoning: weighing the bull case against the bear.
X. Analysis & Bear vs. Bull Case
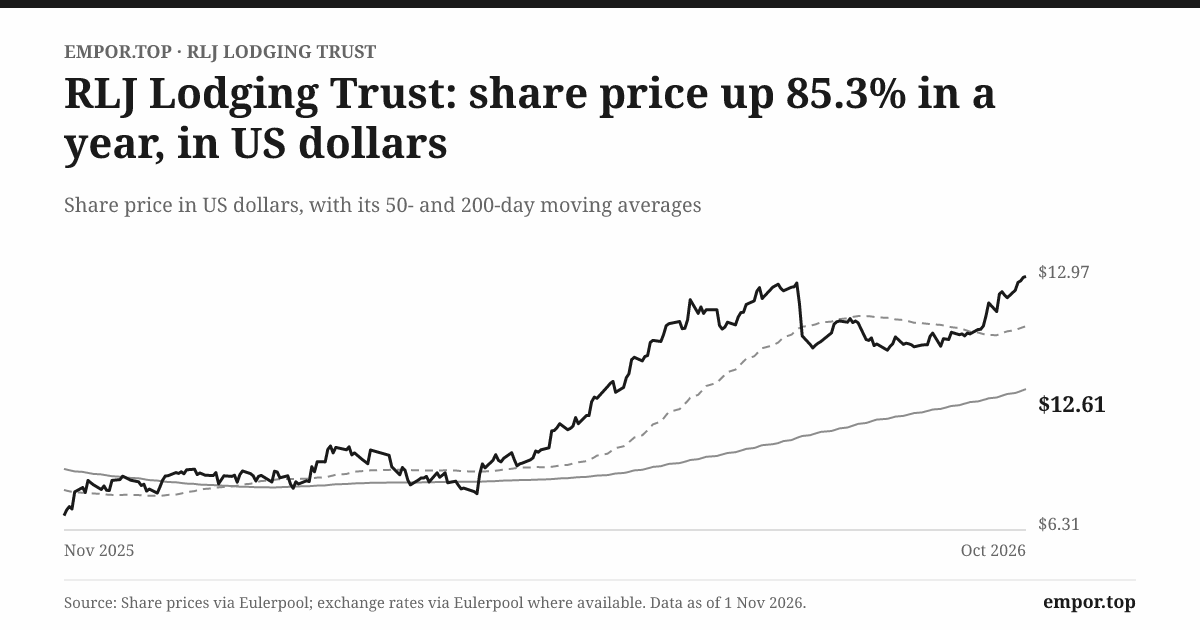
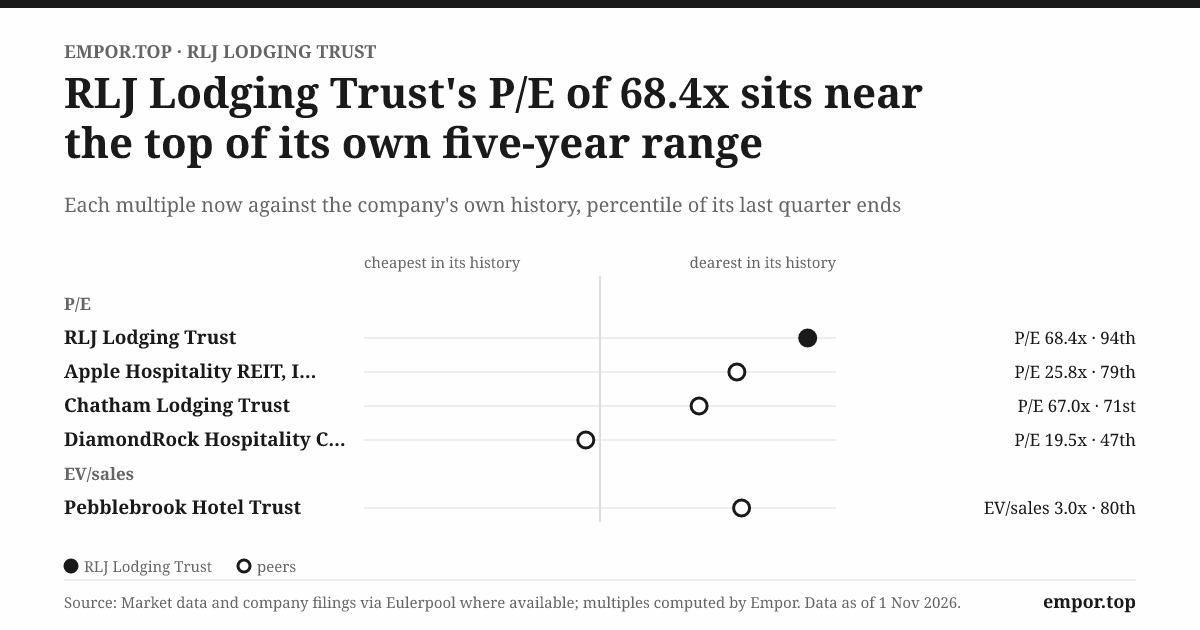
Two valuation screens, side by side, tell opposite stories about the same company. On one, RLJ's shares trade at about 0.9 times book value, which looks like a bargain: the market values the company at less than the accounting value of its equity. On the other, the shares trade at about 68 times earnings, against a five-year median of about 24, which looks wildly expensive. At a share price of about $12.61 on November 1, 2026, at the top of its 52-week range and nearly double its 52-week low of $6.67, both screens are describing the same $1.9 billion of market value and the same $3.8 billion enterprise value, which adds debt and subtracts cash.[^18]
The contradiction dissolves once one remembers what depreciation does to a hotel owner's earnings. The price-to-earnings ratio is unusually high because GAAP earnings are depressed by real-estate depreciation and preferred dividends, and it is a particularly unstable measure for a lodging REIT. A better starting point is enterprise value relative to EBITDA, about 11.4 times, and adjusted funds from operations per share. In the second quarter of 2026 RLJ produced adjusted FFO of $0.52 per diluted share, up 8.3% from a year earlier, and its full-year guidance range was $1.37 to $1.50.[^2] At the share price above, that puts the stock at roughly eight to nine times the guided adjusted FFO, a multiple that implies the market expects modest growth and assigns some discount for leverage. These figures are data, not a conclusion. RLJ's peers own different hotels with different leverage, and any comparison has to account for both.
The case, then, turns less on GAAP P/E than on sustainable hotel EBITDA and adjusted FFO after the hotels have been maintained and the lenders paid. To weigh it properly, it helps to step back and ask what kind of business this is in structural terms.
The forces and powers behind the room rate
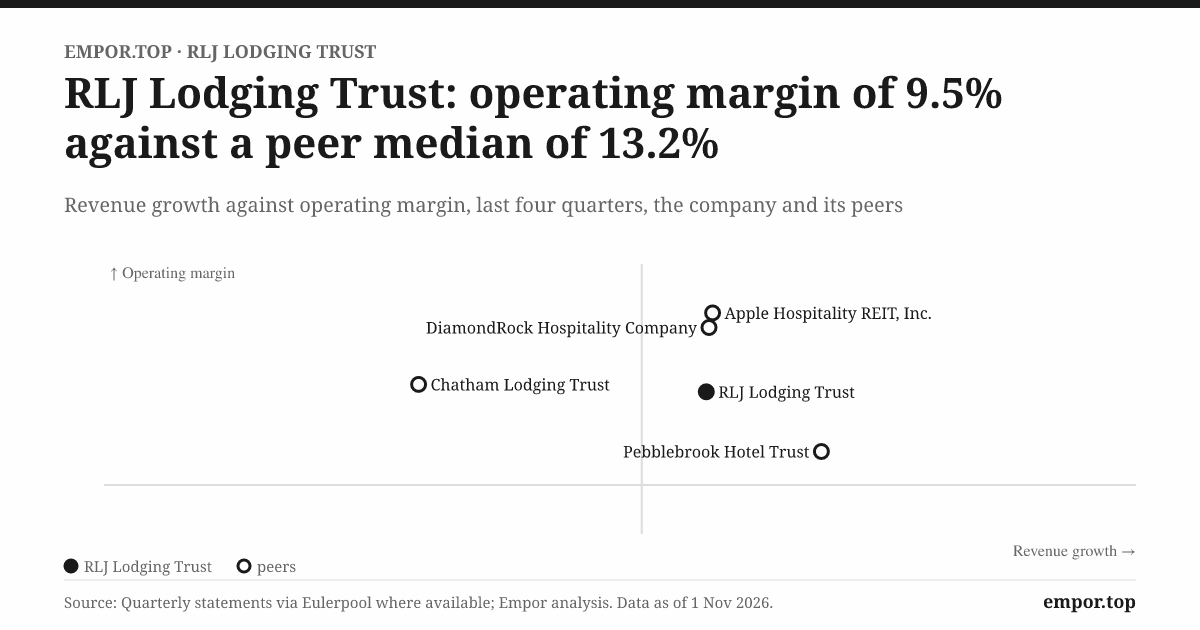
Start with the five competitive forces. Buyer power is high in the aggregate, because guests compare prices instantly and switch freely; the company reports no meaningful customer concentration.1 Supplier power is substantial: brands and managers control distribution and operations, while fees and labor costs pressure margins.1 The threat of new entrants is moderate and local: in dense urban markets high construction costs limit new supply, while in suburban and secondary markets a new hotel can open within a couple of years. The threat of substitutes is real at the edges, from short-term rentals to virtual meetings that replace business trips, though nothing replaces a room in the right place for a traveler who must be there. Rivalry is intense and constant, conducted hotel by hotel and night by night. Taken together, these forces describe an industry where returns depend on location and cycle more than on any company-specific edge.
Hamilton Helmer's seven powers framework, which asks what lets a company earn persistently higher returns than its competitors, gives a sharper result. Scale economies exist at the corporate level, as the FelCor overhead savings showed, but they reduce costs that are small relative to hotel-level expenses. Network effects do not apply to a hotel owner; they belong to the brands' loyalty programs. Counter-positioning, a business model incumbents cannot copy without hurting themselves, is absent, because RLJ's model is the industry standard. Switching costs are negligible for guests. Branding power exists, but it belongs to Hilton and Marriott, and RLJ rents it. Process power, a superior way of running assets that others cannot copy, would show up in consistently higher margins or share gains than peers, and the company does not disclose evidence of that. The one power with some support is cornered resource, in the form of scarce urban sites; it protects individual hotels, not the company.
That framework points to the same conclusion: RLJ has no company-wide moat, and its returns will track the cycle, local supply and the quality of its capital decisions.
Two investors, one set of hotels
The bull case is easy to state and grounded in recent evidence. In the second quarter of 2026, RevPAR, Hotel EBITDA and adjusted FFO all grew, and most of the RevPAR gain came from rate rather than occupancy.[^2] Management raised full-year guidance substantially. Urban business and leisure demand were improving, and recently renovated hotels were contributing. The refinancing cleared the calendar until 2029. If the recovery persists, a hotel portfolio with high operating leverage could convert rising revenue into much faster EBITDA growth, and a stock trading below book value with a single-digit multiple of adjusted FFO would have room to re-rate. A notable vote of confidence comes from the shareholder register: Donald Smith & Co., a value-oriented investment firm, held about 8.6% of the shares as of early 2026, alongside index giants Vanguard and BlackRock.6
The bear case is equally grounded. In 2025 comparable RevPAR and occupancy fell and rates stalled, which is precisely the behavior of a portfolio without pricing power.1 Over the decade from 2015 to 2025, revenue grew only about 1.7% a year, a figure distorted by asset sales and the pandemic but hardly a record of compounding.1 Renovation spending has run at about 10% of revenue for years, and no project-level disclosure proves that it earns its cost. The balance sheet is still carrying roughly $2.2 billion of debt, a large share of it floating with rates, plus ground leases and preferred stock ahead of common shareholders. In 2025 free cash after property improvements barely covered the dividend. On this view, the stock's apparent cheapness reflects real claims on cash, not an overlooked opportunity.
An activist looking at RLJ would likely push on three points. The first is buybacks while leverage is high: why repurchase stock when debt is the binding constraint? The second is disclosure: why not publish hotel-level returns on renovations, so shareholders can judge the largest discretionary use of capital? The third is portfolio focus: if some hotels consistently earn less than their capital costs, why hold them rather than sell them and reduce debt? None of these is a criticism of current execution. Each is a question the company could answer with more data.
Three measures will tell investors which case is winning. The first is comparable RevPAR growth, split between rate and occupancy; it fell in 2025 and rose 6.8% in the second quarter of 2026, with rate doing most of the work.[^2]1 The second is comparable Hotel EBITDA margin, which reveals whether rising revenue is outrunning cost inflation; in the second quarter, Hotel EBITDA grew a little faster than revenue.[^2] The third is adjusted FFO per share after recurring capital spending and financing costs, which grew 8.3% in the quarter.[^2]
The decision rule follows. The recovery thesis strengthens if full-year 2026 RevPAR and EBITDA meet the raised guidance and cash after maintenance improves materially. It weakens if occupancy or rate growth reverses, margins compress, or renovation spending fails to show property-level payback. Everything else is commentary.
XI. Lessons From a Hotel Portfolio That Can't Stop Aging
The 2020 and 2025 downturns showed that durable real estate does not make for durable revenue. Anyone who values a hotel owner as if it were a landlord with long leases is pricing the wrong asset.
Depreciation is non-cash; renovation is not. For founders and investors in any physical business, the lesson is the same: the right measure of cash generation is what remains after keeping the asset competitive, not before.
Scale can lower overhead, but it cannot manufacture a guest. The FelCor merger showed that cutting the cost of a head office is not the same as earning a return on every acquired room.
A refinancing moves the calendar; operating cash changes the risk. The 2026 refinancing bought time, and that time is genuinely valuable. But time is only an option, and its value depends on what the hotels do with it. Maturity relief matters most when the underlying properties can fund their own upkeep and every claim ahead of the common shareholder. If they cannot, the next refinancing simply moves the same question further down the calendar.
XII. Epilogue
Tonight RLJ stands in a better position than it did a year ago. It has a strong quarter behind it, a raised forecast in hand, about $1 billion of liquidity, and no debt maturities until 2029.[^2] Its 2026 guidance calls for comparable RevPAR growth of 3.5% to 4.5% and adjusted FFO of $1.37 to $1.50 per diluted share.[^2] On the surface, the recovery story is working.
The next moments that will decide whether it lasts are already on the calendar. The first is the full-year 2026 result, when investors will see whether comparable RevPAR and Hotel EBITDA landed within the raised range. A miss would suggest the second quarter was a strong season rather than a turning point. A beat, followed by guidance for 2027 that implies continued growth, would support the idea that demand has genuinely recovered.
The second is the cash test. Investors should watch adjusted FFO per share, and more importantly cash after recurring capital spending, interest and preferred dividends, compared with what RLJ pays in common dividends and spends on buybacks. If renovation spending settles at the lower level guided for 2026 while operating cash rises, the thin cushion of 2025 should widen into a margin of safety. If capital spending creeps back up while operating cash stalls, the dividend will once again depend on asset sales.
The third is the renovation evidence. RLJ has invested heavily in its hotels, and management attributes part of the recent strength to that investment. The test that would settle the question is hotel-level data showing post-renovation RevPAR and EBITDA uplift against the capital spent, measured over a full year. Portfolio averages and management attribution are not enough.
The fourth is the balance sheet. Net debt relative to EBITDA and fixed-charge coverage should improve through the refinancing runway. By the time the 2029 maturities approach, RLJ will either have a stronger balance sheet funded by better hotel earnings, or it will face another round of refinancing on whatever terms the market offers then.
What would change the verdict is clear. A recovery that funds both better hotels and a more resilient balance sheet would show that RLJ's strategy of renovating and recycling its portfolio can generate durable returns. Another round of selling assets and moving maturities to preserve the payout would show the opposite: a company running hard to stay in place. The tension that remains is that both outcomes are plausible, and one strong quarter cannot yet tell them apart.
XIII. Outro
Go back to the room where this story began. The guest has checked out. Housekeeping has stripped the bed, wiped down the desk, and restocked the coffee. Somewhere down the hall, a floor that just came out of renovation smells of fresh paint and new carpet. By late afternoon the room is ready again, priced and waiting, exactly as it was the night before.
That is RLJ in a single image: an owner of buildings that can last for decades, in a business that must win its customers every night. The real estate stays; the revenue must be won again tomorrow. RLJ's wager is that better rooms in the right places can outlast the night-to-night uncertainty of who checks in.
References
-
RLJ Lodging Trust Form 10-K for fiscal year 2025 — SEC, 2026-02-27 ↩↩↩↩↩↩↩↩↩↩↩↩↩↩↩↩↩↩↩↩↩↩↩↩↩↩↩↩↩↩↩↩↩↩↩↩↩↩↩↩↩↩↩↩↩↩↩
-
RLJ Lodging Trust Q2 2026 Earnings Call Transcript — Stock Analysis, 2026-08-07 ↩↩↩↩↩↩
-
RLJ Lodging Trust Form 10-Q for the quarter ended June 30, 2026 — SEC, 2026-08-07 ↩↩↩↩↩↩↩↩↩
-
Pebblebrook Hotel Trust Form 10-K for fiscal year 2025 — SEC, 2026 ↩↩
-
Host Hotels & Resorts 2025 Annual Report — Host Hotels & Resorts, 2026 ↩↩
-
RLJ Lodging Trust 2026 Proxy Statement — SEC, 2026-03-23 ↩↩↩↩↩↩↩↩↩↩↩↩↩↩
-
RLJ Lodging Trust Form S-4 merger proxy for the FelCor transaction — SEC, 2017 ↩↩↩↩
-
Leslie Hale's Pioneering Career — Nareit REIT Magazine, 2018 ↩↩↩↩↩
-
RLJ Lodging Trust Form 10-K for fiscal year 2020 — SEC, 2021-02-26 ↩↩↩↩↩↩↩
-
North American Corporate Rating Component Scores — S&P Global Ratings, 2024-06-30 ↩
-
RLJ Lodging Trust 2026 Annual Meeting Voting Results, Form 8-K — SEC, 2026 ↩
 LinkedIn
 WhatsApp
 Reddit
 Hacker News
 Email
 Kindle
 RSS Feed
 Spotify
 Apple Podcasts
 Amazon Music
 Audible
 YouTube