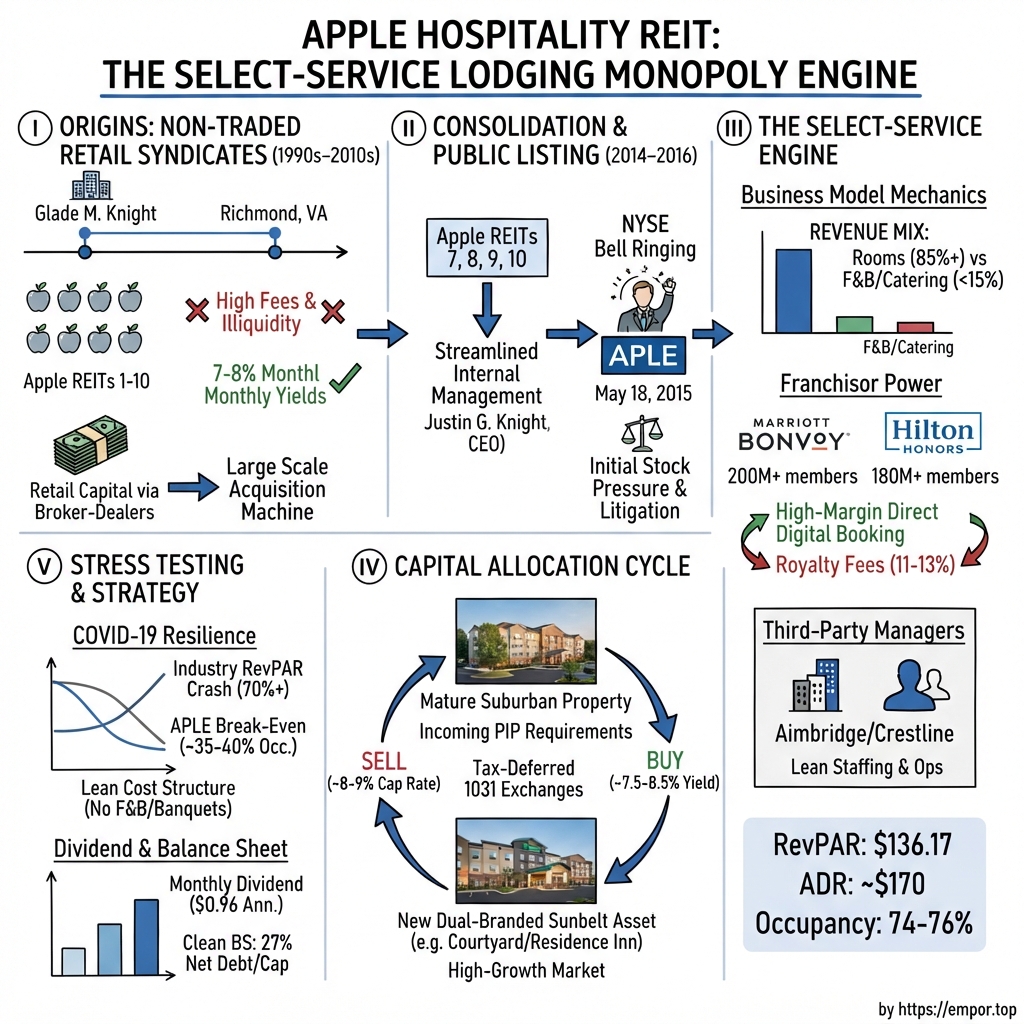
Apple Hospitality REIT: The Select-Service Lodging Monopoly Engine
I. Introduction & Episode Roadmap
There is a building at 814 East Main Street in Richmond, Virginia, that houses one of the largest hotel portfolios in the United States. Inside it, as of the end of 2025, worked exactly sixty-four people.2
Sixty-four. That is the entire corporate headcount of Apple Hospitality REIT — a company that owns 216 hotels containing roughly 29,500 guest rooms spread across 83 markets in 37 states and the District of Columbia, carrying a market capitalization of roughly $3.9 billion in late August 2026.123 Not one of those sixty-four employees changes a bed sheet, checks in a guest, or answers a front desk phone. Not one of them owns a hotel brand. Apple Hospitality does not employ hotel workers, operate hotels, or market properties under its own name. Instead, the REIT owns the real estate, franchises the brands, hires the operators, and retains the cash flow.
That business model functions with straightforward simplicity: Apple Hospitality acquires, holds, renovates, and periodically recycles upscale, rooms-focused hotels — such as Courtyard, Hampton Inn, Hilton Garden Inn, and Residence Inn properties across suburban America — under franchise agreements with Marriott and Hilton, outsourcing day-to-day operations to sixteen unaffiliated third-party management companies.2 This operational structure eliminates two cost drivers that historically compressed lodging returns: the heavy labor and food-and-beverage overhead of full-service convention hotels, and the marketing expenditure required to build consumer brand recognition.
The resulting operating margin structure stands out within the lodging sector. In the second quarter of 2026, Apple Hospitality generated a comparable hotels adjusted hotel EBITDA margin of 38.1% on revenue per available room (RevPAR) of $136.17.1 Over the same period, Summit Hotel Properties — its closest listed peer — delivered a 36.4% margin on nearly identical RevPAR of $136.06.21 Meanwhile, Host Hotels & Resorts, which holds luxury full-service and resort properties generating nearly twice the revenue per room, reported a comparable hotel EBITDA margin of 28.9% for full-year 2025.20 Delivering a room at $170 a night with a complimentary breakfast buffet and no banquet kitchen yields superior bottom-line conversion compared to selling a room at $250 with attached conference facilities.
This operational case study is relevant for two central reasons.
First, select-service lodging serves as a clear testing ground for a fundamental commercial real estate question in 2026: how operating margins adapt when labor costs, insurance premiums, and construction expenses rise simultaneously. Apple Hospitality has provided an eleven-year public track record of performance under these conditions.
Second, the company's origin story remains distinct. Apple Hospitality was not founded through institutional private equity. Instead, it was built sequentially through retail investor capital across Virginia and Long Island, distributed via independent broker-dealers at a fixed, non-appraised price of $11.00 per unit — a pricing model the Securities and Exchange Commission later cited in a settled enforcement order as "arbitrarily established."6 Founder Glade M. Knight launched eight successive Apple entities over two decades, and his son, Justin G. Knight, directs the public REIT today. The evolution from a commission-heavy syndicate structure to an S&P SmallCap 600 constituent with BlackRock and Vanguard as its primary shareholders4 represents a complex structural transition.
The story follows a clear progression. First, the syndicate era: how the Apple program raised billions from retail investors, the cost of that capital, and the regulatory findings. Second, the consolidation and 2015 New York Stock Exchange listing, including the internal buyout of advisory entities. Third, the select-service platform — franchise economics, third-party management structures, and margin durability metrics. Fourth, capital allocation: asset recycling playbooks and recent 2026 portfolio decisions. Fifth, stress testing — operational responses to pandemic disruptions, labor inflation, and insurance market shifts. Sixth, competitive dynamics analyzed through Helmer and Porter frameworks. Finally, the bear case, risk factors, and key operational metrics monitoring future performance.
The narrative begins in Richmond in the 1990s, with a sponsor who had launched and sold one REIT and was structuring the next.
 Subscribe on LinkedIn
II. The Origins: Glade Knight, Non-Traded REIT Syndicates, & The 10-Apple Architecture (1990s–2010s)
Glade M. Knight was not a hotelier. He was a capital raiser who happened to like real estate.
Before there was ever an Apple anything, Knight founded and ran Cornerstone Realty Income Trust, a Virginia REIT that owned apartment communities across Virginia, the Carolinas, Georgia and Texas. He served as its chairman and chief executive from 1993 until it merged into Colonial Properties Trust in 2005, then stayed on as a Colonial trustee until 2011.4 Along the way he became founding chairman of Southern Virginia University and a founding member of Brigham Young University's entrepreneurial department at its graduate business school — biographical details that matter less as trivia than as a map of the distribution network he would later tap.4
The insight Knight acted on in 1999 was not about hotels as buildings. It was about hotels as a product that could be sold to a specific kind of investor. Institutional capital in the late 1990s wanted trophy assets — the convention hotels, the urban boxes with 40,000 square feet of meeting space. What it largely ignored was the suburban interstate exit with a Hampton Inn and a Courtyard by Marriott, serving the regional sales rep on a Tuesday and the youth soccer family on a Saturday. Those hotels had no ballrooms, no unionized banquet staff, no celebrity chefs, and — critically — no need for any of them.
The Apple Program
The architecture Knight built was a sequence, not a company. Each fund raised money, bought hotels, held them, and eventually either sold to a third party or merged into a successor. The lineage, as the company itself lays it out, ran: Apple Suites, formed in 1999, merged into Apple Hospitality Two in January 2003; Apple Hospitality Two, formed 2001, sold to an affiliate of ING Clarion in May 2007; Apple Hospitality Five, formed 2002, sold to Inland American Real Estate Trust in October 2007; Apple REIT Six, formed 2004, sold to an affiliate of Blackstone Real Estate Partners VII in May 2013; Apple REIT Seven (2005) and Apple REIT Eight (2007), both merged into Apple REIT Nine in March 2014; Apple REIT Nine itself, formed in 2007, which was renamed Apple Hospitality REIT and is the entity trading today; and Apple REIT Ten, formed in 2010 and merged in during September 2016.4
Eight vehicles, one sponsor, one distribution channel. The money came not from pension funds but from retail brokerage clients, sold through independent broker-dealers — most consequentially David Lerner Associates, a Long Island firm that served as managing dealer for the later funds.5 The pitch was straightforward and, for a certain investor, irresistible: a fixed price per unit that never moved, a monthly distribution in the 7–8% range, and real hotels behind it. No screen flashing red. No mark-to-market anxiety. Just a check.
The trade-off was liquidity, and the price of that trade-off was steep. Apple REIT Ten is the cleanest example because its full life cycle is disclosed. From its initial capitalization in August 2010 through the close of its best-efforts offering on July 31, 2014, it sold 96.1 million units for gross proceeds of approximately $1.1 billion. It incurred roughly $109.1 million of offering costs, of which about $105.2 million was selling commissions and the marketing expense allowance paid to the managing dealer. Net proceeds to the company: approximately $943.0 million.5
Read that again slowly. Of every dollar an Apple REIT Ten investor wired in, somewhere near ninety cents reached the balance sheet available to buy hotels. Roughly a dime went to distribution before a single key was purchased. That is not an accusation; it is the disclosed arithmetic of the non-traded REIT model as it existed in that era. But it is the single most important number in understanding what these investors actually owned, because it means the underlying real estate had to appreciate roughly 11% just to get the investor back to par.
Testing the Claim: Was This a Wealth-Creation Engine?
The generous version of the Apple story holds that the structure was an unusually disciplined engine — a sponsor who bought real assets in real markets, paid real distributions, and delivered liquidity events. The record supports parts of that and refutes others, and it is worth being precise about which is which.
What actually happened to the money is knowable. When Apple REIT Six shareholders approved the Blackstone merger in May 2013 — with roughly 97% of votes cast in favor — the company disclosed that it had originally sold units at $10.50 to $11.00, and that since inception it had paid approximately $7.29 per unit in distributions, totaling about $589 million, on a portfolio of 66 hotels with 7,658 rooms across 18 states.22 Investors got their income. Nine years of it. What they did not get was capital appreciation. Apple REIT Ten's holders, when their fund merged into the public company in 2016, received 0.522 Apple Hospitality shares plus $1.00 in cash for each unit.10 With Apple Hospitality shares closing near the high-eighteens on the effective date, that package was worth roughly what the $11.00 unit had cost — no more.
So the honest verdict on the "wealth creation" claim is narrow: the Apple funds were income vehicles that returned capital at or near par after long, illiquid holding periods. They were not compounding machines. For a retiree who wanted a monthly check and did not need the principal to grow, that may have been an acceptable bargain. For anyone told these were growth investments, it was not.
And some were told exactly that. In May 2011, FINRA filed a complaint against David Lerner Associates alleging that the firm solicited thousands of customers into the illiquid Apple REIT Ten without adequate due diligence into suitability, using misleading marketing materials and performance figures, and targeting unsophisticated and elderly investors. The regulator's account described the firm's principal characterizing the Apple REITs at investment seminars as a "fabulous cash cow" and a "gold mine," and making unfounded predictions of a merger-and-listing "windfall." In October 2012, the matter resolved with the firm ordered to pay over $12 million in restitution to Apple REIT Ten customers plus $2.3 million in fines for unfair pricing in unrelated securities; David Lerner personally accepted a one-year industry suspension, a subsequent two-year principal suspension, and a $250,000 fine.7
That action was against the distributor, not the issuer. The issuer's own reckoning came on February 12, 2014, when the SEC instituted settled cease-and-desist proceedings against Apple REIT Six, Seven, Eight and Nine, their four affiliated advisors, Glade Knight as chief executive, and Bryan Peery as chief financial officer.6 The findings are worth stating plainly because they go directly to governance quality under the current management regime's predecessor. The Commission found that the REITs sold units in blind-pool offerings at what public disclosures described as "an arbitrarily established offering price of $11.00 per unit," then ran dividend reinvestment plans at that same $11.00 price while representing to unitholders that the DRIP price "would be based on the fair market value" of the units as determined in good faith by the boards. The registration statements failed to disclose that the $11.00 figure rested on no appraisal or valuation methodology, and that in a non-traded REIT the last price paid by an unrelated buyer is not a meaningful estimate of realizable value.6 The order also addressed undisclosed related-party transactions — short-term cash transfers between the REITs to meet liquidity needs, and commercial loans personally guaranteed by Knight between 2008 and 2011 — as well as deficient disclosure of executive compensation paid by the advisors.6
The respondents settled without admitting or denying the findings. Civil penalties totaled roughly $1.5 million, borne by the advisory entities and the individuals rather than by the REITs themselves: Apple Six Advisors paid $437,500, Apple Seven Advisors $375,000, Knight $125,000, and Peery $50,000.6
Weighing It
How much should a 2026 investor weight a 2014 settlement about 2008–2011 conduct? Three things argue for discounting it: the conduct predates the public company's existence in its current form; the disclosure failures were about a non-traded structure that no longer exists; and there has been no comparable enforcement action against the listed entity in the twelve years since. Three things argue against dismissing it entirely: the chief executive named in the order remains Executive Chairman today; the specific failure mode — related-party arrangements and pricing determined by insiders rather than by markets — is precisely the failure mode a controlled, family-led REIT is most exposed to; and, as the current proxy still states in plain language, the company "has engaged in, and is expected to continue to engage in, transactions with related parties" that "cannot be construed to be at arm's length."4
The calibrated conclusion: the non-traded era built genuine scale and paid genuine income, but it did so at a friction cost of roughly ten cents on the dollar and under a disclosure regime that regulators found materially deficient. That history does not condemn today's company. It does mean an investor should treat related-party disclosure and board independence as live diligence items rather than settled ones — a point returned to in Section VIII.
By 2013, with Apple REIT Six sold to Blackstone and the enforcement matters converging, the sponsor faced an obvious question. Three funds remained under management, the non-traded model was under regulatory siege, and the retail spigot was closing. What do you do with $5 billion of hotels and no exit?
III. The Consolidation Crucible & Going Public: Restructuring & The NYSE Listing (2014–2016)
The answer was a forced march: collapse the funds into a single entity, buy out the external manager, and ring the bell at the New York Stock Exchange.
Between August 2013 and September 2016, that execution unfolded out of necessity rather than pure strategic choice. The mechanics moved quickly. On March 1, 2014, Apple REIT Seven and Apple REIT Eight merged into Apple REIT Nine, which promptly renamed itself Apple Hospitality REIT.4 The transaction added 99 continuing hotels with 12,121 rooms across 27 states. To complete the merger, Apple Nine issued roughly 90 million common shares to Seven and Eight unitholders, valuing the consideration at approximately $1.8 billion based on an estimated fair value of $20.20 per share.8 Shortly thereafter, the company executed a two-for-one reverse share split, consolidating 372.2 million shares into 186.1 million — a standard cosmetic step before a public listing to convert an $11 non-traded unit into an institutionally palatable share price.8
The Price of Getting Free
The internalization of management marked the true financial shift in the roll-up — a step often simplified in company narratives.
Like most non-traded REITs of that era, the Apple funds were externally managed, paying recurring management fees to a sponsor-owned entity. Transitioning to a self-advised structure is generally shareholder-friendly, but eliminating external contracts comes at a cost. Upon closing the Seven and Eight mergers, the advisory contracts terminated, triggering the conversion of the sponsor’s Series B convertible preferred shares into roughly 5.8 million common shares. Apple Hospitality recorded a non-cash expense of approximately $117.1 million in the first quarter of 2014 to reflect the fair value of that conversion at $20.20 per share.8
That nine-figure expense represented the cost of terminating the external advisory relationship, paid directly in equity to insider affiliates. The $117.1 million charge flowed through the 2014 income statement under "Series B convertible preferred share expense," driving reported net income down to $6.8 million from $115.2 million in 2013 — a decline driven entirely by internalizing management rather than deteriorating hotel operations.8
While Series B conversion terms were disclosed in original offering documents, the net financial effect was clear: unitholders funded a $117.1 million equity transfer to sponsor affiliates to eliminate future management fee streams. The economic merit of that trade depended on the present value of the avoided fees, a figure management did not separately break out.
Legal challenges followed the consolidation. In April 2014, unitholders filed Moses v. Apple Hospitality REIT, a class action representing Apple Seven and Eight investors who acquired shares via dividend reinvestment plans between July 2007 and February 2014, alleging DRIP pricing deficiencies similar to those cited by the SEC. The parties agreed in principle to settle in January 2017 for $5.5 million.11 In July 2016, a derivative suit, Quinn v. Knight, was filed in the Eastern District of Virginia by an Apple REIT Ten unitholder against directors, officers, and the company. That litigation settled in November 2016 for $32 million gross, with $10 million recovered from directors-and-officers insurance, leaving a net $22 million expense.11 An earlier consolidated class action, In re Apple REITs Litigation, was dismissed with prejudice by the Eastern District of New York in 2013, an outcome affirmed by the Second Circuit in April 2014.
While core securities claims were dismissed, the company ultimately paid $37.5 million in gross cash settlements across merger- and DRIP-related claims. The consolidation was not a seamless transition, but a complex restructuring that required substantial cash settlements to resolve investor litigation.
May 18, 2015
The public debut arrived on May 11, 2015, when the company announced approval to list on the New York Stock Exchange under ticker APLE, beginning trading on May 18. At listing, the portfolio held 173 hotels and 22,003 guest rooms across 32 states.9 Executive leadership had already transitioned: Justin G. Knight, who joined the Apple companies in 2000 and served as president of several funds, became chief executive in May 2014, while Glade Knight became Executive Chairman, a role he retains today.4
To manage potential selling pressure from thousands of retail investors gaining liquidity after years in an illiquid structure, the board pre-funded an exit mechanism. Concurrently with the listing, Apple Hospitality launched a modified Dutch auction tender offer to buy back up to $200 million of common stock, running from May 18 to June 22, 2015. At expiration, the company repurchased approximately 10.5 million shares at $19.00 per share for $200 million — absorbing roughly 97% of shares properly tendered at that price — funded primarily through debt facility borrowings.8 A separate $500 million share repurchase program took effect on July 8, 2015.8
This capital markets structure offered legacy investors immediate liquidity at a fixed price rather than allowing uncoordinated selling to depress share prices post-listing. While it absorbed substantial supply, public trading remained volatile: after trading between $17.03 and $19.45 in the second quarter of 2015, the shares dropped to a low of $13.82 in the third quarter before rebounding to end 2015 at $19.97.8
The final consolidation step occurred on September 1, 2016, when Apple REIT Ten merged into the listed company. Each Apple Ten unit converted into 0.522 Apple Hospitality shares plus $1.00 in cash. The transaction brought total enterprise value to approximately $5.7 billion, expanding the portfolio to 236 hotels with over 30,000 guest rooms across 33 states and 96 metropolitan areas.10 At the time, Justin Knight framed the deal as expanding the platform of Hilton and Marriott select-service assets while maintaining a conservative capital structure.10
What the Record Says
The central claim of the restructuring was that consolidation and internalization aligned insider interests with public shareholders and unlocked enterprise value. Evaluating that claim reveals a nuanced outcome.
Alignment was largely achieved: insider compensation shifted from external fee streams to direct equity ownership, with Glade Knight holding a 4.6% personal stake and Justin Knight holding 1.0%, tying executive wealth directly to share performance.4 Unlocking capital value proved more modest. By late August 2026, eleven years post-listing, the stock traded at $16.55 — below the $19.00 Dutch auction repurchase price and below its 2015 year-end close of $19.97.238 Long-term unitholders achieved total returns primarily through dividend distributions rather than share price appreciation. While consistent with an income-focused real estate allocation, the share price trajectory indicates that public listing alone did not drive structural multiple expansion for suburban select-service hotel real estate.
That track record frames a central operational question: if the underlying assets generate strong operating margins, what factors constrain public market equity valuation? Understanding that dynamic requires examining the operational and economic structure of the hotel portfolio itself.
IV. The Select-Service Engine: Industry Structure, Franchisor Power, & Operating Mechanics
Walk into a Hilton Garden Inn off a highway exit outside Nashville at seven in the morning. There is a front desk with one person behind it. There is a breakfast area where a single attendant restocks waffle batter and cut fruit. There is a small fitness room, a pool that nobody is using, and a business center consisting of a single printer. Upstairs sit 130 guest rooms, where the housekeeping crew represents the building's single largest operational expense.
There is no banquet department, no room service, no executive chef, and no convention floor requiring a full sales staff. That absence underpins the entire investment thesis.
Rooms Are Almost the Whole Business
In 2025, Apple Hospitality generated $1.412 billion in total revenue, of which "other" revenue — parking, cancellation fees, small meeting space, and sundries — accounted for $68.3 million.2 Rooms generated the remaining $1.34 billion, or roughly 95% of the top line. That represents a significantly higher room concentration than the traditional select-service benchmark, explaining its operational dynamics downstream. Food and beverage service is not a minor division here; for all practical purposes, it does not exist.
That structural difference is critical because food and beverage operations tend to dilute hotel profitability. Banquet operations demand kitchen staff, servers, inventory management, waste control, and dedicated sales teams to fill ballrooms — typically converting a dollar of revenue into roughly 25 cents of profit, compared to nearly 70 cents for a room night. Selling rooms without food service produces a structurally superior margin profile.
Operating results illustrate that conversion efficiency. In the second quarter of 2026, Apple Hospitality converted approximately 58 cents of every incremental revenue dollar into comparable hotels adjusted hotel EBITDA — a flow-through rate highlighted by management that drove 120 basis points of margin expansion to 38.1%.31 Comparable total revenue rose 6.2% to $402 million, while adjusted hotel EBITDA grew 9.7% to $153 million.3 Revenue expanded, and profit expanded nearly half again as fast.
Comparing those results with full-service peer performance demonstrates the structural divide. Host Hotels & Resorts, which owns luxury and upper-upscale properties generating comparable RevPAR of $229.24 in 2025, delivered a comparable hotel EBITDA margin of 28.9% that year.20 By contrast, Apple Hospitality recorded a 34.3% margin in 2025, even as its RevPAR declined.13 That represents a structural margin advantage of nearly six percentage points at roughly half the revenue per room — a direct consequence of eliminating full-service operational overhead.
Renting the Demand Engine
The counterpart to this model is that Apple Hospitality owns no consumer brand. Its properties operate under established national names, requiring substantial franchise fees for market distribution.
Franchise agreements carry initial terms of 10 to 30 years, requiring royalty, marketing, reservation, communications support, and loyalty program fees calculated as percentages of room revenue.2 In 2025, franchise fees totaled $62.6 million, while sales and marketing expenses absorbed another $127.0 million.2 Combined, those two line items consumed roughly 14 cents of every room revenue dollar.
That expenditure secures direct access to global customer acquisition systems. Marriott's Bonvoy program reached nearly 271 million members by year-end 2025, with member bookings generating 75% of Marriott's room nights across the U.S. and Canada.18 Hilton reported over 243 million Honors members.17 Marriott alone franchised or licensed 7,644 properties comprising more than 1.18 million rooms at year-end 2025.19
This scale reflects directly in Apple Hospitality's booking mix. In the second quarter of 2026, brand.com — the franchisors' direct websites and mobile apps — represented the single largest booking source at 40% of room nights, up 80 basis points year-over-year, providing both the lowest distribution cost and high average daily rates.3 Online travel agencies charging mid-teens commissions remained flat at 13% of the mix.3 Global distribution system bookings through corporate travel agents rose 100 basis points to 18%, signaling a recovery in corporate travel demand.3
Franchise payments function as an investment in specialized demand distribution that an independent suburban hotel could not replicate. However, bargaining leverage remains concentrated with Marriott and Hilton, which control royalty structures, brand standards, and mandatory property renovation cycles.
As of mid-2026, the portfolio comprised 114 Hilton-branded, 96 Marriott-branded, and 5 Hyatt-branded hotels, alongside 1 independent property.1 At year-end 2025, brand distribution was concentrated in Hilton Garden Inn (39 properties), Courtyard by Marriott (34), Hampton Inn (34), Residence Inn (30), and Homewood Suites (27).2
The Operators, and a Correction Worth Making
Real estate investment trust regulations prohibit direct hotel operation by the trust, requiring property management through third-party operators via taxable REIT subsidiary structures. Rather than relying on mega-operators, Apple Hospitality's 16 management companies at year-end 2025 were led by regional firms: LBAM-Investor Group (32 hotels), Dimension Hospitality (30), Crestline Hotels & Resorts (25), Raymond Management (21), Hersha Hospitality Management (19), and Texas Western Management Partners (16).2 National third-party operators Aimbridge and Highgate do not manage any portfolio properties.
Management contracts also differ from industry standards. Approximately 81% of properties operate under variable fee structures with initial terms of one to two years, charging 2.5% to 3.5% of gross revenues based on performance metrics.2 Management indicates that this single variable structure aligns incentives more effectively than traditional base-plus-incentive models. Total management fees reached $47.1 million in 2025.2
Short contract terms allow rapid operator reallocation. After reallocating nine hotels among existing managers in 2025, Apple Hospitality completed a larger transition in January 2026, shifting hotels previously operated by Marriott affiliates to independent third-party management.213 The transition covered 13 Marriott-managed properties representing approximately 8% of adjusted hotel EBITDA, including nine properties identified in the 2025 10-K.32 In the second quarter of 2026, this transitioned group achieved RevPAR growth exceeding 7% and adjusted hotel EBITDA margin expansion above 300 basis points, contributing roughly 15 basis points to total same-store margins.3
Executive leadership noted that regional operator consolidation improved cost management, observing that Marriott's internal management structure had proven less efficient for select-service asset profiles.14 Unencumbering properties from brand management contracts also enhanced asset marketability for prospective buyers.14
Testing the Margin Moat
Select-service cost structures remain exposed to broader demand shifts. The performance record in 2025 demonstrated that operational leverage impacts earnings during revenue contractions.
In 2025, comparable hotel RevPAR declined 1.6% to $117.95, occupancy fell 1.6% to 74.1%, adjusted hotel EBITDA decreased 6.4% to $474.2 million, and EBITDA margin compressed 190 basis points to 34.3%.13 Net income dropped 18.1% to $175.4 million, while MFFO per share declined 5.6% to $1.52.13 Fourth-quarter margins contracted 210 basis points to 31.1%.13 Revenue reductions stemmed primarily from lower government demand — with same-store government room nights down 12% — and a 5% to 6% drop in corporate contract bookings linked to federal spending reductions and the late-2025 government shutdown.14
Because roughly half of hotel operating costs are fixed, single-digit revenue declines caused a 190-basis-point margin drop and a mid-teens net income decline. The select-service model offers operational efficiency rather than complete immunity to demand shocks.
However, variable cost management remained disciplined. Wage inflation stabilized across late 2025 and early 2026. Fourth-quarter 2025 payroll per occupied room rose 3.5% to $43, while contract labor expense fell 14% year-over-year to 7% of same-store wages.14 By the second quarter of 2026, room wage growth moderated below 3% in total and under 1% per occupied room, holding total same-store expense growth to 3.3% overall and 1.3% per occupied room.3 Cost pressures remained concentrated in utility expenses (up 9%) and repairs and maintenance (up 6%).3
Property insurance trends also shifted. A property insurance renewal in April 2026, combined with real estate tax appeals, reduced second-quarter fixed expenses year-over-year.3 Management estimated the insurance renewal benefit at approximately $900,000 across the final three quarters of 2026.15
Capital expenditure requirements represent another ongoing call on cash flow. Brand standards enforce property renovation schedules. Reinvestment averaged 5% to 6% of total revenue historically, totaling $76.8 million in 2023, $78.3 million in 2024, and $88.2 million in 2025.2 Capital spending guidance for 2026 was raised in August from an initial $80–$90 million to $85–$95 million, covering major renovations across 18 hotels, including conversions at the Anchorage Embassy Suites and Seattle Residence Inn.3 Reinvestment absorbed roughly $88 million in 2025 compared to $240 million paid in shareholder distributions.213
In summary, Apple Hospitality maintains a structural 5 to 9 percentage point hotel EBITDA margin advantage over full-service REIT peers. However, preserving that margin requires continuous capital reinvestment driven by franchisor standards, while earnings remain vulnerable to cyclical revenue contractions.
That turns the focus to capital allocation and how management deploys surplus cash flow.
V. Capital Allocation & Portfolio Recycling: Buying, Selling, & Managing the Asset Base
In April 2026, Apple Hospitality sold a 124-room Hampton Inn & Suites in Rochester, Minnesota for approximately $8.7 million.1
It is an unglamorous transaction — a small hotel in a small market for less than nine million dollars. But the math management disclosed around it is the entire capital allocation philosophy in miniature. The sale price represented a 5% capitalization rate, or 14.5 times EBITDA, before capital expenditures. Factoring in roughly $3 million of anticipated capital improvements the buyer would inherit, the effective price was a 4% cap rate, or 19.6 times EBITDA.3
Nineteen times EBITDA for a suburban Hampton Inn. That is a valuation you would associate with a software company, not a highway hotel — and it exists only because the seller was handing over a renovation bill along with the keys.
The Recycling Playbook
This is the trade Apple Hospitality has been running for years: sell mature hotels approaching a mandated renovation, before spending the money, to buyers who value them on replacement cost rather than on cap rate, and redeploy the proceeds into something with a higher forward yield.
The 2025 vintage shows the pattern at scale. The company sold seven hotels for approximately $73 million gross, generating a $13.1 million gain.13 As a group, management disclosed, those hotels traded at a 6.5% blended cap rate — 12.4 times EBITDA before capital expenditures — and a 4.9% cap rate, or 16.5 times EBITDA, after accounting for roughly $24 million of anticipated capital improvements.14 On the other side, it acquired two hotels for $117 million and used 1031 exchanges to defer the gains: the Homewood Suites Tampa Brandon, adjacent to an existing Embassy Suites, and the Motto by Hilton Nashville Downtown, acquired in late December on completion of construction.1314
Justin Knight's account of who is buying is analytically the most interesting thing he has said on recent calls. Asked in May 2026 whether the buyer mix was changing, he described counterparties who are "primarily local owner operators who have the capacity to drive incremental margins because of their presence in market," and made the key observation that these buyers "have tended not to be cap rate bidders. Instead, they're looking more closely at value relative to replacement costs and bidding based on a revenue multiple."15
That is the arbitrage stated out loud. A public REIT is valued by the market on a multiple of cash flow. A local operator with two other hotels in the same city values the asset on what it would cost to build — and construction costs have risen sharply enough that building new rarely pencils. Selling into that bid, at multiples the public market will not pay for the same asset, is genuinely value-creative when it works.
The Development Sleeve
Apple Hospitality also buys new construction, but on unusual terms. It holds forward purchase contracts for two projects: an AC Hotel in Anchorage, Alaska at approximately $65.5 million, expected to deliver in late 2027, and a dual-branded AC and Residence Inn adjacent to its existing SpringHill Suites in Las Vegas at approximately $143.7 million, expected in the second quarter of 2028.1 In both cases the developer carries the project under a fixed-price contract, and Apple Hospitality's cash outlay occurs only at completion.3
That structure transfers construction risk and cost overruns to the developer and preserves the REIT's balance sheet until delivery. The trade-off is that fixed-price forward contracts are only available when a developer needs a certain takeout, and Knight has been candid that the supply of such deals has dried up: "it is difficult to underwrite and to find deals that pencil like the deals we currently have under contract," he said in August 2026, citing construction costs that rose faster than hotel fundamentals, tariffs, shipping and freight costs.3 He added that over the following six to twelve months the company was "much more likely to be signing up existing deals than we are to be entering into new forward commitments."3
The same forces that block Apple Hospitality's development pipeline block everyone else's, which is why management repeatedly emphasizes supply. At the end of the second quarter of 2026, 55% of its hotels had no new upper-upscale, upscale or upper-midscale product under construction within a five-mile radius.3 That figure was 59% at year-end 2025 and 57% at the end of the first quarter — and when an analyst pressed on the decline, Knight attributed it mostly to portfolio composition changes from selling out of lower-supply markets rather than to a genuine uptick in construction.1415 The willingness to give that answer rather than spin the number is a small but real credibility marker.
The Balance Sheet, and What "Low Leverage" Actually Means
Apple Hospitality carries less debt than almost any lodging peer. At June 30, 2026, total debt was approximately $1.5 billion — about 3.2 times trailing twelve-month EBITDA — at a weighted average interest rate of 4.8%, with roughly 60% fixed or hedged, $10 million of cash and $602 million of revolver availability.3 Of 216 hotels, 207 were unencumbered by mortgage debt.3 Summit Hotel Properties, by comparison, reported $1.1 billion of debt at a weighted average rate of 5.46%.21
In July 2026 the company recast its capital structure comprehensively. It amended and restated the primary unsecured credit facility, increasing capacity from $1.2 billion to approximately $1.3 billion and improving the pricing grid: a $700 million revolver maturing in 2030, a $275 million term loan maturing in 2031, and a $300 million term loan maturing in 2032. A separate $130 million term loan was increased to $160 million with its maturity extended seven years, and improved pricing was conformed across an additional $470 million of term loans. The result was a weighted average debt maturity of nearly five years, no revolver balance, and no significant unsecured maturity before 2029.3
That is genuinely strong execution, done from a position of strength rather than distress. One caveat on how the leverage is presented: the company also quotes net debt to total capitalization, which was 27.4% at mid-2026 versus 35.5% at year-end 2025.113 Nothing about the debt changed materially between those dates. The ratio improved because the share price rose roughly 40% between late March and August 2026.23 Market-capitalization-based leverage ratios flatter a company when its stock is up and punish it when the stock is down; net debt to EBITDA, at 3.2 to 3.4 times across the same span, is the more honest measure.314
Distributions, Buybacks, and the Question Worth Asking
The distribution runs at $0.08 per share monthly, $0.96 annualized. Apple Hospitality paid $57 million, or $0.24 per share, in each of the first two quarters of 2026, and $240.4 million, or $1.01 per share, across full-year 2025.313 Against 2025 MFFO per share of $1.52, that is a payout ratio near two-thirds — conservative for a REIT, and the buffer that funds renovations without borrowing.13
The yield tells its own story about the year. On the February 2026 call, management noted the $0.96 annualized rate represented approximately 7.8% on the then-current price. By early May it was about 7.2%. By August, after the share price had run, it was approximately 5.8%.14153
And here is the question a skeptical investor should put to management. In 2025, Apple Hospitality repurchased 4.6 million shares for approximately $58.3 million, including 3.4 million shares in the first half at a weighted average price of about $12.83.1316 Justin Knight described the logic explicitly: shares repurchased in 2025 were bought at roughly a 2.4-turn EBITDA discount to the multiples achieved on dispositions, and about a 6.5-turn spread after accounting for the capital expenditures avoided.14 In February 2026 he said "at current levels, we see our shares as being attractively priced."14 In May 2026, asked what would make him more aggressive on acquisitions, he answered that the company's underwriting continuously compares acquisitions against buying its own stock, and "as we look at the environment today and pricing for individual assets relative to the implied value or implied multiple in our stock, our stock still screens better."15
The company repurchased zero shares in the first and second quarters of 2026.16
During that period the stock traded as low as roughly $11.50 in late March and spent most of April between $12 and $13.50 — well below the $12.83 average paid a year earlier, and precisely the range at which management said the math favored buybacks.23 By the August call, with the shares near $16.50, Knight acknowledged the calculus had shifted: "up until recently, the map clearly pointed towards share purchases. I will tell you today there is still a gap. But the gap's shrinking."3 The repurchase authorization was extended for a year in May 2026, with $242.5 million remaining available.16
There may be good explanations — liquidity preference ahead of the July refinancing, blackout constraints, a desire to preserve dry powder while credit facility negotiations were live. Management has not offered one publicly. But an activist would frame it simply: the company articulated a clear rule for when to buy its own stock, the stock traded well inside that rule for two consecutive quarters, and nothing was bought. Then the shares rallied 40% and management said the opportunity had narrowed. That is a specific, checkable gap between stated policy and observed behavior, and it is the single strongest capital-allocation criticism available on the current record.
The falsification test for the recycling thesis, then, is not whether individual trades look smart in isolation — the Rochester and 2025 disposition multiples plainly did. It is whether the aggregate program compounds per-share value. On that measure, MFFO per share fell 5.6% in 2025 and the share price in August 2026 remained below its 2015 listing-era levels.13823 The recycling machine has demonstrably protected portfolio quality and deferred capital expenditure. It has not yet demonstrably grown earnings per share through a full cycle. The KPI to watch is MFFO per share across the next several years, not the multiple on any single sale.
Now, how does this whole structure behave when the world stops?
VI. Stress Testing the Model: Pandemics, Inflation, & Conference Call Evidence
In the second week of March 2020, hotel demand across the United States virtually ceased.
For Apple Hospitality, full-year 2020 operational metrics reflected the sudden drop: portfolio occupancy fell to 46.1%, compared to 77.0% in 2019. The average daily room rate dropped from $137.30 to $111.49, driving revenue per available room (RevPAR) down more than 51% from $105.72 to $51.34.12 The company reported a net loss of $173.2 million for the year,12 while total distributions declared for 2020 dropped to $0.20 per share — roughly $45 million in total — with virtually all of it paid prior to the operational shutdown.12
The stock reflected that severe market disruption, falling from around $16 at the start of 2020 to under $5 during the market panic of mid-March.23
What the Model Actually Did
Evaluating the platform's performance during this shock requires separating operational resilience from balance sheet limitations.
On the operational side, Apple Hospitality kept its properties open. As the company reported in its 2020 annual filing, while hotels operated at reduced service levels and staffing, every property in the portfolio remained open throughout the crisis.12 That marked a distinct operational difference from full-service and convention hotels, many of which closed entirely. A select-service hotel with a lean front-desk staff, reduced housekeeping, and no full-service restaurant can operate at low occupancy without incurring severe operating cash drains. That structure allowed Apple Hospitality to maintain baseline operations and capture essential-worker, logistics, and regional drive-to leisure demand.
However, operational continuity did not fully insulate the balance sheet. In April 2020, management determined that the REIT risked breaching financial maintenance covenants under its unsecured credit facilities in upcoming periods. On June 5, 2020, Apple Hospitality negotiated amendments that suspended covenant testing through the quarter ending June 30, 2021, in exchange for operational restrictions.12
This waiver places the REIT's conservative leverage profile in proper perspective. Entering the pandemic with one of the lowest debt burdens in the sector allowed Apple Hospitality to avoid emergency equity dilution, distressed asset sales, or formal restructuring. Yet low leverage alone did not prevent covenant stress; rather, it provided the balance sheet headroom necessary to negotiate lender forbearance on manageable terms.
The Dividend That Was Not Indestructible
The pandemic also tested the stability of the REIT's income stream. Apple Hospitality suspended its monthly distribution in March 2020. When distributions resumed in March 2021, the board declared a token payout of $0.01 per share at the end of each quarter, preserving cash rather than providing meaningful shareholder yield. Regular monthly distributions were not restored until February 22, 2022, at a rate of $0.05 per share.12
For investors reliant on steady monthly income, the distribution was effectively absent for nearly two years. While pausing payouts was a prudent decision to preserve liquidity and maintain credit agreement compliance, it demonstrated that equity distributions carry full operational risk during demand shocks.
Even with monthly distributions restored, the current $0.96 annualized rate remains below pre-pandemic levels. Management continues to emphasize that the board evaluates dividend distributions relative to portfolio performance, capital requirements, and alternative investment opportunities.3 This framing highlights that dividend payouts remain subject to ongoing board evaluation.
What the Calls Reveal
Management's earnings commentary from early to mid-2026 illustrates how guidance shifted alongside changing lodging demand.
In February 2026, Chief Executive Officer Justin Knight introduced initial full-year guidance expecting flat midpoint RevPAR growth, aligning with industry forecasts from STR for upscale and upper-midscale chain scales. Knight framed this as a measured baseline that could prove conservative given upcoming events like the FIFA World Cup and easy year-over-year comparisons following late-2025 government spending disruptions.14 Chief Financial Officer Liz Perkins expressed additional caution, noting that business transient travel recovery had shown vulnerability around federal spending cuts.14
As operating trends improved, management updated its outlook. In May 2026, following a first-quarter beat, the company raised its midpoint RevPAR growth target by 100 basis points to 1.0%.15 By August, after second-quarter results exceeded forecasts, management raised the RevPAR growth midpoint again to 3.25% and lifted its adjusted hotel EBITDA margin guidance by 75 basis points at the midpoint — projecting a 25-basis-point year-over-year margin expansion instead of the original forecast of contraction.3
Raising guidance across three consecutive calls reflects a conservative underwriting philosophy. Management consistently sets baseline expectations with built-in cushions, allowing operating beats as travel demand holds steady.
During analyst Q&A sessions, management provided specific details behind these headline adjustments. In response to inquiries from Baird analyst Michael Bellisario in February, Perkins clarified that re-incorporating a lower-margin New York asset into the same-store comparable pool distorted baseline margins by roughly 40 basis points, while actual same-store expense growth sat at 1.6% after factoring in $5 million in savings from reduced brand fees and fewer national conferences.14 Similarly, when questioned by KeyBanc analyst Austin Wurschmidt in August regarding anticipated second-half cost increases per occupied room, Perkins pointed to specific comparisons against a major late-2025 real estate tax appeal benefit and expected autumn insurance renewals.3
Second-quarter 2026 results also offered insight into specific demand drivers. While host markets for the FIFA World Cup contributed roughly 150 basis points to June RevPAR growth and 50 basis points to quarterly performance, same-store RevPAR outside those event markets still expanded by nearly 5%.3 Substantial RevPAR increases occurred in event-influenced markets such as Kansas City (up 17%) and Fort Worth–Arlington (up 16%), but strong growth was also recorded in South Bend (up 24% on midweek university group demand), Anchorage (up 17%), St. Louis (up 13%), and Chicago (up 13%).3 Overall, approximately 75% of portfolio properties achieved RevPAR growth during the quarter, up from two-thirds in the first quarter.3
Management also acknowledged regional underperformance, noting that Phoenix RevPAR declined 5% due to lower occupancy and average daily rates, driven partly by reduced travel from semiconductor corporate accounts.3
Booking channel and customer mix trends further highlighted corporate demand shifts. During the second quarter of 2026, weekday occupancy grew by 240 basis points compared to a 120-basis-point increase on weekends, reversing the post-pandemic trend where leisure travel drove outperformance.3 Simultaneously, higher-margin retail rate bookings expanded by 120 basis points to reach 33% of total occupancy mix, while contracted corporate negotiated rate bookings fell 160 basis points to 15%.3 This shift indicates that business travelers increasingly booked rooms at standard retail rates rather than pre-negotiated corporate discounts, supporting average daily rates and margin expansion during peak weekday periods.
VII. Strategic Position, Helmer's 7 Powers, & Porter's 5 Forces
Picture the value chain as three boxes and two sets of arrows.
At the top sit Marriott and Hilton, owning the brands, the reservation systems and the loyalty programs that between them count over half a billion enrolled members.1817 They send demand down into the middle box — Apple Hospitality's 216 hotels — through brand.com and the global distribution systems, at a distribution cost far below what an online travel agency would charge. In exchange they take royalty, marketing, reservation and loyalty fees off the top of room revenue, and they dictate when the carpet gets replaced.
At the bottom sit the sixteen regional management companies, who supply the labor, the systems and the market-level operating expertise. Apple Hospitality pays them a variable fee tied to performance and can replace them on short notice.
Apple Hospitality itself owns the middle: the real estate, the capital structure, and the decision rights over what to buy, what to sell, and who operates what. It is the least glamorous position in the chain and, arguably, the one with the least pricing power. Understanding why it still earns acceptable returns requires being honest about which powers it actually has.
Helmer's 7 Powers, Applied Honestly
Scale economies — real but narrower than advertised. With 216 hotels, Apple Hospitality is among the largest franchisees in both the Marriott and Hilton systems. That scale buys three concrete things. It buys procurement leverage on furniture, linens, operating supplies and technology. It buys an in-house capital projects team that renovates at lower cost per key than an owner doing one hotel at a time — management specifically credits "the scale of our portfolio, the efficient design of our rooms-focused hotels and our experienced in-house project management team" for renovation cost advantage.3 And it buys the ability to cluster hotels under a single regional operator in a market, which is exactly the synergy the January 2026 management transitions were designed to capture.14
What it does not buy is a materially cheaper management fee. The 2.5%–3.5% of gross revenues Apple Hospitality pays under its variable structure is a normal market rate, not a scale discount.2 The scale advantage here is a cost advantage of perhaps tens of basis points, not hundreds. It is real. It is not a moat.
Counter-positioning — moderate, and structurally attractive. Apple Hospitality is a pure play. It owns no convention hotels, no golf courses, no resorts, no unionized food-and-beverage operations. Host, Park and Pebblebrook cannot replicate the rooms-focused cost structure without selling the assets that define them, and their investors would not thank them for trying. That is genuine counter-positioning: the incumbent cannot copy the challenger without abandoning its own business. The six-point margin gap versus Host in 2025 is the measurable output.1320
The limit is that the position is not exclusive. Summit Hotel Properties runs essentially the identical model and posted a 36.4% hotel EBITDA margin at nearly identical RevPAR in the second quarter of 2026.21 Apple Hospitality's 38.1% is better, but by 170 basis points, not by a category.1 Counter-positioning against full-service does not confer any advantage against the other select-service owner.
Process power — plausible, partially evidenced. The claim is that Apple Hospitality has institutionalized a repeatable capability: identifying which hotels are approaching a renovation cliff, marketing them to local operator-buyers who underwrite on replacement cost, executing 1031 exchanges to defer the gains, and redeploying. The 2025 disposition results — 12.4 times EBITDA before capital expenditures, 16.5 times after — plus the April 2026 Rochester sale at 19.6 times after capital expenditures are real evidence that the capability produces outcomes competitors would envy.143
The counter-evidence is that the same skill has not yet produced compounding per-share results. Recycling that protects the portfolio but leaves MFFO per share lower than it was a year prior is competence, not power.13
The powers that are absent, and it matters. There are no switching costs at the guest level; a traveler chooses a hotel for location, price and loyalty points, and none of those attach to the owner. There are no network effects — or rather, there are enormous ones, and Marriott and Hilton own them. There is no cornered resource. And brand power, the most valuable asset in this entire value chain, sits entirely with the franchisors. Apple Hospitality rents it, annually, for roughly fourteen cents of every room-revenue dollar.2
That is the honest structural picture: a business with a durable cost advantage over one competitor set, no advantage over its closest peer, and no control over the demand engine that fills its rooms.
Porter's Five Forces
Supplier power: high, and rising in an interesting direction. Marriott and Hilton set royalty rates, brand standards and renovation mandates, and Apple Hospitality's leverage to resist is limited by the fact that de-flagging a Hampton Inn destroys most of its demand. But the relationship is not purely extractive right now. Management disclosed brand fee reductions and the elimination of brand conference costs as part of roughly $5 million of 2026 benefit.14 And when asked in August about Marriott's new "intent to recommend" incentive framework, Knight described "increased effort on the part of the brands to work with owners to find ways to drive incremental profitability" and characterized it as "a win," while carefully noting that "we do not yet know where Marriott intends to set those thresholds."3 Franchisors under pressure to sustain development pipelines have been offering key money and incentives — a cyclical softening of supplier power, not a structural one.
Buyer power: low individually, moderate in aggregate. No single traveler negotiates. But corporate travel managers do, and the 2026 mix shift shows the dynamic clearly: negotiated corporate business fell to 15% of occupancy mix while retail rate business rose to 33%.3 When demand is tight, hotels can decline the negotiated rate. When it is not — as in 2025, when government and negotiated room nights fell double digits and mid-single digits respectively — buyers regain leverage fast.14
Substitutes: moderate and specific. Short-term rentals compete for the extended-stay and family leisure traveler, particularly in suburban markets where a whole house may cost less than two rooms. They compete poorly for the Tuesday-night business traveler who wants a predictable room, a reimbursable folio and loyalty points. Apple Hospitality's exposure to extended-stay brands — Residence Inn, Homewood Suites, Home2 Suites, TownePlace Suites together account for roughly 75 hotels — is where this pressure concentrates.2 Notably, Knight has been explicit that the portfolio does not compete at the bottom: "we do not own economy or even mid scale hotels," he said in August, with portfolio ADR near $200 including the acquisitions and renovations.3
New entrants: currently the weakest force, and it is the bull case. New hotel supply is the historical destroyer of select-service returns, because these buildings are relatively cheap and fast to construct. That mechanism is presently jammed. Construction costs have risen faster than hotel operating fundamentals in most markets; interest rates are elevated relative to the 2010s; tariffs and freight costs add uncertainty.3 The observable consequence in Apple Hospitality's own portfolio is that 55% of its hotels face no new competitive construction within five miles.3 Management's framing — that low supply "meaningfully shifts the risk profile of a portfolio like ours, decreasing the downside risk and meaningfully increasing the upside potential" — is directionally sound.3 The caveat is that it is cyclical, not permanent. Construction costs will eventually normalize relative to room rates, and when they do, the same forces that block Apple Hospitality's development pipeline will unblock everyone else's.
Rivalry: high and permanent. Suburban submarkets are dense with substitutable branded product — a Courtyard, a Hampton, a Hyatt Place and a Holiday Inn Express clustered at the same interchange, each with nearly identical rooms. Differentiation is location, condition and price. This is why renovation capital is non-optional and why RevPAR index against the local competitive set is the metric operators actually manage to.
The war-game verdict: Apple Hospitality occupies a defensible but unexceptional position in a structurally competitive industry, currently enjoying an unusually favorable supply backdrop that is not of its own making. Its genuine edges are cost structure versus full-service owners, balance sheet capacity versus most peers, and transactional skill in a fragmented private market. None of those is permanent, and the largest single determinant of returns from here — new supply — is outside management's control.
VIII. The Skeptical Investor & Current Risk Radar
An activist investor evaluating Apple Hospitality would find a clear framework for a campaign letter.
The Activist Case
First: the capital allocation gap. Management has repeatedly articulated a disciplined framework in which every hotel acquisition is benchmarked against repurchasing the company's own stock. In February 2026, leadership called the shares attractively priced; in May, management noted that the stock still screened better than any available real estate asset.1415 Yet across both quarters, the REIT repurchased zero shares, even as the stock traded between $11.50 and $13.50 — below the $12.83 average repurchase price paid a year earlier.1623 By August, after the stock rallied sharply, management characterized the valuation gap as shrinking.3 An activist would highlight this disconnect between policy and practice, demanding either a systematic buyback execution tied to a disclosed valuation metric or an explicit explanation for passing on lower share prices.
Second: governance and family leadership. Apple Hospitality's board features eight nominees with tenures dating to 2007, 2014, 2015, 2018, 2021, and 2023, and ages ranging from 52 to 82.4 Three members of the Knight family hold top executive roles: Glade Knight serves as Executive Chairman, Justin Knight as Chief Executive Officer, and Nelson Knight as President of Real Estate and Investments.4 Insiders collectively hold 6.9% of total common shares, with Glade Knight personally holding 4.6% and Justin Knight holding 1.0%.4
This concentration of ownership presents a distinct dual narrative. High insider ownership aligns executive wealth with equity performance, ensuring management suffers real losses when share value declines. However, a board where five of eight members have served for a decade or more — chaired by a founder named in a 2014 SEC settlement — falls outside standard institutional governance preferences. Proxy filings disclose that Glade Knight owns Apple Realty Group, which receives support services from Apple Hospitality and reimburses the company at cost. In turn, Apple Realty Group provides services to two oil and gas partnerships, Energy 11 and Energy Resources 12, where Glade Knight serves as partner and chief executive.4 Public disclosures acknowledge that these related-party arrangements cannot be construed as arm's-length transactions.4 While the dollar amounts remain immaterial to overall financial performance, and Glade Knight's 2025 total compensation of $1.35 million declined from $1.45 million in 2024 and $1.65 million in 2023,4 the interlocking structure remains a focal point for governance scrutiny.
The underlying executive compensation structure remains performance-linked. Approximately 78% of 2025 target executive compensation was incentive-based, roughly 75% of target incentive pay was delivered in equity, and half of target incentive pay was tied directly to total shareholder return over one-, two-, and three-year periods.4 When 2025 operating results lagged expectations, incentive payouts contracted accordingly. Chief Financial Officer Liz Perkins noted on the February 2026 earnings call that corporate administrative expenses and share-based compensation came in well below target due to lower performance.14
Third: franchisor concentration. With 114 Hilton properties and 96 Marriott properties in a 216-hotel portfolio, virtually all room revenue depends on two corporate brand systems.1 If either franchisor raises royalty fees, mandates tighter operational standards, or enforces costly brand updates, Apple Hospitality has limited options beyond compliance. De-flagging a suburban select-service hotel cuts off the global loyalty network that drives 40% of room nights directly through brand channels.3 Management occasionally changes brand flags, such as an ongoing rebranding project at the Seattle Residence Inn, which Justin Knight noted is guided by local market supply dynamics and brand incentive terms.14 However, single-property rebrandings do not confer broad negotiating leverage over major franchisors.
Fourth: public versus private valuation disconnect. Management has consistently argued that public equity markets undervalue the portfolio relative to private real estate transactions. In February 2026, Justin Knight stated that the stock had traded at an implied discount to achievable private market values for much of the preceding year, pointing to the 2025 strategy of selling properties and repurchasing stock to capture that pricing gap.14 The transactional math validates that assessment: selling mature hotels at 12 to 16 times EBITDA while buying company stock at a 2.4 to 6.5 turn discount creates measurable value on paper.14 The activist critique follows directly: if private real estate values persistently exceed public equity prices, management should either execute aggressive share buybacks or evaluate strategic alternatives for the entire platform.
The Risk Radar
Demand sensitivity to economic and policy shifts — high impact, demonstrated likelihood. Federal spending reductions and the late-2025 government shutdown caused same-store government room nights to drop 12% and negotiated corporate room nights to fall 5% to 6% in 2025, driving a 190-basis-point hotel EBITDA margin contraction.1413 Operational leverage works symmetrically; a broader economic contraction affecting corporate travel budgets would compress margins quickly.
Supply normalization — medium impact, medium-term likelihood. The shortage of competing hotel construction represents the central pillar of the positive outlook, driven by high construction costs relative to property yields. However, franchisors are deploying financial incentives and key money to restart project pipelines.3 A sustained decline in the proportion of hotels without local competitive construction — separate from portfolio sales — would signal returning supply pressure.
Capital costs and debt maturities — low near-term impact following July 2026 debt restructuring. The credit facility recast extended the weighted average debt maturity to nearly five years and eliminated major unsecured maturities until 2029.3 Operational flexibility remains constrained by variable rate exposure on roughly 40% of outstanding debt and a credit agreement covenant limiting annual shareholder distributions to 95% of funds from operations.8
Insurance and property tax volatility — short-term tailwind, structural risk. Favorable April 2026 insurance renewals and successful property tax appeals lowered second-quarter fixed overhead.3 However, management built higher projected costs into guidance for late-2026 insurance renewals.3 Property insurance remains vulnerable to severe weather events, particularly across key regional concentrations such as Texas, which represents 25 portfolio properties.2
Franchisor capital expenditure mandates — medium impact, high likelihood. Property renovation obligations are contractually mandated by franchise agreements. Management increased its 2026 capital expenditure target from $80–$90 million to $85–$95 million mid-year, attributing the shift to accelerating two high-return conversion projects rather than franchisor demands.3 Distinguishing between value-enhancing property investments and mandatory brand compliance capital remains a critical oversight item.
Key executive transitions. The company reported on its August 2026 earnings call that Chief Accounting Officer Rachel Labrecque had passed away.3 In a streamlined corporate organization of sixty-four employees, the loss of a senior financial officer presents a distinct operational transition risk, making the appointment of a permanent successor an important monitorable item.
IX. Playbook: Business & Investing Lessons
Lesson 1: Operational simplicity is a balance sheet strategy, not just a margin strategy. Eliminating food and beverage service does more than widen operating margins by five to six percentage points. It lowers fixed overhead enough for properties to remain open even at 46% annual occupancy — as Apple Hospitality demonstrated across its portfolio in 2020.12 Margin advantages boost profitability during economic expansions, but low break-even points determine equity survival during severe demand shocks.
Lesson 2: Renting a demand engine is usually cheaper than building one — but the asset remains rented, not owned. Apple Hospitality allocates roughly 14 cents of every room-revenue dollar to Marriott and Hilton, gaining access to loyalty platforms with hundreds of millions of members and the lowest-cost direct booking channels in lodging.21817 An independent owner cannot cost-effectively replicate that customer acquisition network. However, the most critical asset in the lodging value chain rests on a third-party balance sheet, leaving franchise terms subject to modification at the franchisor's discretion rather than the property owner's.
Lesson 3: The most effective real estate transaction often involves selling the capital expenditure liability rather than just the physical asset. A core element of Apple Hospitality's recycling model is recognizing that a hotel approaching a mandated brand renovation can hold greater relative value for a local operator underwriting against replacement costs than public market multiples suggest. Disposing of assets at 12.4 times EBITDA before capital expenditures — and 16.5 times after accounting for required upgrades — effectively transfers a predictable reinvestment obligation to a buyer willing to absorb it.14 Across capital-intensive real estate sectors, assessing the scale and allocation of upcoming maintenance liabilities remains a central driver of long-term returns.
Lesson 4: Conservative leverage provides negotiating position, not operational immunity. Although Apple Hospitality entered 2020 with one of the lowest debt burdens in the lodging sector, severe demand contraction still necessitated credit facility covenant waivers by June of that year.12 Low leverage did not prevent financial stress; instead, it enabled management to secure bank waivers on standard commercial terms without resorting to distressed asset sales or dilutive equity raises. Evaluating balance sheet strength requires distinguishing between absolute protection from market shocks and the flexibility to navigate debt restructuring smoothly.
Lesson 5: Transitioning away from a retail syndicate structure is costly and protracted, with expenses emerging across multiple balance sheet items. Transitioning from a non-traded program to a publicly listed REIT required Apple Hospitality to absorb a $117.1 million non-cash charge to terminate external advisory contracts, $37.5 million in gross cash litigation settlements covering merger and dividend reinvestment claims, and approximately $200 million in Dutch auction share repurchases to absorb legacy retail selling pressure.811 Over eleven years after listing, the stock trades below its 2015 tender offer price.238 While internalizing management and listing on a major exchange improved corporate governance and lowered operating overhead, resolving the legacy costs of early non-traded syndication required sustained financial commitments over a multi-year period.
X. Epilogue & Forward View
By late August 2026, Apple Hospitality REIT presents a stronger operational profile than its historical market valuation reflects. Its margins lead the lodging sector, its debt profile carries no significant maturities until 2029 following a major credit facility recast, and its submarkets face minimal competitive supply. Furthermore, business travel — the demand segment that lagged post-2020 recovery — demonstrated tangible momentum in the second quarter of 2026, as weekday occupancy expanded twice as fast as weekend occupancy and incremental demand materialized at higher-margin retail rates rather than pre-negotiated corporate discounts.3
Yet structural limitations remain. The company owns no consumer brands, maintains no control over the global reservation platforms that generate its bookings, employs no hotel operational staff, and trades at a share price that in August 2026 remained below its post-listing levels from mid-2015.238 For initial public shareholders, overall returns have depended entirely on dividend distributions — distributions that dropped to a single cent per quarter for two years during the acute demand shock of 2020 and 2021.
The forward investment case depends on three conditions holding simultaneously: competitive hotel supply must remain constrained long enough for average daily rates to compound; the 2026 business travel rebound must represent a durable trend rather than a temporary baseline recovery from a policy-disrupted 2025; and management must translate its asset recycling discipline into per-share earnings growth rather than solely maintaining asset quality. For the bear thesis to prevail, only one of those pillars needs to fracture.
Three key metrics will clarify the trajectory:
Comparable hotels RevPAR growth provides the primary indicator of top-line demand momentum. Evaluating its underlying composition remains essential: revenue expansion driven by average daily room rates flows through to net operating income at a significantly higher conversion rate than volume-driven occupancy growth, making rate expansion during periods of stable occupancy the definitive marker of pricing power.
Comparable hotels adjusted hotel EBITDA margin serves as the benchmark test for the select-service operational model. The model assumes a rooms-focused portfolio converts top-line revenue into operating profit more efficiently than full-service peers. Margin compression occurring alongside positive RevPAR growth would indicate that rising operational overhead, rather than room demand, is constraining profitability.
Modified funds from operations per share ultimately determines whether platform efficiencies translate into shareholder value. Apple Hospitality has established its ability to execute opportunistic asset dispositions and selective acquisitions. Whether this ongoing cycle of buying, selling, renovating, and distributing capital compounds per-share value across a complete economic cycle remains the central unanswered question for long-term investors.
References
-
Apple Hospitality REIT Reports Results of Operations for Second Quarter 2026 — Apple Hospitality REIT, 2026-08-04 ↩↩↩↩↩↩↩↩↩
-
Apple Hospitality REIT, Inc. Annual Report on Form 10-K for the year ended December 31, 2025 — U.S. Securities and Exchange Commission, 2026-02-23 ↩↩↩↩↩↩↩↩↩↩↩↩↩↩↩↩↩↩
-
Apple Hospitality REIT Q2 2026 Earnings Call Transcript — Seeking Alpha, 2026-08-06 ↩↩↩↩↩↩↩↩↩↩↩↩↩↩↩↩↩↩↩↩↩↩↩↩↩↩↩↩↩↩↩↩↩↩↩↩↩↩↩↩↩↩↩↩↩↩↩↩↩
-
Apple Hospitality REIT, Inc. Definitive Proxy Statement (DEF 14A) for the 2026 Annual Meeting — U.S. Securities and Exchange Commission, 2026-04-02 ↩↩↩↩↩↩↩↩↩↩↩↩↩↩↩
-
Apple REIT Ten, Inc. Annual Report on Form 10-K for the year ended December 31, 2014 — U.S. Securities and Exchange Commission, 2015 ↩↩
-
SEC Order Instituting Cease-and-Desist Proceedings, In the Matter of Apple REIT Six, Inc., Apple REIT Seven, Inc., Apple REIT Eight, Inc., Apple REIT Nine, Inc., their Advisors, Glade M. Knight and Bryan F. Peery — U.S. Securities and Exchange Commission, 2014-02-12 ↩↩↩↩↩
-
FINRA Enforcement Action against David Lerner Associates regarding Apple REIT Ten — FINRA, 2012 ↩
-
Apple Hospitality REIT, Inc. Annual Report on Form 10-K for the year ended December 31, 2015 — U.S. Securities and Exchange Commission, 2016-02-25 ↩↩↩↩↩↩↩↩↩↩↩↩↩
-
Apple Hospitality REIT, Inc. Approved to List Common Shares on New York Stock Exchange (Form 8-K, Exhibit 99.1) — U.S. Securities and Exchange Commission, 2015-05-11 ↩
-
Apple Hospitality REIT, Inc. Completes Merger with Apple REIT Ten, Inc. — Apple Hospitality REIT, 2016-09-01 ↩↩↩
-
Apple Hospitality REIT, Inc. Annual Report on Form 10-K for the year ended December 31, 2016 — U.S. Securities and Exchange Commission, 2017-02-27 ↩↩↩
-
Apple Hospitality REIT, Inc. Annual Report on Form 10-K for the year ended December 31, 2020 — U.S. Securities and Exchange Commission, 2021-02-23 ↩↩↩↩↩↩↩↩
-
Apple Hospitality REIT Reports Results of Operations for Fourth Quarter and Full Year 2025 — Apple Hospitality REIT, 2026-02-23 ↩↩↩↩↩↩↩↩↩↩↩↩↩↩↩↩
-
Apple Hospitality REIT Q4 and Full Year 2025 Earnings Call Transcript — Seeking Alpha, 2026-02-24 ↩↩↩↩↩↩↩↩↩↩↩↩↩↩↩↩↩↩↩↩↩↩↩↩↩
-
Apple Hospitality REIT Q1 2026 Earnings Call Transcript — Seeking Alpha, 2026-05-05 ↩↩↩↩↩↩↩
-
Apple Hospitality REIT, Inc. Quarterly Report on Form 10-Q for the quarter ended June 30, 2026 — U.S. Securities and Exchange Commission, 2026-08-05 ↩↩↩↩
-
Hilton Worldwide Holdings Inc. Fourth Quarter and Full Year 2025 Earnings Release — U.S. Securities and Exchange Commission, 2026-02 ↩↩↩
-
Marriott International, Inc. Fourth Quarter and Full Year 2025 Earnings Release — U.S. Securities and Exchange Commission, 2026-02-10 ↩↩↩
-
Marriott International, Inc. Annual Report on Form 10-K for the year ended December 31, 2025 — U.S. Securities and Exchange Commission, 2026 ↩
-
Host Hotels & Resorts, Inc. Reports Results for Fourth Quarter and Full Year 2025 (Form 8-K, Exhibit 99.1) — U.S. Securities and Exchange Commission, 2026-02-18 ↩↩↩
-
Summit Hotel Properties Reports Second Quarter 2026 Results — PR Newswire, 2026-08 ↩↩↩
-
Apple REIT Six Shareholders Approve Definitive Merger Agreement with an Affiliate of Blackstone Real Estate Partners VII (Form 8-K, Exhibit 99.1) — U.S. Securities and Exchange Commission, 2013-05-09 ↩
-
Apple Hospitality REIT Inc (APLE.N) Company Overview and Market Data — Reuters ↩↩↩↩↩↩↩↩↩
 LinkedIn
 WhatsApp
 Reddit
 Hacker News
 Email
Email Kindle
 RSS Feed
 Spotify
 Apple Podcasts
 Amazon Music
 Audible
 YouTube