Heritage Financial: The Community Bank That Bought Itself a Bigger Future
The $185 Million Bet on Kitsap
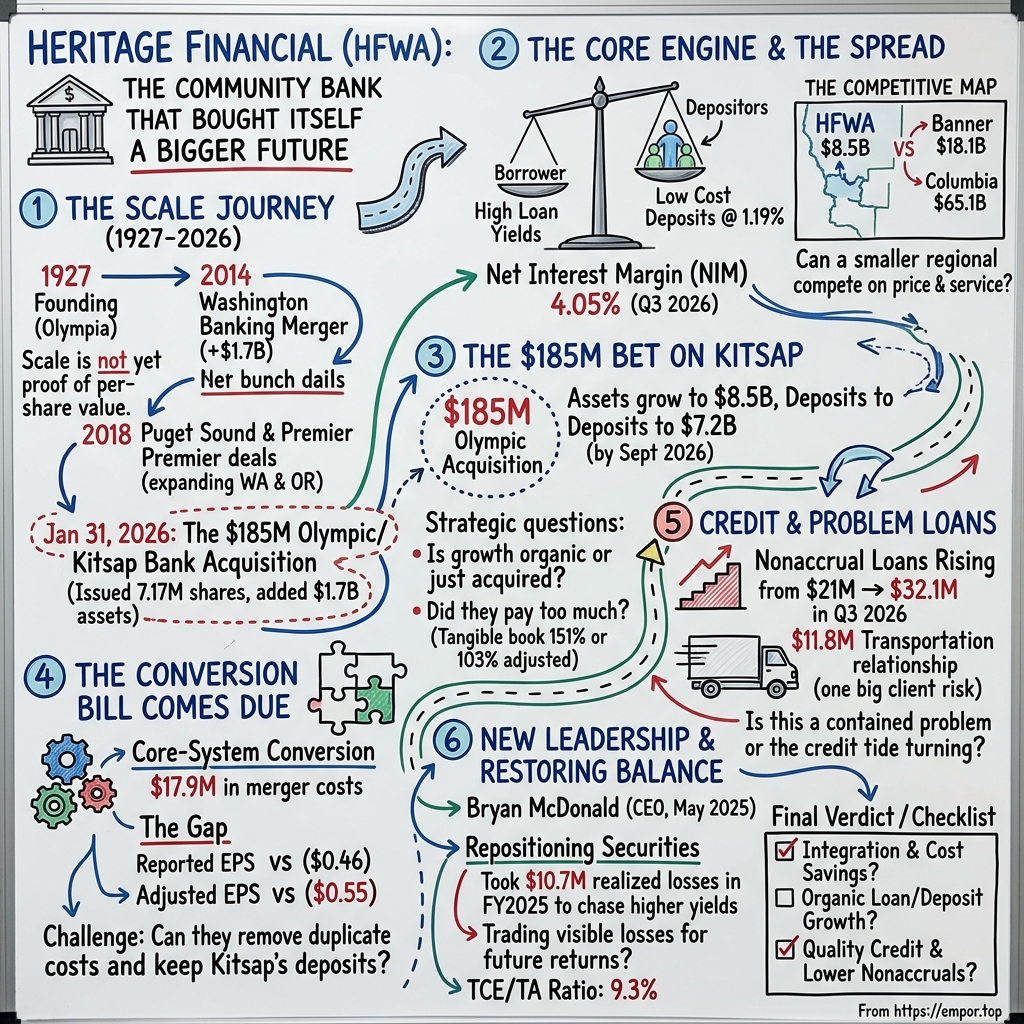
On January 31, 2026, a bank changed hands without anyone handing over cash. Heritage Financial Corporation, the Olympia holding company behind Heritage Bank, issued 7,167,600 new shares of its own stock to the owners of Olympic Bancorp, and in return took ownership of Kitsap Bank, the community lender across Puget Sound in Kitsap County.1 At the closing-date price, that paper was worth about $185 million.1 No vault was opened and no wire went out. One group of shareholders traded a stake in a local bank for a smaller slice of a larger one, and the Kitsap Bank branches that had served shipyard workers, small contractors and family businesses on the Kitsap Peninsula became, on paper at least, Heritage branches.
Bank deals often look like this, and that is why they deserve close reading. When a company pays in stock, the price is not a single number paid on a single day. It is a promise that the combined bank will earn more per share than the old one would have earned on its own. Every new share Heritage issued claims a portion of future profits, so the deal works only if Kitsap's deposits, loans and customers produce enough extra earnings to cover those claims and then some. The question inside the deal is simple to state and hard to answer: did Heritage buy a durable local banking franchise at a price its shareholders can earn back?
By the end of September, the combined bank had about $8.5 billion of assets and $7.2 billion of deposits, compared with roughly $7.0 billion of assets a year earlier.23 In the third quarter, it earned $18.7 million, slightly less than the $19.2 million it had earned in the same quarter of 2025, before Kitsap joined.2 Revenue, which for a bank mostly means interest income net of interest paid plus fees, jumped by about a quarter year on year. Profit did not follow. That gap between a bigger top line and flat earnings is the tension that runs through this whole story.
The stakes come in five parts, and each one gets its moment. The first is whether Heritage's growth is earned or bought: how much of the new size came from bankers winning customers, and how much arrived on January 31 in a single exchange of shares. The second is whether the Kitsap integration, which involved converting core computer systems, closing overlapping branches and moving customers onto Heritage's platforms, will lift earnings once the one-time costs stop. The third is whether Heritage's inexpensive deposit base is a real competitive advantage or a happy accident of the rate cycle. The fourth is whether a recent rise in problem loans, concentrated in a single transportation borrower, is a contained event or the first sign of a credit turn. The fifth is whether the share price, which sits near its own long-run average multiple, leaves any room for things to go wrong.
A boundary is worth drawing early. Heritage Financial Corporation is the listed company; Heritage Bank is the operating bank that takes deposits and makes loans, and the holding company's financial statements relate mostly to the bank's operations.3 Olympic Bancorp and Kitsap Bank appear in the consolidated results only from January 31, 2026.1 So any comparison of 2026 with 2025 compares a bigger bank with a smaller one, and the reader has to keep subtracting the acquisition to see what the original franchise did on its own.
One more warning before the story starts. The usual tools of industrial analysis break down when pointed at a bank. Debtor days, cash conversion cycles and working-capital ratios assume a company sells goods on credit and waits to be paid. A bank's "receivables" are its loans, which is to say its entire product, so those ratios produce nonsense; generic screens that report Heritage's debtors at thousands of days of revenue are measuring the loan book, not slow-paying customers. Some data services also understate the investment portfolio. At year-end 2025, Heritage's 10-K reported securities of about $1.28 billion, far more than the roughly $600 million some screens show.3 Free cash flow and enterprise value are also distorted, because customer deposits flow through a bank's cash statement and a bank's "cash" is partly other people's money. The measures that matter here are the ones bankers use: net interest margin, credit quality, deposit costs and capital. Those are the numbers that will tell whether the January exchange of shares was a good trade, and to read them properly it helps to know how a small Olympia savings bank came to be the buyer in the first place.
 Subscribe on LinkedIn
Olympia Was a Small Bank Before It Became a Roll-Up
Heritage began in 1927 in Olympia, Washington's capital, a government town at the southern tip of Puget Sound.3 For most of its first seven decades it was what its name suggests: a local institution serving local savers and borrowers in Thurston County and the surrounding area. There is no founding myth of a visionary banker standing on a crate. The interesting part of the Heritage story, the part that shapes the investment case today, is much more recent. It is a story of a modest bank deciding, again and again, that the fastest way to become a regional commercial lender was to buy one.
The decisive moment came in 2014. That year Heritage merged with Washington Banking Company, the parent of Whidbey Island Bank, a lender rooted in the islands and towns north of Seattle.4 Washington Banking brought about $1.7 billion of assets, and the combination more than doubled the size of Heritage.4 It was not a takeover of a struggling neighbour. It was close to a merger of equals in a market where community banks were consolidating because the fixed costs of technology, compliance and regulatory reporting were becoming harder to carry at small scale. The deal also brought people. Bryan McDonald, who now runs the company, came to Heritage through that merger.5 In hindsight, the 2014 deal was the moment Heritage stopped being an Olympia bank with branches and became a Puget Sound bank with an Olympia address.
Four years later came a second step. In 2017 Heritage agreed to buy Puget Sound Bancorp, a Bellevue-based business bank with roughly $639 million of assets, and in 2018 it also completed the purchase of Premier Commercial Bancorp, a Hillsboro, Oregon, lender with about $440 million.67 Both deals were paid largely in stock. Puget Sound gave Heritage a commercial banking team on the affluent east side of Lake Washington, where technology companies and the professional firms around them generate exactly the kind of business deposits community banks covet. Premier extended Heritage's reach into the Portland metropolitan area. The logic was consistent: buy branches, buy commercial lenders, buy deposits, buy relationships, and buy them in places where Heritage was thin.
After those deals, the strategy shifted in texture though not in direction. Rather than another acquisition, Heritage spent several years adding teams of commercial bankers and opening in new markets, including Eugene, Oregon, and Boise, Idaho, where it entered with lenders rather than with a bought branch network.4 Hiring teams is cheaper than buying a bank and does not dilute shareholders, but it is slower, and the loans those bankers bring have to be won one relationship at a time, usually from a competitor who will fight back on price.
How did all of this show up in the numbers? Over the ten years to 2025, Heritage grew revenue at about 7% a year and net profit at about 6% a year.3 Total assets roughly doubled, from about $3.5 billion at the end of 2014 to about $7.0 billion at the end of 2025.3 That looks like a steadily compounding franchise, and in aggregate it was. But growth in assets and revenue says nothing about how much of the growth was earned per share, and stock-funded deals make that distinction essential.
The clearest test sits in the years around the 2018 deals. Between 2017 and 2019, net profit rose from about $41 million to about $67 million, a gain of roughly 60%.3 Earnings per share rose from $1.40 to $1.83, a gain of about 30%.3 The difference between those two percentages is the new shares: the share count grew by roughly a quarter to pay for Puget Sound and Premier. And part of the profit gain came from somewhere other than banking. Heritage's tax rate fell from about 30% in 2017 to about 16% in 2019 after the federal corporate tax cut took effect in 2018.3 Strip that away and the per-share improvement from the deals looks considerably smaller than the headline.
The longer view is more sobering still. Diluted EPS was $1.83 in 2019 and $1.96 in 2025, six years later.3 In between it swung widely, to $2.77 in the stimulus-flush year of 2021 and down to $1.25 in 2024, a year burdened by securities-sale losses.3 Through all of it, per-share earnings at the end of the period were only modestly higher than at the start. Heritage's own investor materials separate acquired assets from organically generated ones in their historical charts, which is a commendable bit of honesty, but it also concedes the point: the step-changes in scale were bought.4
So the history neither rejects nor proves the acquisition strategy. It narrows it. Heritage has shown it can find willing partners, close deals and keep the combined bank stable. It has not shown that acquisitions reliably compound earnings per share for long-term holders, because the record since 2019 is dominated by rate cycles and accounting losses rather than by visible deal payoffs. By 2025 management faced the classic community-bank choice: keep building market by market with hired lenders and patience, or make another larger acquisition and accept the integration risk. In September 2025 it chose the second path. To judge whether that was wise, one first has to understand what a bank like Heritage actually sells.
The Spread Between a Loan and a Deposit
Picture a business owner in Tacoma who runs a mechanical contracting firm. She needs a $2 million line of credit to buy materials before her customers pay her, and a term loan to buy a building. She walks into a Heritage office, or more likely her relationship banker drives out to see her. Heritage prices the loan at an interest rate, perhaps a little above 6%; new commercial loans came on at an average of about 6.46% in the third quarter of 2026.8 Her firm's operating account, where customer payments land and payroll goes out, sits at the same bank and pays little or no interest.
That account is the quiet hero of the story. Every dollar Heritage lends has to be funded with somebody else's money: checking accounts, savings accounts, certificates of deposit or, when deposits run short, borrowings from the Federal Home Loan Bank. The cheaper the funding, the wider the gap between what borrowers pay and what the bank pays. That gap, expressed as a percentage of earning assets, is the net interest margin, and it is the single most important number in a community bank's economics. From that spread the bank pays its staff, rents its branches, buys its technology, absorbs its credit losses, pays its taxes and, if anything is left, rewards shareholders.
In the third quarter of 2026, Heritage reported a net interest margin of 4.05%.2 A year earlier, it was 3.64%.2 On the surface that is an impressive improvement, the kind that turns a middling bank into a profitable one. But the filing is careful about the cause. The increase came largely from the merger, which brought in a larger loan balance at higher yields, and from purchase accounting.1 When Heritage bought Kitsap, it had to mark Kitsap's loans to their fair value, and because many of those loans carried interest rates below current market rates, their fair value was below their face value. That discount is then gradually recognised as extra interest income over the life of the loans, a mechanism called purchased-loan accretion. Excluding it, the third-quarter margin was 3.98%.2 So of the roughly 41-basis-point improvement, about seven basis points came from accounting accretion, and much of the rest reflected the acquired balance sheet and the steady repricing of older, low-rate fixed loans into new higher-rate ones. That last element is genuine, but it is not unique to Heritage; every bank with a book of loans written in 2020 and 2021 enjoys it as those loans mature.
On the funding side, Heritage's cost of total deposits was 1.19% in the third quarter, and interest-bearing deposits cost 1.65%.28 Noninterest-bearing demand deposits, the operating accounts that pay nothing, made up 27.4% of total deposits.2 These are the numbers that underpin the most interesting claim one can make about Heritage: that it has a cheaper deposit base than its peers.
KBRA, the rating agency, made exactly that argument when it affirmed Heritage's ratings in May 2026. It cited a deposit cost of 1.26% versus 1.78% for peers, and noninterest-bearing deposits at 29% of the total, both measured at the first quarter of 2026.9 A 52-basis-point funding advantage is not trivial. On a $7 billion deposit base, it is worth roughly $35 million a year of pretax income, which is a large share of what Heritage earns. Comparing like with like matters here: by the third quarter, Heritage's deposit cost had fallen to 1.19%, but the noninterest-bearing share had also slipped, from 29% to 27.4%. Some of that drift reflects the mix of the acquired Kitsap deposits and some reflects customers moving idle balances into accounts that pay interest, a trend that has squeezed every bank since rates rose in 2022. On the third-quarter call, CFO Don Hinson said deposit costs had "likely hit an inflection point," and he put the spot cost of interest-bearing deposits at 1.66% at quarter end.8 In plain English, the easy part of the funding tailwind is probably over.
The fee businesses deserve their proper size. Heritage earns service charges on deposit accounts, card interchange revenue, wealth management fees, fees on interest-rate swaps sold to commercial borrowers, and income on bank-owned life insurance.3 These broaden the relationship and make a business customer somewhat stickier, but they are small next to the spread. In 2025, noninterest income was about $21.7 million in total, and that figure was depressed by $10.7 million of securities-sale losses.3 Heritage does not disclose what share of revenue is recurring fees, and there is no evidence in its filings of a fee business large enough to act as a second engine. This is a spread lender with fee garnish.
Where does Heritage sit on the map? With $8.5 billion of assets after the acquisition, it is a mid-sized community bank in a region dominated by much larger lenders. Columbia Banking System, the product of Umpqua's merger with Columbia and its later expansion, had $65.1 billion of assets at the end of the third quarter.10 Banner Corporation, the Walla Walla lender with a big Puget Sound presence, had about $18.1 billion.11 Above them sit the national banks, JPMorgan Chase, Bank of America, Wells Fargo and U.S. Bank, plus WaFd, KeyBank and a dense field of credit unions, including some of the largest in the country, and scores of small local lenders. Every one of them wants the Tacoma contractor's operating account.
Apply Michael Porter's lens and the picture is clear. The contractor has real bargaining power: she can get quotes from three banks for her loan, and her treasurer can move idle cash to a money market fund with a few clicks. Rivalry among regional banks is intense, because they sell nearly identical products funded by nearly identical deposits, and the main differentiators are price, speed of decision and the quality of the individual banker. The threat of a brand-new full-service bank is modest, because charters, capital requirements, deposit insurance and the cost of a modern technology stack make de novo banking slow and expensive. Substitutes, however, nibble at the edges: fintech payment platforms take pieces of the payments relationship, private credit funds lend to mid-sized companies, and credit unions, which pay no federal income tax, can price consumer and small-business products aggressively.
That leaves the moat limited but testable. The evidence supports two things: a comparatively inexpensive deposit base, as KBRA measured it, and an established network of local branches and commercial bankers across western Washington and Oregon. It does not support strong switching costs or a network effect. A business owner who moves her operating account faces some hassle, since payroll links, autopay and treasury-management connections have to be rebuilt, but the hassle is measured in weeks, not years. The best evidence of a moat would be a deposit cost that stays below peers through a full rate cycle, a noninterest-bearing share that holds up, loan yields that do not need to be cut to win business, and customer retention through events like the Kitsap conversion. Heritage reports the first three; it does not disclose retention. That matters immediately, because the bank had just bet roughly $185 million that Kitsap's customers would stay.
A Familiar Franchise Gets Bigger—At What Price?
On September 25, 2025, Heritage announced that it would buy Olympic Bancorp in an all-stock transaction.1213 The target was not a stranger. Kitsap Bank, headquartered in Port Orchard, had 17 offices and roughly $1.7 billion of assets, and it operated across Kitsap County and nearby Puget Sound communities where Heritage already had a presence.1412 For Heritage, the attraction was obvious. Kitsap brought a large base of local deposits, a group of commercial and consumer borrowers, and a branch network in a county that sits between the naval facilities at Bremerton and the ferry routes to Seattle, a stable if not fast-growing economy.
The deal fitted a pattern. Like Whidbey Island in 2014, Kitsap was a neighbouring franchise whose customers would not have to learn a new geography. Like Puget Sound Bancorp in 2018, it was paid for with stock, which meant the sellers became Heritage shareholders and shared in the outcome. And like every one of Heritage's acquisitions, it was justified by a set of financial metrics that management presented on the day of the announcement.
Those metrics need translating. Heritage said it was paying about 151% of Olympic's tangible book value, or 103% if one excluded accumulated other comprehensive income.12 On an earnings basis, the price was 20.4 times Olympic's estimated core earnings, or 7.8 times assuming the full planned cost savings.12
Start with the book-value figures. Tangible book value is roughly what shareholders would have left if a bank sold every asset at its stated value, paid off every depositor and creditor, and ignored intangible items such as goodwill. "Accumulated other comprehensive income," the clumsy accounting phrase, is in this context mostly a pile of unrealized losses on bonds. When interest rates rose sharply in 2022 and 2023, the market value of bonds that banks had bought at low yields fell. Those losses reduce reported equity even though the bank may never sell the bonds and will be repaid in full if it holds them. Strip the losses out and Olympic's tangible book is larger, so the price looks smaller relative to it: 103% rather than 151%. Neither number is "right." The 151% figure reflects economic reality today, because those bonds really are worth less than their face value until they mature. The 103% figure reflects the view that the losses are temporary and will melt away as the bonds approach maturity. In an acquisition, they melt away, while the purchase-accounting loan discount contributes to reported interest income. Neither number is "right." The 151% figure reflects economic reality today, because those bonds really are worth less than their face value until they mature. The 103% figure reflects the view that the losses are temporary and will melt away as the bonds approach maturity. In an acquisition, they melt away, while the purchase-accounting loan discount contributes to reported interest income.
The earnings figures tell an even more revealing story. At 20.4 times standalone core earnings, Heritage paid a premium multiple, well above what the market was paying for its own shares or for larger regional peers. Only after adding the full cost savings does the multiple fall to 7.8 times. Do the arithmetic and the implication is striking: for the multiple to fall that far, the combined earnings attributed to Kitsap must be about two and a half times Kitsap's own standalone earnings. In other words, the expected cost savings were worth well over Kitsap's entire standalone profit stream. Management targeted savings of about 35% of Kitsap's cost base.8 That is an aggressive but not unusual target for an in-market deal, where overlapping branches, back offices and technology contracts can be cut. It also means the investment case is mostly a cost-takeout case. If the savings arrive, the price looks reasonable. If they arrive only partially, or arrive while revenue leaks away, the price looks rich.
How does this compare with Heritage's own standards? The company has long described its acquisition targets as an internal rate of return above 15% and a tangible-book earnback of under three years.4 The earnback concept is easy to grasp with an analogy. When Heritage issues shares worth more than the tangible book value it receives, its own tangible book value per share falls on day one. The earnback period is how long it takes for the extra earnings from the deal to rebuild that lost book value. Three years is the conventional industry ceiling; shorter is better. These are management targets, set by the people doing the deal, not independent proof that value was created.
The most useful benchmark is Heritage's own past. When it closed the Puget Sound acquisition in 2018, Heritage estimated that the deal would add 5.67% to 2019 earnings per share, produce an 18% internal rate of return and earn back the tangible-book dilution in 2.1 years.7 Did it? The record is muddied. EPS did rise strongly in 2019, but the federal tax cut and the simultaneous Premier deal made it impossible to isolate Puget Sound's contribution from the company's reported figures, and Heritage's later annual reports do not break out the deal's realized return. The 2020 pandemic, the 2021 stimulus deposit flood and the 2022 rate shock overwhelmed any deal-level signal. So the honest conclusion is not that the earlier forecasts were wrong, but that they were never cleanly verified, and that investors should therefore treat the Olympic projections in the same spirit: plausible management estimates awaiting confirmation.
The Kitsap acquisition also changes how growth should be read. On January 31, assets, loans and deposits stepped up overnight. Anyone who compares 2026 balances with 2025 and calls the difference growth is counting the acquisition as if Heritage's bankers had produced it. The better question is what happens after the step: whether loans and deposits grow from the new, larger base, and whether earnings per share rise faster than the share count. In the third quarter, loans grew by about $133 million, or 2.3% from the prior quarter, and deposits grew by about $148 million, or 2.1%.2 Those are organic increases on the combined base and they are respectable. But one quarter is not a trend, and the lending pipeline, as management disclosed, was shrinking.
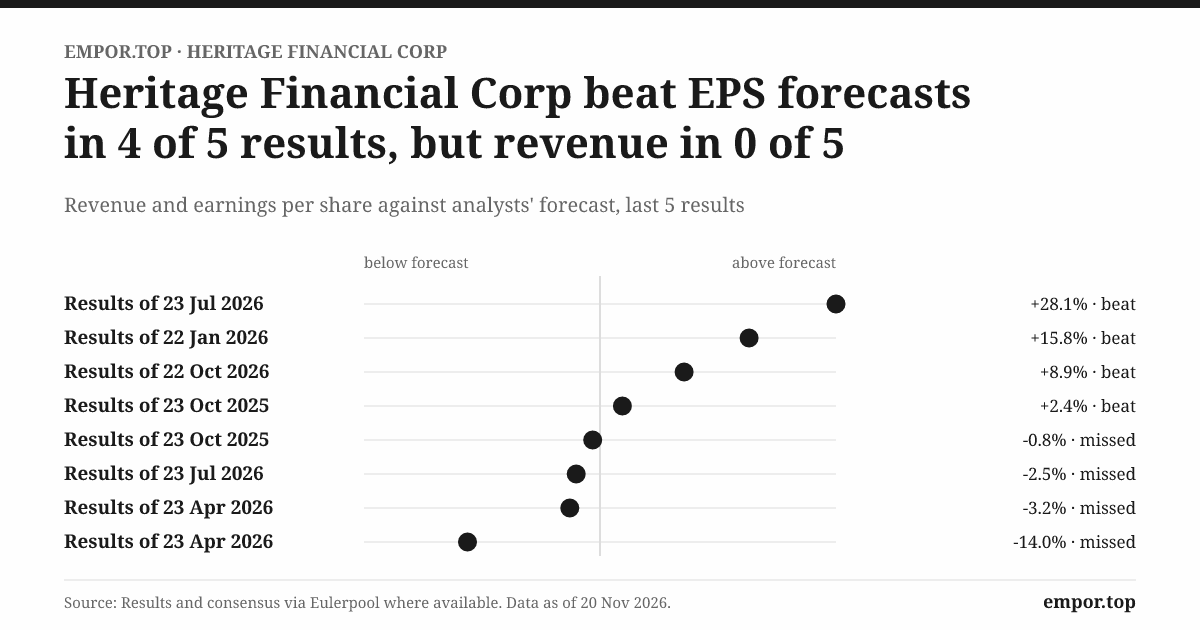
Follow the shares through to per-share economics. Before the deal, Heritage had roughly 34 million shares outstanding; the Olympic issuance added about 21% to that count.13 Total assets grew by a similar proportion, and so did shareholders' equity, which rose by $185 million in the first nine months of 2026 because of the acquisition.1 Put differently, Heritage bought roughly a fifth more bank with roughly a fifth more shares. The deal creates value only if each share ends up owning more earnings than before. Through the third quarter, it had not yet done so: reported EPS was $0.46, below the $0.55 earned a year earlier, while adjusted EPS, which excludes merger costs, was $0.55, essentially level with the prior year's $0.56.2 Management's own adjusted figure, in other words, showed the combined bank earning the same per share as the old one, before the full benefit of the savings and after paying for the merger in stock.
The third-quarter call put management's claims and analysts' skepticism side by side. In prepared remarks, CEO Bryan McDonald said the Kitsap core conversion was "completed as planned in late September."8 When Andrew Terrell of Stephens asked whether the 35% cost-saving target had been met, Hinson answered "yes, we feel we hit that," while adding that new investments in staffing and technology had added expense.8 The concrete commitments were few but specific: quarterly operating expense of $55 million to $56 million in the fourth quarter, and about $500,000 of costs in the fourth quarter tied to the commercial online-banking conversion, followed by about $1.5 million in each of the first two quarters of 2027, with that conversion finished by mid-2027.8 The vaguer language concerned 2027 core expenses, which Hinson said would rise, with the budget still being built.8 That distinction matters. A target described as "hit" while overall expenses are set to rise is the kind of claim investors should verify in the reported efficiency ratio rather than accept on the call. The bill for the conversion, in any case, was already coming due.
The Conversion Bill Comes Due
Merging two banks is not like merging two software companies. Customers do not just log into a new app. Every checking account, debit card, loan payment schedule, direct-deposit link and wire template has to move from one core processing system to another, usually over a single weekend. On a Friday, a Kitsap Bank customer uses Kitsap's systems; by Monday morning, their account number may have changed, their online-banking login may be new, and the branch around the corner may have closed. If the payroll file of a 200-employee contractor fails to process, or a retiree's Social Security deposit goes missing, the cost is not just a complaint. It is a relationship placed at risk at precisely the moment the acquirer needs every deposit to stay.
Heritage reached that point in late September 2026.8 It was a genuine operational milestone. A bank that had ended 2025 with 723 full-time and 32 part-time employees, and a voluntary staff turnover rate of about 15% a year, had absorbed another with a large branch network and moved its customers onto new systems on schedule.3 That turnover figure matters more than it looks: in a merger year, the bankers who leave often take their clients with them, and Heritage does not report turnover among the acquired Kitsap staff. The second-quarter release had promised that after the systems conversion in the third quarter, the company "will recognize additional cost savings," and the conversion indeed came in the quarter management had pointed to.15 Delivering a conversion on time is the minimum condition for a successful bank merger, not proof of one, but plenty of banks have failed even the minimum.
The bill for getting there was real. Heritage recorded about $17.9 million of merger-related costs in the first nine months of 2026: about $5.2 million in the first quarter, $7.5 million in the second and $5.2 million in the third.1152 Those costs covered data-processing contracts, conversion work, branch closures and the other frictions of combining two institutions.1 They explain the gap between reported and adjusted third-quarter EPS.2 They are also why the reported efficiency ratio, a bank's operating costs as a share of its revenue, was 71.6% in the quarter, against 62.2% on an adjusted basis.2 For context, a well-run community bank typically aims for an efficiency ratio in the mid-to-high 50s; each dollar of revenue costs 55 to 60 cents to produce. Heritage, even on its adjusted figure, is not there yet.
Not every merger-related cost is temporary, and that is the subtle trap in adjusted earnings. Some costs, such as severance for redundant staff or the fee to exit a duplicate technology contract, really do stop. Others look temporary but become permanent: a larger technology stack, more expensive cybersecurity, higher compliance costs as the bank grows, or new hires made to support the bigger franchise. Intangible amortization, the gradual write-down of the value assigned to Kitsap's customer deposits at acquisition, is a non-cash charge that will appear in reported results for years.1 Investors who rely only on "adjusted" figures risk assuming a cleaner future than the reported one will deliver.
Management's fourth-quarter guidance offers the first test. Third-quarter noninterest expense was $62.0 million.8 Strip out the $5.2 million of merger costs and the run rate was about $57 million. The guidance of $55 million to $56 million for the fourth quarter therefore implies only $1 million to $2 million of further reductions, even before the half-million dollars of online-banking conversion cost that management said it would incur.8 The most natural reading is that most of the cost savings were already in the third-quarter run rate, consistent with Hinson's claim that the target had been hit. The less comfortable reading is that the room for further improvement is narrow, and that 2027 core expense growth, which management said would rise, will eat into whatever is left. Either way, the evidence will arrive when the fourth-quarter results are published in early 2027.
The remaining integration work is not trivial. Commercial online banking, the system that business customers use to send wires, manage cash positions and run payroll, will be converted by mid-2027.8 For a commercial bank, that is the more sensitive conversion. A consumer who dislikes a new mobile app may grumble and stay. A business treasurer whose wire templates fail or whose positive-pay fraud controls do not migrate cleanly may decide that this is the moment to take an offer from the competitor who has been calling for years. The second conversion therefore carries more deposit risk than the first, even though it costs less.
What would success look like? The proof will come in four forms. First, recurring cost savings visible in the reported efficiency ratio, not only the adjusted one. Second, loan and deposit balances in the acquired Kitsap markets that hold steady or grow, which Heritage does not yet break out separately. Third, adjusted earnings converging toward reported earnings as merger costs end in 2027. Fourth, per-share earnings that rise above the pre-merger level once the savings and the larger balance sheet are fully reflected. Until those appear, the integration is a plausible success story with a high-quality first chapter and the rest unwritten.
The downside sits in the same frame. If service problems push customers to move balances, Heritage would lose cheap deposits just as it needs them to fund the acquired loan book and to repay short-term borrowings. Third-quarter deposits rose, which is a good sign, but the full effect of a conversion on customer behavior can take quarters to show, because businesses tend to consolidate accounts gradually rather than leave on a single day.
The deeper question is whether the merger makes Heritage more useful to its customers or only larger on the balance sheet. A bigger bank can make larger loans, offer more treasury products, and spread its technology costs over a broader base. A Kitsap business that outgrew its old bank's lending limit may now find a lender that can grow with it. But a bigger bank can also feel more distant, with decisions made farther from the branch and more standardized products. If the merger produces more capacity without less intimacy, it will have strengthened the franchise. If it only adds branches to the map, it will have made Heritage bigger without making it better. And just as that judgment began to form, a different kind of test arrived on the loan side of the balance sheet.
When Low Charge-Offs Meet a Rising Problem-Loan Count
In the third quarter of 2026, Heritage's credit team moved a commercial relationship made up of several transportation companies onto nonaccrual status.8 The total exposure was about $11.8 million, of which just over $4.4 million was government-guaranteed, according to Chief Credit Officer Tony Chalfant.8 It was not, by itself, a catastrophe. It was one borrower group in a loan book of nearly $5.9 billion. But it pushed a number that bank investors watch closely, nonaccrual loans, sharply higher in a single quarter, and it did so at the moment the market was hoping for a quiet integration year.
To understand why that matters, it helps to know what nonaccrual means. A loan normally earns interest each month, and the bank books that interest as income whether or not it has yet been paid in cash, on the expectation that it will be. When a borrower's ability to pay becomes doubtful, usually after 90 days of missed payments or earlier if the bank sees trouble, the bank stops booking interest on the loan. It may also reverse interest it had already recorded but not collected. In the third quarter Heritage reversed $219,000 of interest on commercial-business loans.1 The loan has not been written off, and the bank may still recover all or most of its money through repayment, collateral sales or a government guarantee. But the loan has stopped earning, which reduces margin, and it signals that a loss could follow.
The shape of the trend is what caught attention. Nonaccrual loans were $21.0 million, or 0.44% of loans, at the end of 2025.1 They fell to about $15.5 million by the end of June 2026, then roughly doubled to $32.1 million, or 0.55% of loans, by the end of September.12 The transportation group was the largest single contributor, though the release showed several commercial and commercial real-estate relationships moving into nonaccrual in the quarter.2 Loans at least 30 days past due, a separate and broader measure that includes borrowers who are late but not yet classified as nonaccrual, totaled $47.5 million at the end of the quarter.1 Criticized loans, the even wider category of loans that the bank's own credit reviewers consider weaker than normal, reached about $246 million, or 4.19% of loans, up about $16 million from the prior quarter.8 These categories overlap but measure different things: criticized is the watch list, past due is the late-payer list, and nonaccrual is the list where income has stopped. Lumping them together would overstate the problem; ignoring the wider lists would understate the risk that more loans will migrate into the narrower one.
Against those rising counts, the losses themselves remained tiny. Annualized net charge-offs, the loans actually written off net of recoveries, were 0.03% of loans in the third quarter; the amount charged off was about $381,000.8 KBRA, in its May rating rationale, noted that Heritage had recorded only about $3.5 million of net charge-offs over the previous five years.9 That is a remarkably benign record for a bank of this size, and it says something about the discipline of the commercial-lending culture. Heritage's allowance for credit losses, the reserve set aside for expected future losses, was 1.04% of loans at the end of the quarter, and the provision expense jumped to $2.3 million after a reserve release in the second quarter.2
How should the record be weighed? A five-year history of almost no losses is relevant, but it was set mostly during an extraordinary period: pandemic-era government support, very low interest rates through 2021, and then a strong economy that cushioned borrowers when rates rose. A benign record is the base case, not a guarantee, and history shows that credit problems arrive late, after the conditions that produced them. Transportation is a cyclical sector in which freight rates, fuel costs and equipment values can turn quickly, and a trucking-related borrower in trouble in late 2026 says more about the freight economy than about Heritage's broader loan book. But if the problem broadens into commercial real estate, where Heritage has a large exposure, the conversation will change.
Heritage's concentration controls limit single-name risk. At the end of 2025, its ten largest borrowing relationships accounted for 6.5% of the loan portfolio.3 That means no single borrower can sink the bank, and the $11.8 million transportation exposure is small relative to the book. But concentration risk is not only about names. A bank with many borrowers in the same industry or the same local economy can suffer correlated losses when a sector turns, and Heritage's loan book is heavily weighted toward commercial real estate and commercial business lending in the Pacific Northwest. Single-name limits do not protect against a regional downturn.
The verdict is calibrated. The low charge-off rate and the modest absolute size of nonaccrual loans temper the alarm; this is not a bank with a credit crisis. But the direction is wrong, the criticized-loan list is rising, and the nonaccrual count doubled in a quarter. The investment thesis should turn on the transportation relationship's resolution, whether through repayment, collateral recovery, a charge-off or a return to accrual, and on the next two quarters of migration into or out of problem status. If the transportation group is resolved with modest losses and the criticized list stabilizes, the third quarter will look like noise. If more names follow, the market's patience with an integration story will shrink quickly. And the person who will have to answer that question on the next call is a chief executive who has been in the top job for barely eighteen months.
A New CEO Inherits the Balance Sheet
Bryan McDonald became chief executive of Heritage Financial in May 2025, when Jeffrey Deuel retired.5 He had already been running the operating bank; he became chief executive of Heritage Bank in 2024 and then of the holding company a year later.5 Within months of taking the top job, Heritage completed a securities restructuring and announced the Olympic acquisition. Few new chief executives move so quickly to stamp their strategy on a company. The speed suggests the plan was largely in place before he took the corner office, which would be consistent with his long tenure in the bank's operating leadership.
McDonald is not an outsider. He came to Heritage through the 2014 Washington Banking merger and spent roughly a decade in senior operating roles at the bank before ascending to the top job.5 He knows the Puget Sound market, the commercial-lending teams and the integration playbook from the inside, having lived through the Whidbey Island combination himself. That continuity is an asset in a merger year, because the person running the integration has seen one from the acquired side. It is also a limitation, because a long-tenured insider can find it harder to question strategies he helped build. The board's chairman, Brian Vance, is himself a former long-serving chief executive, which reinforces the sense of continuity.5
What does McDonald have at stake? In 2025, his reported total compensation was about $1.35 million, up from about $1.0 million in 2024, reflecting his promotion and performance-linked pay.5 McDonald beneficially owned 70,717 shares, including restricted units vesting in the near term, and all directors and executive officers together owned 1.49% of the company.5 At the November share price, McDonald's stake is worth roughly $1.9 million. That aligns a meaningful part of his personal wealth with shareholders, but it does not amount to control or to the kind of ownership that makes an executive think like an owner of the whole enterprise. Heritage has no controlling shareholder; its largest holders are index and institutional funds, with BlackRock reporting about 13.3% in an April 2026 filing, up from the 12.3% listed in the proxy even though the Olympic issuance had enlarged the share count, which implies the fund manager added shares.516
The incentive design is better than many. McDonald's annual cash bonus and long-term equity awards are tied partly to return on average tangible common equity and to three-year relative total shareholder return compared with a peer group.5 Those are the right kinds of metrics for a bank: tangible returns penalize overpaying for acquisitions because goodwill is excluded, and relative shareholder return penalizes underperformance against peers rather than rewarding a rising market. The real test of an incentive plan, though, is what happens when performance misses. Here Heritage's record is revealing.
The 2023-to-2025 performance award paid out at just 8% of target.5 The relative shareholder-return component paid nothing, and the tangible-return component paid only 16% of its target, because both fell below the threshold ranges set in advance.5 That is strong evidence that the plan has teeth: management did not hit its targets, and management was not paid as if it had. It also confirms, from management's own scorecard, that Heritage underperformed its peers on shareholder return and on tangible profitability over those three years.
But there is a counterpoint in the same proxy. The board adjusted the 2024 incentive earnings measure to exclude securities losses and other items, which helped produce a 90% payout on the annual award for that year.5 The adjustment had a logic: the securities losses resulted from a deliberate restructuring that the board wanted management to undertake, and penalizing executives for a decision the board endorsed would discourage sensible capital management. Yet the effect was that a year of weak reported earnings produced near-target annual pay. Discretionary adjustments are not wrong in themselves, but they weaken the link between reported results and compensation, and investors should notice when the measure that matters to the bonus is not the one that matters to the shareholder.
The 2026 annual meeting gave a small but useful governance signal. Shareholders approved say-on-pay comfortably, with about 32.4 million votes for and about 645,000 against.17 Director dissent, however, was highest for two long-serving board members: lead independent director Brian Charneski, with about 433,000 votes against, and chairman Brian Vance, with about 432,000.17 Those numbers are small relative to the total, and there is no sign of activism. But proxy advisers and institutional holders often vote against long-tenured directors to signal concerns about board refreshment and independence. Ten of eleven director nominees were independent.5 The message is not rebellion; it is a quiet preference for a board that changes faster than this one has.
The other hygiene signals are clean, and they deserve only a brief mention. Crowe LLP, the auditor, gave unqualified opinions on both the 2025 financial statements and the company's internal controls, with no material weakness identified.3 Heritage reported no material pending litigation beyond routine matters, and the third-quarter filing said the company knew of no governmental proceeding contemplated against it.31 Loans to directors, executives and their affiliates were made in the ordinary course and were all performing at year-end, and there is no outside parent charging fees or royalties to the listed company.3 CFO Don Hinson's total pay rose to about $922,000 in 2025 from about $799,000 a year earlier, a moderate increase for the executive who carried the merger's financial planning.5 Nothing here suggests a governance problem. It simply leaves results, rather than red flags, as the thing to judge management by.
How has management's story moved between calls? In the second-quarter release, McDonald said that as fixed-rate loans repriced, "we expect that our net interest margin will continue to improve," and the company promised additional cost savings after the third-quarter conversion.15 In the third quarter, both promises were broadly kept: the margin rose, the conversion happened on schedule, and the CFO said the cost-savings target had been achieved.28 What changed was the tone on deposits, where Hinson now spoke of an inflection point, and on credit, where Chalfant had a new nonaccrual relationship to explain.8 Loan growth guidance was concrete, mid-single digits annualized for the next couple of quarters, but the commercial pipeline had fallen to about $399 million from $628 million in the second quarter.8 That is an honest disclosure, and it is the kind of number that management could have chosen not to volunteer.
The overall assessment is mixed in a specific way. McDonald is a credible operator who delivered the first conversion on time and gave measurable expense guidance. His time as chief executive is still short, the prior three-year award showed tangible returns and shareholder returns below peers under a leadership team in which he was a senior member, and the board's 2024 adjustment shows a willingness to soften the scorecard. Credibility should be judged by results over the next several quarters: realized returns on tangible equity, loan quality and delivery against the integration timetable. Before any of that, McDonald had already made one big decision that cost reported earnings, and it involved the bank's bond portfolio.
Repositioning Securities Bought Time—and Cost Earnings
The problem began with the low-rate era. In 2020 and 2021, deposits flooded into American banks as the government sent stimulus payments and businesses hoarded cash. Heritage, like nearly every bank, had more deposits than it could lend, so it bought bonds: Treasury and agency securities and mortgage-backed securities yielding 1% or 2%. When the Federal Reserve raised rates rapidly in 2022 and 2023, those bonds lost market value, and worse, they kept earning their low yields while deposit costs rose. A bank holding a large portfolio of 1.5% bonds funded by deposits costing more than that was losing money on every one of those dollars.
The fix is conceptually simple and emotionally painful. Sell the low-yield bonds, take the loss, and reinvest the proceeds in new bonds or loans at current yields. The loss is booked immediately; the higher income arrives over time. The trade pays off if the extra future income outweighs the loss before the bonds would have matured anyway. Heritage did this repeatedly. It booked securities-sale losses in 2023, 2024 and 2025, including about $10.7 million of realized losses in 2025 alone.3 KBRA named the repositioning losses of 2023 to 2025 as one of the constraints on its rating.9 Those losses are the main reason Heritage's 2024 EPS fell to $1.25 and its dividend payout ratio in that year rose to about 72% of earnings.3
Did it work? The margin improved substantially in 2026, rising to 4.05% in the third quarter.2 But attribution is complicated. Three forces moved the margin at once: the repricing of older loans and securities at higher rates, the acquisition of Kitsap's higher-yielding loan book, and the purchased-loan accretion from fair-value marks. The securities repositioning contributed to the first of those, but Heritage does not isolate its contribution, and the acquisition and accretion make it impossible to measure from the outside. By the end of September, the securities portfolio stood at about $1.60 billion, larger than at the end of 2025 because Kitsap brought its own bonds, which Heritage also repositioned after closing.1 The honest verdict is that the restructuring was a deliberate trade, sensible in logic, but not yet proven by results, because the improvement in recurring earnings it was meant to produce is entangled with the merger.
It helps to separate two kinds of losses that are easy to confuse. A market-value loss on a bond held for sale reflects interest rates: the bond is worth less because newer bonds pay more. A credit loss reflects the risk that the borrower will not pay. Heritage's third-quarter filing says the decline in value of its available-for-sale securities reflected interest rates, not credit, and the company recorded no credit allowance on them; its held-to-maturity securities were U.S. government or agency guaranteed.1 The bond book is a rate exposure, not a hidden credit problem.
The funding side matters too. At the end of September, the bank had about $121.9 million of Federal Home Loan Bank advances, all short-term and due during the fourth quarter.1 These are borrowings, separate from customer deposits, and they typically cost more than deposits. When Matthew Clark of Piper Sandler asked about those maturities on the call, the discussion centered on how they would be handled and on deposit betas, the share of a rate change that passes through to deposit costs.8 The fourth-quarter filing will show whether the advances were repaid from deposit growth and securities cash flow, renewed or replaced. Repaying them from deposits would reduce funding cost and support the margin; renewing them would suggest deposits are not growing fast enough to fund the balance sheet. The holding company also carries about $22.6 million of junior subordinated debentures, a small and long-standing obligation.1
Capital is the final piece. Tangible common equity, the bank's equity minus goodwill and intangibles, was 9.3% of tangible assets at the end of September, down from 9.7% a quarter earlier.2 Several forces pushed the ratio down. The Kitsap acquisition created goodwill and intangible assets that are subtracted from tangible equity, and the larger balance sheet increased the denominator. Accumulated unrealized losses on securities still weigh on equity. And Heritage spent $10.2 million buying back 341,483 shares in the third quarter.2 Earnings, net of the dividend, partly offset those reductions. The regulatory common equity tier 1 ratio was estimated at 11.9%, a comfortable cushion above minimum requirements, though KBRA had noted at the first quarter that Heritage's 12.2% CET1 ratio was slightly below the 12.5% peer average.29 Heritage is not undercapitalized, but its capital buffer is thinner than before the deal, and it is no longer an outlier on the strong side.
Liquidity tells a similar story of a cushion that is adequate rather than lavish. KBRA observed that on-balance-sheet liquidity had moderated to about 15% of assets and 18% of deposits, and that total net liquidity plus contingent borrowing capacity covered uninsured deposits roughly one for one at the first quarter.9 That one-to-one coverage is the number that matters in a panic: it means that if every depositor above the insurance limit asked for their money at once, the bank could in principle pay them without selling assets at fire-sale prices. The regional bank failures of 2023 taught investors to ask exactly that question. Heritage's answer is acceptable, but it leaves no room to be careless with the funding mix, which is why the fate of those maturing advances deserves attention. Off the balance sheet, Heritage also carried about $1.20 billion of unfunded loan commitments at the end of 2025, lines of credit and construction draws that customers can call on and that would need funding if they did.3
For a bank, free-cash-flow yields, enterprise-value multiples and debtor-day statistics are misleading because deposits and loans distort those measures. The useful lens is return on tangible equity relative to price-to-tangible-book, and the willingness of the market to pay for it. That is where the bull and bear cases meet.
Analysis & Bear vs. Bull Case
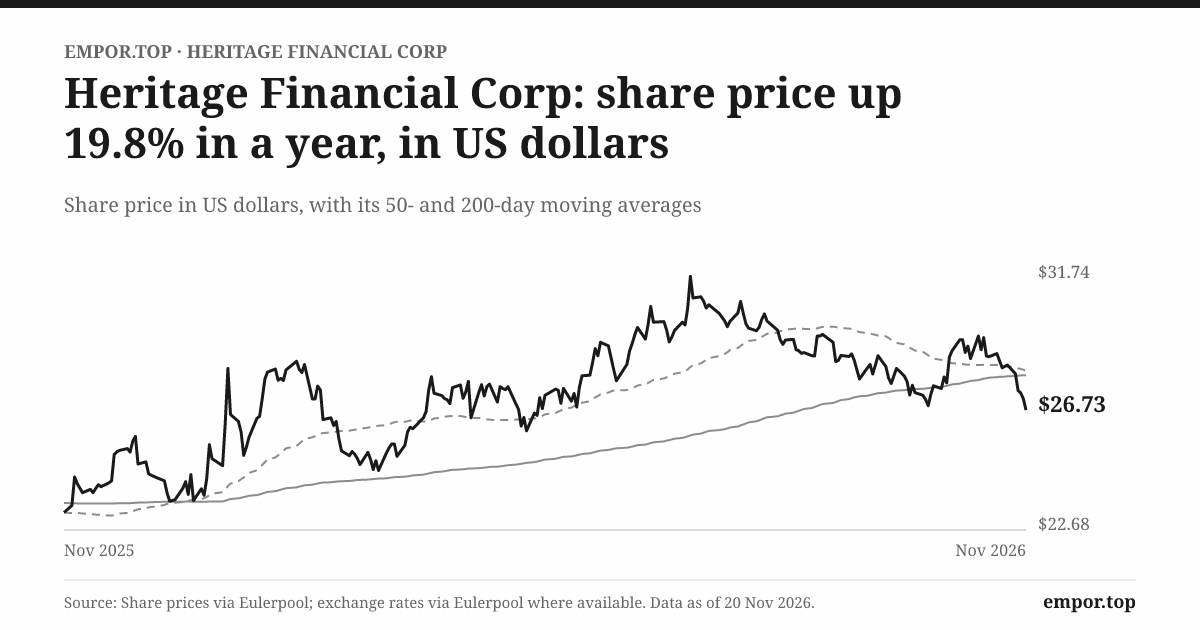
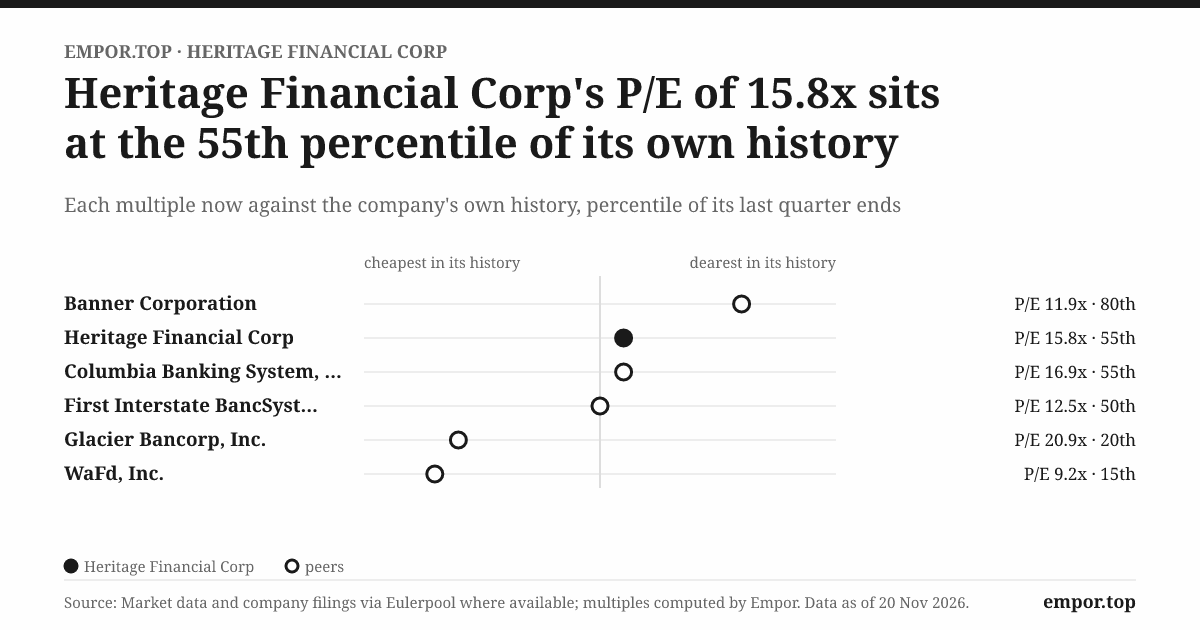
On November 20, 2026, Heritage's shares closed at $26.73, about 15% below their 52-week high of $31.25 and well above their low of $22.32, giving the company a market value of roughly $1.2 billion. At that price, the stock traded at about 15.8 times trailing earnings, against a five-year median of about 15.0 times, and at about 1.1 times book value. The dividend, $0.25 a quarter, yields about 3.7%.2 The bank is bigger after Kitsap, but it has not yet reported a full year of combined operations, and the market is pricing it close to its own historical average. Is that the right price for a bank in mid-transformation?
Start with the bull case, built from evidence rather than adjectives. KBRA measured a deposit-cost advantage of about half a percentage point, and roughly a quarter of Heritage's deposits pay no interest at all.92 Its five-year charge-off record remains clean.9 Its margin had improved to above 4%, and management said the repricing tailwind on older fixed-rate loans had moved higher, which should support net interest income from here.8 The Kitsap conversion happened on schedule, management said the cost-savings target was met, and the fourth-quarter expense guidance implied a leaner run rate.8 Third-quarter adjusted return on average tangible common equity was 12.75%; if merger costs fade and the margin holds, reported returns could approach that level, compared with 10.67% reported in the third quarter.2 A bank earning a sustained low-teens return on tangible equity at about 1.1 times book is not obviously expensive.
Now the bear case, with equal force. Heritage is a small fish in a big pond. Columbia Banking System is nearly eight times its size by assets and Banner more than twice.1011 Larger banks can spread technology and compliance costs over a bigger base, pay more for talent, and price loans more aggressively. On the third-quarter call, McDonald disclosed that seven affordable-housing projects totaling $103 million had left the pipeline: three shelved by the borrowers and four lost to competitors, mainly on price.8 That is a small but telling sign that, in competitive situations, Heritage's relationships do not override price. The commercial pipeline fell by more than a third between the second and third quarters, and loan payoffs rose.8 The transportation exposure and the rising criticized list test whether the clean credit record reflects discipline or simply benign conditions. And the deal math depends on full cost savings that management says it achieved but that have not yet appeared in reported efficiency.
The competitive pressure remains intense, with regional and national banks, credit unions, fintechs and private-credit lenders contesting parts of the relationship.
Hamilton Helmer's seven powers point to the same narrow moat: Heritage's best-supported edge is underwriting and relationship management, reflected in its five-year charge-off record. The deposit-cost advantage is promising, but there is no evidence of strong switching costs or pricing power, as the lost affordable-housing projects suggest.
Valuation comparisons need consistent terms. Heritage trades at about 15.8 times trailing reported earnings, while Columbia traded at about 10.0 times on the same close, which means Heritage carried a multiple roughly 60% higher.18 That premium looks hard to justify for a smaller bank. But Heritage's trailing earnings are depressed by merger costs. Adding management's adjusted EPS for the first three quarters of 2026 to the reported fourth quarter of 2025 gives trailing earnings of about $2.36 a share, and on that basis the multiple falls to roughly 11 times.2153 Columbia's own earnings also reflect acquisition effects from its recent deals, so neither multiple is clean. Mercer Capital's February 2026 peer report had Heritage at 14.1 times trailing earnings and 1.02 times book, against Banner at 10.9 times and 1.07 times.[^19] The pattern is consistent: on reported earnings, Heritage has traded at a premium to its larger peers, while on book value it has traded roughly in line. The market appears to be giving Heritage credit for earnings recovery that adjusted figures suggest is coming but that reported figures have not yet shown.
What does the price assume? At about 1.1 times book and a return on tangible equity in the low teens, the market seems to expect that the merger savings stick, that credit losses stay modest, and that the margin holds near 4%. That is not heroic, but it is not cautious either. If returns settle near the 10% to 11% reported in the third quarter rather than the 12% to 13% adjusted figure, the current multiple would look full.
Capital allocation deserves a skeptic's eye. Heritage issued about $185 million in stock to buy Olympic and then, within months, spent $10.2 million repurchasing shares and authorized a new program for up to 5% of its shares, about 2.0 million.12 Issuing stock at one price and buying it back at a similar price can make sense if the buyback is at a discount to intrinsic value, but it also invites the question of why the company did not simply issue fewer shares. Hinson said Heritage would probably be less active on buybacks in the fourth quarter.8 With the tangible-equity ratio down to 9.3% and criticized loans rising, retaining capital may prove the wiser use. An activist would push on exactly this: if buybacks are attractive, why issue stock for acquisitions; and if acquisitions are attractive, why spend capital on buybacks while integrating one?
The skeptical investor's central question deserves its full weight. If the acquisition case relies on full cost savings, and management says those savings have been achieved, why should investors credit them before they appear in the reported efficiency ratio and per-share earnings? The answer is that they should not, at least not fully. The fourth-quarter results will provide the first clean quarter of combined operations after conversion, and the 2027 results, after the commercial online-banking conversion, will provide the real test.
Three numbers will tell the story over the next year. The first is organic growth in loans and deposits, measured from the post-acquisition base: third-quarter increases were positive, but the shrinking pipeline suggests the pace may slow.28 The second is the efficiency ratio and reported EPS as merger costs fade; both remained below their adjusted readings in the third quarter.2 The third is whether criticized and nonaccrual loans stabilize and charge-offs remain low.82
The confidence level is clear. The deposit franchise is promising but incompletely evidenced, because Heritage does not disclose retention and the noninterest-bearing share has slipped. The integration is plausible but unproven, because savings have not yet shown up in reported numbers. Management has made a consequential bet whose results will take several more quarters to judge. That is not a reason for alarm; it is a reason to watch the next few quarters closely, and the history of this company offers a few lessons about how to watch.
Playbook: Business & Investing Lessons
Heritage's acquisition chart climbs in steps: a jump in 2014, another in 2018, and another in 2026. On the same pages of the company's disclosures sits the 2023-to-2025 performance award, paid at 8% of target. Those two images, a staircase of size and a near-empty bonus pool, frame the lessons this bank's history offers.
The first lesson is that a branch is a doorway, not a moat. When Heritage absorbed Whidbey Island Bank in 2014, it added about $1.7 billion of assets and a network of branches north of Seattle.4 That map was useful, but it did not by itself earn returns. Per-share earnings in 2025 were only modestly above 2019's, despite the larger footprint.3 The advantage, if there is one, lives in the cost of the deposits behind each doorway, in how long those customers stay and in the price at which loans can be made without losing the deal. Founders and investors in any distribution-heavy business should remember Heritage's example: a footprint is an option on an advantage, and it has to be exercised through better economics before it counts.
The second lesson is that a price is a promise about the future. Heritage issued about 7.17 million shares for Olympic, and the favorable deal math, 7.8 times earnings rather than 20.4, assumes savings that the company says it achieved but that still need to appear in reported results.112 Every stock-funded acquisition is a promise from the acquirer's managers to its existing shareholders: give up a fifth of your bank today, and the combined business will earn more per share tomorrow. Investors should treat the promise the way a lender treats a borrower's projections, with respect and a requirement for collateral, and the collateral here is reported earnings per share.
The third lesson is that credit risk arrives late. Heritage's five-year charge-off record, about $3.5 million in total, is the kind of history that makes a bank look safe.9 Then, in a single quarter, nonaccrual loans doubled, led by one transportation relationship. The clean record is genuine, and it tells investors something about underwriting culture. But it was set in an era of low rates and government support, and credit cycles do not announce themselves. The lesson for investors in any lender is that the best years for credit statistics are often the years in which the next problem loans are being written.
The fourth lesson is that incentives are most revealing when performance misses. Heritage's compensation plan uses the right metrics, return on tangible equity and relative shareholder return, but the plan's design mattered less than what it did when results fell short: it paid 8% of target.5 That is stronger evidence of accountability than any statement of intent. The same proxy, however, showed the board adjusting the 2024 annual measure to exclude securities losses, producing a 90% payout.5 The lesson cuts both ways: a plan's honesty is revealed in the years when it is tested, and investors should check whether the measure that pays the bonus is the measure that pays the shareholder.
Each of these lessons belongs to Heritage specifically. The bank did not suffer from a lack of growth; it suffered from growth that did not translate into per-share returns. Its next chapter will be judged not by how large it becomes but by whether the deposits, credit discipline and returns survive the growth.
Epilogue
Tonight, Heritage Financial stands as a bigger bank than it was a year ago, with about $8.5 billion of assets, a completed core conversion and a margin above 4%. It is also a bank in the middle of proving something. The first full quarter after conversion closes at the end of December, and the results, due in early 2027, will be the first clean look at the combined franchise.
The next filing will answer the funding question first. The FHLB advances due in the fourth quarter will have been repaid, renewed or replaced.1 If deposits covered them, Heritage's funding story improves and the margin gets a little help. If the bank had to renew borrowings, it will suggest deposit growth is slowing just as deposit costs reached their inflection point. Alongside that, investors will see whether the deposit cost and noninterest-bearing share held up through the conversion, or whether customers quietly moved balances.
Then comes the cost question. The fourth-quarter expense guidance will show whether the company says its savings target has been achieved, or whether new investments are offsetting the savings.8 The remaining commercial online-banking conversion will be the next operational milestone, and a smooth one would remove a meaningful risk to business deposits.8
The credit question will be answered over two quarters rather than one. The transportation relationship will move toward resolution: repayment, recovery through collateral and the government guarantee, a charge-off, or a return to accrual. The criticized-loan list will either stabilize or keep rising. If it stabilizes, the third quarter's jump will look contained. If it climbs, the clean five-year charge-off record will offer less reassurance.
Finally, the per-share question will be answered only over a full year. Investors will need to judge diluted EPS against its pre-merger level, accounting for organic loan and deposit growth, purchase-accounting accretion and buybacks. Only then can the valuation question be resolved: whether returns on tangible equity and reported earnings show that the acquisition earned its cost.
The story remains open because the acquisition has not yet passed through a full year of combined earnings, and the credit trends are still moving. The bank has met the deadline for its core conversion. It has not yet shown the results that make that deadline matter.
Outro
In January, Heritage made its $185 million bet on Kitsap.1 Nothing physical moved. A promise did.
Heritage is a community bank trying to turn local relationships into regional scale, and the stock it issued bought a bigger footprint. The next chapters must show what that footprint earns. The question its history leaves behind is the one every growing community bank eventually faces: can it stay disciplined enough, in pricing, in credit and in capital, to make scale matter?
References
-
Q3 2026 Form 10-Q — Heritage Financial Corporation, 2026-11-06 ↩↩↩↩↩↩↩↩↩↩↩↩↩↩↩↩↩↩↩↩↩↩
-
Q3 2026 Earnings Release — Heritage Financial Corporation, 2026-10-22 ↩↩↩↩↩↩↩↩↩↩↩↩↩↩↩↩↩↩↩↩↩↩↩↩↩↩↩↩
-
2025 Form 10-K — Heritage Financial Corporation, 2026-02-27 ↩↩↩↩↩↩↩↩↩↩↩↩↩↩↩↩↩↩↩↩↩↩↩↩
-
Q3 2026 Investor Presentation — Heritage Financial Corporation, 2026-10-22 ↩↩↩↩↩↩
-
2026 Proxy Statement — Heritage Financial Corporation, 2026-03-20 ↩↩↩↩↩↩↩↩↩↩↩↩↩↩↩↩
-
Puget Sound Bancorp Acquisition Announcement — Heritage Financial Corporation, 2017-07-26 ↩
-
Puget Sound Acquisition Investor Presentation — Heritage Financial Corporation, 2018-04-27 ↩↩
-
Q3 2026 Earnings-Call Transcript — The Motley Fool, 2026-10-22 ↩↩↩↩↩↩↩↩↩↩↩↩↩↩↩↩↩↩↩↩↩↩↩↩↩↩↩↩↩
-
KBRA Affirms Ratings for Heritage Financial Corporation — KBRA, 2026-05-22 ↩↩↩↩↩↩↩↩
-
Columbia Banking System Q3 2026 Earnings Presentation — Columbia Banking System, 2026-10-22 ↩↩
-
Olympic Acquisition Investor Presentation — Heritage Financial Corporation, 2025-09-25 ↩↩↩↩↩
-
Olympic Merger Agreement Form 8-K — Heritage Financial Corporation, 2025-09-25 ↩
-
Q2 2026 Earnings Release — Heritage Financial Corporation, 2026-07-23 ↩↩↩↩
-
2026 Annual Meeting Vote Results Form 8-K — Heritage Financial Corporation, 2026-05-08 ↩↩
-
Columbia Banking System Statistics — Stock Analysis, 2026-11-22 ↩
 LinkedIn
 WhatsApp
 Reddit
 Hacker News
 Email
 Kindle
 RSS Feed
 Spotify
 Apple Podcasts
 Amazon Music
 Audible
 YouTube