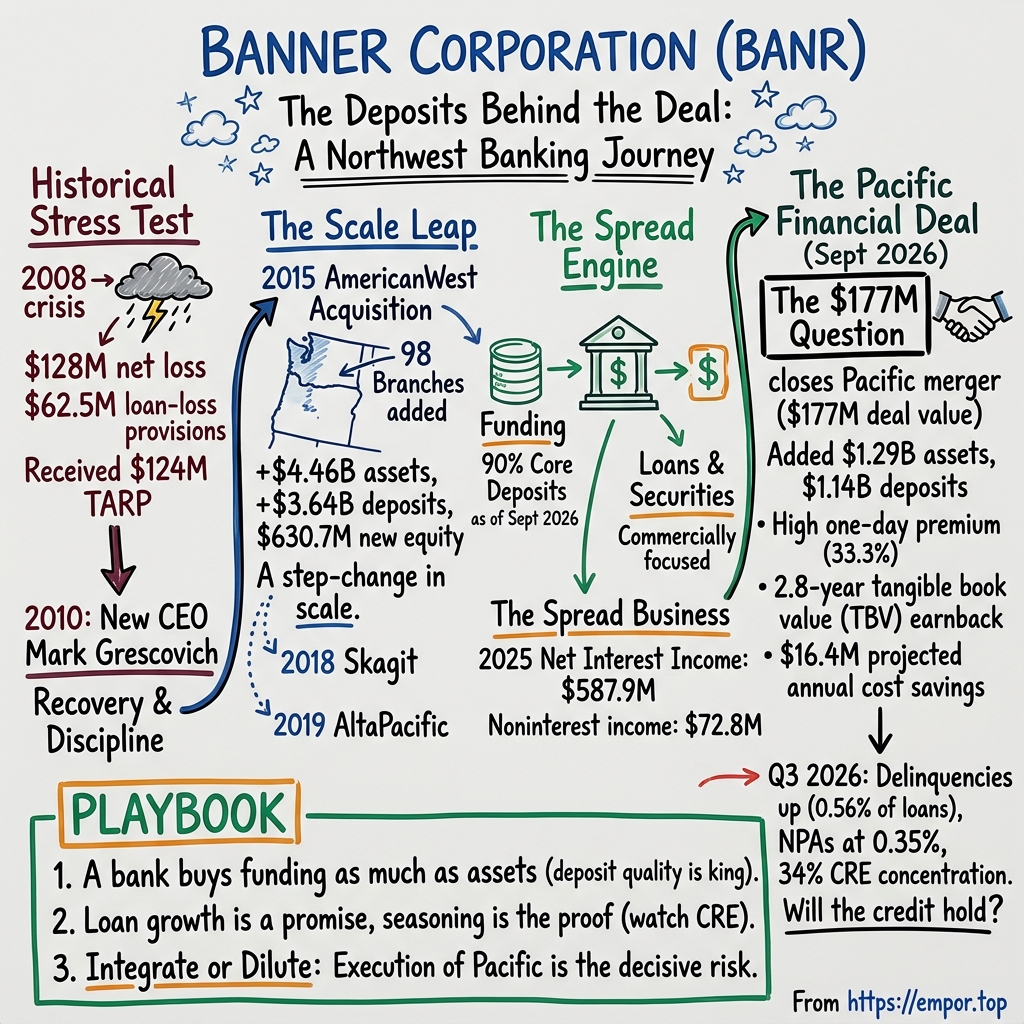
Banner Corporation: The Deposits Behind the Deal
I. The $177 Million Question
On September 1, 2026, a 55-year-old community bank headquartered in Aberdeen, Washington, a timber and fishing town on Grays Harbor where the Chehalis River meets the Pacific, stopped being independent. Pacific Financial Corporation and its operating bank, Bank of the Pacific, became part of Banner Corporation, the Walla Walla-based holding company for Banner Bank.12 No cash changed hands for the company itself. Each Pacific share became 0.2633 of a Banner share, and Banner issued about 2.66 million new shares to make the exchange.31 Eighteen offices, fifteen in Washington and three in Oregon, now flew the Banner name, along with $1.14 billion of deposits and about $766 million of loans.14
Three weeks later, Banner reported its first results with the new bank inside it, and the numbers seemed to argue with one another. Net interest margin, the spread a bank earns on its assets after paying for its funding, rose to 4.14%, up from 3.98% a year earlier and the best reading in the recent run.1 Net income, however, fell to $47.7 million from $53.5 million in the third quarter of 2025, and diluted earnings per share slid from $1.54 to $1.36.1 The engine was running hotter while the dashboard showed less profit. Part of the explanation sat in two lines: about $5.2 million of merger and acquisition expenses, and a $2.1 million loss from selling the investment portfolio Banner inherited from Pacific.1 Strip those out, and adjusted earnings came to $1.51 a share. Even that adjusted figure sat below the year-earlier quarter, because the bank was also carrying more shares, a higher expense base and slightly larger credit provisions.1
That juxtaposition is the whole story in miniature. When Banner agreed to buy Pacific in April 2026, the deal carried an announced value of about $177 million.2 By the time it closed, the consideration had risen to $186.8 million, not because Banner agreed to pay more, but because its own stock had climbed and the exchange ratio was fixed.1 In an all-stock bank merger, the price tag is a moving shadow cast by the buyer's share price. The real price is a slice of the company: Pacific's shareholders ended up owning about 7% of the combined Banner.2 The question for every other Banner shareholder is simple to state and hard to answer. Will 7% of the future earnings of this bank turn out to be a fair trade for what Pacific brought in?
Four questions sit underneath that one, and they will follow this story to its end. The first is about deposits: can Banner keep gathering cheap, sticky money from local households and businesses and lend it out profitably, even as rates and competitors push on the cost of that money? The second is about discipline: can a bank that has grown largely by buying other banks keep doing so without paying away the value it is trying to create? The third is credit: as the loan book expands, through both organic lending and acquired portfolios, will borrowers keep paying? And the fourth is management: has the team led by chief executive Mark Grescovich, in charge since 2010, earned the benefit of the doubt on this next deal?
Some ground rules matter before the investigation begins. Banner Corporation is the listed holding company; Banner Bank is the operating franchise that takes deposits and makes loans, and the consolidated accounts are essentially the bank's accounts.5 The third quarter of 2026 included only one month of Pacific's results, so it is not a picture of the combined bank at full stride, and the systems conversion that would put Pacific's customers onto Banner's platforms was scheduled for mid-October, after the quarter ended.4 Any verdict on the deal drawn from a single quarter would be premature.
The second ground rule is about how to read a bank at all. For an industrial company, an investor might start with cash conversion: does profit turn into cash? For a bank, that shortcut misleads, because loans and deposits are not working capital around the business. They are the business. A bank's "inventory" is money, its "suppliers" are depositors, and its "receivables" are loans that may or may not be repaid. Earnings quality shows up not in a cash-flow ratio but in the cost and stability of deposits, the spread earned on them, and the slow, revealing evidence of whether borrowers pay on time.
By the end of 2025, those ingredients had built a bank with about $16 billion of assets, revenue of roughly $661 million and net income of $195.4 million.6 It had not always looked so composed. To understand why Banner's management talks about credit discipline the way a person who once nearly drowned talks about swimming, the story has to go back to a year when the bank lost more money than it had earned in a long time.
 Subscribe on LinkedIn
II. The Crisis That Made Growth Expensive
In January 2009, Banner Corporation told shareholders what 2008 had cost. The answer was $128 million, a net loss of $7.94 for every diluted common share.7 The fourth quarter alone accounted for $78.5 million of it.7 Then-chief executive D. Michael Jones struck a steady tone, saying management continued to believe that revenue and operating results would be sufficient for the bank to remain "well capitalized."7 The fact that the sentence needed saying at all was a measure of how far things had moved.
The anatomy of that loss is a short course in how banks fail. A bank's earnings can look steady for years because the losses in a loan book arrive late. Borrowers keep paying until the day they cannot, and collateral looks solid until buyers disappear. In the Pacific Northwest of the mid-2000s, the riskiest part of that book was residential construction: loans to builders for houses, lots and land that only made sense if the housing boom continued. At Banner, one-to-four family construction and related lot and land loans made up about 23% of the total loan portfolio at the end of 2008, and they accounted for a remarkable 82% of nonperforming assets.7 When home prices broke, those loans broke first.
The accounting followed a familiar sequence. First came provisions, the money a bank sets aside against expected loan losses, which jumped to $62.5 million in 2008 from $5.9 million the year before.7 Nonperforming assets climbed to $209.2 million, or about 4.6% of total assets, nearly five times their level a year earlier.7 Then came the less obvious blow. Banks that grow by acquisition carry goodwill, the premium they paid over the fair value of what they bought, as an asset on the balance sheet. When the value of the franchise falls, that premium has to be written down. Banner wrote off $121.1 million of goodwill in 2008, including a $71.1 million noncash charge in the fourth quarter.7 The write-down did not drain cash, but it was an admission in accounting form that earlier deals were worth less than the bank had paid for them.
On November 21, 2008, Banner received $124 million from the U.S. Treasury's Capital Purchase Program, the bank-capital piece of TARP, in exchange for senior preferred stock.7 That capital bought time rather than a cure. In June 2010 Banner raised another $148 million of common equity, a raise that diluted existing owners heavily, and the American Banker later described the period that followed as one in which the bank "continued to bleed money."8 An analyst at D.A. Davidson called the company a "reclamation project."8 The Treasury's preferred shares were eventually sold to private investors, which meant the government exited but the claim on Banner's earnings remained to be paid down over time.8
This is where the current management era begins, and the boundary matters. Mark Grescovich arrived from Akron, Ohio, where he had spent years at FirstMerit Corporation, holding a series of commercial and corporate banking posts from 1994 onward, including chief credit officer, before becoming executive vice president and chief corporate banking officer.9 Earlier he had been a credit analyst and lending officer at Society National Bank in Cleveland. Banner named him president in April 2010, and he became chief executive later that year, after the capital raise.98 He was, by training, a credit man hired into a credit disaster.
His early public statements were notably unglamorous. In 2012, with Banner back to profitability but still uncertain, Grescovich said that the focus was "on improving profitability and return to our stakeholders, not necessarily size."8 He also made an admission that would become one of the most useful clues in this story: "Our cost of deposits is significantly higher than our peers."8 At the end of 2009, core deposits, the stable checking, savings and money-market balances that banks prize over rate-sensitive certificates of deposit, made up only about half of Banner's deposits.10
So what does 2008 tell an investor in 2026? It does not indict today's management, which inherited the damage rather than causing it. Nor does it prove that the lesson was learned. What it does is establish the failure mode with unusual precision. Banner's crisis was a concentration problem in construction lending, amplified by goodwill from past acquisitions, and resolved through dilutive capital. Each of those three ingredients, construction exposure, acquisition goodwill and new share issuance, is present in some form today. The difference lies in proportion: construction and land loans were about 14% of the book in September 2026, with one-to-four family construction about 5%, compared with 23% for the riskiest residential categories in 2008.47 The current franchise has kept credit costs low for years; KBRA calculated provision expense of only about 6 basis points of average assets over the three years to mid-2026.11 But low losses in a benign period are what every bank shows before a downturn. The real test of the lending discipline built after 2010 is the next recession, and it has not yet arrived.
What Banner did once it had stopped bleeding is the more surprising part of the story. The president who warned against chasing size went on to make one of the largest acquisitions in the bank's history.
III. The $4.5 Billion Acquisition That Changed Banner's Map
On October 1, 2015, Banner closed the deal that turned it from a recovering Inland Northwest lender into a West Coast regional bank. It bought Starbuck Bancshares, the holding company for AmericanWest Bank, adding about $4.46 billion of assets at fair value, $3.0 billion of net loans and $3.6 billion of deposits.12 AmericanWest came with 98 branches, and the combined company operated in five western states: Washington, Oregon, California, Idaho and Utah.1213 The combined institution had more than $9.8 billion of assets at year-end, roughly double the size of the legacy bank.12
The deal had been signed on November 5, 2014, at an announced value of about $702 million.13 By closing, it had become roughly $760.7 million, made up of $130 million in cash and 13.23 million Banner shares valued at $630.7 million.1213 As with Pacific a decade later, the gap between announced and final value reflected movement in Banner's own share price, not a renegotiation. The point to hold onto is the share count. Banner paid for its largest acquisition primarily with its own stock, so the cost was measured in ownership, not dollars.
AmericanWest did not arrive alone. In June 2014, Banner had bought six branches in southwest Oregon, assuming $212 million of deposits and booking a $9.1 million bargain-purchase gain, meaning it paid less than the fair value of what it got.12 In March 2015 it closed the purchase of Siuslaw Financial Group, a 10-branch Oregon coastal bank with about $370 million of assets, for $63.9 million, mostly in stock.12 Taken together, the three transactions represented a step change built from a sequence: a cheap branch deal to test the waters, a small bank to build density on the Oregon coast, then a transformational acquisition across the region.
What did the scale cost? The cleanest way to see it is in tangible book value, the equity per share left after subtracting goodwill and other intangibles, which is the measure bank investors use to judge whether a deal created or destroyed value for existing holders. At the end of 2015, Banner's tangible book value was $29.66 per share, essentially unchanged from $29.64 a year earlier.12 That looks like a deal that paid for itself. But the ratio of tangible common equity to tangible assets fell from about 12.3% to 10.7% over the same year, with most of the decline arriving in the quarter AmericanWest closed.12 Banner had doubled its balance sheet while thinning its capital cushion per dollar of assets, a reasonable trade at a moment when it held more capital than it needed, but a trade nonetheless.
The year's earnings showed the cost of integration as well. Net income fell to $45.2 million, or $1.89 a diluted share, from $54.1 million, or $2.79 a share, in 2014, as merger expenses tied to AmericanWest reached $24.1 million for the year and the new shares spread earnings across a larger base.12 Grescovich called 2015 "a truly transformational year."12 Both things were true. The bank was bigger and broader; the shareholders, for the moment, were earning less per share.
Banner did not stop. On November 1, 2018, it completed the purchase of Skagit Bancorp, adding about $916 million of assets and 11 branches along the Interstate 5 corridor from Seattle to the Canadian border, for $180 million paid mostly in about 3.1 million Banner shares.14 Exactly a year later it closed AltaPacific Bancorp, a Santa Rosa, California, bank with six branches and about $426 million of assets, for $87.6 million, again mostly in stock.14 These were smaller deals, closer to infill than transformation, and they pointed toward the shape of a repeatable capability. Banner bought banks in or next to markets it already served, paid largely in shares, and integrated them into a common platform.
What exactly is that capability? There are three candidates. One is local deposit gathering: the acquired banks brought customers who kept their checking accounts after conversion. Another is branch density: each deal let Banner spread fixed costs, from compliance to technology, over more customers in the same towns. The third is systems integration, the unglamorous craft of moving loan and deposit records from one core banking system to another without losing customers in the confusion. The strongest evidence for the first is what happened to Banner's funding mix over the decade. Core deposits went from about half of total deposits in 2009 to 90% by September 2026.10 Some of that came from acquired franchises and some from organic gathering, and Banner does not publish a clean split between the two over the full period.
That missing split is the reason for proportion in judging the long record. From 2015 to 2025, reported revenue rose from about $305 million to about $661 million, and net income from $45.2 million to $195.4 million, compound growth of roughly 8% and 16% a year.156 Those figures flatter the organic engine because they start in a year depressed by merger costs and include every acquired balance since. A more honest yardstick is per-share tangible value. Tangible book value per share went from $29.66 at the end of 2015 to $45.84 at the end of September 2026, which works out to roughly 4% a year compounded, before counting the dividends paid along the way.121 That is respectable for a bank that also paid out a meaningful share of earnings, but it is not the growth rate that the asset totals suggest. Buying scale did build a broader franchise. Whether it built proportionally more value per share is a narrower claim, and the evidence leaves it intact but modest.
Which raises the question the acquisitions cannot answer by themselves: once the branches are on the map, what actually makes a customer choose Banner, and keep choosing it?
IV. A Bank Sells a Spread, One Relationship at a Time
Picture an ordinary transaction in a mid-sized town in eastern Washington. A family-owned distributor wants to buy the warehouse it has rented for a decade. It goes to its banker at Banner, who has watched its payroll account rise and fall with the seasons for years, and asks for a commercial real estate loan. The bank lends, say, a few million dollars against the building at a rate fixed for some years. Meanwhile, the company's operating cash, the money that passes through on its way to employees and suppliers, sits in a Banner checking account that pays little or nothing. On one side of the relationship, the bank earns interest. On the other, it borrows from the same customer almost for free. Multiply that by tens of thousands of businesses and households, and the result is a bank.
The product Banner sells, in other words, is a spread. It earns interest on loans and securities, pays interest on deposits and other borrowings, and keeps the difference, which is what net interest income measures. In 2025 that figure was $587.9 million, against $72.8 million of noninterest income.6 Put another way, close to nine dollars in every ten of Banner's revenue came from the spread. Fees were a supporting cast: deposit service charges brought in about $43 million, mortgage banking about $13 million, and bank-owned life insurance, a tax-advantaged investment in policies banks hold on their employees, about $10 million.6 There is no single large contract, no subscription, no customer that matters on its own. Banner does not report any customer above 10% of revenue, and nothing in its business model would lead anyone to expect one.5
That shapes how growth enters the model. Volume comes from two directions: loan demand from borrowers and deposit gathering from savers and businesses. Rates and customer mix then decide whether that volume improves the spread or erodes it. A bank can grow loans quickly and earn less if it has to fund them with expensive certificates of deposit or wholesale borrowings. It can grow slowly and earn more if its loans reprice upward while its deposits stay put. The art is in the second column of the ledger, the funding.
That is where the third quarter of 2026 looks strong. About 32% of Banner's average funding came from noninterest-bearing deposits, the checking balances on which the bank pays nothing at all.10 Interest-bearing checking, savings and money-market accounts cost about 1.84%, and certificates of deposit about 3.15%.10 Blended together, Banner's total cost of deposits was 1.38% in the quarter, up 5 basis points from the second quarter but down from 1.50% a year earlier.14 Core deposits, excluding larger certificates and brokered money, made up 90% of the total.1 KBRA, which rates Banner's debt, put the bank's cost of deposits nearly 50 basis points below its rating-category peers in June 2026, and it called the deposit franchise granular, retail-oriented and low-cost.11
This is the most important single fact about Banner's business, and it represents a complete reversal of the bank that Grescovich inherited. In 2012, he had acknowledged the deposit-cost problem.8 By 2026 an independent rating agency was saying the opposite. That shift happened under the same chief executive, over the same span in which Banner made its acquisitions, which makes it the strongest piece of evidence that the strategy of the past fifteen years did something real. Banner calls its model a "super community bank": the product range of a regional bank, sold to middle-market companies, small businesses and consumers, with lending decisions made close to the client.10 The label is marketing. The deposit cost is evidence.
The way to put that evidence in proportion is scale. When Banner agreed to buy Pacific, its $16.3 billion of assets put it squarely in the middle of a group of publicly traded banks with $10 billion to $20 billion of assets, whose median was about $15.6 billion.16 It is not a giant in its own markets either. In Washington and Oregon it competes with national banks such as U.S. Bank, JPMorgan Chase and Wells Fargo, each many times its size, and with regional rivals that have themselves consolidated into larger institutions. Banner is a mid-sized fish in a pond with whales.
Michael Porter's competitive forces explain why a low deposit cost is valuable but not automatically durable. Depositors can move their money with a few taps on a phone, and in a rising-rate environment money-market funds and online banks offer yields that a checking account cannot match. Borrowers, particularly the commercial borrowers who make up most of Banner's loan book, can shop for loans and negotiate on rate. The large banks have scale advantages in technology and marketing. Banner's counter is relationship banking: a commercial customer with a loan, an operating account, payroll services and a banker who knows the business faces real inconvenience in moving all of it. That is the theory. What Banner does not publish is the evidence that would prove it: customer retention rates, the average tenure of deposit relationships, or how much of its pricing reflects loyalty rather than market rates. The low deposit cost is consistent with switching costs, but it is also consistent with a customer base that has simply not yet been tested by a long period of high rates.
The rate cycle was, in fact, turning while this story was being written. On the October call, chief financial officer Robert Butterfield described the bank as slightly asset-sensitive, meaning its loans and securities reprice faster than its deposits when rates rise, and noted that roughly a quarter of the loan book repriced upward after the Federal Reserve's September rate increase.4 Management expected the margin to widen in the fourth quarter. It also modelled deposit betas, the share of each rate increase passed on to interest-bearing depositors, of between 28% and 40%.4 That range is the bet in numerical form. If depositors accept a third of each increase, the spread grows. If competition forces Banner toward the top of the range or beyond, the advantage narrows. The analysts on the call were already pressing on deposit pricing, and management acknowledged intense competition for both loans and deposits.4
There is also a slower-moving risk on the asset side. At the end of 2025, Banner's securities portfolio had an effective duration of about 6.2 years, meaning its market value is meaningfully sensitive to interest rates.6 When rates rise, those bonds fall in value, which does not hit reported earnings unless they are sold but does reduce tangible equity and limits how freely the bank can reposition. The loss Banner booked on selling Pacific's portfolio in the third quarter was a small, deliberate example: management chose to take the hit and redeploy the cash into loans rather than hold someone else's bonds.4
Volume in the third quarter was encouraging on both sides. Organic loans, excluding Pacific, grew by about $235 million, roughly 8% annualized, and organic deposits by about $463 million, about 13% annualized.10 Management guided to mid-single-digit loan growth into 2027 and warned that about $100 million of seasonal agricultural deposits would leave early in the fourth quarter.4 One quarter of strong organic deposit growth is a positive data point, not a trend. The proof of a deposit franchise is boring: core deposit share and cost holding steady through a full rate cycle, loan growth reported separately from acquired balances, and a margin that survives competition.
A spread business has a hidden partner, though, and it collects its share later. Every loan that funds the spread is also a promise by a borrower to pay, and the question of whether those promises are being kept is the one that has decided Banner's fate before.
V. The Loan That Looks Safe Until It Doesn't
On October 22, 2026, chief credit officer Jill Rice gave analysts the credit update, in a tone that was measured rather than alarmed. Most of the problem loans of any size were idiosyncratic, Rice said, the result of individual borrowers' circumstances rather than a pattern driven by rates.4 The bank was watching consumer, small-business and office exposures. Rice also offered a warning that carried more weight than its length: the rising-rate environment Banner was moving into would be "an initial headwind" for builders, who were already cautious about starting new homes.4
To understand why that matters, it helps to translate a bank's balance sheet into the language of an ordinary company. For a manufacturer, the question about receivables is whether customers pay their invoices. For a bank, the receivables are the loans, and the vocabulary of collection is specific. A delinquent loan is one where payments are late. A nonaccrual loan is one where the bank has stopped counting expected interest as income because it doubts it will be paid. Nonperforming assets add foreclosed property to the nonaccrual loans. Charge-offs are the losses the bank finally writes off. And the allowance for credit losses is the reserve the bank holds against losses it expects but has not yet recognized.
On the first two measures, Banner's book in September 2026 looked healthy in absolute terms and worse than a year before. Nonperforming assets were $63.0 million, or 0.35% of total assets, up from 0.27% a year earlier, though slightly better than 0.36% in June.1 Delinquent loans, including nonaccruals, were 0.56% of loans, up from 0.39% a year earlier and 0.51% in June.1 The allowance stood at $171.6 million, or 1.32% of loans, and it covered nonperforming loans almost three times over.1 Net charge-offs for the quarter were just $704,000.1 By comparison with the 2008 crisis, these are tiny numbers. By the standards of a bank whose earnings depend on keeping them tiny, the direction matters more than the level.
The second-quarter movement offers a clue to where the pressure sits. Between March and June 2026, nonaccrual construction and land loans tripled, from about $4 million to about $13 million, accounting for most of the rise in nonperforming loans that quarter.17 That is a small dollar amount for a bank with $13 billion of loans, but it is exactly the category that broke Banner in 2008, and the chief credit officer's warning about builders points in the same direction.
The loan book's concentrations explain why credit migration, not loan growth, is the central test. Commercial real estate made up about 35% of loans in September 2026, split among owner-occupied properties, investment properties and smaller-balance loans.10 Construction lending added to the exposure, and multifamily lending made up about 7%.10 Office buildings, the most worried-about property type since the pandemic emptied downtown towers, accounted for about 5.5% of loans, roughly half of it owner-occupied, with an average loan size of about $800,000 and a largest exposure of $18 million.10 Those numbers describe a granular, small-ticket book rather than a bank betting on skyscrapers. KBRA nonetheless identified the concentration in commercial real estate and construction-and-development lending as the chief constraint on Banner's ratings, even as it noted that nonperforming assets and net charge-offs had stayed below peer levels on five-year averages.11
There is a reason the auditor focuses on the same place. In its 2024 report, Banner's auditor singled out the allowance for credit losses as its critical audit matter, the part of the financial statements that required the most challenging and subjective judgment.5 Under the current accounting standard, a bank must estimate losses over the entire life of its loans at the moment it makes them, using economic forecasts and assumptions about how borrowers will behave. The resulting number is an educated guess dressed as a precise figure. The auditor gave an unqualified opinion, which means the process and the estimate were reasonable on the evidence then available. It does not mean the future losses are settled, and the difference is worth remembering whenever a bank's allowance ratio drifts lower while delinquencies drift higher, as Banner's did over the year to September.1
Pacific adds a new wrinkle. Acquired loans enter the books at fair value, with an estimate of expected losses built into the price. Banner marked Pacific's loans down by about 1.18% for credit at announcement.18 Pacific itself had been a clean book, with nonperforming assets of only about 0.05% of assets in early 2026.18 That is reassuring but also short. Acquired loans have their own seasoning curve, and the borrowers who have just watched their bank be absorbed by a larger one may behave differently, especially if a familiar loan officer departs.
The arithmetic of the quarter makes the stakes clear. Total loans rose by about $1 billion in the quarter, to $13.0 billion, but Pacific supplied about $766 million of that, and organic growth was about $235 million.110 Originations, the new loans written during the quarter, reached $1.28 billion, up 61% from a year earlier, with commercial real estate leading the growth.4 Strong origination volume in a rising-rate environment is a double-edged statistic. It shows demand and the effectiveness of new bankers hired from disrupted competitors, which Rice cited as a source of growth.4 It also creates a large cohort of new loans whose performance will not be visible for two or three years.
That is the falsification test, stated plainly. If the legacy and acquired loans season without charge-offs climbing meaningfully above their recent near-zero levels, and without the allowance needing to be rebuilt, then the conservative-credit story that KBRA tells about Banner gains real support, tested by a rate cycle rather than a calm. If delinquencies keep rising from 0.56% and nonaccruals spread from a few construction projects into broader categories, no amount of cheap deposit funding will protect the earnings story, because a single bad year of losses can consume several years of spread. For now, the evidence leaves the credit record intact but under watch: problem loans are modest and rising, and the next several quarters, with acquired loans included, will show which way the line bends.
Which brings the story back to the deal itself, and to a question that the credit numbers cannot answer: did Banner pay a sensible price for what it bought?
VI. The Pacific Deal: A Fair Price, With a High Bar for Integration
The sale of Pacific Financial began not in Walla Walla but in Aberdeen, at a September 2025 strategic-planning meeting of Pacific's board.16 The directors reviewed the bank's prospects as an independent company with their adviser, Piper Sandler, and the picture was sobering in a quiet way. Pacific's profitability was roughly in line with the industry, but its loan and deposit growth had lagged peers, its stock traded thinly, and the pool of potential merger partners was small and shrinking.16 Over three years, its shares had risen about 128% against 158% for its peer group.16 By December, the board had voted to run a targeted sale process.
On January 29, 2026, Piper Sandler contacted five potential buyers. Four signed confidentiality agreements, including Banner.16 By early March, three had submitted non-binding offers. Banner proposed 0.2566 of its shares for each Pacific share, worth about $15.42 a share or $156 million at the time. A rival identified only as Party A offered more, about $16.42 a share or $166 million. Party B offered about $14.07.16 On March 10, Pacific's board chose to pursue Banner anyway, citing lower execution risk, a similar business model, a strong strategic and geographic fit, and the liquidity of Banner's stock, and it asked for 0.27 shares.16 Three days later, Banner raised its ratio to 0.2633, the two sides agreed exclusivity, and on April 30 the merger agreement was signed.16
That background reveals something the press release did not. Banner did not win by overpaying. It won with a bid that was below a competing offer, because Pacific's directors judged Banner's stock a more reliable currency and its integration a safer bet. For Banner's own shareholders, that is a mildly encouraging sign about discipline: when another bidder went higher, Banner moved only modestly.
The headline numbers then moved on their own. Banner's stock closed at $66.25 on April 29, 2026, which made the fixed ratio worth about $17.44 per Pacific share and about $177 million in total.2 By closing on September 1, the value had reached $186.8 million.1 In return, Banner received a bank with about $1.29 billion of assets, roughly $757 million of net loans at fair value and $1.14 billion of deposits.1 Pacific's loans were only about 68% of its deposits, far below Banner's own ratio of 84% after the deal.184 That gap is the strategic point. Pacific had more deposits than it could lend, and they were cheap: about 38% of them paid no interest, and the total cost of deposits was about 1.03%.18 Banner, with more loan demand than its legacy funding comfortably supported, was buying a reservoir of low-cost money in towns along the Washington coast and lower Columbia River.
Was the price fair? The Piper Sandler analysis in the merger proxy gives the most useful benchmarks. Banner paid about 1.54 times Pacific's tangible book value, against a median of 1.43 times for a set of comparable precedent bank deals.16 On trailing earnings, it paid about 14.3 times, almost exactly the 14.2 times median.16 The core deposit premium, the premium paid over tangible book expressed as a share of core deposits, was 5.9% against a 4.8% median.16 On those measures the price was slightly rich but not out of line. The one number that stands out is the one-day market premium, the gap between the deal price and Pacific's share price the day before the announcement: 33.3%, against a median of 7.9%.16
That outlier deserves interpretation rather than alarm. A thinly traded stock like Pacific's often sits well below the value a strategic buyer would pay, so a large market premium can reflect an illiquid market price more than an extravagant offer. It is also worth remembering that precedent-deal samples vary, and that Pacific's unusually low loan-to-deposit ratio and deposit quality are exactly the features a buyer pays up for. On the evidence of the fairness analysis, the price was not obviously excessive. It was, however, a full price, which leaves very little margin for error in execution.
Management's case rested on its own set of numbers. Banner's April presentation projected cost savings of about 40% of Pacific's expected 2027 noninterest expense, or roughly $16.4 million a year, with 75% captured during 2027 and all of it thereafter.18 It anticipated $25.5 million of one-time, pre-tax merger expenses, a fee-income loss of about $1.4 million, and, once the savings were fully in place, about 3.2% accretion to Banner's earnings per share.18 Tangible book value per share would be diluted by about 2% at closing and earned back in about 2.8 years, with an internal rate of return above 25%.18 Piper Sandler's analysis, using Banner management's assumptions, showed the deal accretive to earnings per share from 2027 through 2030 and dilutive to tangible book value per share through 2028.16
People are part of the price too. Banner's plan included a retention program for selected Pacific leaders, with chief executive Denise Portmann expected to join Banner Bank as an executive vice president.1816 Her existing employment agreement entitled her to a lump sum of three times her highest recent base salary and three times her average cash bonus if she were terminated without cause within two years of a change in control, a standard protection in community-bank deals that also gives the acquirer a clear incentive to keep her, and keep her happy.16 Pacific's adviser, Piper Sandler, earned a fee of 1.5% of the purchase price, contingent on the deal closing, a reminder that everyone on the sell side was paid to get to signature, while Banner's shareholders are paid only if the integration works.16 In a bank whose value rests on relationships, the retention of the people who hold them is not a soft issue. It is the mechanism by which the deposits stay.
A rough calculation shows why the savings carry the whole case. Pacific earned a return on assets of about 0.97% in the first quarter of 2026, which on $1.29 billion of assets implies annual earnings in the region of $12 million to $13 million.18 Seven percent of Banner's 2025 net income of $195.4 million is about $14 million.6 Without cost savings, Banner gave away slightly more earnings power than it received. With roughly $16 million of pre-tax savings, worth perhaps $13 million after tax, the acquired earnings roughly double, which is how the deal priced at about 6.3 times 2027 earnings with savings fully phased in.18 The deal works if, and largely only if, the savings arrive and the customers stay.
The first quarter of ownership showed the bill arriving before the benefits. Merger expenses jumped from about $238,000 in the second quarter to $5.2 million in the third.1 Selling Pacific's securities produced a $2.1 million loss.1 The efficiency ratio, the share of revenue consumed by expenses, worsened to about 65% from about 60% a year earlier, and return on average tangible common equity fell to about 11.6% from about 14.2%.1 Tangible book value per share fell about 4% in the quarter to $45.84, more than the roughly 2% closing dilution in the April deck, as merger costs and the quarter's other moving parts landed at once.118 On the October call, management said about 10% of the targeted 40% savings had been achieved, with the bulk timed around the systems conversion and the remainder by mid-2027.4
Because the deal was paid in stock, the test is not whether Banner can service debt. It took on none to do it. The test is whether the 2.66 million new shares earn an adequate return after costs, dilution and integration.3 The structure gave Pacific's holders a stake in Banner's future, which aligned the incentives on the way in. It also means that if integration goes badly, Banner's existing shareholders bear 93% of the consequences.
Every deal is ultimately a bet on the people executing it. So who are they, and what does their record say about whether this one will work?
VII. The Statements Behind the Story
Open Banner's 2024 annual report to the cash-flow statement, and a reader trained on industrial companies will feel a small thrill. Net income for the year was $168.9 million. Cash provided by operating activities was $293.2 million, almost three-quarters more.5 The pattern held in earlier years as well, with operating cash flow above net income in 2022 and 2023.5 For a software or consumer company, that would look like superb earnings quality, profit turning into even more cash.
For a bank, the thrill is misplaced, and understanding why is a useful lesson in how bank accounting works. Banner's real operating activity, making loans and taking deposits, does not show up in the operating section at all. Loans that the bank holds for investment are classified as investing activities, so a year of strong lending appears as a large cash outflow in investing. Deposit inflows and outflows are classified as financing activities. What remains in the operating section is a mixture: net income, plus noncash charges such as depreciation, stock compensation and loan-loss provisions, plus the flow of mortgage loans the bank originates to sell, plus changes in other assets and liabilities.5 The gap between operating cash flow and net income in 2024 reflects those mechanics, especially the timing of mortgage loans held for sale. It is not proof that Banner converts profit to cash unusually well, and it would be equally wrong to read a future year's shortfall as a warning. For a bank, the cash-flow statement is a supplement to the balance sheet, not a verdict on it.
Where does the money actually go, then? The clearest signals are in what Banner spends on itself. Purchases of property and equipment ran at about $14 million to $15 million a year between 2022 and 2024, a modest sum for a bank of Banner's size, and staffing stayed close to 1,950 full-time-equivalent employees throughout.5 Neither figure suggests a bank pouring money into new branches or a hiring spree. Banner does not report research and development as a separate line, which is normal for a bank, but its 2025 results pointed to rising information-technology and software costs and a major new loan and deposit origination system.6 That is where a modern regional bank's reinvestment goes: into the systems that let a banker open an account or approve a loan quickly, and that will determine whether Pacific's customers noticed the conversion as a hiccup or a headache. The modest capital spending and flat headcount before the deal also matter for the Pacific case. They suggest Banner's cost base was already reasonably lean, so the savings must come from absorbing Pacific's overhead rather than from a broader efficiency program.
A second trap for the unwary sits in the parent-company accounts. In 2024 Banner Corporation, the holding company, reported about $88 million of dividends from its subsidiaries and another $91 million of equity in their undistributed earnings, and it held a $50 million note receivable from Banner Bank.5 Those are real flows inside the group, but they are the bank paying its owner, not outside revenue. In the consolidated accounts they disappear, as they should. Banner has no outside parent, promoter or private-equity controller extracting fees, and its 2024 annual report and 2026 proxy describe no royalties or management fees flowing to any related party.519
The related-party lending that does exist is small. Loans to directors, officers and their affiliates totaled $682,600 at the end of 2024, made on the same terms and under the same underwriting standards as comparable loans to unrelated customers.5 That is around a tenth of one percent of annual revenue, an ordinary feature of community banking, where directors are often local business owners who also bank with the institution. It closes the related-party question rather than opening one.
The debt side of the balance sheet is similarly plain, once deposits are recognized as the funding base they are. At the end of 2024, Banner's borrowings consisted mainly of $290 million of Federal Home Loan Bank advances, about $125 million of other borrowings, about $80 million of subordinated notes and about $68 million of junior subordinated debentures, a legacy of earlier eras of bank capital raising.5 The subordinated notes include $100 million of 5% fixed-to-floating notes issued in 2020 and due in 2030, issued at a time when such debt counted toward regulatory capital and cost little.5 Lease liabilities on branches and offices, about $44 million, are a separate obligation, not borrowing in the ordinary sense.5 By September 2026, Banner had repaid its Federal Home Loan Bank advances entirely, down from $320 million at the end of June, using Pacific's excess liquidity and its own deposit growth.1 A bank that does not need wholesale funding at the top of a rising-rate cycle has a real, if temporary, advantage. The subordinated notes due in 2030 are the one piece of corporate debt that will eventually need refinancing, and Banner has given no sign of strain in that respect.
A handful of smaller trust items round out the picture, and none of them is large. The 2024 tax note reports about $2.0 million of unrecognized state tax benefits, positions the company has taken that might not survive an audit.5 A class action, Bolding v. Banner Bank, was settled, with the final payment made in the third quarter of 2024 and no further obligation.5 The 2025 results referred to a $0.4 million rise in fourth-quarter professional and legal expense tied to a pending legal settlement without naming the matter.6 Banner's derivatives are interest-rate swaps, loan-sale forward commitments and mortgage rate locks, tools for managing rate risk in the mortgage pipeline; the bank describes no foreign-currency exposure or hedging, which fits a lender whose customers are in four western states.5
The auditor's verdict on 2024 was clean, with unqualified opinions on the financial statements and internal controls.5 The allowance remains the least verifiable estimate, and the Pacific acquisition and rising delinquencies are putting it under pressure.
If the statements are sound and the judgment calls sit where they should, the remaining question is about the people making those calls, and about how they are paid to make them.
VIII. Can the Same Team Keep Earning the Right to Buy?
Mark Grescovich has now run Banner for roughly sixteen years, a tenure long enough that almost every important decision in the modern bank's history carries his signature. His path from credit repair to acquisition-led growth can be read as hypocrisy or as sequencing. The generous reading is that Grescovich first rebuilt the deposit base and credit culture and only then used Banner's stock to buy franchises that fit. The evidence supports the generous reading more than the cynical one, because the deposit transformation happened and the large deals came after the repair. But the long record also means that shareholders are not judging a new team's promises. They are judging a familiar team's next bet.
The team around him has been stable as well. Robert Butterfield, the chief financial officer, and Jill Rice, the chief credit officer, both took the analysts' questions on the October call.4 The 2026 proxy shows no change in the chief executive or chief financial officer roles in 2024 or 2025.19 Stability is a strength in integration, because the people who ran the earlier conversions are still there. It is also a risk to independent challenge, because a team that has done many deals together may underrate the ways the next one differs.
Pay has risen with profits. Grescovich's total reported compensation was about $3.59 million in 2025, up from about $2.26 million in 2024, as net income rose from $168.9 million to $195.4 million.196 His annual incentive was about $1.15 million, reported at 110% of target.19 Butterfield's total compensation rose from about $0.80 million in 2023 to $1.30 million in 2025.19 The direction of pay tracking the direction of earnings is what a compensation committee would want to show. The jump in the chief executive's pay was proportionally larger than the jump in profits, though 2024 had been a weak year, and the proxy also disclosed an off-cycle equity grant and relocation benefits for chief operating officer Mark Costa, including a relocation payment of about $152,000 and a tax gross-up of about $50,000.19 Gross-ups are the kind of small detail governance investors dislike, more for what they signal than for what they cost.
Shareholders, on balance, accepted the package. At the May 2026 annual meeting, the advisory vote on executive pay passed with about 23.5 million votes in favor and 1.3 million against.20 Twelve of Banner's thirteen directors are independent.19 Director Roberto Herencia drew the largest opposition of any board nominee, about 4.3 million votes against.20 That is a signal of some dissent concentrated on one director, not evidence of a governance crisis, and Banner's institutional ownership, led by BlackRock and Vanguard with filings showing about 15% and 11% respectively, means those votes largely reflect index-fund policies rather than an activist campaign.19
Capital allocation is where trust is earned or lost, and Banner's record forms a sequence. In 2015 it issued about 13 million shares to buy AmericanWest and accepted a sharp drop in its capital ratio. In 2018 and 2019 it issued smaller amounts of stock for Skagit and AltaPacific. In late 2025 it bought back about 250,000 shares at an average of about $63, then paused buybacks while the Pacific deal was pending.6 In 2026 it issued about 2.66 million shares for Pacific, and in September, with the deal closed, it bought back 200,000 shares at about $71.31 Buying back stock at $71 shortly after issuing it to Pacific holders at a reference price of $66 is not inconsistent: the buyback offsets part of the dilution, and the sale and purchase served different purposes. But it is a reminder that the bank's own stock is both its currency and its investment.
Judged on per-share results rather than size, the record since AmericanWest is better than the acquisition-year optics suggested. Diluted earnings per share went from $1.89 in 2015, a year weighed down by merger costs, to $5.64 in 2025, roughly tripling while the share count grew to accommodate the acquisitions.126 Part of that came from the falling burden of merger expenses and part from the higher-rate environment that widened bank margins across the industry, so not all of it is management skill. But the per-share figures do show that the shares issued in 2015, 2018 and 2019 were not simply wasted. The deals added earnings faster than they added shares, at least over a decade measured from a depressed starting point. The test for Pacific is whether the same holds over a much shorter horizon, with the savings carrying more of the load.
The quality of management's explanations matters as much as the decisions. On the October call, prepared remarks attributed the year-over-year earnings decline to merger costs and the securities loss.4 That is accurate as far as it goes. The fuller picture, visible in the results, is that adjusted earnings per share were also lower than a year earlier and that return on tangible equity fell by more than two and a half percentage points.1 Management gave specific numbers on synergy progress and a date for the conversion, which is the kind of concrete disclosure that allows investors to hold it to account. Asked about further acquisitions, Grescovich said Banner remained open to deals but was focused on integration.4 That answer, too, is the right one, provided that the focus is real.
The skeptical investor's challenge comes down to two questions. First, if Banner's organic engine was producing loan growth of about 8% annualized and deposit growth in double digits in the same quarter, why buy another bank at all?10 The best answer is that organic deposit growth is lumpy and seasonal, and Pacific's reservoir of cheap money gives Banner capacity to keep lending without paying up for funding. Second, what return must the acquired deposits and the cost cuts deliver to justify issuing 7% of the company? The promised savings and earnback are measurable.
Banner's leadership has a long record and has completed multiple acquisitions, but that history does not, by itself, prove repeatable shareholder returns. Tangible value per share has compounded at a respectable but unspectacular pace since 2015. The next proof is specific: realized savings, credit quality in the combined book, and earnings per share after the dilution. Which is the moment to put all the evidence on the table and argue both sides.
IX. Analysis & Bear vs. Bull Case
The same balance sheet can be read two ways. Read optimistically, Banner's funding position and margin support growth, and Pacific adds deposits to the franchise.111 Read skeptically, credit pressure is rising as Banner absorbs a full-priced acquisition and its returns on tangible equity fall.1 Both readings use true numbers. The investment case depends on which way those numbers move from here.
The bull case starts with funding. Banner's deposit transformation and KBRA's assessment remain its strongest support.1011 Margin trends and management's repricing outlook add to the case.4 If Banner retains Pacific's deposits and captures the planned savings while keeping credit costs near their recent lows, the added density in western Washington and Oregon can lift earnings in a way that compounds. The agreed price and Pacific's low loan-to-deposit ratio also leave room for lending, and Banner's lower bid than Party A suggests restraint.161816
The bear case starts with competition. The competition and unproven switching costs remain concerns. The deal's premium, tangible-book dilution and unproven savings leave little room for integration or customer attrition to disappoint.16 Credit remains the most serious objection: real-estate exposure, rising construction nonaccruals and the builders' rate headwind.10174
Porter's five forces sharpen the bear's point. Buyer power is significant on both sides of the balance sheet: depositors can move money, and commercial borrowers negotiate rates. The threat of substitutes is real, from money-market funds and online savings accounts on the deposit side to private credit and nonbank lenders on the loan side. Rivalry is intense, as management acknowledged on the call.4 Supplier power, in a bank's terms, is the power of depositors and wholesale lenders to demand higher rates, and Banner's ability to repay all its Federal Home Loan Bank advances in the quarter shows it is not currently dependent on expensive funding.1 The threat of new entrants is moderated by regulation and the capital required to charter a bank, but digital banks enter the deposit market without branches at all. On balance, the industry structure is difficult. Banner's position within it is reasonable, not dominant.
Hamilton Helmer's seven powers offer a stricter test, and Banner passes it only partially. It has no network effects; one more depositor does not make the bank more valuable to the others. It has no cornered resource, such as a patent or a unique license. Counter-positioning does not apply; large banks could copy the community model if they chose. Switching costs are plausible for commercial customers with bundled services, but they are not demonstrated in the disclosures. What remains are two modest powers. One is a form of scale economy at the local level: branch density in specific towns spreads fixed costs and builds brand recognition, which is exactly what deals like Pacific and Skagit buy. The other is process power, the accumulated know-how of underwriting and integrating, supported by Banner's post-2010 credit record and deposit transformation. Neither is a deep moat. Both are real enough to produce better-than-average returns for as long as execution stays good.
Three numbers will reveal which side is winning. The first is core-deposit share and cost, which remain favorable.1 The second is net interest margin, which has expanded.1 The third is delinquency and charge-off migration across legacy and acquired loans, with delinquencies rising over the past year.1 To these add two that measure whether acquisitions benefit shareholders rather than just the balance sheet: realized cost savings against the $16.4 million target, and return on tangible common equity, which fell to 11.6% in the quarter.181
Valuation can only be framed with care. In the merger analysis, using prices at the April 2026 reference date, Banner traded at about 1.4 times tangible book value against a 1.6 times median for its selected peers, and at about 11 times trailing core earnings against a peer median of about 13.3 times.16 That is historical context drawn from a transaction document, not a current valuation conclusion. It suggests that, at that moment, the market was pricing Banner close to its peers on assets and somewhat below them on earnings, as though investors gave its low-cost deposits less credit than the rating agency did.
On balance, the bull case has evidence in the funding transformation, the credit record since 2010 and a deal price near benchmarks. The bear case has evidence in rising delinquencies, real estate concentration, unproven switching costs and savings that have not yet arrived. Scale by itself does not decide it. Per-share returns after integration will. The question then becomes what, beyond the numbers, this story teaches.
X. Playbook: Business & Investing Lessons
Set two moments side by side. Banner's 2015 AmericanWest deal and its 2026 Pacific deal both asked shareholders to wait as earnings per share fell. The first bet has had a decade to prove itself. The second has had seven weeks. Both asked shareholders to wait, and the lessons are in what made the wait worth it, or not.
A bank buys funding as much as it buys assets. Pacific's cheap deposits were the prize. But deposits are not owned the way a building is owned. They are lent to the bank, one customer at a time, and they can leave. Every bank acquisition is, at its core, a wager that customers will stay with an institution they did not choose. The founders and investors who build or back acquisitive businesses of any kind should recognize the pattern: when the asset walks out the door at night, the purchase price is a bet on loyalty.
Loan growth is a promise; loan seasoning is the proof. Banner's rapid loan growth and rising delinquencies, against the memory of its 2008 construction losses, make the point. Growth in a loan book reports itself immediately and fails slowly. Investors in any business that books revenue before it knows whether customers will pay, from lenders to buy-now-pay-later firms to insurers, should weight the vintage over the headline.
A fair price still needs a return. Pacific's price was near median, but the deal still depends on the savings Banner projected. Comparable-deal benchmarks tell a buyer that it was not reckless. They do not tell it that it was right. A median price means the acquirer must deliver at least a median integration just to stand still.
Local is an operating choice, not a moat by itself. Banner's deposit-cost reversal under Grescovich shows that its community-bank model can produce results. But "community" is a description of how the bank chooses to operate, not a barrier a competitor cannot cross. The proof sits in deposit costs, retention and credit outcomes, measured through a cycle. A strategy becomes a moat only when the numbers keep holding after the conditions that created them have changed.
XI. Epilogue
As of October 24, 2026, the Pacific integration is in its most delicate phase. The systems conversion that would move Bank of the Pacific's customers onto Banner's platforms was scheduled for mid-October.4 For a depositor in Grays Harbor or Pacific County, Washington, that event is the merger. Before conversion, the bank they used had a new owner on paper. In the conversion, their online login, their debit card and possibly their branch hours change. Conversions are the moment when acquired customers decide whether the new bank is theirs.
The next milestones are already on the calendar. Banner's fourth-quarter results, expected in January 2027, will be the first with three full months of Pacific inside them, and they will show whether the deposit base held through conversion, net of the seasonal agricultural outflow management had already flagged.4 Management has said it expects to reach a much larger share of the 40% cost target by the start of 2027 and the full run-rate by mid-2027.4 Banner's April plan projected that about 75% of the $16.4 million in savings would be realized during 2027.18 The difference between targeted and realized savings will be the first concrete grade on the deal, and it will be visible in noninterest expense, quarter by quarter.
The 2027 promise is the larger one. The 2027 accretion target is the larger promise.2 If that happens alongside stable credit, the deal will have done what management said. If accretion arrives only because the margin widened for reasons unrelated to Pacific, or if it is consumed by higher provisions, then the acquisition will have added size without adding much value per share.
On credit, the important reading is the one that starts from 0.56% delinquencies. If that number stabilizes, and if nonaccruals stay confined to a few construction projects, then Banner's post-2010 credit culture will have passed its first rate-rising test with a larger book. If it keeps rising, and if the allowance has to be rebuilt from 1.32% of loans, the conversation will shift from synergies to losses.1
The four questions from the start remain open, but each now has a measurable answer coming. Deposits: does the core share hold near 90% at a cost that rises more slowly than rates? Discipline: do the savings arrive on schedule, and does Banner resist another deal until they do? Credit: do the new and acquired loans season cleanly? Management: does the team that rebuilt Banner after 2008 deliver per-share results that match its promises? After a full year of combined operations, the market will know a great deal more than it does today. Tonight, the deal's logic is plausible and its price is not an obvious outlier, but its value has not yet been demonstrated in Banner's reported results.
XII. Outro
Go back to Aberdeen: the September handover and the quarterly report that followed capture the gap between buying a bank and earning its customers. The first takes a signature and newly issued shares. The second takes years, and it is never finished.
Banner has shown it can build a low-cost deposit base. Whether Pacific turns that into more value per share remains unproven. The deal is the next test, and the answer will come from depositors and borrowers rather than announcements.
References
-
Banner Corporation Reports Net Income of $47.7 Million, or $1.36 Per Diluted Share, for Third Quarter 2026 — Banner Corporation, 2026-10-21 ↩↩↩↩↩↩↩↩↩↩↩↩↩↩↩↩↩↩↩↩↩↩↩↩↩↩↩↩↩↩↩↩↩↩
-
Banner Corporation to Acquire Pacific Financial Corporation — Banner Corporation, 2026-04-30 ↩↩↩↩↩
-
Acquisition Completion, Form 8-K — Banner Corporation, 2026-09-01 ↩↩↩
-
Banner (BANR) Q3 2026 Earnings Call Transcript — The Motley Fool, 2026-10-22 ↩↩↩↩↩↩↩↩↩↩↩↩↩↩↩↩↩↩↩↩↩↩↩↩
-
2024 Annual Report — Banner Corporation, 2025 ↩↩↩↩↩↩↩↩↩↩↩↩↩↩↩↩↩
-
Banner Corporation Reports Net Income of $51.2 Million for Fourth Quarter 2025; Earns $195.4 Million, or $5.64 Per Diluted Share, for Full Year 2025 — Banner Corporation, 2026 ↩↩↩↩↩↩↩↩↩↩↩
-
2008 Fourth Quarter and Year-End Results — Banner Corporation, 2009-01-28 ↩↩↩↩↩↩↩↩↩
-
Banner Finds Stability, but Its Future Remains Unclear — American Banker, 2012-09-20 ↩↩↩↩↩↩↩
-
Banner Corporation Names Mark J. Grescovich President — Idaho Business Review, 2010-04-14 ↩↩
-
Q3 2026 Investor Presentation — Banner Corporation, 2026-10-21 ↩↩↩↩↩↩↩↩↩↩↩↩↩
-
KBRA Affirms Ratings for Banner Corporation — KBRA, 2026-06-16 ↩↩↩↩↩
-
Banner Corporation Earns $45.2 Million, or $1.89 Per Diluted Share, in 2015; Fourth Quarter Highlighted by Completed Acquisition of AmericanWest Bank — Banner Corporation, 2016-01-27 ↩↩↩↩↩↩↩↩↩↩↩↩
-
Banner Corporation in Acquisition of AmericanWest Bank — Cleary Gottlieb, 2015-10-01 ↩↩↩
-
Pacific Financial Merger Proxy Statement/Prospectus, Form S-4 — Banner Corporation and Pacific Financial Corporation, 2026 ↩↩↩↩↩↩↩↩↩↩↩↩↩↩↩↩↩↩↩↩
-
Second Quarter 2026 Results, Exhibit 99.1 to Form 8-K — Banner Corporation, 2026-07-22 ↩↩
-
Acquisition of Pacific Financial Corporation, Investor Presentation — Banner Corporation, 2026-04-30 ↩↩↩↩↩↩↩↩↩↩↩↩↩↩
-
2026 Proxy Statement — Banner Corporation, 2026-04-06 ↩↩↩↩↩↩↩↩
-
2026 Annual Meeting Results, Form 8-K — Banner Corporation, 2026-05-22 ↩↩
 LinkedIn
 WhatsApp
 Reddit
 Hacker News
 Email
 Kindle
 RSS Feed
 Spotify
 Apple Podcasts
 Amazon Music
 Audible
 YouTube