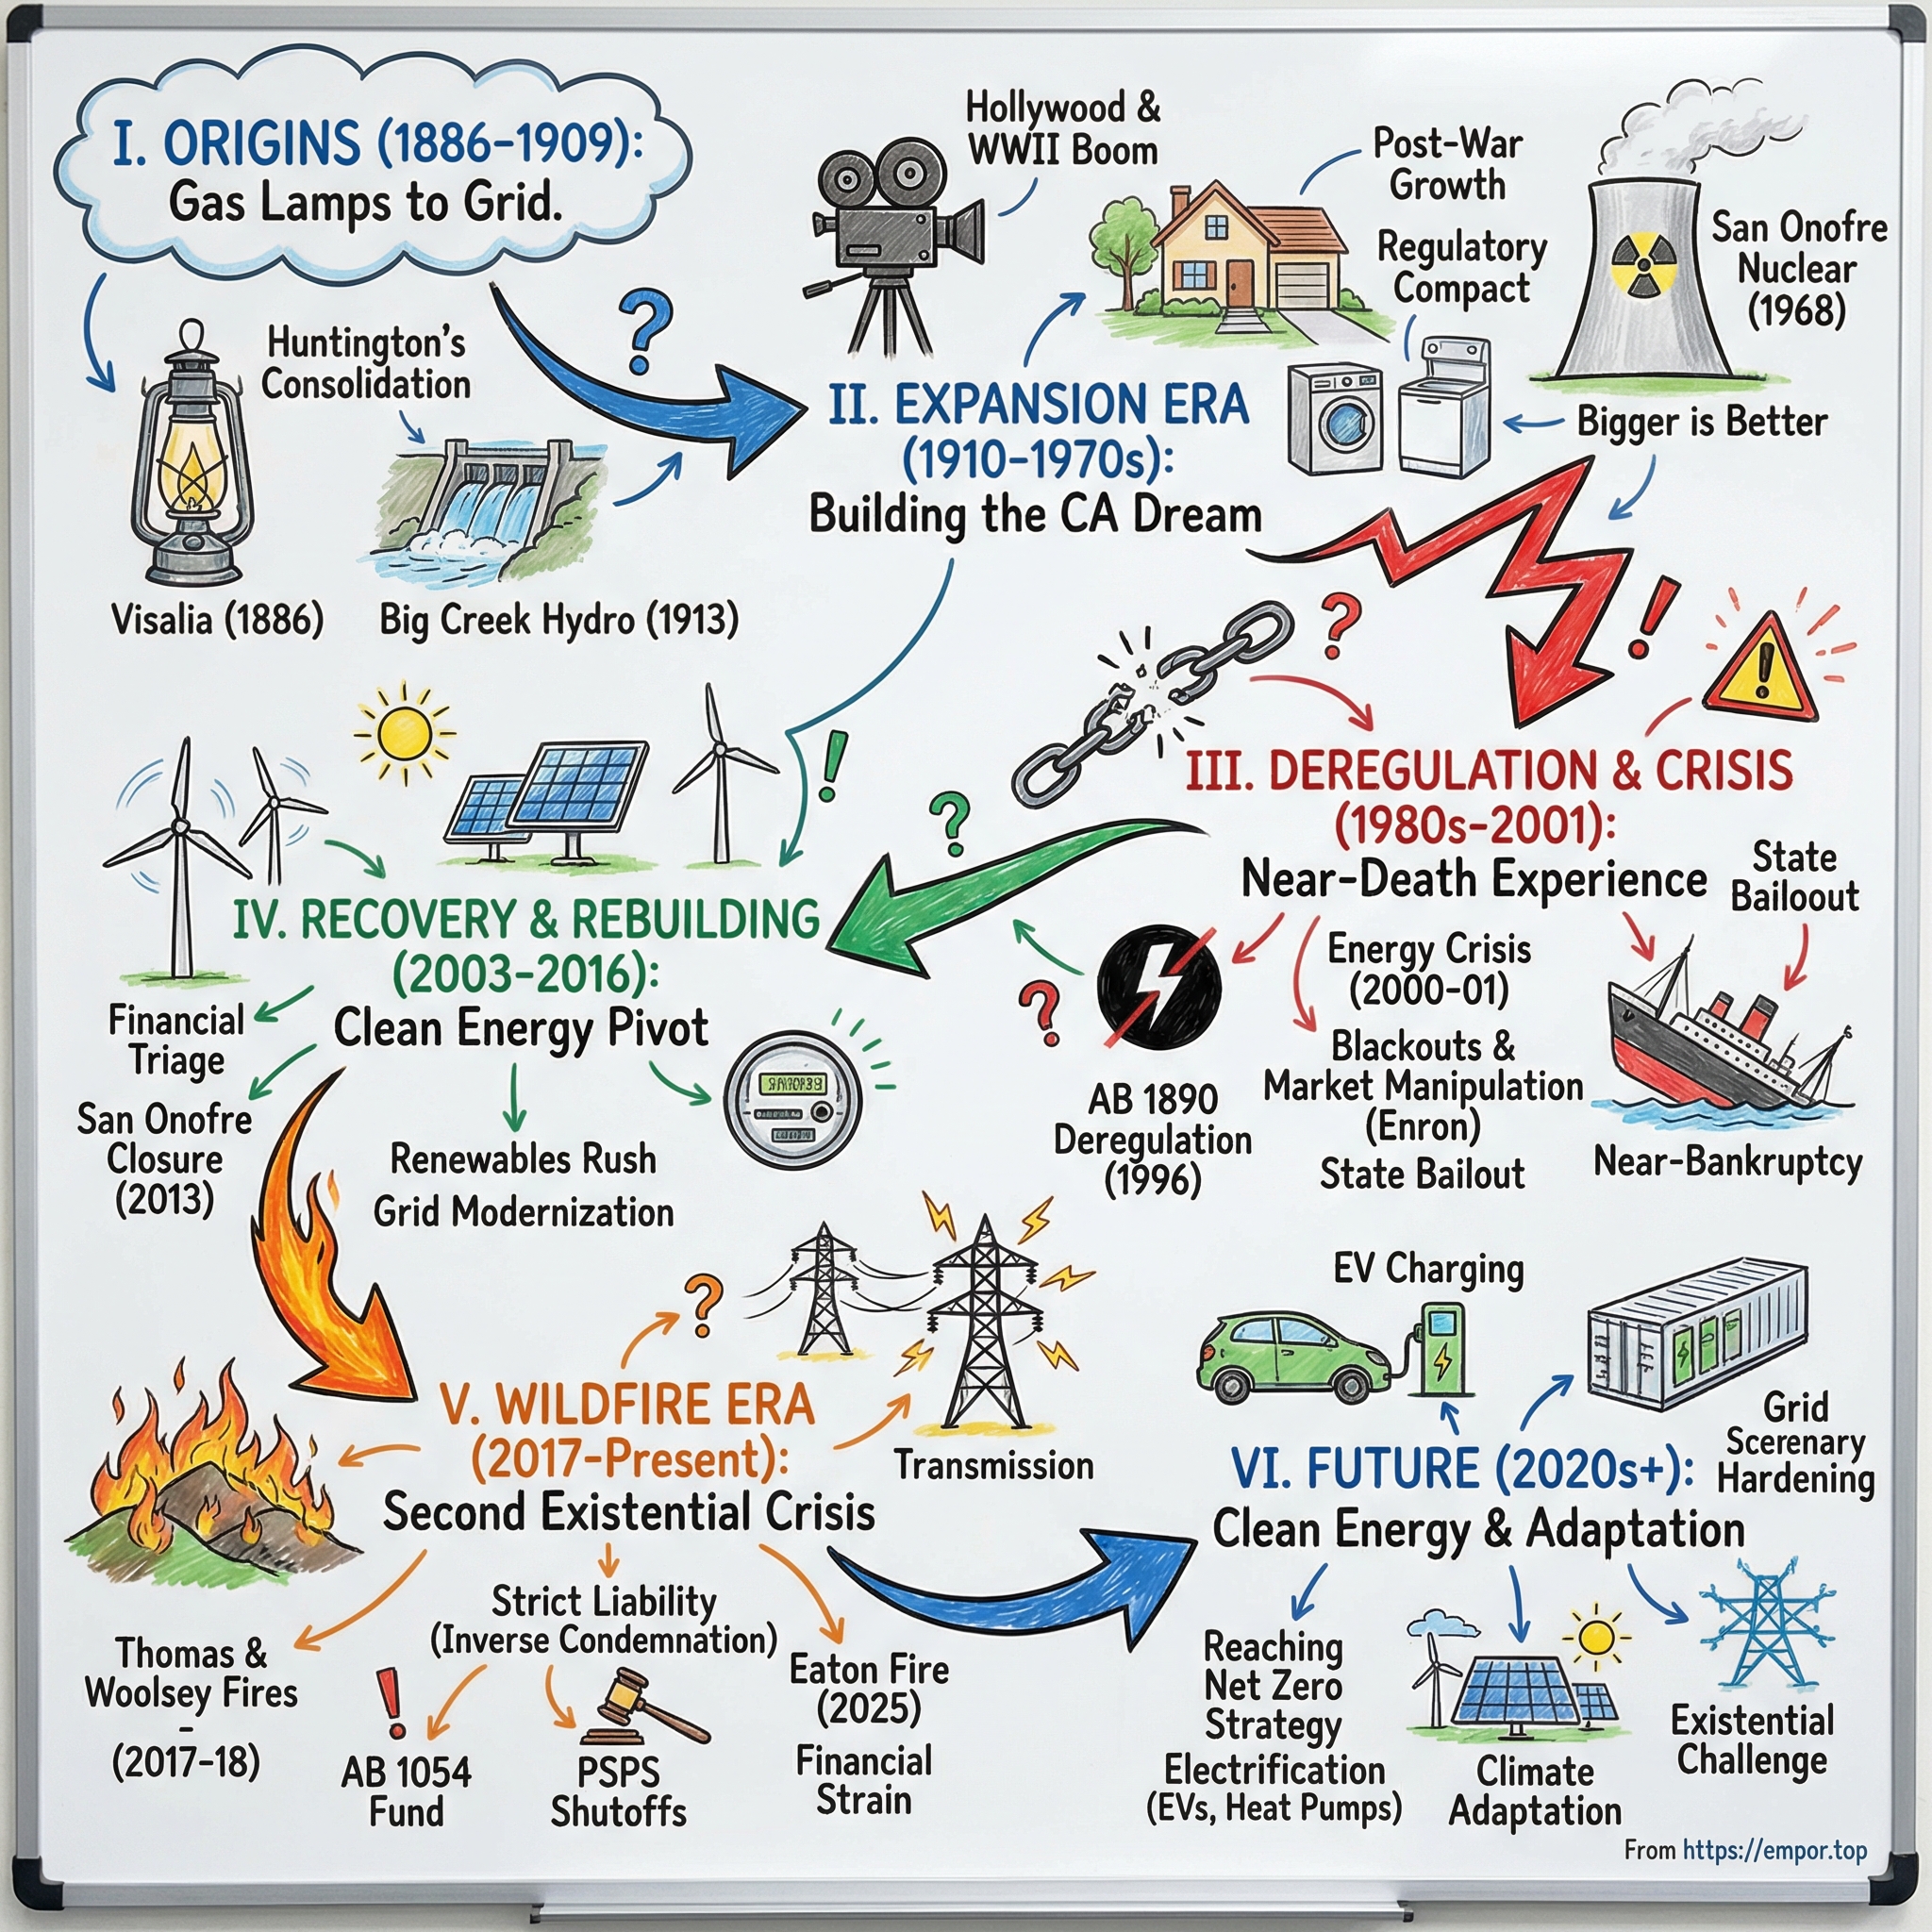
Edison International: Power, Politics, and the California Grid
I. Introduction & Episode Roadmap
On the morning of January 8, 2025, a photograph circulated that defined a company's next decade. It showed a lattice steel transmission tower standing above Eaton Canyon Wash in the San Gabriel foothills, and below it, where part of the town of Altadena had stood, a grid of concrete foundations and chimneys. Nineteen people died, and more than 9,400 homes and businesses were destroyed.1 The tower belonged to Southern California Edison, though it had not carried electricity in decades.
That final detail captures the central vulnerability. An idle line—de-energized, forgotten, and a relic of a transmission configuration abandoned in the 1970s—became, according to the Los Angeles County Fire Department and CAL FIRE, the origin point of a fire that put a $30 billion utility's equity value in play.1 The destruction stemmed not from a critical asset failing under load, but from an unmonitored legacy asset.
This analysis examines Edison International, the New York-listed holding company whose principal subsidiary, Southern California Edison, delivers electricity across roughly 50,000 square miles of central, coastal, and southern California to approximately 15 million people.2 As one of the oldest continuously operating electric utilities in the United States, it traces its origins to Central Valley street-lighting ventures in the 1880s. Over the past quarter-century, the company came within weeks of bankruptcy twice: first under a deregulation framework that required buying wholesale power at fifty cents per kilowatt-hour while capping retail rates at seven cents, and later when California courts established that a utility whose equipment causes a wildfire faces financial liability regardless of fault.
That second legal framework underpins the utility's modern financial reality. California applies the doctrine of inverse condemnation to investor-owned utilities under Article I, Section 19 of the state constitution. Derived from the takings clause, the doctrine treats private property damage caused by utility infrastructure as a public taking. The result is strict liability: if SCE equipment causes a fire, SCE is liable for property damage regardless of whether it met every applicable safety standard.3 Meanwhile, a separate regulator, the California Public Utilities Commission, determines whether SCE can pass those costs to customers, retaining full discretion to disallow cost recovery if it finds the company acted imprudently.
Taken together, these two conditions create a structural trap that has shaped every capital allocation decision Edison has made since 2017: unlimited downside risk paired with discretionary cost recovery—a profile commercial insurance markets refuse to underwrite willingly. Consequently, California utility equities trade at a persistent discount relative to national peers. The dynamic has forced the state legislature to intervene with emergency statutes on two separate occasions, making the surrounding legal architecture the central driver of Edison International's investment profile, ahead of its rate base growth.
The story follows a clear arc. It begins with hydroelectric pioneers and a railroad magnate who funded early major engineering projects in the American West. It moves through the post-war regulatory compact—granting exclusive service territories in exchange for regulated returns—and the nuclear ambitions that followed. It then examines the 1990s shift toward commodity electricity markets, which demonstrated the peril of frozen retail prices paired with floating wholesale rates. It evaluates two capital allocation failures that cost shareholders billions: a merchant power subsidiary that went bankrupt, and a nuclear plant that was rebuilt and subsequently retired. Finally, it traces the emergence of the wildfire era, the legislative rescue via Assembly Bill 1054, and the $21 billion fund designed to keep California utilities financeable—a fund that, as of 2026, a single major fire threatens to consume entirely.
The analysis concludes with an assessment of what Edison is today: a pure-play wires business pursuing a capital plan of $38 billion to $41 billion from 2026 through 2030 to achieve roughly 7% compound rate base growth, led by Chief Executive Officer Pedro Pizarro, a Caltech-trained chemist who has spent his entire executive career inside the company.4 The bull case rests on the premise that grid modernization and hardening are mandatory, allowing the utility to earn regulated returns on substantial capital investments. The bear case stresses that these capital investments add to customer bills in an already cost-sensitive state, where legal doctrines have not resolved who ultimately bears the cost when equipment fails.
Both perspectives warrant detailed evaluation.
 Subscribe on LinkedIn
II. Origins & The Foundation of SoCal Grid (1886–1970s)
In 1886, in the farming town of Visalia in California's Central Valley, two businessmen named Holt and Knupps strung wire and lit street lamps. That venture marked the earliest ancestor of Southern California Edison—not a grand industrial enterprise, but a localized lighting contract typical of the hundreds established across America in the decade following Thomas Edison's Pearl Street Station.2 What set this lineage apart was not its modest beginning, but the geographic reality of its service territory.
Southern California in the 1880s faced a structural constraint absent in the East: a distinct lack of local fuel. The region lacked coal fields, major oil production near Los Angeles, and navigable rivers for barging. It did, however, possess the Sierra Nevada—snowpack, steep gradients, and rivers dropping thousands of feet over short distances. Generating power for the Los Angeles basin required capturing energy in the mountains and transmitting it across long distances. That geographic necessity made Southern California a testing ground for long-distance, high-voltage transmission, shaping a utility model fundamentally different from coal-dependent peers in the Midwest.
Corporate consolidation proceeded in stages. A series of urban lighting ventures merged to form the Edison Electric Company of Los Angeles, which formally incorporated as Southern California Edison Company in 1909.2 Yet the enterprise that expanded in the 1910s owed much of its scale to an executive whose primary business lay outside electricity.
Huntington and the Hardest Working Water in the World
Henry E. Huntington was a railroad magnate and real estate developer. His Pacific Electric Railway—the famed "Red Cars"—connected growing Southern California towns, generating wealth primarily through land appreciation ahead of rail line extensions. Because electric railways required immense power, Huntington opted to own generation assets rather than purchase electricity. His Pacific Light & Power Corporation launched the Big Creek Hydroelectric Project in the Sierra Nevada above Fresno.
The Big Creek project achieved notable engineering feats. Designers repeatedly dammed the same descending water flow, funneling it through successive powerhouses to extract energy at each drop—earning the system the moniker "the hardest working water in the world." Over time, the network expanded into a system of reservoirs, dams, and roughly 40 miles of granite-bored tunnels, delivering power more than 240 miles south to Los Angeles at transmission voltages previously unproven in commercial operation.2
Southern California Edison acquired Pacific Light & Power in 1917, incorporating Big Creek into its network. The underlying strategic logic proved durable: controlling long-distance transmission secured market dominance, given the region's reliance on remote power generation. Edison established its position not as the lowest-cost generator, but as the owner of the essential transmission corridors.
That historic focus remains relevant: more than a century later, Edison's core business model centers once again on transmission and distribution infrastructure rather than power generation.
The Regulatory Compact and the Post-War Boom
The regulatory framework governing the utility over subsequent decades was formalized under the California Railroad Commission, renamed the California Public Utilities Commission in 1946. The standard regulatory compact granted the utility an exclusive service territory and an opportunity to earn a regulated return on prudently invested capital, in exchange for an obligation to serve all customers at approved rates subject to public oversight.
Under this economic framework, a regulated utility does not earn a profit margin on electricity sales directly. Instead, it earns an authorized return on the capital assets approved by regulators—the poles, lines, substations, transformers, and meters that constitute its rate base. When a utility expands its approved asset base, earnings grow; if electricity sales rise without new capital investment, regulatory mechanisms adjust to return surplus revenue to customers. Consequently, capital expenditure serves as the primary driver of earnings growth for investor-owned utilities.
The post-war era offered ideal conditions for this business model. Southern California's population roughly doubled between 1950 and 1970, driven by expanding aerospace manufacturers, defense contractors, Central Valley agricultural operations, and suburban housing developments. As demand grew, the utility expanded its grid, regulators approved capital investments, and expanding scale helped keep customer rates stable.
Atomic Ambition at San Onofre
Capital expansion culminated in the San Onofre Nuclear Generating Station (SONGS). Built along the coast between Los Angeles and San Diego, Unit 1 began commercial operation in 1968, followed by Units 2 and 3 in the early 1980s. Nuclear generation aligned with the period's regulatory incentives: high upfront capital costs expanded the rate base, substantial base-load output met regional demand growth, and low variable fuel costs minimized operating expenses.
The development of San Onofre reflected a core utility thesis of the era—that large, capital-intensive, long-life assets represented stable foundational investments for a regulated utility. Subsequent operational and regulatory shifts in the 2010s would later challenge that premise.
By the late 1970s, Edison operated as a large, conservatively capitalized monopoly supported by hydroelectric assets, nuclear generation, and rapid regional population growth. Historically viewed as a stable income investment for conservative portfolios, the utility soon faced significant structural changes as state and federal policymakers sought to restructure electricity markets.
III. The Deregulation Experiment & Capital Allocation Failures (1980s–1999)
The intellectual shift arrived from Washington and economics departments rather than from California. Through the 1980s, deregulation swept airlines, trucking, telecommunications, and natural gas pipelines, yielding broadly popular results. Electricity presented the next target, anchored by a persuasive premise: power generation was a competitive business in disguise. Anyone could build a power plant, whereas only the transmission and distribution wires constituted a natural monopoly. Unbundling them—allowing generators to compete while keeping wires regulated—was designed to pass the cost savings to consumers.
While that theoretical framework functioned under specific market conditions, the version California adopted contained critical structural flaws.
Building a Holding Company
Edison's management anticipated this policy trajectory early. In 1988, the company reorganized under a holding company structure, SCEcorp, above the regulated utility, and was later renamed Edison International in 1996.2 The stated purpose was to ring-fence regulated operations from unregulated ventures, separating the utility balance sheet from higher-risk corporate investments.
The implicit objective reflected the financial incentives of utility leadership during that era. Regulated returns were capped by design: a utility executing flawlessly earned roughly its authorized return on equity, much like one executing adequately. The holding company provided a structure to deploy capital into non-regulated projects capable of generating market-based rather than tariff-administered returns.
Edison Mission Energy and the Merchant Power Thesis
The vehicle created for this strategy was Edison Mission Energy (EME). Through the late 1980s and 1990s, EME assembled a portfolio of independent power projects across the United States and internationally, spanning coal, natural gas, and later wind assets. The expansion accelerated around the turn of the millennium with major acquisitions of Midwest coal-fired generation.
Management pitched the strategy to shareholders as a diversification play: cash flows uncorrelated with California regulatory decisions, growth unconstrained by CPUC-approved rate base, and direct exposure to what it projected would be a tightening merchant power market.
Subsequent events disproved that thesis, providing a key case study in Edison's capital allocation history. Merchant generation did not diversify utility risk; instead, it introduced a volatile business model. As price-takers selling an undifferentiated commodity into wholesale markets, merchant power plants saw clearing prices set by the marginal generator, offering no downside contract protection alongside expanding environmental compliance obligations. When abundant shale gas arrived in the late 2000s and depressed wholesale power prices across PJM and Midwest markets, EME's coal fleet shifted from cash generation to net cash consumption. The capital needed for environmental compliance eventually exceeded the plants' earning potential.
Edison Mission Energy filed for Chapter 11 bankruptcy protection in December 2012, and NRG Energy subsequently acquired its assets for approximately $2.64 billion—a fraction of the capital deployed over two decades.56 Edison International declined to inject equity to rescue the subsidiary. The holding company structure functioned as designed in a legal sense, shielding EIX shareholders from EME's creditors.
However, the strategic cost was substantial. A significant portion of Edison's discretionary capital over two decades—intended to demonstrate that management could outperform its regulated return cap—resulted in bankruptcy. The outcome demonstrated that diversifying an investor-owned utility into merchant generation destroyed shareholder value at scale.
This historical outcome remains relevant when evaluating management assertions regarding non-regulated corporate optionality, a dynamic this analysis returns to in evaluating later ventures.
AB 1890: The Law That Ate Itself
Concurrently in Sacramento, energy deregulation moved into state law. Assembly Bill 1890 passed in 1996 with broad bipartisan support, backed by a Republican governor, a Democratic legislature, incumbent utilities, and large industrial power consumers.
The statutory framework rested on three core components:
First, incumbent utilities were required to divest most of their fossil-fuel generation so the regulated transmission and distribution business could not favor its own power plants. SCE sold its gas-fired stations across Southern California while retaining its hydroelectric and nuclear assets.
Second, the legislation created a centralized spot market, the California Power Exchange, and required utilities to purchase virtually all their power supply through day-ahead and hour-ahead spot transactions. To preserve price discovery in the spot market, regulations discouraged utilities from securing long-term bilateral contracts.
Third, retail electricity rates were frozen at levels roughly 10% below 1996 rates. This rate freeze was designed to allow utilities to recover stranded costs from their divested generation assets over time.
Operating together, these three provisions created an unsustainable structural mismatch. The utility retained no legacy fossil generation of its own, remained obligated to buy power at variable wholesale spot prices it could not control, and was legally restricted to selling that power at a fixed retail rate it could not adjust. In financial terms, California created an uncovered short position on wholesale electricity prices for its investor-owned utilities while prohibiting them from hedging the risk.
During the first two years of the new market design, wholesale prices remained low and the structural vulnerability went unnoticed, leading proponents to praise the model. Edison's management, having spent a decade expanding merchant generation on the expectation of rising energy prices, did not insulate the utility from the opposite price risk.
In the summer of 2000, wholesale prices spiked.
IV. The 2000–2001 California Energy Crisis: Survival on the Brink
By the winter of 2000, Southern California Edison confronted an acute financial crisis driven by mathematical impossibility. Bound by its public utility obligation to supply power to every customer within its service territory, SCE was forced to procure electricity on the spot market under the unbundled structure mandated by Assembly Bill 1890.
Through late 2000 and early 2001, wholesale spot prices escalated dramatically. At various points, SCE was paying between 11 cents and 50 cents per kilowatt-hour for wholesale power, while retail rates remained capped by statute at approximately 6.7 cents per kilowatt-hour.7 Wholesale electricity costs across California surged by roughly 900% between late 1999 and early 2001. Under this price freeze, every kilowatt-hour the utility delivered generated a direct operating loss, rapidly draining cash reserves while statutory obligations prohibited SCE from curtailing service.
What Actually Caused It
The crisis resulted from three compounding factors. First, structural supply constraints hit the state: California had constructed minimal new generation capacity during the 1990s despite steady demand growth, and a hot summer combined with reduced hydroelectric output in the Pacific Northwest eliminated market buffer. Second, natural gas prices spiked nationwide, driving up the marginal operating costs of gas-fired power plants. Third, market manipulation exacerbated the shortage: independent power producers and energy traders—most notably Enron Corporation—exploited vulnerabilities in the California Power Exchange rules. Market participants strategically withheld generation capacity to induce artificial scarcity and routed electricity out of state to reimport it at inflated congestion-relief prices.
The state's deregulatory framework had assumed that market participants would behave competitively in an inelastic market lacking utility-scale storage. That design proved fundamentally flawed.
The Bleed
By early 2001, SCE had accumulated more than $4.7 billion in undercollected power procurement costs—cash disbursed for wholesale power and logged on its balance sheet as a regulatory asset against future rate collection that the California Public Utilities Commission had not yet authorized.7 The utility's solvency turned on a critical accounting distinction: whether this massive undercollection would be recognized as a recoverable regulatory asset or written off as an unrecoverable loss. The willingness of auditors to treat the balance as an asset hinged on the uncertain prospect of future regulatory approval.
As financial losses mounted, credit rating agencies downgraded SCE's debt to junk status, severing the utility's access to the commercial paper market for short-term working capital. SCE subsequently defaulted on payments to merchant generators and qualifying facility contracts. In April 2001, neighboring investor-owned utility Pacific Gas and Electric filed for Chapter 11 bankruptcy protection.
SCE chose a different path, avoiding bankruptcy through targeted regulatory and political negotiations.
Bryson's Workout
John E. Bryson, then chairman and chief executive of Edison International, brought a distinct background to the crisis. A former co-founder of the Natural Resources Defense Council and a past president of the CPUC, Bryson possessed extensive experience within both regulatory and political spheres.
Bryson concluded that Chapter 11 bankruptcy posed severe long-term risks for an investor-owned utility. In California, where service franchises rely on political support, entering bankruptcy would surrender operational oversight to a federal bankruptcy court and a committee of creditors. Operating on the premise that a political resolution offered greater certainty than judicial reorganization, management sought a negotiated settlement with state officials.
The financial recovery occurred in stages. To stabilize electricity supply, the California Department of Water Resources stepped in to purchase wholesale power on behalf of utility customers, financing the purchases through revenue bonds. In October 2001, SCE reached a comprehensive settlement with the CPUC. Litigated in federal court and formalized as a binding judicial consent decree, the agreement established the Procurement Related Obligations Account (PROACT). This dedicated accounting mechanism allowed SCE to apply revenues collected above its ongoing operational costs toward paying down its $4.7 billion undercollection balance.7
Under the terms of the settlement, retail rates remained elevated while surplus revenues were directed toward retiring the procurement debt rather than distributing profits to shareholders. Consequently, Edison International suspended its common stock dividend for several years to rebuild its balance sheet.
What Investors Should Take From This
The 2000–2001 energy crisis highlights three enduring dynamics for investors examining Edison International.
First, regulatory cost recovery in California functions ultimately as a political determination rather than a routine accounting mechanism. SCE's survival depended less on internal operational efficiency or engineering performance than on whether state regulators and executive leadership permitted the utility to recover previously incurred costs.
Second, regulatory relationship management represents a core strategic requirement for California investor-owned utilities. Navigating political and regulatory structures proved vital to preserving equity value during extreme market dislocations.
Third, the crisis demonstrated how structural policy design can expose utilities to severe financial liabilities independent of operational performance. SCE fulfilled its statutory duties precisely as mandated under state law, yet encountered near-fatal illiquidity due to an unhedged market structure. This structural vulnerability—where legal and regulatory frameworks impose financial liability without operational fault—reemerged seventeen years later in the context of wildfire liability under inverse condemnation.
Following the settlement, management pledged to refocus the enterprise on core regulated utility operations. However, subsequent developments tested whether a pure-play utility model could remain insulated from systemic legal and regulatory risks.
V. The SONGS Nuclear Fiasco & Regulatory Reckoning (2002–2016)
Following the resolution of the energy crisis, the remainder of the 2000s brought a period of operational stability. Balance sheet debt declined, common stock dividends resumed and began to grow, and credit ratings recovered to investment grade. The company refocused on its core rate-base growth model, and by the late 2000s, Edison International traded primarily as a conventional regulated utility, albeit with an underperforming merchant power subsidiary still attached.
That period of relative calm ended on January 31, 2012, when a radiation monitor at San Onofre Unit 3 detected a leak of primary coolant, triggering an automatic plant shutdown. When inspectors examined the steam generators, they uncovered what became one of the most costly engineering failures in modern U.S. utility history.
The Replacement That Broke the Plant
Understanding why the equipment failed requires examining the mechanics of a pressurized water reactor. In these nuclear facilities, radioactive water circulates through the reactor core inside a sealed primary loop. That water flows into a steam generator—a massive heat exchanger containing thousands of thin, U-shaped alloy tubes—where it transfers heat to a separate, non-radioactive water loop that boils to produce steam and drive the turbines. Those alloy tubes serve as the physical barrier separating radioactive coolant from the clean water system, with roughly 10,000 tubes per generator acting as individual pressure boundaries.
Because steam generators degrade over decades of operation, replacing them is a standard, albeit expensive, industry procedure. SCE contracted with Mitsubishi Heavy Industries to design and manufacture replacement steam generators for SONGS Units 2 and 3 at a cost of roughly $670 million, completing installation in 2010 and 2011.8
However, the replacement units featured a modified design that increased the tube count and altered internal support structures and fluid flow geometry compared to the original components. Once in operation, these changes triggered fluid-elastic instability. High-velocity steam and water mixtures flowing through specific sections of the tube bundles caused adjacent tubes to vibrate violently against one another. Components designed to remain stable for 40 years suffered severe thinning from mechanical wear after less than two years of service.
The rapid degradation was unprecedented for newly installed equipment. Yet the regulatory hurdles quickly eclipsed the technical challenges. Because SCE had executed the replacement under a streamlined process for equivalent component swaps rather than securing a formal license amendment for a major design change, restarting the reactors—even at reduced power—required long regulatory approval from the Nuclear Regulatory Commission alongside intense local public opposition.
Confronted with prolonged regulatory uncertainty, SCE announced the permanent retirement of San Onofre Units 2 and 3 on June 7, 2013.8 A generating complex representing approximately $4.7 billion in invested capital, with decades of remaining licensed operational life, was abruptly written down to zero as an active generating asset.
The Warsaw Hotel
The regulatory and political aftermath damaged the company's standing even more durably than the asset write-down.
Under standard utility accounting frameworks, a prematurely retired power plant is not immediately written off in full. Instead, the unrecovered capital investment remains on the balance sheet while state regulators determine how the financial burden will be split between utility customers and shareholders. In November 2014, the CPUC approved a settlement agreement that allocated roughly $3.3 billion of SONGS-related closure costs to ratepayers.9
Subsequent disclosures revealed that key terms of the settlement had been discussed in March 2013 at the Hotel Bristol in Warsaw, Poland, during an undisclosed meeting between a senior SCE executive and CPUC President Michael Peevey. State rules mandated prompt public disclosure of such ex parte communications. The meeting came to light after law enforcement agents discovered handwritten notes outlining settlement terms on hotel stationery during a search of Peevey's home.
The resulting scandal triggered public backlash and regulatory disruption. Peevey declined to seek reappointment, state and federal criminal investigations were launched, and regulators reopened the settlement in 2018 to shift a further substantial portion of the unrecovered costs from ratepayers back to Edison shareholders.9
Weighing It
Evaluating the twin capital allocation failures of this era together tests a central premise of utility investing from complementary angles.
That premise holds that capital deployed by a regulated utility carries inherently low risk because expenditures receive advance regulatory approval. The outcome at SONGS disproved that assumption. Regulatory pre-approval does not guarantee eventual cost recovery; when a major capital project fails, regulators can re-evaluate cost allocation retroactively under a prudence standard shaped by political pressure and public scrutiny surrounding the failure.
When combined with the bankruptcy of Edison Mission Energy a year earlier, investors observed a holding company that, between 2012 and 2015, sustained multibillion-dollar write-downs across both major divisions: its unregulated merchant power bet and its core regulated asset base. Consequently, Edison's capital allocation record during that decade reflected significant strategic and execution missteps.
Two qualifications contextualize these outcomes. First, neither failure stemmed primarily from overpaying for acquisitions or aggressive corporate expansion; EME represented a strategic misjudgment regarding structural power market dynamics, while SONGS resulted from a vendor engineering defect that SCE actively litigated. Second, corporate leadership evolved over time. The executive team leading Edison International in 2026 inherited the legacy of these failures rather than originating them. CEO Pedro Pizarro served as president of Edison Mission Energy during its Chapter 11 restructuring and subsequently took the helm at SCE, managing the operational and regulatory recovery for both entities.
Nevertheless, the ex parte scandal created lasting institutional friction between the CPUC and SCE. Having faced intense public scrutiny over perceived improper closeness with the utility, regulators acquired a strong institutional incentive to demonstrate independence and rigor in subsequent proceedings. As a result, Edison entered the wildfire era requiring unprecedented regulatory cooperation at a time when its regulatory capital and public trust had reached historic lows.
VI. The Wildfire Era & Inverse Condemnation Crisis (2017–2019)
In Southern California, the arrival of Santa Ana winds brings a familiar atmospheric shift. The air dries rapidly, the light turns a strange copper, and high-desert winds accelerate through mountain passes, compressing and gusting past 70 miles per hour. It represents the region's oldest weather pattern.
What changed during the 2010s was the environmental landscape into which those winds blew. A historic California drought from 2012 to 2016 killed vegetation across millions of acres. Rainy seasons began later and ended earlier, shifting the period of dry vegetation directly into peak Santa Ana season. State fire officials noted that the traditional fire season had effectively become year-round.
Running across that dry terrain—through canyons, ridgelines, and the expanding wildland-urban interface—were tens of thousands of miles of bare overhead conductor. Much of this infrastructure had been designed and installed decades earlier, when engineering standards prioritized mechanical strength over ignition prevention.
Thomas and Woolsey
In December 2017, the Thomas Fire ignited in Ventura County and burned more than 280,000 acres, becoming at the time the largest wildfire in modern California history. Investigators attributed the ignitions to Southern California Edison electrical equipment. The following month, heavy rains on the denuded slopes above Montecito triggered a catastrophic debris flow that killed 23 people—a secondary disaster for which the utility also faced legal claims.
In November 2018, while the Camp Fire destroyed the town of Paradise in Northern California, the Woolsey Fire ignited in Ventura County near the Santa Susana Field Laboratory. It burned through Malibu to the Pacific Ocean, destroying roughly 1,600 structures, with SCE equipment again identified in connection with the ignition.
Edison ultimately recognized estimated losses for the 2017 and 2018 wildfire and mudslide events exceeding $9.9 billion on a pre-tax basis, before expected recoveries.10 That liability equaled several years of the company's total consolidated net income at the time, threatening its financial foundation.
Why the Legal Doctrine Is the Whole Story
Investors accustomed to utilities in other jurisdictions often misjudge California exposure by assuming liability turns on negligence—that a utility is liable if it fails to trim vegetation or inspect lines, but protected if it meets regulatory safety standards.
The governing framework operates differently. Inverse condemnation, as applied by California courts to investor-owned utilities, is a strict liability doctrine derived from the constitutional takings clause.3 Under this legal theory, a utility exercising state-granted powers to site infrastructure for public benefit must compensate private property owners for infrastructure-related damage, just as the state would. Operational fault is not an element of the claim, and full compliance with California Public Utilities Commission safety regulations provides no legal defense.
The doctrine's judicial logic rested on a key matching principle: because government entities can spread taking costs across all taxpayers, utilities were presumed capable of spreading wildfire liabilities across all ratepayers. That premise formed the rationale for extending strict liability to investor-owned utilities.
In practice, the matching principle failed. Cost recovery through customer rates is not automatic; it requires the CPUC to determine that the utility acted as a prudent operator. Consequently, a California utility could incur strict liability without operational fault in court, yet be denied cost recovery by regulators on prudence grounds—facing two separate forums operating under contradictory standards.
Strict liability upstream combined with discretionary cost recovery downstream left equity holders absorbing the unhedged financial gap, which carried no statutory upper bound.
The PG&E Precedent
On January 29, 2019, Pacific Gas and Electric filed for Chapter 11 bankruptcy protection. PG&E was not insolvent in a conventional operational sense; it remained a functioning utility with a massive rate base and a captive customer base. It filed because estimated liabilities from the 2018 Camp Fire, calculated under strict liability, far exceeded its total equity capacity.
For Edison International shareholders, PG&E's bankruptcy transformed a theoretical legal hazard into an immediate repricing event. If the state's largest electric utility could be forced into bankruptcy by wildfire claims, every California investor-owned utility carried unquantifiable and unhedgeable tail risk. Edison's equity valuation compressed relative to national peers, credit spreads widened, and access to capital markets tightened.
The crisis extended beyond corporate balance sheets. If investor-owned utilities lost access to affordable capital, critical grid investments would halt, imperiling California's statutory mandate to electrify its economy and transition away from fossil fuels.
That structural reality, rather than investor relief, forced a legislative intervention. State policymakers recognized that while California could reform utility oversight, it could not maintain its broader energy policy goals without financeable utilities.
VII. AB 1054 & The Wildfire Insurance Fund Architecture (2019–Present)
Assembly Bill 1054 passed the California legislature in July 2019 at a speed reflecting its urgency—a complex piece of financial engineering designed to construct a synthetic insurance market for a risk commercial underwriters refused to bear.
The Three Mechanisms
The centerpiece of the legislation was a wildfire fund with approximately $21 billion of initial claims-paying capacity, capitalized roughly half by utility shareholders and half by an extension of a non-bypassable charge on customer bills.[^11] California's three major investor-owned utilities made initial contributions—SCE's share was approximately $2.4 billion—plus ongoing annual contributions over a ten-year period.[^11] When a participating utility faces eligible third-party wildfire claims above a specified threshold, it can draw from the fund to pay them, subject to administrator approval and remaining fund capacity.
The second mechanism established a safety certification process. To qualify, a utility must obtain an annual certificate from the Office of Energy Infrastructure Safety, contingent on an approved wildfire mitigation plan, executive compensation structures linked to safety metrics, and independent compliance verification. Holding a valid certificate shifts the evidentiary burden during a subsequent CPUC prudence review: rather than requiring the utility to prove its conduct was reasonable, regulators presume reasonableness unless an intervenor raises substantial doubt.
The third mechanism introduced a liability cap. If a certified utility is nonetheless found to have acted imprudently, shareholder disallowance exposure is capped at a rolling three-year aggregate—in the range of $3.2 billion for SCE—provided the conduct does not constitute willful misconduct.[^11]
Taken together, the statute did not repeal inverse condemnation; instead, it established a liquidity facility and a procedural shield. The structural distinction is significant: underlying legal liability remains unlimited, while AB 1054 alters which entity provides immediate liquidity and elevates the regulatory standard required to disallow cost recovery to shareholders.
What SCE Actually Built
Statutory reform represented only one component of the company's risk mitigation strategy; the operational response focused on physical grid hardening.
The primary initiative involved replacing bare overhead wire with insulated covered conductor across high fire risk areas. The engineering objective was straightforward: preventing ignitions caused by wind-driven conductor clash, foreign objects such as mylar balloons or tree branches bridging lines, or fallen conductors contacting vegetation. Installing covered conductor provided a significantly faster and less capital-intensive alternative to undergrounding lines, which requires substantial capital expenditure per mile and multi-year construction timelines.
By mid-2026, SCE reported approximately 7,200 miles of covered conductor installed, with roughly 90% of the 16,800 distribution line miles in high fire risk areas hardened.4 The utility supplemented the program with fast-acting sectionalizing devices that de-energize circuits within fractions of a second during a fault, an extensive network of weather stations and high-definition cameras supporting predictive fire-weather models, and Public Safety Power Shutoffs (PSPS) to proactively de-energize lines during severe wind events.
Management has represented that hardened circuits demonstrate a wildfire risk reduction of 85%-plus relative to the pre-2018 baseline.4 While derived from the company's internal risk modeling rather than independent audit, the underlying mechanism supports substantial risk reduction, even if the exact percentage reflects management estimation.
The implementation of PSPS highlights an operational conflict for the utility. Proactively cutting power to hundreds of thousands of customers during high-wind events effectively reduces ignition risk, but creates substantial economic disruption, disables medical equipment, and impacts rural communities. Frequent shutoffs invite public criticism over service reliability, whereas cautious application leaves the grid exposed during severe weather events.
The Test the Architecture Failed
The AB 1054 framework was constructed under the assumption of multiple recurring wildfires that would incrementally draw down fund reserves over time. It was not designed for a single catastrophic event capable of depleting the fund's entire capacity.
The Eaton Fire represented that scenario. The fund administrator reported that approximately $21 billion of the fund's claims-paying capacity is available for the Eaton Fire—effectively directing the entire original fund toward a single event.11 Under fund rules, SCE is entitled to reimbursement from the initial account for eligible third-party claims exceeding $1.0 billion, subject to administrator approval and remaining capacity.11
In response, state lawmakers enacted Senate Bill 254 in late 2025 as an urgency statute. The legislation established an $18 billion Continuation Account within the fund applicable to fires igniting after enactment, extended the ratepayer surcharge through 2045, authorized revenue bond issuances, and required participating utilities to opt in under revised cost-recovery terms, including restrictions on rate-basing an initial tranche of fire risk mitigation capital.1213
This sequence highlights a central structural dynamic in Edison's investment outlook. The initial 2019 fund faced functional depletion by a single major fire six years after its creation. The legislative remedy required establishing a secondary fund, financed jointly by ratepayers and shareholders, accompanied by restrictions that limit utilities from earning a regulated return on portions of mandatory safety capital.
The positive investment interpretation holds that California has twice demonstrated a political commitment to maintaining utility solvency, establishing a practical backstop for investor-owned utilities. Conversely, the cautious perspective emphasizes that successive legislative interventions have become increasingly complex and costly for equity holders, while political tolerance for ratepayer surcharges remains constrained.
Both interpretations derive support from recent history. However, the outcome demonstrates that AB 1054 did not eliminate structural tail risk or potential insolvency for California utilities, as a single severe event can test the boundaries of the state's legislative architecture.
VIII. Core Business Breakdown: SCE's Rate Base Engine
Behind the wildfire liabilities, statutory interventions, and historical restructuring, Edison International operates a straightforward utility model: converting approved capital expenditures into regulated earnings.
The Segment Reality
Southern California Edison generates well over 95% of Edison International's consolidated revenue and earnings.14 The utility operates primarily as a transmission and distribution business, owning the poles, wires, substations, and meters across its service territory and charging tariffs for electricity delivery. Following its post-AB 1890 power plant divestitures and the 2013 retirement of the San Onofre nuclear station, SCE owns minimal generation capacity. Although it procures electricity on behalf of retail customers, power procurement functions as a pass-through expense on which the utility earns no margin.
The holding company's unregulated operations consist primarily of Trio, formerly Edison Energy, a clean energy advisory firm serving corporate and institutional clients.[^16] Trio contributes under 2% of consolidated revenue and earnings, remaining immaterial to overall financial performance. Given the historical bankruptcy of Edison Mission Energy, non-regulated ventures at the holding company warrant cautious evaluation until they demonstrate meaningful cash flow generation.
At the holding company level, parent entity debt service and corporate overhead create an interest expense drag on consolidated earnings per share, offsetting a portion of net income generated at the operating utility.
How the Money Is Actually Made
The economics of a regulated utility depend on a specific earnings formula administered by state regulators. The California Public Utilities Commission establishes the utility's rate base—the net depreciated value of approved capital assets—and authorizes a capital structure, which for SCE specifies 52% common equity. Applying the authorized return on equity to the equity-financed portion of the rate base yields the utility's authorized net income.
Under this model, earnings growth relies on capital deployment rather than volumetric electricity sales. A decline in electricity consumption does not inherently reduce authorized earnings, provided regulators approve ongoing grid investments required to maintain reliability and system capacity. Conversely, reducing capital expenditures to increase short-term cash flow contracts the asset base that generates regulated earnings.
Consequently, capital expenditure plans represent the primary driver of Edison International's earnings growth. The company has guided to $38 billion to $41 billion in capital investments from 2026 through 2030, projecting roughly 7% compound annual rate base growth from 2025 to 2030, supported by annual capital spending forecast at $8 billion to $9 billion by 2029.415 In March 2026, SCE filed an application for a $3.1 billion advanced metering infrastructure upgrade program, with approximately half of the projected spending falling within the current five-year planning window.15
The Regulatory Cadence, and the 2025 Rate Case
Capital deployment and operational expenses receive regulatory authorization through General Rate Case proceedings conducted on a four-year cycle. On September 18, 2025, the CPUC issued its final decision in SCE's 2025 rate case, establishing the utility's authorized revenue requirement for 2025 through 2028. The decision reduced SCE's requested revenue requirement by $727 million, with the commission explicitly citing customer bill affordability as the rationale for the reduction.16
The decision presents dual implications for investors. Operationally, the ruling establishes revenue visibility through 2028, providing regulatory clarity for the core capital program—a milestone management emphasized repeatedly on earnings calls.4 Analytically, the $727 million disallowance underscores growing regulatory sensitivity toward cumulative rate increases in California.
A subsequent cost of capital decision issued in December 2025 reinforced this regulatory direction. The CPUC set SCE's authorized return on common equity at 10.03% for 2026 through 2028 and reduced its authorized overall rate of return to 7.59%, reflecting broader reductions applied across California's investor-owned energy utilities.1718 Transmission assets remain regulated separately by the Federal Energy Regulatory Commission under distinct return frameworks, offering partial diversification against state-level regulatory decisions.
While modest in isolation, the return on equity reduction illustrates that authorized returns in California face downward pressure amid heightened public focus on utility rates. Financial projections assuming static authorized returns through 2030 risk overstating long-term rate base profitability.
Competition, and the Substitution Question
Within its defined service territory, SCE holds a franchise monopoly over electricity distribution. Although Community Choice Aggregators—local governmental entities that purchase power on behalf of residents—have assumed a substantial portion of power procurement in Southern California, CCA customers remain dependent on SCE's transmission and distribution network and continue paying standard delivery tariffs. Because regulated returns derive from grid infrastructure rather than power generation, the shift in procurement responsibility has had minimal impact on utility earnings.
Relative to its California peers, Edison International presents a distinct operating profile. Pacific Gas and Electric operates across heavily forested Northern California terrain with significant natural gas distribution assets and ongoing balance sheet restructuring following its 2019 bankruptcy. Sempra pairs San Diego Gas & Electric with a large non-regulated energy infrastructure and liquefied natural gas export business, pursuing geographic and business diversification outside California regulation.
The primary long-term threat to the utility model involves technological substitution, specifically behind-the-meter rooftop solar paired with battery storage. California's adoption of the NEM 3.0 regulatory framework significantly reduced export compensation for rooftop solar, dampening demand for standalone solar systems while shifting consumer adoption toward paired solar-and-storage configurations.
Industry advocates argue that broader electrification will offset distributed generation losses, as electric vehicles, heat pumps, and electric appliances increase overall demand on the distribution grid and necessitate expanded infrastructure investment. This premise underpins most long-term California load growth forecasts.19 However, electrification growth remains closely linked to state environmental mandates and consumer adoption rates, both of which are sensitive to rising electricity tariffs. Higher utility rates can reduce the economic incentive for consumers to transition from natural gas or gasoline to electric alternatives, creating a potential headwind for long-term load growth projections.
IX. Management, Capital Allocation & Strategic Execution
Pedro Pizarro does not fit the typical profile of a utility chief executive. He earned a PhD in chemistry from Caltech after completing his undergraduate degree at Harvard, began his career at McKinsey, and joined Edison in 1999—arriving just before the onset of the California energy crisis.20 On earnings calls, his style is precise and analytical, focusing on regulatory and operational mechanisms rather than narrative framing.
His executive progression within the organization provides relevant context for evaluating corporate governance. He managed Edison Mission Energy through its Chapter 11 restructuring, served as president of Southern California Edison, and became president and chief executive officer of Edison International in October 2016.20 As a result, the chief executive leading the response to the Eaton Fire previously oversaw the administrative aftermath of the company’s two prior financial crises.
Maria Rigatti, executive vice president and chief financial officer, brings a similarly long tenure to the executive team, having served as CFO of both SCE and EME prior to assuming her role at the parent company.20 This executive continuity is notable in an industry characterized by frequent senior financial leadership transitions.
Reading the Calls
Management's public disclosures offer direct insight into corporate strategy, and the earnings calls conducted in 2026 reflect contrasting managerial priorities.
During the second-quarter 2026 call, the company reaffirmed its 2026 core earnings per share guidance of $5.90 to $6.20 and maintained its long-term core EPS growth target of 5% to 7% through 2030, citing regulatory visibility from the 2025 General Rate Case decision through 2028 and projecting zero common equity issuances through 2030.4 The commitment to avoid common equity dilutive offerings remains a central theme for executive leadership, as funding the planned $38 billion to $41 billion capital program entirely through debt and operating cash flows allows existing shareholders to capture full rate base expansion.
However, messaging during the same period highlighted underlying structural vulnerabilities. Pizarro issued a public warning during an earnings call, stating that without additional legislative action in 2026, California investor-owned utilities faced a strong likelihood of credit rating downgrades, with higher borrowing costs ultimately passed through to utility customers.21 This explicit warning reflected active public lobbying by leadership, identifying concrete financial consequences for state policymakers.
That cautious messaging stood alongside CFO Rigatti's characterization of wildfire-related expenses as a temporary operational headwind that would not disrupt the company's long-term growth trajectory.10 While those perspectives can be reconciled—with the core capital plan representing the baseline case and tail liabilities representing the systemic risk—the contrasting statements demonstrate that executive leadership simultaneously described wildfire liabilities as a manageable cost item and as a potential trigger for sector-wide credit downgrades.
Earnings guidance patterns also illustrate a non-linear growth path. The core EPS guidance range of $5.90 to $6.20 for 2026 sits below the $6.55 reported for 2025, a step-down management attributed to higher depreciation, increased tax expenses, and wildfire-related costs, before projecting a recovery in 2027 to a range of $6.25 to $6.65.10 Although multi-year compound annual growth targets remain mathematically consistent from a rebased baseline, actual year-over-year earnings performance exhibits greater volatility than the long-term target suggests.
The Eaton Claims Machine
Operational management of the Eaton Fire liabilities centers on the utility's Wildfire Recovery Compensation Program, an out-of-court mechanism designed to evaluate and settle individual claims directly. By mid-2026, SCE had extended more than 2,200 settlement offers totaling $775 million across roughly 12,300 individual claimants, while processing approximately 30,000 litigated claims and executing subrogation settlements with insurance carriers at roughly 55 cents on the dollar.4
The 55-cent subrogation settlement rate offers a key indicator of commercial claim valuation. Institutional insurers holding subrogated claims represent sophisticated counterparties seeking to balance litigation exposure against the time value of money. Settling below 60% of face value indicates an assessment of litigation risk, though it provides limited insight into unresolved personal injury and wrongful death claims, which represent less predictable financial liabilities.
As of June 30, 2026, SCE recorded $1.6 billion in pre-tax losses related to Eaton settlements, offset by $917 million in expected recoveries from customer-funded self-insurance, $645 million from the Wildfire Fund, and $70 million through FERC-regulated rate mechanisms—yielding a net after-tax charge to earnings of $9 million, which represents the required shareholder contribution under the self-insurance framework.11
This accounting treatment relies on specific regulatory and administrative outcomes. The modest $9 million net earnings impact holds only if each anticipated recovery is realized in full: the self-insurance framework must function as approved, the Wildfire Fund administrator must approve claims draws within remaining fund capacity, and FERC must permit its cost allocation share. Recoveries are currently booked as balance sheet receivables subject to future verification, an accounting structure comparable to the $4.7 billion procurement undercollection balance SCE carried during the 2000–2001 energy crisis. Independent financial analysis suggests potential total liabilities may exceed management's recorded estimates, with Jefferies analysts projecting total Eaton liabilities of approximately $13.5 billion.10
Credibility Assessment
On operational execution, management's record demonstrates consistency with stated objectives. Covered conductor installation has progressed ahead of initial timelines, cost recovery for the Woolsey Fire was completed—including approximately $2 billion in securitization bond issuances to pay down utility debt—and the company has maintained its commitment to refrain from common equity offerings during periods of equity valuation pressure.4
Strategic execution presents a more focused record. Executive leadership has demonstrated experience in managing restructuring and crisis recovery—including the resolution of Edison Mission Energy's bankruptcy, the retirement accounting for San Onofre, and the administration of Eaton claims—alongside routine rate-base capital deployment. However, because the holding company has effectively curtailed non-regulated diversification projects, leadership has not been tested on discretionary capital allocation outside the core regulated utility framework.
Key analytical metrics going forward include whether customer bill affordability concerns lead to additional CPUC disallowances or reduced authorized returns on equity, and whether consolidated funds from operations (FFO)-to-debt ratios remain within the 15% to 17% target band required to preserve investment-grade credit ratings.
X. Strategic Frameworks: Helmer's 7 Powers & Porter's 5 Forces
Applying competitive strategy frameworks to a regulated monopoly presents an inherent paradox: standard strategic models explain how companies earn above-market returns, whereas investor-owned utilities operate under legal caps on profitability. When adapted appropriately, however, these frameworks clarify where Southern California Edison's structural protections originate and where vulnerabilities remain.
Hamilton Helmer's 7 Powers
Cornered Resource — High, with a caveat. SCE holds an exclusive service franchise across roughly 50,000 square miles.2 Replicating a parallel distribution grid is practically impossible given prohibitive capital costs and unavailable rights-of-way, creating as close to a structural monopoly as exists in a modern economy. The essential caveat is that this resource is granted by the state and conditioned on ongoing performance. Assembly Bill 1054's safety certification mechanism illustrates how the state can make franchise rights conditional. A cornered resource that a legislature can re-specify in any session is a fundamentally different asset than a patent portfolio or a mineral deposit.
Scale Economies — High. Operating a transmission and distribution network of this magnitude requires absorbing immense fixed costs across approximately 15 million residents. Furthermore, grid hardening and wildfire mitigation operate as scale businesses: weather modeling, high-definition camera networks, predictive risk analytics, and specialized field crews represent fixed-cost investments that only a major utility can justify.
Switching Costs / System Lock-In — High. Residential customers cannot choose an alternative distribution provider, and the Community Choice Aggregation model illustrates the boundary of customer choice: customers who select third-party power procurement still pay SCE's delivery tariffs. The only true exit is complete grid defection.
Process Power — Moderate, and operationally derived. SCE's covered conductor deployment, fire-weather forecasting, and operational protocols for proactive power shutoffs represent institutional capabilities built under regulatory and environmental pressure. Management has also begun integrating machine learning into engineering workflows, targeting a 20% to 30% acceleration in design cycles across roughly 100,000 annual project designs and a 20% reduction in permit processing times across 40,000 annual applications.4 While these targets reflect operational goals rather than completed outcomes, deployment data supports the conclusion that SCE has accumulated specialized wildfire mitigation capabilities ahead of industry peers.
Counter-Positioning — Low. As the legacy incumbent, Edison is the target of counter-positioning by distributed energy providers, whose economic model depends on high incumbent utility rates.
Network Effects — None. Power grids possess physical network topology but lack economic network effects; a neighbor's connection does not increase the economic value of another customer's service line.
Brand Power — Negligible, and potentially negative. Utility brand equity in California carries minimal commercial value. Customer perception remains dictated by rates and service reliability, while the association of the utility's equipment with wildfire ignitions in communities such as Altadena represents a reputational liability with political ramifications.
Porter's Five Forces
Threat of New Entrants — Very Low. High capital intensity, exclusive franchise rights, and regulatory licensing requirements prevent new market entrants from disrupting the distribution grid.
Bargaining Power of Suppliers — Moderate and rising. Supply chain constraints have emerged as a broader industry challenge. Extended lead times for large power transformers, switchgear, and specialized conductor threaten to delay capital project completion globally. Equipment delays risk converting into capital expenditure slippage, which defers planned rate base expansion.
Bargaining Power of Buyers — High through political and regulatory channels. While individual ratepayers possess limited leverage, consumers exercise substantial collective power through advocacy groups such as The Utility Reform Network and the CPUC's Public Advocates Office, as well as through elected officials. The $727 million reduction in requested revenue requirements for the 2025 rate case and the reduction in authorized return on equity illustrate how buyer power operates in a regulated framework—manifesting through political and regulatory decisions rather than price negotiations.1617 In a market where regulators establish tariffs, customer leverage centers on political influence over regulatory appointments and policy mandates.
Threat of Substitutes — Moderate and increasing over time. Falling battery storage costs enhance the viability of paired solar-and-storage systems. While complete grid defection remains uneconomic for most customers, partial defection by high-consumption, creditworthy customers risks leaving fixed grid maintenance costs distributed over a smaller customer base. Although this dynamic has not led to total grid departure in major utility markets, high retail rates and favorable solar conditions make California a key test case for partial substitution.
Competitive Rivalry — Low. Edison faces no direct geographic competition. Operational rivalry exists primarily through regulatory benchmarking, in which the CPUC evaluates SCE's authorized returns and operating efficiency against state peers.
Ultimately, Edison's insulation from direct commercial competition is virtually complete, yet largely secondary to its financial performance. The primary determinants of shareholder returns remain legal doctrines and regulatory outcomes. Purchasing Edison International common equity represents an investment not in a traditional competitive moat, but in California's political economy of regulated electricity.
XI. Bull vs. Bear Case & Investor Stress Test
The Bull Case
The affirmative investment thesis for Edison International rests on four core arguments:
Mandatory infrastructure expansion. California has legislated a 100% clean electricity target by 2045 and is pursuing broad transportation and building electrification. Delivering on these mandates requires extensive transmission and distribution investments, which must flow through the utility that owns the regional wires network. Rather than depending on consumer demand preferences, this expansion is driven by statutory deadlines, making SCE the essential counterparty across its service territory.
Equity dilution avoidance. The $38 billion to $41 billion capital program through 2030 is projected to be financed entirely from operating cash flows and debt, with no new common equity issuances through 2030.4 For equity investors, this distinction separates simple rate base expansion from per-share earnings growth, avoiding the dilution that has eroded shareholder returns at national peers pursuing comparable capital programs.
Improved regulatory visibility. The California Public Utilities Commission's 2025 General Rate Case decision fixed SCE's authorized revenue requirement through 2028.16 Combined with the December 2025 cost of capital decision covering 2026 through 2028, key regulatory variables remain settled over a three-year horizon.17
Legislative backstop history. State policymakers have repeatedly intervened to preserve utility financeability—first with Assembly Bill 1054 in 2019 and subsequently with Senate Bill 254 in 2025—rather than permitting investor-owned utilities to lose capital market access.[^11]12
For income-oriented investors, the utility has also maintained a steady record of annual common stock dividend increases following its post-crisis reinstatement.
The Bear Case, Tested Against the Record
Evaluating these bullish premises requires testing each core claim against historical evidence and operational data from Edison's record.
Test 1: Does AB 1054 eliminate bankruptcy risk?
The bull argument posits that the Wildfire Fund and statutory liability caps eliminate existential insolvency risks for the utility.
However, recent operational evidence challenges this assumption. A single event—the January 2025 Eaton Fire—is expected to consume roughly the entirety of the fund's initial $21 billion claims-paying capacity.11 Designed as a multi-year, multi-event liquidity buffer, the original fund faced functional depletion by one fire in its sixth year. In response, state lawmakers established a secondary $18 billion Continuation Account applicable only prospectively, funded through a joint shareholder-ratepayer arrangement and subject to new operational constraints, including restrictions on rate-basing an initial tranche of wildfire mitigation capital.1213
Furthermore, statutory liability caps protect against cost disallowances rather than underlying legal liability, and they do not apply if utility conduct is determined to constitute willful misconduct or gross negligence. The Eaton Fire investigation centers on an unmonitored, de-energized transmission tower, after which SCE implemented a policy of grounding idle lines every two miles.10 While operationally prudent, post-event remediation measures can complicate legal defense strategy by providing opposing litigants arguments regarding prior asset management standards—the precise context in which gross negligence claims are litigated.
Verdict: The claim that AB 1054 eliminates insolvency risk is unsupported in its broad form. A more accurate formulation holds that AB 1054 and SB 254 reduce liquidity-driven bankruptcy risk from routine wildfire events and limit shareholder exposure during prudently managed ignitions. However, tail risk from a catastrophic fire paired with an adverse conduct finding remains unhedged. Critical factors to monitor include the final regulatory determination regarding SCE's idle line management, the processing speed of Wildfire Fund claim draws, and whether total Eaton settlement liabilities align with recorded balance sheet reserves or higher external estimates.
Test 2: Will the CPUC maintain 7% rate base growth at an approximate 10% ROE?
This argument assumes that California regulators will continue approving capital deployment at historical returns on equity.
Regulatory decisions already on the record counter this expectation. The 2025 General Rate Case reduced SCE's requested revenue requirement by $727 million, explicitly citing customer bill affordability as the driver.16 Additionally, the December 2025 cost of capital ruling lowered authorized returns on equity by approximately 30 basis points across California's major utilities, setting SCE's authorized ROE at 10.03%.1718 SB 254 further restricts utilities from earning a rate-base return on an initial tranche of wildfire mitigation capital expenditure through 2035.13 With Southern California residential tariffs rising significantly over recent years, ratepayer advocacy groups have intensified political pressure on regulatory proceedings.
This dynamic creates a structural paradox: the same statutory framework that provides a liquidity backstop also restricts shareholder returns on safety capital.
Verdict: While rate base growth remains supported by physical grid requirements and state clean energy targets, the authorized return on that rate base faces structural downward pressure. Allowed returns on equity in California display a downward trajectory, with statutory and regulatory mechanisms limiting shareholder returns on portions of approved capital. The key analytical benchmarks to evaluate going forward are the post-2028 cost of capital proceeding and SCE's earned ROE relative to authorized levels in the interim.
Test 3: Is regulated capital deployment inherently low risk?
This thesis asserts that because CPUC oversight governs utility investments, capital deployment carries minimal risk of permanent capital impairment.
Edison's operational history across both unregulated and regulated divisions refutes this generalization. Unregulated subsidiary Edison Mission Energy consumed two decades of discretionary growth capital before filing for Chapter 11 bankruptcy in 2012, with its assets ultimately sold for approximately $2.64 billion.56 Within the core regulated utility, the San Onofre nuclear plant—a pre-approved, rate-based asset—was retired prematurely in 2013 with roughly $4.7 billion in invested capital and decades of licensed operating life remaining, following a $670 million steam generator replacement project that caused severe equipment degradation.8 The subsequent cost allocation settlement was reopened and revised to shift substantial costs onto shareholders following an ex parte disclosure scandal.9
Verdict: The general claim that regulated capital deployment is inherently safe is invalid. Regulatory pre-approval does not guarantee cost recovery if asset failure occurs or political scrutiny escalates. A narrower, defensible claim holds that routine distribution infrastructure—poles, wires, transformers, and meters—carries a reliable recovery history, and SCE's current capital plan consists primarily of these assets. Higher risk remains concentrated in large, technically complex capital projects. Consequently, monitoring execution on the advanced metering infrastructure upgrade program and major transmission initiatives offers important insight into capital risk management.15
The Activist Stress Test
A critical financial evaluation highlights five core balance sheet and strategic vulnerabilities:
- Reserve adequacy and recovery receivables. The largest accounting judgment on Edison's balance sheet involves expected wildfire recovery receivables netted against recorded losses.11 The variance between the approximately $1.6 billion in recorded Eaton Fire settlement charges and higher third-party estimates of ultimate liability represents a major swing factor for equity value. An institutional investor would seek granular disclosure regarding claims distributions, the underwriting assumptions behind self-insurance and Wildfire Fund recoveries, and detailed sensitivity modeling.
- Asset governance and historical conduct. Implementing an idle-line grounding policy post-fire raises questions regarding historical asset management protocols. Evaluating how de-energized infrastructure was inventoried, inspected, and risk-ranked prior to January 2025 represents a central corporate governance issue for executive leadership and the board of directors.
- Portfolio complexity and non-regulated allocation. Although clean energy advisory firm Trio remains immaterial to overall earnings, its presence requires corporate focus. Given the legacy of Edison Mission Energy, skeptics question the strategic rationale for maintaining non-regulated advisory ventures alongside core utility operations.
- Refinancing costs and credit rating sensitivity. Chief Executive Officer Pedro Pizarro's explicit warning regarding potential sector-wide credit downgrades underscores a fundamental balance sheet vulnerability.21 With a $38 billion to $41 billion capital program funded heavily through debt, higher borrowing costs resulting from rating downgrades would feed directly into customer tariffs, exacerbating affordability concerns that compress allowed returns on equity.
- Capital constraints of the no-equity commitment. Refraining from common equity issuances through 2030 protects existing shareholders from dilution, but can constrain financial flexibility if wildfire cash outflows outpace regulatory and fund recoveries. Managing unexpected cash obligations under a fixed equity framework requires trade-offs between capital expenditure scaling, debt leverage targets, and funding commitments.
XII. Key Forward KPIs & Epilogue
While utility coverage often overwhelms investors with secondary metrics, three primary indicators will determine Edison International's long-term financial performance.
1. Wildfire liability resolution versus recorded reserves — and remaining fund capacity.
Wildfire exposure remains the dominant investment variable. Key metrics to monitor include the trajectory of settled Eaton claims against recorded losses, the timing of recovery receivables from self-insurance and the Wildfire Fund, remaining claims-paying capacity in both the original fund and the SB 254 Continuation Account, and any regulatory or legal determinations regarding SCE's idle transmission line.1112 All other elements of the valuation thesis remain downstream of these liability determinations.
2. Authorized return and rate base execution — measured against affordability pressure.
Rate base expansion drives potential earnings growth only if regulators preserve allowed returns. Investors should monitor authorized versus earned returns on equity, capital deployment against the planned $38 billion to $41 billion capital program, cost disallowances in ongoing rate cases, and the trajectory of residential electricity bills relative to Southern California household income.417 Customer bill affordability serves as the primary political constraint shaping future regulatory decisions.
3. FFO-to-debt and the credit rating trajectory.
Management targets a funds from operations (FFO)-to-debt ratio in the 15% to 17% range to maintain investment-grade credit ratings. Given the scale of planned debt issuances and executive warnings regarding potential sector-wide downgrades, this solvency metric serves as the primary indicator of balance sheet stress.21 Because wildfire liability disbursements precede regulatory cost recoveries, cash outflows impact credit metrics before offsetting revenues are realized.
Epilogue
A clear historical symmetry defines Edison International's evolution. In 1913, its predecessor completed the Big Creek hydroelectric project, transmitting power 240 miles from the Sierra Nevada to supply a growing coastal basin lacking local fuel reserves. The transmission grid represented the company's defining engineering achievement.
A century later, that same infrastructure constitutes its primary financial vulnerability. Overhead transmission corridors designed to build a modern regional economy now cross terrain increasingly subject to severe wildfires, operating under a legal doctrine of strict liability that assigns property damages to infrastructure owners. Although modern grid hardening—including covered conductor, high-definition cameras, predictive weather modeling, and targeted power shutoffs—has reduced operational risk relative to 2017 levels, physical engineering alone does not determine corporate outcomes.
Edison's historical crises have turned consistently on regulatory and legal frameworks. Legislation produced the structural mismatch of the 2000–2001 energy crisis, political negotiations yielded the settlement that restored solvency, licensing requirements and ex parte disclosures dictated the retirement of the San Onofre nuclear plant, and the ultimate financial impact of the Eaton Fire will be resolved through judicial proceedings, regulatory decisions, and legislative action.
Throughout its 140-year history, Edison International's foundational capability has centered on navigating its relationship with California's political and regulatory institutions. The physical grid represents the underlying asset, but state energy policy and regulatory frameworks constitute the core business model. Understanding the utility requires evaluating both its physical infrastructure and the political economy in which it operates.
References
-
Utility's idle transmission tower caused 2025 Eaton Fire, which killed 19, L.A. County officials say — NBC News, 2026-08 ↩↩
-
Edison International Investor Relations Portal — Edison International ↩↩↩↩↩↩
-
Edison International SEC Filings & Form 10-K Archive — U.S. Securities and Exchange Commission ↩↩
-
Edison International (EIX) Q2 2026 Earnings Call Transcript — The Motley Fool, 2026-07-30 ↩↩↩↩↩↩↩↩↩↩↩
-
Edison Mission Energy Chapter 11 Reorganization Docket Archive — U.S. Bankruptcy Court ↩↩
-
Edison International News, Market Data, and Filings — Reuters ↩↩
-
Southern California Edison Regulatory Proceedings and Settlement Documents — California Public Utilities Commission ↩↩↩
-
Edison International SEC Form 8-K and Annual Report Archive — U.S. Securities and Exchange Commission ↩↩↩
-
CPUC Decision D.14-11-040 approving SONGS Retirement Settlement — California Public Utilities Commission Archive ↩↩↩
-
Southern California Edison expects 'muted' 2026 growth as wildfire costs roll in — Utility Dive, 2026 ↩↩↩↩↩
-
Edison International Form 10-Q for the quarterly period ended June 30, 2026 — U.S. Securities and Exchange Commission, 2026-07-30 ↩↩↩↩↩↩
-
California Enacts New Electric Transmission Financing Programs and Adds to Its Wildfire Fund — Greenberg Traurig LLP, 2025-10 ↩↩↩↩
-
Survivors of past Northern California wildfires shut out of last-minute bill adding $18 billion for state's restitution fund — The Press Democrat, 2025-09-20 ↩↩↩
-
Edison International Second-Quarter 2026 Financial Results — U.S. Securities and Exchange Commission Form 8-K, 2026-07-30 ↩
-
Edison (EIX) Q1 2026 Earnings Call Transcript — The Motley Fool, 2026-04-28 ↩↩↩
-
CPUC Decision Fact Sheet: Southern California Edison's 2025 General Rate Case — California Public Utilities Commission, 2025-09-18 ↩↩↩↩
-
CPUC Fact Sheet: Cost of Capital Decision — California Public Utilities Commission, 2025-12-18 ↩↩↩↩↩
-
California PUC lowers utilities' return on equity by 0.3 percentage points — Utility Dive, 2025-12 ↩↩
-
California Clean Energy & Grid Reliability Reports — California Energy Commission ↩
-
Edison International Second-Quarter 2026 Earnings Teleconference Presentation — U.S. Securities and Exchange Commission, 2026-07-30 ↩↩↩
-
Without wildfire reform, California utilities could see credit impacts: Edison International — Utility Dive, 2026 ↩↩↩
 LinkedIn
 WhatsApp
 Reddit
 Hacker News
 Email
Email Kindle
 RSS Feed
 Spotify
 Apple Podcasts
 Amazon Music
 Audible
 YouTube