Brown & Brown: The Story of America's Relentless Insurance Consolidator
I. Introduction & Episode Roadmap
On June 10, 2025, Daytona Beach, Florida-based insurance broker Brown & Brown announced a $9.825 billion agreement to acquire RSC Topco, Inc.1 Target entity RSC Topco served as the holding company for Accession Risk Management Group, parent of Risk Strategies and One80 Intermediaries. Two days later, Brown & Brown issued 43,137,254 new common shares at $102.00 per share, raising $4.315 billion net. The following day, it placed $4.2 billion in senior notes across six tranches with maturities extending through 2055.2 In seventy-two hours, a firm that had spent three decades purchasing small-town insurance agencies at eight times earnings rewired its balance sheet.
Fourteen months later, on August 31, 2026, the stock trades around $72 — roughly 29% below the equity offering price and down from a 52-week high of $97.15.3 Market capitalization sits near $24 billion, below its level at the end of 2024, when Brown & Brown generated one-third less revenue.[^4] The business expanded in scale, yet its equity market value contracted. That divergence forms the central focus of this analysis.
The company the thirty-year record describes
This trajectory contrasts with Brown & Brown’s long-term historical performance. For three decades, the company operated as a steady compounder: annual revenue grew from roughly $83 million prior to its 1993 public listing to $5.956 billion in fiscal 2025, securing a place as an S&P 500 Dividend Aristocrat led by three generations of founding family management.4 Its operating model relied on broad decentralization under local branch leaders, whom Chairman J. Hyatt Brown described as "the horse" because a strong local agent "pulls the whole town along."5 Capital allocation followed a disciplined pattern: hundreds of small acquisitions executed at single-digit earnings multiples, financed conservatively and integrated lightly.
In 2025, management shifted strategy. The central thesis of this analysis is that Brown & Brown’s 2025–2026 performance represents an active test of whether its historical operating model can succeed at the scale management has now adopted.
The company the current numbers describe
Initial operating results display noticeable stress. Organic revenue growth — which excludes acquisitions to measure underlying business performance — fell 2.8% in the fourth quarter of 2025 and contracted another 0.7% in the second quarter of 2026. By comparison, peers Arthur J. Gallagher and Marsh McLennan posted organic growth of 6% and 5%, respectively, over the same quarter.678 In December 2025, approximately 275 employees departed for a rival start-up, taking an estimated $23 million in annual revenue and resulting in a projected $50 million to $60 million revenue loss for 2026.97 Meanwhile, second-quarter 2026 interest expense doubled year-over-year to approximately $100 million.7 On August 10, 2026, P. Barrett Brown — son of Hyatt Brown and brother of CEO J. Powell Brown — resigned his executive officer roles "for good reason" after an outside hire assumed leadership of the Retail segment.10
Four threads to follow
Four primary themes organize this narrative.
First is the economics of insurance brokerage: why the tollbooth model is highly regarded in financial services, and where claims of zero balance-sheet risk require closer scrutiny against actual financial filings.
Second is corporate governance and family control. Three generations of the Brown family have guided the firm, and their roughly 12.5% beneficial ownership stake maintains effective voting control.11 While family oversight historically provided stability, it now introduces critical governance questions.
Third is M&A execution. Integrating small tuck-in brokerages at 8 to 10 times earnings is fundamentally different from integrating a $9.8 billion leveraged platform purchase, carrying distinct financial math and integration risks.
Fourth is structural competitive advantage. The primary question for investors is whether Brown & Brown possesses an enduring moat, or whether historical results reflected a favorable pricing cycle that has now turned.
 Subscribe on LinkedIn
II. The Insurance Brokerage Tollbooth: Mechanics & Economics
Consider a mid-sized trucking company in Ohio seeking insurance coverage. The enterprise requires commercial auto coverage for its fleet, general liability, workers' compensation for drivers, property coverage on its terminals, an umbrella layer, and health benefits for 300 employees. The business owner cannot easily determine which of the more than 1,000 carriers in the U.S. market will write those specific risks at a competitive price, as underwriting appetites shift annually. The owner relies on an insurance broker.
The broker does not assume the underlying underwriting risk. That distinction forms the core of the brokerage business model. Insurance carriers—such as Chubb, Travelers, or Liberty Mutual—commit risk capital and absorb claims losses. The broker designs the insurance program, negotiates terms with carriers, advises on coverage structure, and collects a commission, typically in the low double digits as a percentage of premium. The carrier manages reserve risk, catastrophe exposure, asset-liability mismatch, and regulatory capital requirements. The broker carries virtually none of those balance-sheet liabilities.
The road, not the casino
This dynamic separates the asset-light intermediary from the risk-bearing insurer. A carrier’s underwriting margins fluctuate significantly based on catastrophe loss years, while the broker collects commissions regardless of overall loss ratios. Brokerage revenue is recurring by design: commercial policies renew annually, and middle-market corporate clients switch brokers infrequently. Furthermore, the model requires minimal capital expenditure, which represented roughly 1.1% of revenue for Brown & Brown in 2025.12 The business converts a high proportion of earnings into cash: management targets free cash flow conversion of around 23% of revenue, generating nearly $1.5 billion in operating cash flow in 2025 on $5.956 billion in total revenue.134
Qualification one: the filings do not say "zero risk"
While the core brokerage model is asset-light, regulatory filings reveal that Brown & Brown does not operate entirely free of underwriting risk. In its 2025 Form 10-K, the company notes that it "primarily operates as an agent or broker not assuming underwriting risks"—before detailing six categories of ancillary operations that do assume risk: reinsurance companies and stand-alone captives, series captive insurance companies, protected cell companies, segregated account companies, a quota share captive, and an excess of loss layer captive.4 The quota share captive retains risk on property policies issued through the firm's managing general underwriters, covering earthquake and wind-exposed properties that carry tail-loss exposure. The excess of loss captive assumes personal property risk concentrated in the southeastern United States. Although both entities purchase reinsurance, the annual filing states that this risk transfer limits "but does not fully eliminate" potential losses. Additionally, Brown & Brown operates Wright National Flood Insurance Company as a write-your-own carrier under the National Flood Insurance Program.4
The direct financial exposure remains relatively small relative to overall revenue. Earned premiums in the Specialty Distribution segment totaled $83 million in 2025 against segment revenue of $2.409 billion.4 In a typical operating environment, this liability represents a minor line item on the income statement. However, the exposure is concentrated in coastal catastrophe risk. Rather than operating with absolute balance-sheet immunity, Brown & Brown functions as a capital-light distributor that retains targeted, reinsured underwriting exposure to support program capacity—a structural risk explicitly outlined in its annual report filings.4
Qualification two: exposure times rate, and who controls the rate
A second structural constraint governs broker revenue growth. Organic revenue growth depends on three primary drivers: client economic exposure (such as payroll, property values, and gross revenue), carrier insurance rates per unit of exposure, and net new business volume. While economic exposure tracks macroeconomic activity and net new business reflects sales execution, insurance pricing operates on a cyclical basis beyond the broker's direct control.
During periods of severe underwriting losses or constrained capital, insurance carriers raise premium rates across commercial lines. In this "hard market" phase, brokers earn higher commissions on existing client books without proportional increases in operating costs. Conversely, when capital enters the market and pricing softens, commission revenue per policy declines. Brokers effectively operate as price-takers subject to broader insurance pricing cycles.
Following a sustained hard market from 2019 through 2023, commercial property pricing experienced a significant downward adjustment. On Brown & Brown's second-quarter 2026 earnings call, Chief Executive Officer J. Powell Brown noted that catastrophe property rates fell 15% to 35% year-over-year, pointing out that coastal catastrophe property rates in Southeast Florida had returned to 2017 levels.7 Nine years of premium rate increases were erased in a single market turn. Addressing whether property rates had reached a floor, management declined to project a market bottom, estimating that stabilizing pricing would require an industry-wide catastrophe loss event between $100 billion and $150 billion.7
Where Brown & Brown sits in the industry
This cyclical environment impacts the broader industry across three primary tiers: global megabrokers—such as Marsh McLennan, Aon, and Willis Towers Watson—which focus on multinational corporations; a middle-market tier led by Arthur J. Gallagher and Brown & Brown, alongside specialized firms like Ryan Specialty and private-equity-backed consolidators including HUB, USI, and NFP; and tens of thousands of independent local agencies. Brown & Brown built its historical foundation by acquiring smaller local agencies across this fragmented lower tier. The central question for the business is whether that acquisition model can continue to deliver compounding returns under its current scale.
III. The Founding & The Hyatt Brown Era: Local Shop to Regional Powerhouse (1939–1993)
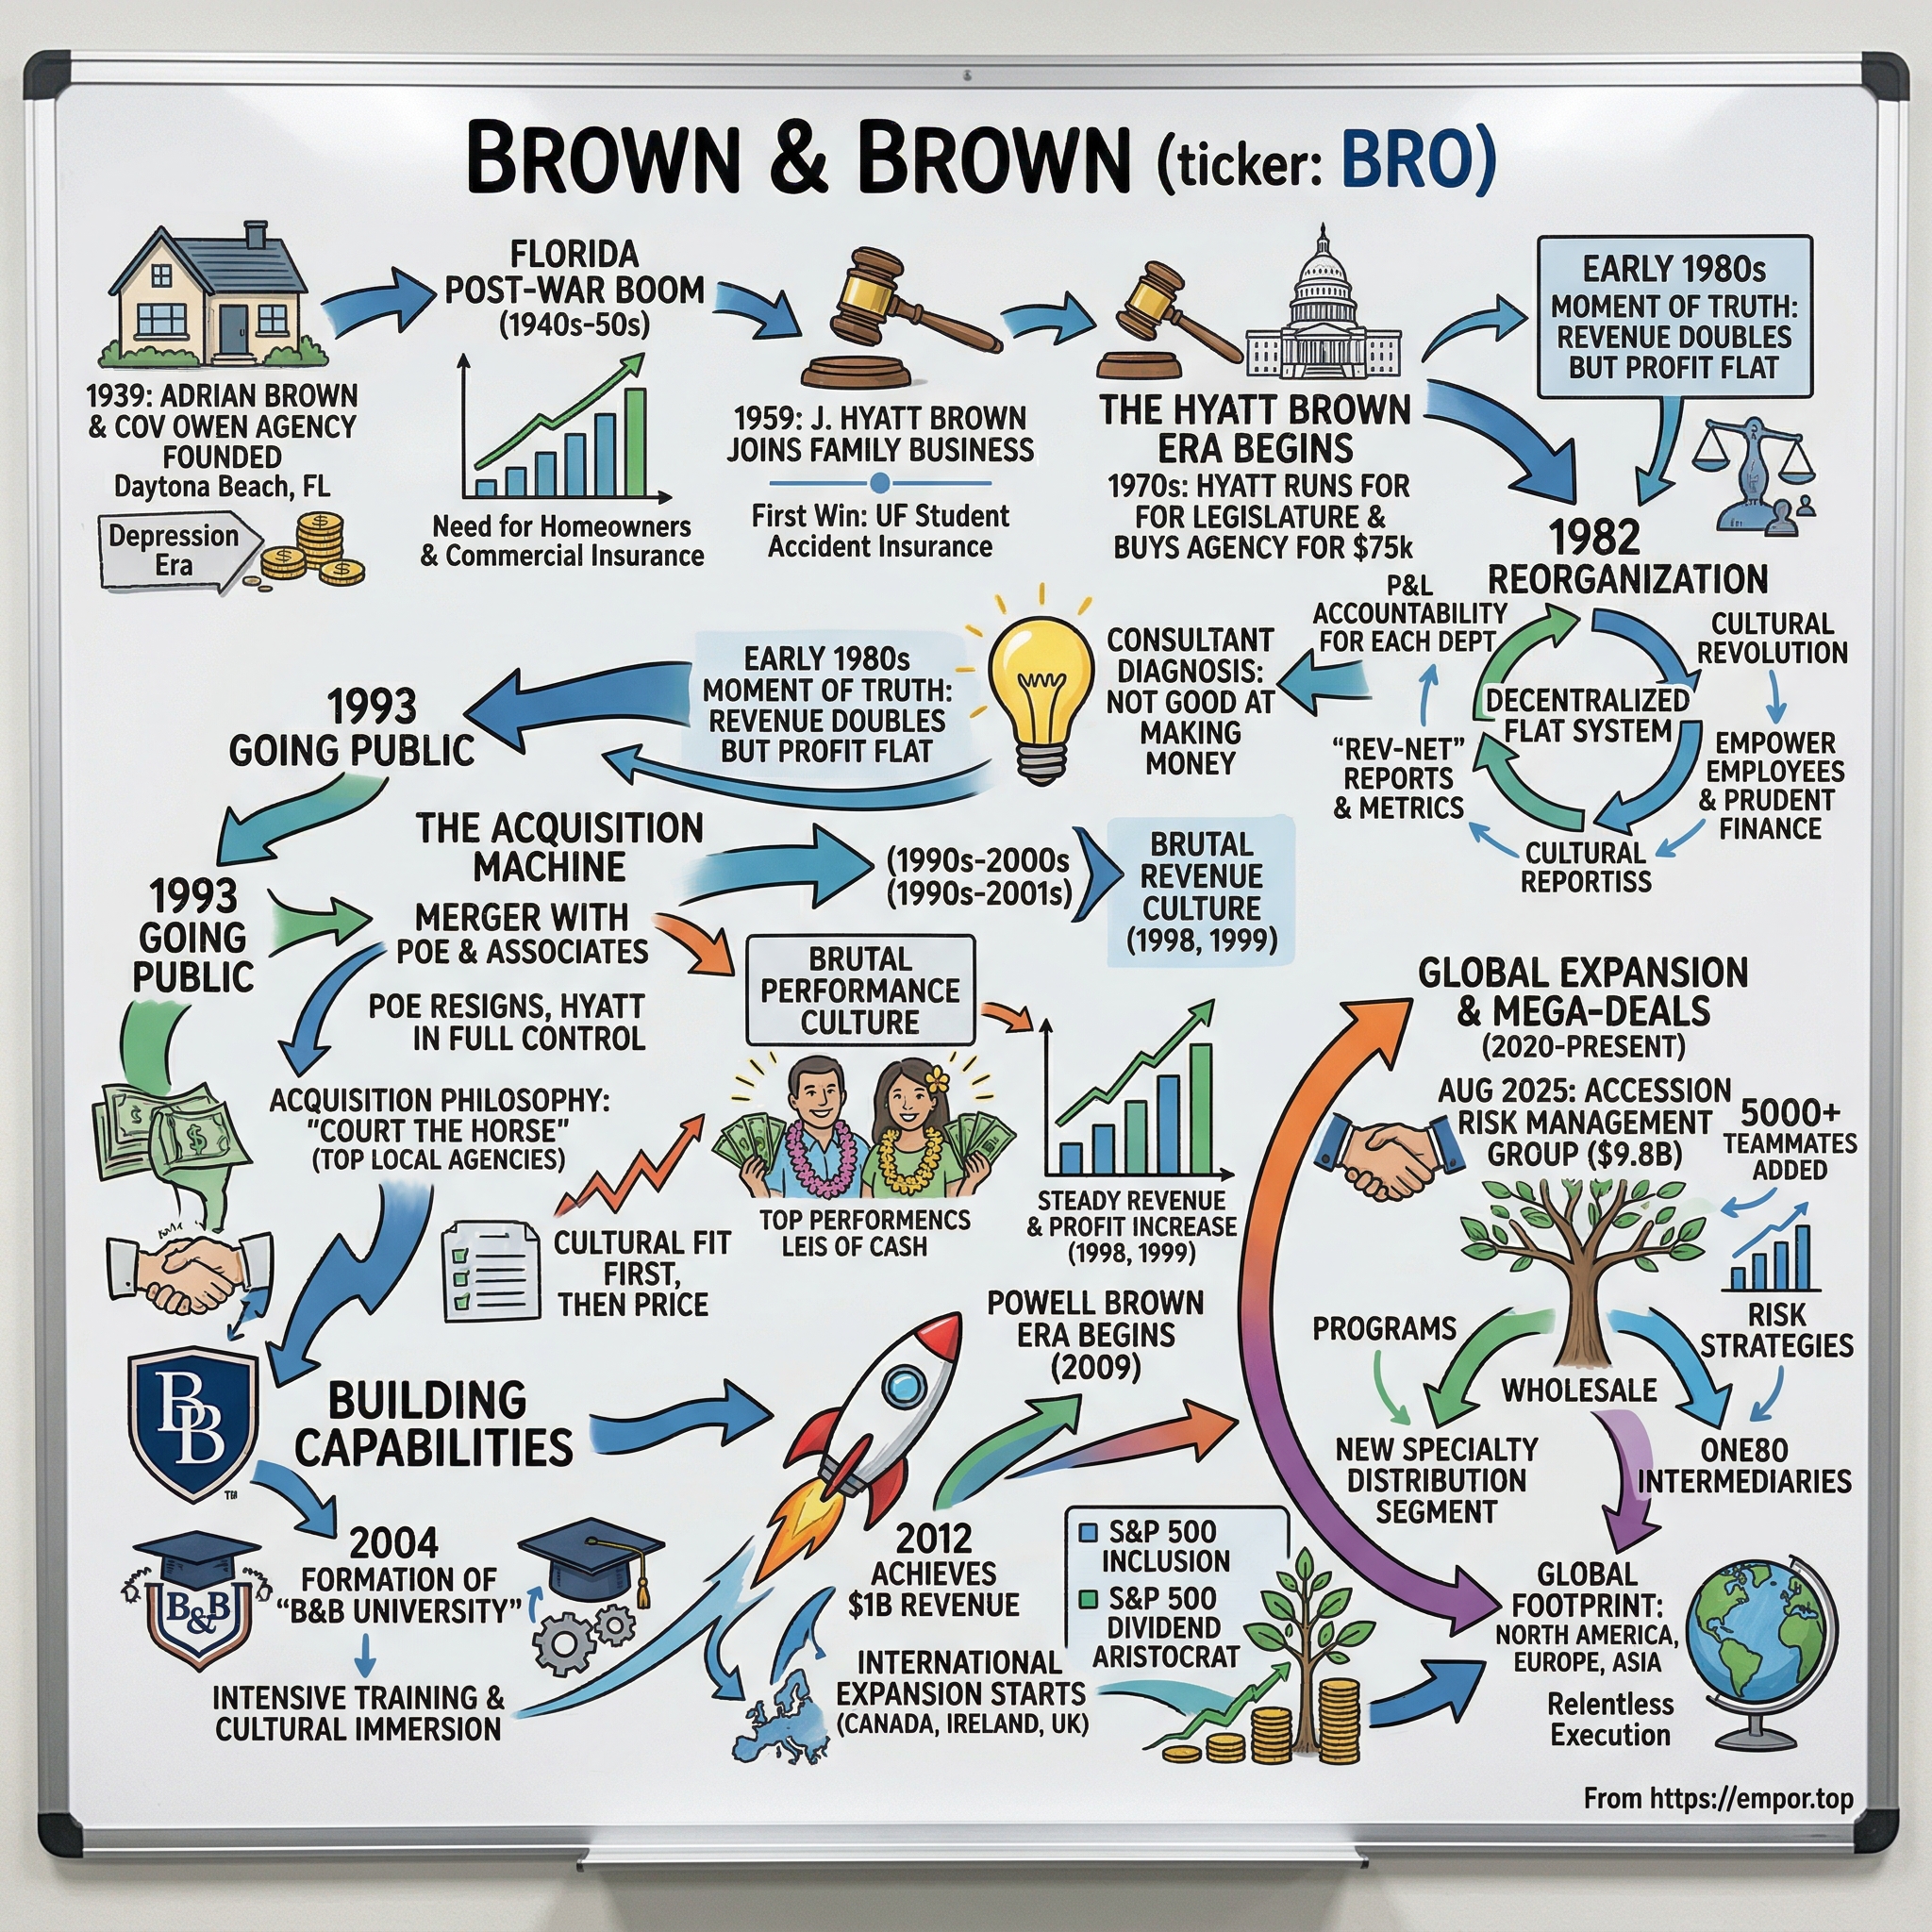
In 1939, a Metropolitan Life agent named J. Adrian Brown opened an insurance agency in Daytona Beach with his cousin, Charles "Cov" Owen.14 Florida was not yet a major economic powerhouse; it was a state of citrus groves, cattle, small ports, and tourism, with a total population smaller than metropolitan Chicago's. The business was a conventional local commercial agency—writing coverage for the merchants, contractors, and growers of Volusia County, collecting commissions, and maintaining steady operations.
The enterprise remained modest for two decades. The pivotal shift occurred in 1959 when Adrian's son, J. Hyatt Brown, returned from the University of Florida to join his father and brother at an agency generating approximately $45,000 in annual revenue.14 In 1961, Hyatt purchased the firm and became its chief executive.4
The man who wrote the operating system
Hyatt Brown was the central figure in shaping the firm's culture, establishing an operating system that directly reflected his management philosophy. He maintained a disciplined, highly competitive posture, emphasizing that success required relentless execution. He summarized the firm's approach to performance management in four words: "we weigh and measure everyone."5 Alongside his corporate role, he pursued public service—winning election to the Florida House of Representatives in 1972 and serving as Speaker of the House from 1978 to 1980—which built a strong political and business network across a rapidly growing state.4
"The horse"
The core insight behind Brown & Brown’s early strategy focused on local market dynamics rather than financial engineering. Hyatt Brown concluded that his primary competition was not global brokers like Marsh or Aon, but the leading independent agency in each municipality. In most mid-sized towns, that agency centered on a prominent local figure—an agent embedded in civic organizations, local boards, and community networks who understood upcoming commercial bids. Hyatt termed that key producer "the horse," noting that a strong local agent "pulls the whole town along."5
This focus on key individuals shaped the company's organizational structure. Because client value resided in local relationships rather than centralized corporate processes, Brown & Brown rejected a traditional corporate hierarchy. Each branch operated as an autonomous profit center with its own income statement. Office leaders retained local decision-making authority, received performance-based compensation, and held equity in the business. Regional managers, rather than a centralized corporate development team, sourced, negotiated, and integrated acquisitions while remaining accountable for ongoing operations. Corporate overhead remained lean. In 1980, Hyatt accelerated this strategy, choosing to "put the pedal to the metal and grow like crazy."5
Florida and Georgia, one town at a time
Throughout the 1960s, 1970s, and 1980s, expansion extended across Florida and Georgia. The firm targeted middle-market accounts typically overlooked by national brokers: municipalities, regional contractors, agricultural operations, and auto dealerships. By the early 1990s, Brown & Brown had established a significant regional presence, setting the stage for national expansion.
The falsification test: did the local-relationship model actually insulate the business from the cycle?
The thesis behind the decentralized model suggests that deep local relationships create client loyalty, insulating the business from industry pricing cycles. Historical results present a more nuanced reality.
During the severe soft markets of the late 1970s and mid-1980s, agency revenue fluctuated alongside falling premium rates. Because broker commissions represent a fixed percentage of insurance premiums, commission rates do not automatically rise to offset falling policy prices. High client retention preserves the client relationship, but it does not protect revenue per client when overall rates drop. Rather than relying on pricing immunity, Hyatt Brown responded by demanding higher sales volume—pushing agents to acquire new accounts to offset declining rates per policy. That strategy established an aggressive growth mandate rather than a structural buffer against market cycles.
This distinction remains vital for evaluating Brown & Brown's modern financial performance. An insurance broker maintaining client retention above 90% can still experience negative organic revenue growth if market-wide premium rates contract, as retention rate and revenue per policy are separate operational metrics.
By 1992, Hyatt Brown led a flourishing regional broker with an established operating culture but no publicly traded equity to fund broader acquisitions. In Tampa, a rival broker faced the exact opposite challenge.
IV. Going Public, The Roll-Up Engine, & B&B University (1993–2009)
William Poe founded Poe & Associates in Tampa in 1956 with $20,000 in startup capital. By 1992, it was a public company distributing through 130 independent agents across nine states and generating roughly $50 million in annual revenue.14 In September 1992, Poe approached Hyatt Brown. Both men were University of Florida alumni and members of the same fraternity, reflecting the tight network that characterized Florida business in that era.
The merger closed in April 1993, creating Poe & Brown with combined 1992 revenues of roughly $83 million and instantly establishing the largest insurance brokerage headquartered in the Southeast.14 The transaction also secured a New York Stock Exchange listing under the ticker BRO. That public equity provided the essential acquisition currency required to transform a regional agency into a national consolidator.
The Poe problem
The cultural integration proved far more challenging than the financial structure. Poe served as chairman for roughly a year before resigning in August 1994, stating he was "not comfortable serving in a subordinate position" and finding Brown's strict bottom-line management style incompatible with his own leadership approach.14 In 1999, shareholders voted to drop the Poe name and return the corporate identity to Brown & Brown — a tribute, Hyatt noted, to his father and brother.14
That departure marked the first documented instance of an executive pattern within the firm. While Brown & Brown's decentralized structure grants operational autonomy to local branch offices, executive leadership remains tightly controlled. The company empowers profit-center leaders but remains unsentimental about senior executives who diverge from its management model—a source of organizational discipline that has twice led to the departure of a prominent executive following a major merger.
The machine: what it bought, and why sellers said yes
With public stock as acquisition currency, the roll-up engine accelerated. Target acquisitions fit a precise profile: middle-market agencies generating $2 million to $15 million in revenue, employing 20 to 100 people, and led by founder-operators in their fifties or sixties seeking a succession solution—in essence, a local "horse" without a designated successor. The commercial proposition appealed directly to sellers: founders gained liquidity, job security for employees, access to broader carrier networks, and continued operational autonomy under their existing agency name. In exchange, Brown & Brown acquired local books of business, experienced producers, and established franchises, typically paying eight to ten times earnings.
The integration playbook separated front-office operations from back-office systems. Local brand names, client relationships, and sales decisions remained intact, while accounting, carrier contracting, compliance, and treasury functions migrated to centralized platforms. This structure allowed client relationships to retain the personal feel of an independent agency, while providing insurance carriers with a unified, high-volume distribution network.
Acquisition volume expanded rapidly. By 1998, the company closed 26 agency acquisitions in a single year.14 The 2000 purchase of The Reidman Corporation nearly doubled the firm's geographic footprint to 24 states. Revenue grew from $118.7 million in 1996 to $209.7 million in 2000, while net income rose from $16.5 million to $33.2 million—a rate of profit growth that made the stock a strong performer throughout the decade.14 By 2001, Brown & Brown ranked as the ninth-largest insurance brokerage in the United States.
Manufacturing producers: Brown & Brown University
To sustain this growth, management addressed a structural talent constraint. Because the operating strategy depended on key local producers, an aging industry workforce created a continuous supply risk. In 2004, Powell Brown and Tom Finwall established Brown & Brown University, an internal training program focused on technical coverage, premium calculation, and cold-call sales execution.15 The company's Form 10-K continues to highlight the program as a central mechanism for integrating new hires from acquisitions and outside industries.4 The initiative represents an effort to institutionalize producer development, turning sales recruitment into a repeatable internal pipeline.
The falsification test: did decentralized sales culture come with clean compliance?
Empowering decentralized local sales offices created recurring supervisory challenges at the corporate level. In December 2006, following a two-year investigation by Florida authorities, Brown & Brown paid $5.8 million to resolve a regulatory probe into whether contingent commissions had been adequately disclosed to policyholders prior to binding coverage.16 The settlement comprised $1 million to state regulators for legal fees, $1.8 million in customer restitution, and $3 million dedicated to a self-insurance trust administered by the firm.16
The regulatory context provides essential perspective. The company faced no formal charges, admitted no liability, and noted in the settlement agreement that it "denies any wrongdoing but desires to resolve this investigation to avoid the further expense and burden of a protracted investigation."16 A company spokesperson emphasized that the disclosure statement in question was "basically the same one we have been using for the past two years."16 Meanwhile, the president of the Florida Association of Insurance Agents characterized the nationwide regulatory scrutiny following New York Attorney General Eliot Spitzer's broker investigations as "me-too-ism."16 Relative to industry peers—such as Marsh McLennan's $850 million settlement in New York—the financial penalty was modest.
This episode demonstrates that delegating authority to hundreds of branch offices creates inherent compliance oversight risks. While the settlement did not indicate widespread misconduct—and no comparable regulatory enforcement has occurred in the subsequent two decades—it underscored that decentralized operating structures require strong central controls. That governance dynamic remains relevant as the organization integrates thousands of newly acquired employees from diverse corporate backgrounds.
Contingent commissions remain an ongoing component of the firm's revenue mix. Over the three years ending in 2025, contingent commissions averaged approximately 4.4% of total commissions and fees, contributing over $250 million in revenue in 2025.417 These payments represent a variable profit stream tied directly to carrier underwriting performance—a factor with direct implications for broader operating margins.
V. The Powell Brown Era & International Expansion (2009–2022)
J. Powell Brown assumed the role of chief executive in July 2009, taking leadership during a severe economic downturn.4
The heir, and what shaped him
Powell Brown joined the firm in 1995, following his 1989 graduation and a gap year in Aspen—a background often cited by colleagues to illustrate a calm, deliberate management style.5 He advanced through operational roles as an account executive and profit-center leader in Tampa, Orange County, and Phoenix, before becoming a regional executive vice president in 2002, president in January 2007, and a director in October 2007.4 Having managed operations across every business segment before assuming the chief executive role, he established a leadership approach based on operational delegation paired with intense internal competition, using publicly displayed quarterly rankings to benchmark U.S. offices.5 His underlying management philosophy remains direct: "If you're not growing, you're going backwards."5
That growth philosophy faced immediate pressure between 2009 and 2011.
The falsification test: the record of the last soft market.
The company's historical performance during the previous soft market highlights the vulnerability of its dual-engine growth model. Total revenue stagnated for four consecutive years, moving from $959.7 million in 2007 to $977.6 million in 2008, $967.9 million in 2009, and $966.9 million in 2010.18 The firm did not surpass $1 billion in revenue until 2011, when it reached $1.006 billion.18
Earnings experienced a steeper decline. Net income peaked at $191.0 million in 2007, fell to $166.1 million in 2008 and $153.3 million in 2009, before rebounding slightly to $161.8 million in 2010—and required until 2013 to surpass its 2007 peak.18 Following a fourth-quarter earnings drop of nearly 30%, then-Chief Financial Officer Cory Walker summarized 2009 to analysts as "a year in hell."
Three converging headwinds produced this prolonged contraction: falling commercial property and casualty rates, a macroeconomic recession that reduced the business payrolls and revenues upon which premiums are calculated, and a frozen M&A environment in which acquired brokerage revenue fell to less than a quarter of the prior year's volume. This third factor underscores a critical vulnerability in the firm's model. Brown & Brown relies on two distinct growth drivers: organic volume and external acquisitions. In a soft pricing environment, organic expansion slows while agency owners resist selling at valuations tied to depressed earnings. Rather than providing strategic diversification, both growth drivers contract simultaneously.
Management responded by reducing corporate overhead, expanding the higher-margin Programs segment—where proprietary niche products were less susceptible to broad property rate declines—and continuing disciplined acquisitions at reduced valuations. This restructuring preserved operating margins and rebalanced the product portfolio. That crisis-management playbook established management's operational credibility, establishing a precedent directly relevant to the market conditions facing the company in 2026.
The golden run — and how much of it was rate
The subsequent decade marked a period of rapid expansion. Annual revenue grew from $1.006 billion in 2011 to $3.563 billion in 2022—representing a compound annual growth rate exceeding 12%, accompanied by steady margin expansion.18 Reflecting this sustained performance and more than three decades of consecutive annual dividend increases, Brown & Brown joined the S&P 500 in September 2021 and was added to the S&P 500 Dividend Aristocrats Index in February 2022.19
However, evaluating this decade requires separating operational execution from industry-wide tailwinds. Commercial property insurance rates surged from 2019 through 2023, driving organic growth higher across the entire brokerage sector, including peers such as Arthur J. Gallagher and Marsh McLennan. While decentralized sales execution and internal producer development contributed to revenue growth, escalating premium pricing provided a substantial tailwind throughout the late-stage expansion.
Going global, and the coastal property bet
Two major transactions at the end of this period significantly altered the firm's trajectory. In March 2022, Brown & Brown agreed to acquire Global Risk Partners, an independent UK intermediary serving nearly 500,000 policyholders with approximately $340 million in annual revenue, for £1.48 billion—equivalent to $1.96 billion at the prevailing exchange rate.2021 Built through acquisitions since 2013 by Peter Cullum, David Margrett, and Stephen Ross, Global Risk Partners provided Brown & Brown with an established European consolidation platform upon closing in July 2022. By 2025, international operations generated $843 million in revenue across 15 countries.4
That same year, the company acquired Orchid Underwriters and CrossCover Insurance Services, expanding its wholesale distribution presence in coastal catastrophe property coverage. Expanding into catastrophe property distribution at the peak of a historic hard market positioned the Specialty Distribution segment's earnings directly in the path of the subsequent commercial property rate softening in 2024 and 2025.
By the close of 2022, Brown & Brown operated with a $3.5 billion revenue base, an international platform in the United Kingdom, strong operating margins, and a three-decade record of acquiring and integrating small agencies. Its subsequent strategy, however, departed significantly from that historic formula.
VI. The Mega-Deal Pivot: Accession Risk Management Group (2024–2025)
Private equity firm Kelso & Company had owned Risk Strategies since 2013. Operating under the Accession Risk Management Group umbrella, the platform had acquired more than 190 agencies since 2014, expanding into the ninth-largest privately held insurance brokerage in the United States. In 2024, Accession placed over $15 billion in premiums across two operating divisions: Risk Strategies, a specialty retail broker, and One80 Intermediaries, a wholesale and program administration platform.1 Pro-forma adjusted revenue for 2024 reached approximately $1.7 billion, supported by a workforce of more than 5,000 employees.1
The target represented the exact profile Brown & Brown had avoided for three decades: a large, private-equity-assembled roll-up built on secondary acquisitions, sold through a competitive auction, and priced for national scale.
On June 10, 2025, Brown & Brown announced an agreement to acquire Accession for a gross purchase price of $9.825 billion on a cash-free, debt-free basis.1 Chief Executive Officer J. Powell Brown framed the transaction as "a unique opportunity to bring the best of both organizations to the forefront."1 Following the expiration of the Hart-Scott-Rodino waiting period, the acquisition closed on August 1, 2025.22
The multiple, and what it says
Evaluating the $9.825 billion purchase price against $1.7 billion in revenue yields an entry multiple of roughly 5.8 times revenue. Historically, Brown & Brown expanded by purchasing small tuck-in agencies at eight to ten times earnings—equivalent to two to three times revenue. By comparison, the Accession purchase required roughly double to triple the historical valuation paid per dollar of acquired revenue.
Management did not disclose an official transaction EBITDA multiple. However, on the second-quarter 2026 earnings call, Chief Financial Officer R. Andrew Watts noted that the acquired business "runs around a 35% margin in total." That margin implies approximately $595 million of earnings before interest, taxes, depreciation, amortization, and change in earn-out payables (EBITDAC) on $1.7 billion of revenue, indicating an estimated entry multiple near 16 times earnings.7 While this represents an analytical reconstruction rather than a reported metric, it highlights that the platform represented a significantly higher acquisition multiple per dollar of earnings than Brown & Brown’s historical purchases.
Higher valuations for specialty distribution assets—such as managing general underwriters with delegated underwriting authority, program administrators, and wholesale brokers—reflect industry-wide pricing trends. Peer platforms like Ryan Specialty command premium multiples because specialized distribution operations generate higher operating margins and defensible market positions relative to standard retail brokerages. In acquiring Accession, Brown & Brown purchased an established specialty platform rather than a localized book of business.
Yet acquiring a competitively marketed platform at prevailing market rates differs structurally from purchasing independent agencies at single-digit earnings multiples. Negotiated tuck-in transactions provided a structural acquisition edge; competitive auction purchases carry no such pricing advantage. For a consolidator whose historical compounding record relied on proprietary, low-multiple M&A, executing a large-scale auction purchase shifts the burden of proof to management execution.
The financing, and what it cost
The transaction required a significant restructuring of the company's capital base. On June 10, 2025, Brown & Brown priced an equity offering of 43,137,254 common shares at $102.00 per share, raising $4.315 billion net after underwriting discounts and offering expenses, which closed on June 12.2 On June 11, the company placed $4.2 billion in senior notes across six tranches: $400 million at 4.600% maturing in 2026, $500 million at 4.700% in 2028, $800 million at 4.900% in 2030, $500 million at 5.250% in 2032, $1.0 billion at 5.550% in 2035, and $1.0 billion at 6.250% in 2055.2 Additionally, Brown & Brown issued approximately $1.045 billion in common stock directly to selling shareholders based on a June 6, 2025 closing price of $110.57, with a portion placed in escrow.2
Total debt expanded from $3.824 billion at year-end 2024 to $7.613 billion at the end of 2025.2 As of June 30, 2026, total debt reached $8.007 billion against $918 million in cash, resulting in net debt of approximately $7.1 billion.23 Measured against full-year 2025 GAAP EBITDA, net leverage stood at approximately 3.4 times—nearing the debt covenant ceiling of 3.5 times and exceeding management’s target leverage range of zero to 2.5 times net debt to EBITDAC.2413 On an adjusted EBITDAC basis incorporating a full twelve months of Accession earnings, net leverage measured closer to 3.0 times. Nonetheless, borrowing costs rose substantially, with second-quarter 2026 interest expense doubling to approximately $100 million from $51 million in the prior-year period.7
Shareholders also absorbed substantial equity dilution. The June 2025 share placement occurred at $102.00 per share; by August 31, 2026, the stock trades near $72, representing a 29% decline for offering participants.3 Diluted weighted average shares expanded from 284 million in 2024 to 313 million in 2025 and 334 million in the second quarter of 2026.187 This share expansion created roughly 18% equity dilution over eighteen months to acquire approximately 30% in incremental revenue, during a period when organic revenue growth remained flat to negative.
Capital efficiency metrics reflected the expanded balance sheet. Return on invested capital declined from 9.1% in 2024 to 5.9% in 2025, while return on equity fell from 15.4% to 8.4%.12 As of June 30, 2026, goodwill and intangible assets comprised $19.7 billion of the firm's $29.9 billion in total assets—representing two-thirds of total assets and exceeding total stockholders' equity of $12.6 billion, resulting in negative tangible book value.23 High intangible asset balances are common among insurance brokerage consolidators, reflecting client relationship valuations. However, this capital structure leaves future equity returns heavily dependent on sustained cash generation from acquired assets, while elevating potential impairment risks if operating performance declines.
What the analysts pushed on
Analyst inquiries during recent quarterly conference calls focused on integration metrics, segment performance, and valuation adjustments. On the second-quarter 2026 earnings call, Mike Zaremski of BMO Capital Markets questioned Accession's revenue seasonality and margin progression; Watts clarified that July represents a major policy placement month, reporting that Accession generated $440 million to $445 million in revenue during the first quarter of 2026 and $410 million in the second quarter, aligning with projected seasonal trends.7 Gregory Peters of Raymond James addressed the divergence between management's positive outlook and soft Specialty Distribution metrics, highlighting increased pricing competition from managing general agents. Powell Brown acknowledged the competitive dynamics, stating, "you're correct in saying that it will continue to put pressure on our programs," while maintaining a projected 2% to 4% organic growth target for the segment in the second half of 2026.7 Andrew Andersen of Jefferies inquired about Form 10-Q disclosures indicating a reduction in earn-out liabilities driven by lower projected operating results. Watts responded that the change reflected refined closing purchase price allocations rather than operational decline, adding that the net nine-month adjustment remained small.7
Management's strategic rationale rests on One80's higher-margin proprietary programs and Risk Strategies' specialized commercial verticals, which present limited account overlap with existing retail offices. During the fourth-quarter 2025 earnings call, management established an integration timeline extending through year-end 2028, projecting annual EBITDA synergies of $30 million to $40 million for 2026—a range reaffirmed during the July 2026 call.177
Weighed against the $9.825 billion purchase price, annual cost synergies of $30 million to $40 million represent roughly 0.4% of total transaction value. Consequently, net cost reduction was not the primary justification for the acquisition; rather, transaction performance depends on whether the acquired platform can generate sustained organic revenue expansion.
VII. Business Model & Segment Deep Dive
The first thing to know about Brown & Brown's segments in 2026 is that the four-part structure the company reported for years no longer exists. In conjunction with the Accession close in the third quarter of 2025, Brown & Brown collapsed Programs and Wholesale Brokerage into a single Specialty Distribution segment and folded Risk Strategies into Retail, moving from three reportable segments to two, with prior periods restated.4
That reorganization is worth a moment of scepticism. Consolidating segments in the same quarter you close the largest acquisition in company history reduces the granularity available to outside investors precisely when they most need it to assess how the acquisition is performing. Management has also said it will not break out Accession's growth separately going forward — on the second-quarter 2026 call, Watts told JPMorgan's Pablo Singzon, "we won't be breaking out a growth for Accession versus the growth for Brown & Brown. We're one company."7 There is a legitimate operating logic for that: the businesses are being combined, and separating them becomes artificial. There is also a straightforward consequence: the outside world can no longer independently verify whether the $9.825 billion asset is growing.
Retail: the core engine, and where the pain is
Retail generated $3.386 billion of commissions and fees in 2025, or 58.7% of the total, up from $2.720 billion in 2024.4 It employed 14,531 people at year-end across locations in 44 states plus Bermuda, Canada, the Cayman Islands, India, the Netherlands, Ireland and the United Kingdom.4 It sells commercial property and casualty, employee benefits and personal lines, plus non-insurance warranty products through automobile and recreational vehicle dealer services.
Its revenue is diversified to an unusual degree: the largest single Retail customer accounted for 0.6% of segment commissions and fees in 2025.4 For an investor, that is genuinely valuable. There is no anchor client whose loss would be material, and no single industry concentration that a downturn could hollow out. This is what a business built from hundreds of local franchises looks like on a concentration screen, and it is a real, verifiable strength.
The weakness is growth. Retail delivered 1.1% organic growth in the fourth quarter of 2025, 1% in the first quarter of 2026 excluding contingents, and 1.5% in the second quarter of 2026 excluding contingents (2.5% including them).17257 Powell Brown's own assessment on the July call was direct: "While the organic growth for retail is improving, it's not where we want it to be yet."7 Margins, by contrast, were strong — Retail EBITDAC margin expanded 230 basis points year over year in the second quarter, helped by higher contingent commissions, expense discipline, roughly 110 basis points of one-time accrual benefits that management explicitly said would not recur, and 30 to 50 basis points from the salaries of departed producers not yet replaced.7
That last item deserves highlighting. Part of the margin expansion investors saw in the second quarter came from people leaving and not yet being replaced. Management flagged it honestly and said it would moderate as hiring catches up. It is a reminder that in a people business, short-run margin expansion and long-run revenue growth can point in opposite directions.
Specialty Distribution: high margin, high beta
Specialty Distribution produced $2.379 billion of commissions and fees in 2025 — 41.3% of the total — and employed 7,905 people.4 It contains three things now operating under new banners: the programs businesses under "Arrowhead Programs," the wholesale brokerage businesses under "Bridge Specialty Group," and the acquired One80 specialty businesses under "Arrowhead Specialty."4
The programs businesses are the most interesting and the least understood part of Brown & Brown. A managing general underwriter is a broker that has been handed a carrier's pen. The carrier delegates underwriting authority — the right to decide which risks to accept and at what price, within agreed parameters — to the MGU, which then builds a specialized book in a niche the carrier cannot efficiently reach on its own. Brown & Brown runs programs for dentists, lawyers, eyecare and title professionals, physicians, real estate agents, automotive aftermarket businesses, sports and entertainment, commercial trucking, forestry, manufactured housing, public entity risk pools, flood, earthquake, coastal wind and lender-placed property.4
The economics are superior to retail brokerage for a reason worth understanding. The MGU earns a commission for distribution plus profit-sharing overrides tied to how well the book performs for the carrier. It is, in effect, paid twice: once for finding the business and once for selecting it well. Specialty Distribution's EBITDAC margin was 42.7% in the second quarter of 2026 — down 400 basis points year over year, but still far above the corporate average.7
The delegated-authority model also produces the segment's two structural vulnerabilities. The first is concentration: the largest Specialty Distribution customer represented approximately 7.2% of segment commissions and fees in 2025.4 In a segment generating $2.4 billion, that is a meaningful single relationship — an order of magnitude more concentrated than Retail, and worth watching.
The second is that profit-sharing overrides are a leveraged bet on the carrier's loss experience, which means they are a bet on the weather. When storm activity is light, contingents are excellent; when a major hurricane makes landfall, they compress. Management has been transparent that the second quarter of 2026 benefited from "minimal storm claim activity," and that Specialty Distribution contingents are concentrated in catastrophe-exposed programs.7 Contingent commissions grew $40 million in the quarter, $24 million of it from Accession, and management has emphasized a new disclosure metric — organic growth including contingents — which flatters the reported number. The second quarter looked like negative 0.7% organic without contingents and positive 0.7% with them.267
Powell Brown made a fair point on the call: most competitors do not break contingents out separately, so including them is closer to an apples-to-apples comparison.7 He is right about comparability. But investors should note that the new metric appeared in 2026, the year the core number turned negative, and that Wolfe Research's Tracy Benguigui asked on the call for the company to recast more historical periods so analysts could see how the metric behaves through a full cycle — a request management did not commit to beyond the one prior year already restated.7 The disclosure change is defensible on the merits and convenient in its timing. Both things are true.
The organic picture in Specialty Distribution is the weaker of the two segments: negative 3.5% excluding contingents in the second quarter of 2026, negative 1.6% including them, with roughly 200 basis points attributed to about $10 million of new business revenue delayed into the third quarter.7 Even adjusting for that, the underlying trend is negative, driven by catastrophe property rates falling 15% to 35%. Management guides to 2% to 4% organic in the second half.
One further disclosure deserves attention. The Arrowhead Core Commercial program, which covered a broad range of industries, is in run-off, as is the private passenger automobile and motorcycle program.4 Programs get discontinued. That is normal — an MGU that never shuts anything down is not underwriting carefully — but it is a useful corrective to any framing of the programs business as a permanent, one-way compounding vector. Some niches stop working.
There is no longer a separate Services segment. The third-party administration, Medicare set-aside and claims businesses that once formed it now sit inside the two remaining segments. Fee revenue — which is what those businesses generate, and which is insulated from the pricing cycle because it is charged for work performed rather than as a percentage of premium — represented 22.2% of total commissions and fees in 2025, up from 21.1% in 2024.4 That mix shift is genuinely useful in a soft market, and it is one of the few places where the current numbers show the business becoming structurally less cyclical rather than more.
VIII. Capital Allocation, Management Credibility, & The Falsification Record
On August 10, 2026, Brown & Brown filed an 8-K disclosing that P. Barrett Brown — executive vice president, son of the chairman, brother of the chief executive — had resigned from all officer and director roles across the company and its affiliates.27 The filing used a term of art that carries real meaning in executive compensation: he resigned "for good reason," the contractual language for a departure triggered by a material diminution of duties.10
The context is in the 10-K. Barrett Brown joined the company in 2000, worked as an account executive and profit center leader in Tampa, Orange County and Phoenix, became a senior vice president in 2014, an executive vice president in January 2020, and served as president of the Retail segment from January 2020 until October 2025.4 In October 2025 — two months after the Accession close — that role went to Stephen Hearn, hired in February 2025 as chief operating officer, a British executive whose career runs through Ed Broking, BGC's Corant Global, and four years of senior roles at The Ardonagh Group.4 Hearn had served on Brown & Brown's own board from August 2024 until February 2025 before crossing over to management.4
Under the transition agreement, Barrett Brown remains employed through July 31, 2027, at his $1,000,000 base salary and up to $1,300,000 of performance bonus, with a $130,000 lump sum for professional transition services and $2,500,000 of severance payable in equal installments in August 2027 and August 2028, subject to a one-year non-compete and a release of claims.10 Any unpaid amounts accelerate on a change of control.10
Read plainly: the third generation of the founding family lost the operating job that runs 59% of the company's revenue to an external hire from a British consolidator, and then left. This is the sharpest available evidence on a question that runs through the whole investment case — whether Brown & Brown is a family business or a professionally managed public company. The answer as of 2026 appears to be that it is becoming the latter, and that the transition is not frictionless.
There are two readings, and honesty requires holding both. The charitable one is that the board and the CEO put the best available operator into the most important seat regardless of surname, which is exactly what shareholders should want from a controlled company, and which is genuinely rare. The uncharitable one is that a leadership change of this kind, at this moment — with Retail organic growth at 1%, a competitor having raided 275 of the segment's people, and a $9.8 billion integration underway — introduces execution risk into the exact business line that can least afford it. Both readings are supported by the record. Neither can be resolved yet.
Ownership and alignment
Hyatt Brown remains chairman and holds roughly 12.5% of the common stock beneficially, through a structure worth describing because it explains the durability of family control: the shares sit in Ormond Riverside, Limited Partnership, whose general partner is Swakopmund, Inc., which is wholly owned by the Swakopmund Trust of 2009, a revocable trust of which Hyatt Brown is sole trustee with sole voting and investment power.11 Powell Brown's beneficial ownership is around 1.9%, a figure that includes 1,954,590 shares held by a charitable lead annuity trust of which he is trustee and remainder beneficiary, and 32,241 shares held by children in his household as to which he disclaims beneficial ownership.11
Beyond the family, roughly 20% of the company is owned by teammates, with over 60% of U.S. employees participating in the Teammate Stock Purchase Plan.4 This is not decoration. It is the mechanism that makes the decentralized model work: profit center leaders who own stock behave differently from profit center leaders who don't. It is also, in 2026, a source of strain — employees who bought stock through 2024 and 2025 are underwater, at precisely the moment a competitor is offering them cash to leave.
The falsification record: testing the three load-bearing claims
Claim one: strict M&A valuation discipline with a fortress balance sheet.
The disconfirming evidence is the Accession transaction itself, and it is decisive. The company executed a deal at roughly 5.8 times revenue against a thirty-year history of two to three times, funded it with $4.2 billion of new debt and $4.3 billion of equity sold at $102.00, and pushed leverage above its own stated target range while the shares subsequently fell to the low seventies.12324 Return on invested capital fell by more than a third in a single year.12
The verdict: the claim of unchanging valuation discipline is rejected. It is not true that Brown & Brown only buys at eight to ten times earnings; it did so for thirty years and then stopped. A narrower claim survives — that management has historically been disciplined at small scale, and chose deliberately to pay a strategic premium once, for a category it could not build organically. That narrower claim is still testable. The falsification boundary is specific: net debt to EBITDAC must fall back inside the stated zero-to-2.5 times band, and consolidated adjusted EBITDAC margin must hold near the mid-thirties while Accession revenue grows. Management deployed $500 million on buybacks in the first half of 2026, repurchasing roughly 9 million shares over the trailing nine months, and has $400 million of notes maturing in December 2026 that Watts said the company will decide in the fourth quarter whether to repay or refinance.7 Watch whether debt reduction or buybacks wins that contest — the choice will reveal how seriously the leverage target binds.
Claim two: high switching costs make organic growth resilient across cycles.
The disconfirming evidence spans two separate regimes, which is what makes it powerful. In 2007–2010, revenue was flat for four consecutive years and net income did not regain its prior peak for six.18 In 2025–2026, organic revenue fell 2.8% in the fourth quarter and 0.7% in the second quarter of 2026 — while Gallagher posted 6% and Marsh McLennan 5% in that same second quarter, and Ryan Specialty 6.7%.678 Gallagher's brokerage-only organic of 5% came in below its own 5.5% full-year guide, so the whole industry is decelerating; but Brown & Brown is decelerating from a lower base and further.28
The verdict: the claim is rejected in its strong form and survives only in a much weaker one. Client retention is high and demonstrably real — the 0.6% largest-customer concentration in Retail and the low churn are genuine. But retention protects the relationship, not the revenue, because commission is a percentage of a premium the company does not set. Brown & Brown is a price-taker on the largest input to its own revenue line. The relevant forward test is not "does organic growth stay positive" but "does the gap to Gallagher and Marsh close." If Brown & Brown remains four to six points behind peers for another two or three quarters, the explanation stops being the property cycle — which all of them share — and starts being company-specific execution.
Claim three: decentralized autonomy produces flawless sales execution and loyalty.
The disconfirming evidence here is the freshest and the most damaging. In December 2025, roughly 275 teammates left for Howden US Services, a start-up American arm of the British broker Howden, taking customers representing about $23 million of known annual revenue.69 Around 40 came from the Minneapolis office alone, part of the Hays Companies business Brown & Brown acquired in 2018.29 Brown & Brown sued in Massachusetts Superior Court in late 2025, alleging a "predatory scheme," and separately in Minnesota, accusing sixteen former employees of breach of contract and alleging civil conspiracy and violations of Minnesota's trade secrets act.29
The litigation has gone the company's way so far. On May 12, 2026, Hennepin County District Court Judge Thomas Conley granted a temporary injunction, finding Brown & Brown had shown "irreparable harm, both past and present," barring the sixteen named individuals from soliciting customers, recruiting staff, or breaching confidentiality obligations.30 Notably, the order did not prevent them from servicing clients who had already moved.30 By that point Howden had captured roughly $31 million of annual revenue from Brown & Brown, including $10 million in the first quarter of 2026 alone.30 Howden's response was that it had treated the employees fairly and that Brown & Brown had "treated its former employees poorly" and "undercompensated them."30
The full-year revenue impact is now estimated at $50 million to $60 million, and the second-quarter adjustment alone was $18 million.7 Brown & Brown is not alone — Aon, Marsh and Willis Towers Watson have brought similar actions against Howden US since its August 2025 launch.3031 And Brown & Brown has been on this side of the table before, winning a $20 million settlement in 2017 from AssuredPartners and former employees in a comparable dispute.3233
The verdict: the claim of a culturally impregnable producer base is rejected. A company whose asset is people is, by construction, vulnerable to a well-capitalized competitor willing to lift teams — and the fact that competitor's own defense is that Brown & Brown "undercompensated them" is an allegation worth taking seriously rather than dismissing, because it goes to whether the company's famously tight expense discipline has a cost. On the January 2026 call, Powell Brown's framing was that the raid "galvanized the entire team" and that management tries "to see the positive."17 By July he was reporting that the company had rehired some but not all of the departed positions and intends to replace "most, if not all."7 That is a candid answer. It is also an admission that a year on, the hole is not filled.
The forward test is narrow and observable: whether the estimated impact stays inside the $50–60 million range management has now committed to publicly, and whether any comparable departures occur in the newly integrated Risk Strategies and One80 offices — where producers joined through a private-equity sale, may hold different retention economics, and are watching a stock that has fallen sharply since their deal closed.
On guidance discipline
One more credibility data point, because it is the kind that compounds. On the January 27, 2026 call, discussing the 2026 outlook for Retail, management said it anticipated "modest improvement over the 2.8% we delivered in 2025."17 Six months later, Retail had delivered 1% and 1.5% organic in the first two quarters, and the second-half guide was 1.5% to 2.5% — meaning full-year Retail organic will land well below 2025's 2.8%, not modestly above it.257 Management has explained the gap, attributing it to the start-up broker's raid, a pharmacy consulting revenue model change worth about 60 basis points, and incentive commission timing.7 Those explanations are specific and plausible. But the guide was given on January 27, three weeks after the December departures the company itself disclosed on that same call. The miss was foreseeable at the time the guidance was issued.
That is a real mark against guidance discipline in a company whose long-term record on it has been good. It is one instance, not a pattern, and it should be weighted accordingly. But it is the kind of thing that determines whether investors take the 2027 numbers at face value.
IX. 7 Powers & Porter's 5 Forces Analysis
Strategic frameworks are only useful when applied rigorously, particularly in categories where the findings reveal structural vulnerabilities. Evaluated against Hamilton Helmer’s 7 Powers framework, Brown & Brown’s business model exhibits a mix of distinct operational strengths and clear competitive limits.
Scale economies — moderate, not high. Brown & Brown negotiates carrier agreements centrally, securing higher commission tiers and larger contingent arrangements than a standalone local agency can command. However, this does not constitute a differentiated advantage. Peers such as Arthur J. Gallagher, Marsh McLennan, Aon, and private-equity-backed consolidators enjoy similar or greater scale; Marsh McLennan’s annual revenue, for example, is roughly four times that of Brown & Brown. Scale serves as a prerequisite for competing in the middle market rather than a source of excess returns relative to direct peers.
Switching costs — moderate, and narrower than usually claimed. A mid-sized commercial buyer changing brokers faces real friction: it must re-explain operations, transfer claims histories, rebuild professional relationships, and manage potential coverage gaps during transition. This friction supports high client retention. However, two factors constrain this power. First, high retention does not protect price per policy, as demonstrated by the organic revenue contraction in 2025 and 2026. Second, client switching costs largely attach to individual producers rather than to Brown & Brown itself. When roughly 275 producers departed for Howden US, $23 million in annual revenue left almost immediately, growing to $31 million within months.930 A switching cost that follows an employee out the door functions as an employee retention challenge rather than a corporate moat.
Counter-positioning — moderate, and eroding. Brown & Brown's decentralized branch structure historically allowed local offices to outmaneuver bureaucratic global brokers for middle-market accounts by combining local responsiveness with national carrier access. That advantage has eroded as competitors adopted similar positioning. Howden US was explicitly designed around this approach, while private-equity-backed consolidators such as HUB, USI, and NFP deploy substantial capital and aggressive compensation packages to capture similar accounts. Furthermore, Brown & Brown's own expansion has diluted this distinction: an enterprise employing 22,888 people while integrating a $9.8 billion acquisition can no longer convincingly frame itself as a nimble alternative.4
Process power — genuine, and the strongest of the seven. Brown & Brown University represents a substantial operational asset: a repeatable training system operating since 2004 that converts inexperienced recruits into producing brokers and integrates staff from acquired agencies.154 Built over two decades, this curriculum addresses a major industry constraint—the shortage of qualified sales talent. However, the producer departures of 2026 expose a structural limit: an internal training pipeline loses value if competitors can recruit trained producers in groups. The ongoing test for the company is whether its internal academy can develop new talent faster than rival firms extract established producers.
Cornered resource — low, representing the model's primary vulnerability. Key local producers—the firm's "horses"—are the closest asset to a cornered resource, but they remain employees bound by non-solicitation covenants whose legal enforceability, as the company notes in its disclosures, "varies based on applicable laws and factual circumstances."4 Enforcement varies significantly across jurisdictions, as seen in state court rulings in California and Minnesota. An asset that can resign and transfer client relationships does not constitute a cornered resource.
Network effects — low. The business exhibits minor two-sided dynamics: broader retail distribution increases the appeal of company programs to insurance carriers, while expanded carrier access enhances office capabilities for clients. However, these dynamics are weak, non-viral, and easily matched by competing consolidators.
Branding — low to moderate. Brown & Brown maintains a strong reputation among insurance carriers and within its regional markets. Middle-market commercial buyers, however, select brokers based on individual producer relationships and policy placement terms rather than corporate brand identity.
The overall assessment yields one strong power, three moderate powers, and three weak powers. This profile describes a high-performing business with a clear operational edge rather than an unassailable economic fortress.
Porter's Five Forces, applied to the same operational evidence:
Buyer power — low to moderate. Commercial insurance is legally or contractually required for most businesses, rendering baseline demand inelastic. Buyers cannot easily forgo coverage, but they can adjust overall expenditure. In a softening market, commercial clients often capture premium savings rather than expanding coverage levels—a dynamic Chief Executive Officer J. Powell Brown noted during recent investor calls.177 While buyer power over the broker remains limited, buyer sensitivity directly affects aggregate industry premium volume.
Supplier (carrier) power — moderate to high, and rising in specialty. Insurance carriers establish the premium rates that determine broker commission dollars, creating a fundamental structural dependency. Carriers also grant and can revoke the delegated underwriting authority that underpins the Specialty Distribution segment. While Brown & Brown's distribution volume provides bargaining leverage, market softening shifts power toward carriers. Furthermore, admitted carriers re-entering lines to compete with excess and surplus (E&S) programs—as Powell Brown detailed on the second-quarter 2026 call—increases supplier-side pressure on the firm's highest-margin segment.7
Threat of new entrants — low at scale, but elevated at the team level. Establishing a national brokerage from scratch requires extensive carrier appointments, state-by-state licensing, and decades of relationship building. However, the launch of Howden US demonstrated a lower-cost entry path: capitalizing a new platform and hiring intact producer teams to capture existing account books. Recruiting teams rather than purchasing entire agencies requires significantly less upfront capital, intensifying competitive pressure on established consolidators.
Threat of substitutes — low. Direct digital placement poses a recognized risk for personal lines and basic small-business policies, as Brown & Brown notes in its annual filing, but these products represent a minor fraction of company revenue.4 Complex commercial insurance programs have largely resisted direct digital substitution, maintaining the broker's intermediary role.
Competitive rivalry — high and intensifying. Arthur J. Gallagher, Ryan Specialty, and private-equity-backed consolidators compete directly for middle-market accounts and key sales talent. Producer recruitment remains fierce, with Powell Brown describing competition for talent as "very intense" across geographic markets.7 Industry rivalry represents the primary operational threat, with widespread litigation over producer non-solicitation covenants serving as its most visible symptom.31
X. Bear vs. Bull Case & Skeptical Investor Stress Test
The bull case, stated at its strongest
The core argument holds that equity markets are pricing a cyclical downturn as a permanent structural break. Brown & Brown trades at roughly 15 times forward earnings, representing a discount to both its historical valuation and its brokerage peer group.34 The driver behind this discount is a single headline metric—organic growth near zero—which remains heavily depressed by a commercial property pricing cycle that will eventually reverse. Catastrophe property rates falling 15% to 35% do not represent a permanent baseline; they mirror the rate hardening from 2019 through 2023. Powell Brown's observation that Southeast Florida rates have returned to 2017 levels cuts both ways.7 Premium rates that have surrendered nine years of gains face limited additional downside before insurance capital exits the market.
Beneath cyclical fluctuations, cash generation remains robust. The company generated nearly $1.5 billion from operations in 2025—a 24% year-over-year increase—and generated $610 million in the first half of 2026, up 13% over the prior-year period.47 Adjusted EBITDAC margins expanded 70 basis points to near 36% in 2025.4 Adjusted diluted earnings per share rose 10.9% in 2025 to $4.26, and grew another 3.9% in the second quarter of 2026 to $1.07, demonstrating resilience through severe property rate declines and producer departures.626 Furthermore, management repurchased $500 million of common stock in the first half of 2026 at valuations substantially below the June 2025 equity offering price—an allocation of capital that proves accretive if the underlying earnings base remains intact.7
The Accession acquisition added significant operational scale: One80's delegated-authority programs generate the highest operating margins across the organization, while Risk Strategies introduces commercial specialty verticals that would have required decades to construct organically. Fee-for-service revenue increased to 22.2% of total commissions and fees in 2025 from 21.1% in 2024, structurally dampening exposure to premium rate cycles.4 Finally, insider alignment remains strong, with the founding family holding roughly 12.5% of common stock and employees owning approximately 20%, ensuring key decision-makers absorb market drawdowns alongside public shareholders.114
The bear case, stated at its strongest
The central bear thesis asserts that soft market pricing is not merely a transient headwind, but a force exposing structural operational vulnerabilities.
Peer comparisons provide the most direct evidence challenging a purely cyclical explanation. Competitors Arthur J. Gallagher, Marsh McLennan, and Ryan Specialty operated under identical market conditions—including catastrophe property rate softening, admitted market competition, and casualty inflation. Yet in the second quarter of 2026, those peers posted organic growth of 6%, 5%, and 6.7%, respectively, while Brown & Brown contracted by 0.7%.87 A six-percentage-point performance gap against Gallagher cannot be attributed entirely to industry-wide pricing trends. While portfolio mix accounts for part of the divergence—given Brown & Brown's heavier concentration in coastal catastrophe property relative to Gallagher's retail book—that product mix resulted directly from deliberate acquisitions, including Orchid and CrossCover in 2022.
Second, elevated balance sheet leverage restricts the acquisition strategy that historically buffered performance during soft pricing cycles. During the 2009 slowdown, management offset flat organic growth by purchasing small agencies at discounted valuations. In 2026, with net debt near $7.1 billion, leverage above management's target band, and quarterly interest expense doubling to approximately $100 million, executing large-scale M&A is financially constrained.237 Management explicitly ranked capital allocation priorities as producer hiring, share repurchases, debt reduction, technology investment, and lastly, selective M&A.7 The firm completed six small tuck-in transactions in the second quarter of 2026, down from 43 acquisitions adding $1.8 billion in revenue during 2025.717 The historical acquisition engine has been curtailed by both balance sheet covenants and strategic necessity.
Third, integration complexity poses sustained operational risks. Management's integration schedule for Accession extends through year-end 2028.17 Integrating more than 5,500 employees from a private-equity-assembled platform coincides with a major corporate restructuring.4 Concurrently, the company collapsed its reportable segments, appointed an external hire to lead Retail following the resignation of a third-generation family executive, and managed the departure of 275 producers to a competitor. Concentrating these structural changes during the largest integration in company history elevates execution risk.
Fourth, accounting disclosures present heightened analytical opacity. Goodwill and intangible assets total two-thirds of assets and exceed stockholders' equity.23 The divergence between GAAP and adjusted earnings remains substantial—$3.16 versus $4.26 in diluted earnings per share for 2025, and $0.84 versus $1.07 for the second quarter of 2026—reflecting integration costs and earn-out adjustments.626 Form 10-Q filings disclosed a reduction in Accession earn-out liabilities "driven by lower projected operating results." While management stated the adjustment reflected purchase price accounting refinements rather than underlying operational decay, the item remains difficult for external investors to independently verify.7 Furthermore, collapsing reportable segments in the same quarter the Accession deal closed—combined with management's decision not to report standalone Accession growth—limits transparency into target performance.47 Concurrently, management introduced an organic growth metric incorporating contingent commissions during the same period organic growth excluding contingents turned negative.7 While these reporting shifts do not indicate improper accounting, they collectively reduce independent visibility into core operations at a pivotal transition point for the business.
Fifth, legal overhangs present ongoing uncertainty. Following the January 2026 earnings report and the concurrent disclosure of the producer departures, Brown & Brown's stock dropped $5.50 per share, or 6.91%, to close at $74.12.35 Law firms Pomerantz LLP and Portnoy Law Firm subsequently announced investigations into potential securities fraud compliance.3536 While attorney investigation announcements frequently follow single-day stock declines and do not constitute formal class-action complaints, the underlying inquiry focuses on whether executive statements regarding talent retention aligned with internal knowledge of team resignations.
The activist's memo
A skeptical investor evaluating Brown & Brown in August 2026 would summarize the core critique directly: Management issued 43 million shares at $102 to acquire a platform from private equity at 5.8 times revenue, pushing balance sheet leverage beyond internal targets. Fourteen months later, the stock trades 29% below the offering price, organic growth lags major peers by four to six percentage points, return on invested capital has dropped by over a third, a competitor extracted over $30 million in revenue by recruiting producers, a founding-family executive resigned for good reason, and segment reporting was consolidated. Meanwhile, management launched share buybacks while debt leverage remains above target.
Management's perspective across recent investor calls asserts that commercial property rate cycles drive the organic slowdown, integration milestones and synergy targets remain on schedule, producer departures represent a contained event, cash flow remains robust, and share repurchases represent an attractive deployment of capital. That response is strategically coherent, but its long-term validity depends on upcoming quarterly execution.
The two or three KPIs that actually settle this
Evaluating these opposing arguments relies on several key performance metrics regularly reported in financial filings.
One: Retail segment organic revenue growth excluding contingent commissions, compared against brokerage organic growth at Gallagher and Marsh McLennan in identical quarters. This metric isolates core operational performance by removing acquisition contributions and variable contingent commissions, while peer comparisons control for industry-wide pricing trends. If the organic growth gap narrows through 2027, evidence will favor the cyclical trough thesis. If the performance gap persists, the valuation discount reflects company-specific execution challenges.
Two: Net debt to adjusted EBITDAC relative to management's target range of zero to 2.5 times. Tracking leverage indicates whether management enforces capital discipline following its largest acquisition. It also determines when tuck-in M&A can resume at historical scale. The company's decision regarding its $400 million debt maturity in December 2026 serves as an initial indicator of capital allocation priorities.
Three: Adjusted EBITDAC margin excluding non-recurring items. Industry-leading operating margins have historically offset lower organic expansion. Sustaining margins near the mid-30% range during integration indicates a resilient underlying earnings base. Conversely, if margins contract as temporary accrual benefits expire and replacement hiring increases payroll expenses, historical margins may have depended on unsustainable expense controls.
XI. Epilogue & Lessons for Builders and Investors
What makes Brown & Brown unusual is not the roll-up model itself. Roll-ups are common in financial services, and many eventually decay—acquired businesses stagnate, founders exit after earn-outs vest, and the aggregate enterprise becomes a collection of declining assets sustained primarily by ongoing acquisitions. Brown & Brown avoided that pattern for three decades, yielding structural mechanisms worth examining.
Lesson one: culture is a compensation structure, not a poster
The core mechanism relied neither on complete centralization nor on unconstrained autonomy, but on a clear separation of the two. Local leaders retained front-office operational control: client relationships, agency branding, decision rights, and local profit-and-loss accountability. Corporate management assumed back-office functions that generate scale and carry operational risk: carrier contracting, accounting, treasury, and regulatory compliance. Furthermore, broad equity ownership—extending to approximately 20% of the workforce—aligned local managers with corporate performance without requiring an extensive management hierarchy.4 In this framework, corporate culture functions not as a decorative values statement, but as a system of compensation structures and decision rights.
Lesson two: build the talent pipeline before you need it
The second takeaway concerns talent as long-term infrastructure. Brown & Brown established Brown & Brown University to address an aging broker population and a shortage of qualified sales recruits.15 Internal training programs require significant upfront investment, incurring expenses on the income statement long before generating revenue. Many industry peers opted instead to recruit established producers from competitors. In 2026, as rivals launched aggressive recruitment efforts targeting middle-market talent, maintaining an internal training pipeline provided Brown & Brown with a structural countermeasure unavailable to pure acquirers of talent. While that pipeline has not fully insulated the firm from producer departures, it offers a repeatable mechanism for long-term talent replacement.
Lesson three: skill at one kind of deal is not skill at another
The third lesson applies directly to capital allocation and M&A evaluation. Demonstrated success in one transaction type does not guarantee equal execution in another. For decades, Brown & Brown excelled at purchasing small, local agencies generating $2 million to $15 million in revenue directly from retiring founders—a fragmented market characterized by proprietary negotiations and single-digit earnings multiples. By acquiring Accession Risk Management Group, the firm entered a competitive auction environment for a large, private-equity-backed platform priced at prevailing market multiples. Executing small tuck-in transactions at discounted valuations represents a fundamentally different capability than integrating a multi-billion-dollar platform acquired at market rates; a three-decade record in the former provides limited predictive value for the latter.
Lesson four: leverage costs choices, not just money
The fourth lesson highlights balance-sheet leverage as a strategic constraint. During the 2009 economic slowdown, an unlevered balance sheet allowed management to execute its soft-market playbook, acquiring underpriced agencies while organic growth stagnated. Funding the 2025 Accession transaction with $4.2 billion in senior notes doubled interest expense and curtailed the financial flexibility that had historically allowed the firm to exploit market downturns. Debt service imposes direct financial costs, but its greater strategic toll is the elimination of opportunistic capital allocation when market conditions favor acquirers.
Lesson five: separate the operator from the barometer
Finally, evaluating cyclical intermediaries requires distinguishing underlying operational performance from industry pricing trends. A frequent analytical mistake is attributing revenue expansion during hard market cycles solely to executive execution while blaming soft market downturns entirely on external pricing dynamics. Brown & Brown's strong compounding performance from 2011 through 2022 benefited substantially from rising commercial property rates, just as its slowing organic growth in 2025 and 2026 reflects softening catastrophe property pricing. Evaluating true operational capability requires measuring performance against direct peers operating within the same market environment during identical periods. That comparative performance gap reveals whether financial results reflect an enduring operational edge or a cyclical barometer.
XII. Recent News & What to Watch Next
Four primary factors will determine how Brown & Brown's transition unfolds over the coming year.
Accession integration, without the disclosure to verify it
With integration scheduled through 2028, management reaffirmed projected 2026 cost synergies of $30 million to $40 million.177 Accession contributed roughly $440 million to $445 million in revenue during the first quarter of 2026 and $410 million in the second quarter, remaining on track for its full-year target of $1.7 billion to $1.8 billion—a trajectory management maintained on its July call, noting that July represents a heavy policy placement month.7 Because Brown & Brown will not break out standalone Accession growth going forward, outside observers must evaluate integration success through broader proxies: consolidated organic growth, segment margins, and future earn-out adjustments. Producer retention across newly acquired offices remains the most critical operational risk—and the hardest to track from financial disclosures alone.
Deleveraging versus buybacks
Capital allocation presents a second key benchmark. The company generated $610 million in operating cash flow during the first half of 2026 while deploying $500 million into share repurchases.7 Free cash flow conversion stood at 17% of revenue for the first half, down from 20% in the prior-year period. Management attributed the decline to non-recurring Accession earn-out obligations and working-capital timing, while reaffirming its long-term conversion target of 24% to 27%.7 The upcoming decision on $400 million in senior notes maturing in December 2026 will clarify balance-sheet priorities: retiring the debt would confirm commitment to its net leverage target, whereas refinancing to sustain share repurchases would indicate greater tolerance for elevated debt.
The pricing cycle and the wind
Commercial pricing and catastrophe exposure represent a third variable. Absent a major storm event, management expects admitted market pricing to moderate slightly, excess casualty rates to climb, and catastrophe property rates to continue declining at first-half speeds.7 Because the third and fourth quarters traditionally generate lower catastrophe property volume, seasonal timing mutes both near-term pricing headwinds and potential recoveries. On the July 2026 earnings call, Chief Executive Officer J. Powell Brown observed that hurricane risks received minimal market discussion, noting that major storm landfalls in recent years occurred late in the season.7 A severe hurricane season would create opposing financial effects: depressing near-term contingent commissions while catalyzing premium rate increases for 2027. Meanwhile, the National Flood Insurance Program continues to operate under short-term congressional extensions, directly impacting the firm's write-your-own flood business; Brown noted during the call that he expects short-term extensions to persist.7
Artificial intelligence, and the honest version of it
Technological deployment represents a fourth area of strategic focus. In July 2026, Brown & Brown announced partnerships with Anthropic, McKinsey, and Accenture to integrate artificial intelligence across sales placement, underwriting submissions, and administrative functions, appointing Chief Technology Officer Dori Henderson to lead the initiative.7 Management stated that technology will augment rather than replace traditional brokers, emphasizing that implementation relies on reallocating existing operational budgets without adding dedicated capital expenditure, with primary financial benefits anticipated three to five years out.7
This implementation strategy combines pragmatic discipline with analytical uncertainty. On the positive side, Powell Brown declined to project immediate earnings expansion from automation, noting, "I don't believe anybody today fully understands the cost of tokens," and emphasizing that adoption rates depend on operational training rather than software deployment.7 Chief Financial Officer R. Andrew Watts highlighted the expansion of an internal "value management office" tasked with evaluating project returns and terminating unviable initiatives.7 This approach reflects measured capital management rather than promotional technology messaging.
At the same time, announcing technology partnerships during a period of organic growth deceleration represents a common corporate response, and agreements do not guarantee operational returns. Furthermore, structural automation presents long-term strategic trade-offs. If artificial intelligence significantly lowers placement costs, financial savings may accrue to carriers or policyholders rather than intermediaries, placing downward pressure on traditional commission rates. While Brown & Brown's annual filing notes that complex commercial brokerage remains resistant to direct digital placement—which primarily impacts single-line personal insurance and basic small-business policies—the long-term effect of generative tools on middle-market distribution remains an open structural question.4
And the succession question underneath it all
Underlying these operational dynamics is a broader governance transition. J. Hyatt Brown continues as chairman, and J. Powell Brown remains chief executive officer. However, following the departure of P. Barrett Brown, the Retail segment—which accounts for nearly 60% of total revenue—is now led by Stephen Hearn, an executive recruited from the British brokerage market.410 For eighty-seven years, Brown & Brown operated as a family-led enterprise with a public equity listing. As it evolves into a professionally managed consolidator generating $6 billion in annual revenue across sixteen countries, its governance structure is shifting. While this institutional framework may suit an enterprise of national scale, it represents a fundamental departure from the operating model that built its historical compounding record.
References
-
Brown & Brown, Inc. enters into agreement to acquire Accession Risk Management Group — Brown & Brown Investor Relations, 2025-06-10 ↩↩↩↩↩↩
-
Brown & Brown, Inc. 2025 Annual Report and Form 10-K — Long-Term Debt and Equity Offerings — Brown & Brown Investor Relations, 2026-03-24 ↩↩↩↩↩↩
-
Brown & Brown, Inc. (BRO) Stock Price, News, Quote & History — Yahoo Finance ↩↩↩
-
Brown & Brown, Inc. Annual Report on Form 10-K for the fiscal year ended December 31, 2025 — Brown & Brown Investor Relations, 2026-03-24 ↩↩↩↩↩↩↩↩↩↩↩↩↩↩↩↩↩↩↩↩↩↩↩↩↩↩↩↩↩↩↩↩↩↩↩↩↩↩↩↩
-
Brown & Brown, Inc. announces fourth quarter 2025 results — GlobeNewswire via The Globe and Mail, 2026-01-26 ↩↩↩↩↩
-
Brown & Brown, Inc. (BRO) Q2 2026 Earnings Call Transcript — Seeking Alpha, 2026-07-28 ↩↩↩↩↩↩↩↩↩↩↩↩↩↩↩↩↩↩↩↩↩↩↩↩↩↩↩↩↩↩↩↩↩↩↩↩↩↩↩↩↩↩↩↩↩↩↩↩↩↩↩↩
-
Q2 2026 Earnings Wrap-up: Public Brokers Continue to See Stable Growth — MarshBerry, 2026 ↩↩↩
-
Howden-Driven Talent War Has Cost Brown & Brown $23M in Revenue, CEO Says — Insurance Journal, 2026-01-28 ↩↩↩
-
Brown & Brown Executive Vice President Resigns, Signs Transition Pact — TipRanks, 2026-08-10 ↩↩↩↩↩
-
Brown & Brown, Inc. Definitive Proxy Statement (Form DEF 14A) — SEC EDGAR, 2025-03-19 ↩↩↩↩
-
Brown & Brown, Inc. SEC filings index (returns on capital derived from reported financial statements) — SEC EDGAR ↩↩↩
-
Brown & Brown presents 2026 investor presentation highlighting $5.9B revenue, $1.5B cash from ops and strong margins — TradingView News, 2026 ↩↩
-
Learning from J. Hyatt Brown's Brown & Brown — Investment Masters Class, 2024-11-02 ↩↩↩
-
Brown & Brown settlement with Florida: no charges, no guilt, no fines — Insurance Journal, 2006-12-25 ↩↩↩↩↩
-
Earnings call transcript: Brown & Brown Q4 2025 EPS beats, revenue misses — Investing.com, 2026-01-27 ↩↩↩↩↩↩↩↩↩
-
Brown & Brown, Inc. annual income statements, FY2004–FY2025, as filed with the SEC — SEC EDGAR ↩↩↩↩↩↩
-
Brown & Brown, Inc. added to S&P 500 Dividend Aristocrats Index — Brown & Brown Investor Relations ↩
-
Brown & Brown, Inc. Form 8-K, Exhibit 99.1 — Agreement to acquire Global Risk Partners Limited — SEC EDGAR, 2022-03-07 ↩
-
U.S. Broker Brown & Brown Agrees to Acquire UK's Global Risk Partners Ltd. — Insurance Journal, 2022-03-08 ↩
-
Brown & Brown completes acquisition of specialty MGU Accession Risk Management — Insurance Business, 2025-08 ↩
-
Brown & Brown, Inc. Quarterly Report on Form 10-Q for the quarter ended June 30, 2026 — SEC EDGAR, 2026-07-27 ↩↩↩↩
-
Brown & Brown, Inc. Form 8-K, Exhibit 99.1 — Accession transaction announcement materials — SEC EDGAR, 2025-06-10 ↩↩
-
Brown & Brown Q1 revenue jumps 35%, but organic growth flatlines — Insurance Business, 2026-04 ↩↩
-
Brown & Brown, Inc. announces second quarter 2026 results — GlobeNewswire, 2026-07-27 ↩↩↩
-
Brown & Brown, Inc. Current Report on Form 8-K — SEC EDGAR, 2026-08-10 ↩
-
Gallagher brokerage organic holds at 5%, below its 5.5% full-year guide — The Insurer, 2026-07-30 ↩
-
Minnesota insurance operation in legal firestorm over mass employee exodus — Star Tribune, 2026 ↩↩
-
Brown & Brown Wins Temporary Injunction Against Howden — Insurance Journal, 2026-05-12 ↩↩↩↩↩↩
-
The brokerage industry's litigation epidemic: When poaching becomes a business model — Insurance Business, 2026 ↩↩
-
Brown & Brown Gains $20 Million in Legal Settlement With Rival Broker AssuredPartners — AM Best, 2017-03-02 ↩
-
Brown & Brown, Inc. Settles Lawsuit Against Former Employees and AssuredPartners — Brown & Brown Investor Relations, 2017 ↩
-
BRO Stock Trading at a Discount to Industry at 15.04X: Time to Hold? — Zacks Investment Research, 2026-08-13 ↩
-
INVESTOR ALERT: Pomerantz Law Firm Investigates Claims On Behalf of Investors of Brown & Brown, Inc. — PR Newswire, 2026-02-26 ↩↩
-
Brown & Brown, Inc. Investigated by the Portnoy Law Firm — GlobeNewswire, 2026-04-02 ↩
 LinkedIn
 WhatsApp
 Reddit
 Hacker News
 Email
Email Kindle
 RSS Feed
 Spotify
 Apple Podcasts
 Amazon Music
 Audible
 YouTube