S&T Bancorp: The $10 Billion Question
I. The Quarter S&T Hit a Record
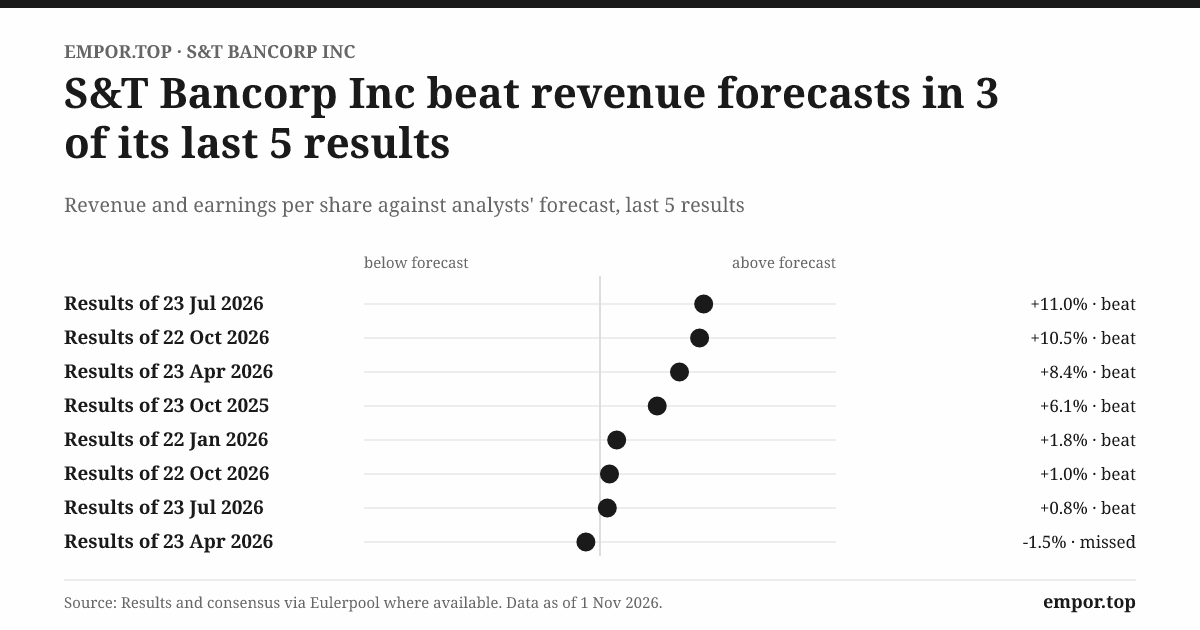
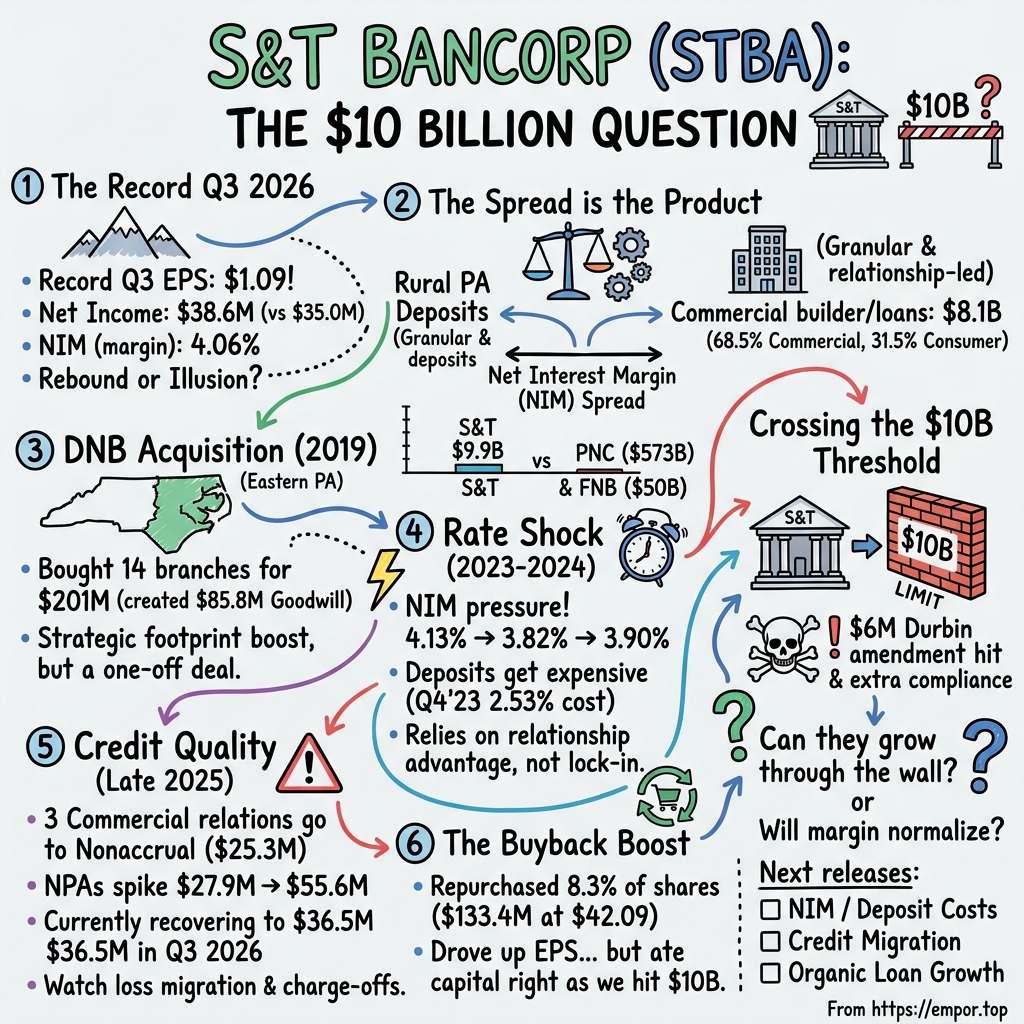
On the morning of October 22, 2026, S&T Bancorp told its shareholders something it had never said before. Diluted earnings per share for the third quarter had reached $1.09, a record for the company, up from 91 cents a year earlier.1 Chief executive Chris McComish summed the quarter up as "record earnings per share, record revenue and higher core profitability."1 For a bank headquartered in Indiana, Pennsylvania, a small college town in the hills northeast of Pittsburgh,2 it was the kind of headline that usually ends up framed in a lobby.
Read the same release a little more slowly, though, and a puzzle appears. Net income was $38.6 million, against $35.0 million in the third quarter of 2025.1 That is a rise of about 10%. Earnings per share rose about 20%. The gap between those two numbers is not an accounting quirk. It is the sound of a share count shrinking. Since the fourth quarter of 2025, S&T had bought back about 3.17 million of its own shares, roughly 8.3% of the stock outstanding, spending $133.4 million to do it.1 So roughly half of the record came from the bank earning more and roughly half came from the profit being divided among fewer owners.
There is a second puzzle, and it comes from the market-data services that track the stock. Their measure of S&T's revenue barely moved, up about 1% from a year earlier.1 A record quarter on flat revenue sounds like a contradiction, and in a manufacturing company it would be. In a bank it mostly means the yardstick is wrong. Data providers stitch together interest income, fee income and sometimes interest expense in ways that do not match how a lender actually makes money, and their quarterly series jump around for reasons that have little to do with the business. The figure that matters most for S&T, net interest income, the gap between what the bank earns on loans and securities and what it pays depositors and lenders, rose to $93.1 million from $89.2 million a year earlier, an increase of about 4%.1
And then there is the line that hangs over everything. On the day of its record, S&T reported total assets of about $9.89 billion.1 That is within a rounding error of $10 billion, which in American banking is not just a round number. It is a regulatory border. Cross it and a bank's debit-card fees are capped by federal rule, its supervision changes and its compliance bill rises. S&T's own credit-rating agency, KBRA, had estimated the hit to revenue from the fee cap alone at about $6 million a year.2 The bank had been approaching that border for years, and it still had not crossed it.
So the record quarter poses a real question rather than settling one. Is S&T's earnings rebound a lasting improvement in the bank, or a strong quarter amplified by a smaller share count? The answer splits into four smaller questions that run through the whole story. Can a community bank of this size turn a loyal local deposit base into durable returns when depositors can move their money with a few taps on a phone? Were the commercial loan problems that surfaced in late 2025 a contained episode or the first sign of a longer credit cycle? Does buying back stock at around one and a half times tangible book value create value for the owners who stay? And can the bank keep growing earnings through the $10 billion line, when the costs of being bigger arrive before any of the benefits?
It helps to be precise about what is being judged. S&T Bancorp is a bank holding company. Its principal operating business is S&T Bank, and alongside it sit a few small nonbank subsidiaries and a 50% interest in a credit life insurer called Commonwealth Trust Credit Life Insurance Company.3 There is no controlling shareholder, no parent conglomerate and no family block.3 The figures in this story are for the consolidated company, which for practical purposes means the bank. When S&T earns a dollar, it earns it by taking deposits in western and central Pennsylvania and lending them out to the businesses and households around those branches.
That also means this story has to use a bank's measuring tape. Free cash flow, the workhorse metric for an industrial company, is close to meaningless here, because a lender's cash-flow statement mixes its everyday earnings with the loans it makes and the deposits it gathers. A bank that lends aggressively can show weak operating cash flow in a great year, and a bank that shrinks can look like a cash machine while it is quietly retreating. EBITDA is no better, because interest expense is not a financing choice for a bank; it is the cost of its main raw material. The tools that matter are the ones bankers and bank supervisors use. Net interest margin, or NIM, measures the spread the bank earns on its earning assets. Fee income shows how much the bank earns without lending. The efficiency ratio measures how many cents of costs it takes to produce a dollar of revenue, lower being better. Credit costs reveal whether the loans were good. Capital ratios show how much loss the bank could absorb before its depositors would be at risk.
On those measures, the third quarter of 2026 was genuinely strong. The margin reached 4.06%, up from 3.93% a year before and 3.99% in the second quarter.1 The efficiency ratio improved to about 53%, meaning S&T spent roughly 53 cents to generate each dollar of revenue, down from about 55.5 cents a quarter earlier.1 Return on average assets was 1.55%, a level that most American community banks would be pleased with.1 These are operating improvements, not buyback effects, and they deserve to be taken seriously.
The verdict at the start, then, is a split one. The rebound has real operating support: profit and margin both rose, and the bank ran more efficiently. But the buyback did a lot of the heavy lifting in the headline figure, and the full-year record is less impressive than the quarter. Over the three years through 2025, S&T's net profit was essentially flat, shrinking by about 0.2% a year.3 The question for the rest of this story is whether the franchise beneath that flat line can keep growing earnings as new costs arrive. To answer it, the place to start is the product itself, which for a bank is not a loan or a deposit but the space between them.
 Subscribe on LinkedIn
II. A Local Bank's Spread Is the Product
Picture two customers walking into the same S&T branch on the same morning. One is the owner of a machine shop outside Greensburg who wants a line of credit to buy equipment for a new contract. The other is a retired teacher deciding whether to leave her savings in a money-market account at the bank where she has had a checking account for thirty years, or move it to an online bank advertising a higher rate. S&T stands on both sides of those two decisions at once. It will lend to the shop owner only if it can fund that loan cheaply, and it can fund it cheaply only if the teacher, and thousands like her, keep their money in the bank at rates below what the bank earns by lending it out.
That is the entire business model in a single scene. A bank gathers deposits, makes commercial and consumer loans, invests any excess in securities, collects interest and fees, and then pays the costs of running branches, paying staff and maintaining technology, and of absorbing the loans that go bad. S&T's revenue is driven chiefly by the yield on its loans and securities minus the cost of its deposits and other borrowings, plus fees from debit and credit cards, deposit service charges and wealth management.3 There are no subscriptions here, no contract renewals and no recurring-revenue disclosures. There is a spread, and the spread is the product.
The loan side of the balance sheet is mostly commercial. At the end of 2025, S&T had roughly $8.1 billion of loans, of which about 68.5% were commercial and 31.5% consumer.3 The commercial book is dominated by commercial real estate, followed by commercial and industrial loans, the bread-and-butter credit lines and term loans that finance a business's equipment, inventory and payroll, and then construction lending. On the consumer side, residential mortgages and home equity loans lead. This mix matters because it tells an investor what kind of risk S&T is taking. A bank that is two-thirds commercial is exposed to the fortunes of the regional economy, to office and retail property values and to the health of small and mid-sized businesses, rather than to a handful of large customers. S&T does not disclose its largest borrowers or how concentrated its loans or deposits are by customer.3 What it does disclose is the mix, the underwriting and the credit-quality data, which is where the story turns later.
The deposit side is where the bank's real economics hide. Deposits can be withdrawn on demand or repriced when the customer asks, while loans have contractual terms and, often, fixed rates for years.3 That mismatch is the oldest tension in banking. In calm times, it is the source of profit, because a bank can pay almost nothing on checking accounts while charging 6% on a commercial loan. In turbulent times, it is the source of danger, because depositors can demand more money faster than the loan book can reprice.
The best deposits are the ones that pay nothing at all. Noninterest-bearing deposits, mostly business and personal checking accounts, are money customers keep in the bank to pay bills and run operations, not to earn a return. At S&T, those accounts made up about 28% of total deposits in the third quarter of 2026, a share McComish had described a quarter earlier as "industry-leading."45 That claim deserves scrutiny, and the competitive question returns later, but the mechanism is easy to see. Every dollar of free checking money is a dollar of loan funding that costs the bank only the expense of servicing the account.
Over the years, the margin S&T earns on all this has moved around a good deal. For the full year 2023, the net interest margin was 4.13%. In 2024 it fell to 3.82%, and in 2025 it recovered only partly, to 3.90%.3 Those are big numbers in banking terms. Each tenth of a percentage point of margin on roughly $9 billion of earning assets is worth about $9 million of annual pretax income, which is a meaningful slice of a bank that earned about $134 million in 2025.3 The margin, in other words, is not one input among many. It is the main lever of S&T's earnings.
Fees are the second, smaller lever. In 2025, noninterest income totaled about $52 million, compared with about $49 million in 2024, and most of it came from card fees, deposit service charges and wealth management.3 The year-on-year increase was not a sign of a booming fee business. It came mainly from smaller securities losses, partly offset by the absence of a one-time $3.5 million gain on Visa shares that had flattered 2024.3 Set against a net interest income line several times its size, fees are a useful diversifier and little more. KBRA put noninterest income at about 14% of operating revenue and called it "slightly below-peer."2 That small fee share has a direct consequence for the $10 billion story, because the debit-card interchange fees that the Durbin cap will reduce are part of this already modest pool.
Because loans are the bank's receivables, the quality of those receivables is measured in a bank's own vocabulary. Debtor days, the standard tool for judging whether an industrial company's customers pay on time, are meaningless here. Instead, the questions are how many borrowers are late, how many loans have been placed on nonaccrual (the bank has stopped booking interest because it doubts it will be paid), how much has been charged off as lost, and how large the reserve for future losses is compared with the loan book. Those four measures are the bank's equivalent of an accounts-receivable aging report, and S&T's late-2025 credit episode shows why they matter.
What about the business lines? S&T reports one segment, community banking.3 Wealth management, insurance and other services exist, but none is reported as a separate material growth engine, and the filings do not suggest one is waiting to emerge. This is a single-engine company. Its fortunes rise and fall with spread, credit and cost.
This also explains why the industrial-style figures that data services publish for S&T deserve a raised eyebrow. A provider might show S&T's "free cash flow" at about $129 million for 2025 and a "free cash flow yield" near 8%.3 But in 2025 S&T's operating cash flow of about $134 million sat alongside a $360 million net increase in loans running through its investing cash flows.3 Cash that the bank lends out to the machine-shop owner is not cash available to shareholders. The provider's "enterprise value" of under $1 billion is similarly odd, because it subtracts the bank's cash, which is largely depositors' money, from the market value of its equity. These measures can be rough signals, but treating them as a bank's version of owner earnings would be like judging a grocery store by the value of the milk in its fridge.
Seen through the right lens, S&T is a straightforward machine: a regional bank of about $10 billion, two-thirds commercial lending, funded by a deposit base with an unusually high share of free checking money, earning a margin of around 4% and supplementing it with a below-average fee stream. The machine is simple. Its history is not, because the footprint S&T operates today was redrawn by a single deal in 2019.
III. Fourteen Branches Bought S&T a New Map
On June 5, 2019, S&T announced that it would merge with DNB Financial Corporation, the parent of DNB First, a bank headquartered in Downingtown, Pennsylvania, in the suburbs west of Philadelphia.6 DNB was nearly 160 years old and operated 14 locations.6 S&T's chief executive at the time, Todd Brice, described it as a merger with an institution "which shares the values, culture and commitment to high quality customer service found at S&T Bank."6 DNB's chief executive, William Hieb, returned the compliment, calling S&T "a high performing company, as evidenced by its superior earnings and consistently high dividend payments."6
For a bank whose roots lay in the hills and small towns of western and central Pennsylvania, the deal was a geographical leap. DNB's 14 full-service branches sat in southeastern Pennsylvania, in Chester County and the surrounding suburbs, among the wealthiest and fastest-growing parts of the state.7 The combined bank would have about $8.4 billion of assets.6 S&T was buying not just loans and deposits but a foothold on the other side of the commonwealth.
The terms were all stock. DNB shareholders would receive 1.22 S&T shares for every DNB share they owned.6 Based on S&T's closing price the day before the announcement, that valued DNB at about $206 million, or $47.28 per share.6 The price moved with S&T's stock, as all-stock prices do; by mid-August, when S&T's share price had slipped, the implied value had fallen to about $43.59 per DNB share.7 When the deal closed in November 2019, S&T recorded a purchase price of about $201 million and $85.8 million of goodwill, the accounting label for the amount paid above the fair value of the assets acquired.8 Former DNB shareholders ended up owning about 13% of the combined company.7
Was it a good price? The headline premium was about 23% over DNB's unaffected closing price, which is typical for a community bank deal of that era rather than extravagant. A more telling yardstick is what S&T paid against DNB's tangible book value, the equity left after stripping out intangible assets. DNB's tangible book value was about $23.63 per share in mid-2019, so the announced price was roughly twice tangible book, and about 19 times DNB's 2018 earnings per share of $2.48.7 Paying twice tangible book in stock is not free. S&T's own tangible book value was about $19.68 per share at the time, and its shares were trading at well above that, so the buyer was using a currency the market valued richly to buy a franchise at a premium.7 That kind of trade only creates value if the acquired franchise earns well above its cost of capital, or if cost savings and deposit growth compensate.
The public financial case S&T offered at announcement was short. The bank said it expected the merger to be accretive to earnings per share in 2020, and the release gave no headline cost-savings target or tangible-book earnback figure.6 Investors were asked to trust the strategic logic, which was straightforward: an established bank in a richer market, a larger presence in Eastern Pennsylvania, and a deal sized so that S&T's existing shareholders kept about 87% of the combined company.7
What happened next makes a clean verdict impossible. The integration and systems conversion followed the November close, and 2019's results carried merger costs. S&T's earnings per share fell from $3.02 in 2018 to $2.48 in 2019.8 Then 2020 arrived. On top of the pandemic shock came a blow entirely of S&T's own making: in May 2020 the bank discovered that a business customer had run a check-kiting scheme through its accounts, bouncing checks between banks to create the illusion of money that did not exist, and S&T recognized a loss of $58.7 million in the second quarter, swinging that quarter to a net loss of $33.1 million.9 For the full year, earnings per share fell to 54 cents.3 Whatever the DNB branches were contributing in their first full year was buried beneath far larger forces. The 2020 dividend payout ratio of about 205% of earnings is the most vivid scar of that year: S&T kept paying its dividend while profit collapsed.3
The deeper issue is that the DNB deal makes S&T's long-run growth rates look better than its organic record. Over the ten years through 2025, net profit grew about 7.2% a year and the provider's revenue measure about 8.4% a year.3 Total assets rose from about $7.3 billion at the end of 2018 to about $8.8 billion a year later, a jump that came largely from DNB.3 Strip the acquisition out and the organic growth is slower; then layer on the CEO change in 2021, and the decade's figures stop being a clean measure of what one management team built. KBRA itself notes that executive leadership changes began in 2021.2 The decade-wide compound growth rate is a fact about S&T's history, not a forecast of what the current team will produce.
What can be said fairly is narrower. DNB was a consequential footprint expansion that gave S&T scale and a presence in the Philadelphia suburbs. It was not proof of a repeatable acquisition machine, because S&T has not done another transformational deal since. The bank's management has repeatedly said it is open to acquisitions in its "core and contiguous markets," mainly Pennsylvania and Ohio, as McComish put it on a January 2024 call.10 By mid-2026 the tone had a sharper edge: "there are a number of deals that we've chosen not to move forward with," McComish told analysts.5 On the October 2026 call, asked again about M&A, he said S&T's "posture has not changed at all," and that a deal would need "the right structure, with the right partner, at the right time," citing price, timing, cultural fit and even the upcoming election as obstacles.4
That restraint can be read two ways. A disciplined management team that refuses to overpay for banks in a frothy market deserves credit. A management team that talks about acquisitions every quarter but never completes one is also telling investors something, namely that its organic growth plan has to carry the load. Either way, the record shows that the next major deployment of S&T's capital after DNB was not another acquisition. It was the 2025–26 share repurchase, a decision that returns in the capital-allocation chapter.
The DNB question, then, comes down to whether those 14 branches have kept their deposits, kept their credit clean and earned a return on the roughly $200 million S&T paid for them. S&T does not report results for the legacy DNB franchise separately, so the answer can only be inferred from the bank as a whole. And the bank as a whole was about to face the most severe test of any deposit franchise in a generation: the moment when depositors everywhere learned that their money could earn 5% somewhere else.
IV. The Rate Shock Exposed the Deposit Franchise
In the spring of 2023, the American banking industry had a collective panic attack. Several large regional banks failed in quick succession, and depositors across the country, many of whom had never thought about the safety of their checking account, suddenly asked two questions at once. Is my money safe here? And why am I earning almost nothing on it when Treasury bills were paying 5%? The first question drove the headlines. The second, quieter question did more lasting damage to bank earnings, because it applied to every bank, including the well-run ones.
S&T was never in danger in the way the failed banks were. Its balance sheet was built on local deposits rather than on a few large, nervous corporate clients, and it held capital well above the regulatory minimums. But it could not escape the second question. Through 2023, its deposit bill rose quarter after quarter, and in the final quarter of the year the climb was steep. The cost of S&T's interest-bearing deposits jumped 49 basis points in a single quarter, from 2.04% to 2.53%.11 A basis point is a hundredth of a percentage point, so that is roughly half a percentage point added to the cost of billions of dollars of funding in three months. The net interest margin fell to 3.92% in that quarter, down from 4.09% in the third quarter.11
The irony is that 2023 was, by the headline numbers, S&T's best year. Net income was a record $144.8 million, or $3.74 a share, and the full-year margin was 4.13%.11 The record came because loan yields had reset upward with interest rates through 2022 and early 2023, while deposit costs lagged behind. By the fourth quarter, the lag was closing. The full-year number was a rear-view mirror; the fourth-quarter number was the windshield.
On the January 2024 earnings call, chief financial officer Mark Kochvar walked analysts through the damage with a banker's precision. The cost of all deposits, including the free checking accounts, had risen 38 basis points in the quarter to 1.76%, which brought the "cycle-to-date beta" to 31%.10 Beta is the share of the Federal Reserve's rate increases that a bank has passed on to its depositors. A beta of 31% meant that for every percentage point the Fed had raised rates, S&T's overall deposit cost had risen by about a third of a point, which is a respectable result for a bank but not immunity. Kochvar noted that about 10 of those 38 basis points came from a deliberate choice, replacing about $200 million of wholesale borrowings with brokered deposits at roughly the same cost, but the rest reflected customers who "continue to seek higher rates, but the pace has moderated."10 He also warned of "a higher-than-normal amount of repricing CDs" in the first quarter of 2024 and guided to a margin bottoming "in the 3.70% range by mid-year."10
That guidance turned out to be close to the mark. The full-year 2024 margin came in at 3.82%, down about three tenths of a point from 2023, and net income fell to about $131 million.3 For a bank whose earnings move about $9 million for every tenth of a point of margin, that decline accounts for most of the drop in profit from the 2023 record.
There was a positive counterpoint in Kochvar's January 2024 remarks. He pointed out that free checking balances were "just under 30%" of S&T's deposits, compared with about 24% at the end of the previous rate upcycle in 2019.10 In other words, after a year of the most aggressive rate increases in four decades, S&T had more noninterest-bearing money as a share of deposits than it had at the end of the gentler 2015–2018 cycle. That is real evidence of a sticky operating-account franchise. Businesses that run their payroll and payments through an S&T checking account do not move it lightly, because the account is wired into their daily operations.
What the episode disproves is the stronger claim that a local relationship-based bank is insulated from repricing. S&T was not. Its customers moved money into higher-yielding certificates of deposit and money-market accounts, and the bank had to pay up to keep them. The deposit franchise worked as a shock absorber, not a wall.
Then came the recovery, and it is worth being careful about where it came from. The margin improved to 3.90% for 2025 and climbed through 2026, to 3.99% in the second quarter and 4.06% in the third.31 But look at the deposit side. The cost of S&T's interest-bearing deposits in the third quarter of 2026 was 2.46%, down from 2.74% a year earlier but only a hair below the 2.53% of late 2023.111 Funding has become somewhat cheaper since its peak, but it has not returned to the cheap money of the pre-2022 era. On the October 2026 call, McComish attributed the latest quarter's margin expansion to "higher loan yields and an improved funding mix."4 Kochvar added that the yield on earning assets rose 9 basis points in the quarter while the cost of funds rose only 1.4
That decomposition is the key to judging the recovery. A large part of the margin's improvement has come from the asset side, as older fixed-rate loans and securities mature and are replaced at today's higher rates. Kochvar described securities cash flows of roughly $100 million to $150 million a year and about $100 million of personal loans that will reset in 2027 with a pickup of "100 or more basis-point range."4 That repricing is a genuine tailwind, but it is a finite one. Once the old low-yielding assets have rolled off, the margin depends again on the competitive price of new loans and new deposits.
Management's own outlook acknowledges that tension. In July 2026, Kochvar guided to "relative net interest margin stability around the current high 390s level" for several quarters, and warned of "some uptick potentially after Q3 in deposit costs," because S&T's certificates of deposit remained "highly concentrated in that six-month timeframe."5 David Antolik, S&T's president, noted rising competition for CDs and money-market balances, "particularly from smaller banks."5 By October, the outlook had firmed: Kochvar expected the margin to "stay north of 4% into 2027," and to strengthen "if rates continue to move higher," adding that "how much depends on the level of price competition on both loans and deposits."4 That is a candid caveat. The bank is telling investors that the margin is a function of the rate environment and of rivals' pricing, which is another way of saying that it is not entirely in S&T's control.
The bank did make one funding choice that deserves credit. It ran down its brokered deposits, the wholesale money that banks buy through intermediaries when local funding is short, by more than $180 million during 2026 and had none left on the balance sheet by the third quarter.4 Brokered money is expensive and flighty, so replacing it with local customer deposits improves both the cost and the quality of funding. It also slowed balance-sheet growth, a detail that becomes important at the $10 billion line.
As noted, the cash-flow statement says little about a bank's earnings for its owners. In 2024, S&T's operating cash flow of about $173 million exceeded its net income of $131 million because of noncash items and timing, while in 2025 the two figures were nearly identical, at about $134 million each.3 Those figures say little about deposit franchise health, as noted.
The verdict on the rate shock is two-sided. S&T's deposit base held up well relative to the industry: free checking money stayed high, the deposit beta was moderate and the bank never needed emergency funding. But the episode rejects any claim that the franchise insulates S&T from repricing. The margin fell by about three tenths of a point in a single year, and the recovery since has leaned on assets repricing upward as much as on deposits becoming cheaper. Whether S&T's deposit relationships amount to a durable competitive advantage, and not just a decent hand in a favorable cycle, is a question about competition, and it starts with a single depositor deciding where to keep her money.
V. S&T's Moat Is a Deposit Relationship, Not a Lock-In
Consider a depositor in one of S&T's rural markets, a woman who runs a small insurance agency in a county seat in central Pennsylvania. Her business checking account has been at S&T for years. Her loan officer knows her by name and approved her line of credit without making her fill out a form she did not understand. But her phone shows her an online bank offering a high-yield savings rate well above what S&T pays, and one of the giant national banks has a branch two blocks away with a slicker app. She could move her money in an afternoon. Most years, she does not. S&T's competitive advantage lives in the space between "could" and "does."
That space is real but narrow, and the competitive forces pressing on it come from every direction. Depositors can move funds more easily than ever. Borrowers can shop loans, and a strong commercial borrower will get competing term sheets from several banks. Larger banks can spread the cost of technology, cybersecurity and compliance over far bigger balance sheets. Fintech lenders and online banks need no branches at all.
Start with the scale gap. S&T had about $9.9 billion in assets at the end of 2025.3 F.N.B. Corporation, headquartered in Pittsburgh and competing across much of S&T's western Pennsylvania territory, had about $50.2 billion.12 PNC Financial Services, also based in Pittsburgh and one of the largest banks in the country, had about $573.6 billion.13 Those figures do not mean F.N.B. has five times S&T's market share in any given county, because their footprints only partly overlap, but they do mean that F.N.B. can spend five times as much on technology, and PNC nearly 60 times as much, while charging each dollar of assets the same share. Closer to home, First Commonwealth Financial, a bank S&T itself uses as a compensation peer and which is based in the same small town of Indiana, Pennsylvania, competes for the same customers branch by branch.14 Local community banks and credit unions round out the field.
Against that field, what can S&T actually defend? KBRA's August 2026 rating review offers the best independent evidence. It found that core deposits supplied about 90% of S&T's funding in the second quarter of 2026, that noninterest-bearing accounts made up 27% of deposits, and that the bank's overall cost of funding was 1.82%.2 Those low-cost deposits, combined with a "loaned-up" balance sheet in which loans made up about 87% of average earning assets, had in KBRA's words "consistently supported an above-peer NIM."2 The agency also put S&T's return on assets at roughly 15 to 50 basis points above peer averages since 2022.2 KBRA described S&T's legacy franchise as spanning "less rate sensitive rural markets across parts of PA."2
That last phrase is the moat argument in miniature. In rural and small-town Pennsylvania, there are fewer banks competing for each depositor, fewer of those depositors shop rates aggressively, and relationships run deep. A bank that has served the same county for generations has information about its borrowers that a national lender lacks, and it has customers who value local decisions and continuity. These are the classic advantages of a community bank, and they show up in S&T's numbers.
Now stress-test the claim against S&T's own history. The rate shock showed that these rural depositors are not rate-blind. A true lock-in would have shown far less repricing. S&T also does not disclose the measures that would prove a powerful moat. It publishes no customer retention rates, no deposit concentration figures and no deposit market share by county.3 Without them, the claim that S&T's relationships are unusually durable rests on aggregate outcomes, a high free-checking share and an above-peer margin, rather than on direct evidence of customer behavior. Those aggregate outcomes are meaningful, but they could also partly reflect the less competitive markets S&T happens to operate in rather than anything S&T does better than a rival would in the same market.
Fees add a further caution. KBRA flagged S&T's fee income as slightly below peers.2 Fee income is often the clearest sign of a deep customer relationship, because treasury management, wealth management and card services tie a customer more tightly to a bank than a simple deposit account does. S&T's management says it is building those capabilities. Asked about treasury management on the October 2026 call, Antolik said that "activity continues to be steady in that space," with the bank's focus on payments capabilities.4 That is an aspiration, not yet evidence of a stronger moat.
Technology is the other place where the moat could widen or erode. S&T spent about $19.8 million on data processing and information technology in 2025, plus about $13.5 million on furniture, equipment and software, and employed about 1,209 full-time equivalent staff.3 Those are maintenance-level investments for a bank of this size, not the spending of a company building a technology edge. In 2026, the bank upgraded its online banking platform in the third quarter and planned a mobile upgrade in the fourth, which Antolik framed as part of being "committed to investing in our deposit franchise."4 S&T has disclosed no artificial-intelligence product, no quantified digital advantage and no figures on digital adoption, so technology is best seen as a cost of staying competitive rather than a separate growth story. The risk runs the other way: the bigger banks' larger technology budgets could slowly make S&T's offering feel dated to younger customers, eroding the deposit base one account at a time.
So what is the defensible claim? S&T has a relationship-led regional franchise with a real, measurable funding advantage: a high share of free deposits, low funding costs and a margin above its peers. That advantage is relative, not absolute. It survives as long as the bank keeps earning its customers' loyalty through service and reasonable rates, and it erodes whenever rates rise fast enough to make loyalty expensive. It is a moat in the way a slight hill is a defense: useful, but not a castle wall. And like every bank's moat, it is only as valuable as the loans it funds, which is where S&T's late-2025 credit problems enter the story.
VI. Three Commercial Relationships Changed the Credit Story
In the final weeks of 2025, three of S&T's commercial borrowers crossed a line that every banker dreads. Their loans, totaling $25.3 million together, were placed on nonaccrual status.3 For one of the three, the bank set aside a specific reserve of $1.6 million against expected losses.3 S&T does not name the borrowers or describe their industries in detail, so outsiders can only see the outline of the problem: three commercial relationships, a few tens of millions of dollars, and a doubling of the bank's problem loans in a single year.
That doubling is the hero number of this chapter. Nonaccrual loans rose to $55.6 million at the end of 2025, or 0.69% of total loans, from $27.9 million, or 0.36%, a year earlier.3 In the context of a loan book of about $8 billion, those are still small numbers. A bank with less than 1% of its loans in nonaccrual is not in crisis. But direction matters in credit, because problem loans rarely arrive alone, and a doubling in a year is the kind of trend investors watch closely.
The puzzle deepens when the allowance enters the picture. The allowance for credit losses is a bank's estimate of the losses it expects over the life of its loans. It is not cash set aside in a vault for specific problem loans; it is an accounting reserve, built through provisions that reduce earnings, and it reflects management's judgment about the economy, the loan mix and each borrower's prospects. At the end of 2025, S&T's allowance was $93.2 million, or 1.15% of loans, down from $101.5 million, or 1.31%, a year earlier.3 So while problem loans doubled, the reserve shrank. In 2024, the allowance covered nonaccrual loans more than three and a half times over; by the end of 2025, it covered them about 1.7 times.
There are legitimate reasons a reserve can fall while problem loans rise. A bank may have charged off losses it had previously reserved for, so the money leaves the reserve and the loan book at the same time. Its economic forecasts may have improved. Its loan mix may have shifted toward lower-risk categories. And collateral on the new nonaccrual loans may be strong enough that the bank expects little loss. S&T charged off a net $14.5 million in 2025, or 0.18% of average loans, which explains part of the decline.3 But because the allowance depends so heavily on judgment, the bank's auditor, EY, singled it out as a critical audit matter, the auditing profession's formal flag for the areas of the accounts where estimates are most subjective and hardest to verify.3 That flag is common for banks and is not an accusation. It is a reminder that the reserve figure is a forecast, and forecasts can be wrong.
S&T's own history offers a sobering reminder of how fast a credit picture can change. The 2020 check-kiting fraud was a sudden discovery rather than a gradual deterioration.9 It was a fraud rather than a conventional credit loss, and the bank has since strengthened its risk management; KBRA attributes part of that effort to the leadership changes that began in 2021.2 But the episode shows that the worst losses in S&T's recent history did not come with years of warning signs.
The good news arrived through 2026. By the second quarter, nonperforming assets had fallen by $9.7 million in a single quarter to $40.2 million, or 0.50% of loans plus foreclosed real estate.5 By the third quarter they had fallen again, to $36.5 million, or 0.45%.1 KBRA noted that criticized and classified loans, the bank's internal watch list of weaker credits, had fallen to 3.0% of total loans in the second quarter of 2026 from 5.8% in the first quarter of 2023.2 Net charge-offs have stayed below 0.2% of loans every year since 2022, a record that compares well with most regional banks.2
But the latest quarter also carried a warning. Net charge-offs rose to $2.1 million in the third quarter of 2026, from $1.0 million in the second.1 At an annualized 0.10% of loans, that is still low. What makes it worth watching is the combination: falling nonperforming assets alongside rising charge-offs can mean problem loans are being resolved through losses rather than recoveries. In the best case, the bank is cleaning up and moving on. In the less benign case, some of the drop in problem loans is just the losses finally being recognized.
The October 2026 call added texture. Antolik explained that S&T's commercial and industrial loan balances fell by about $50 million in the quarter, partly because of lower usage of credit lines, partly because of lower originations, and partly because of "the decision to exit several credits due to credit deterioration."4 He also disclosed that criticized and classified assets had risen by about 7% in the quarter, though "classified loans remained stable" and the increase was concentrated in the milder "criticized" category.4 That is an honest disclosure, and it bounds the good news. The watch list rose even as the nonperforming list shrank.
The bank's commercial real estate book carries a quieter version of the same tension. Asked about loan growth, Antolik described how rising capitalization rates, the yields investors demand on property, were lowering appraisals, and said S&T had "chosen to require the additional capital from our borrowers to make them fit."4 Requiring borrowers to put in more equity is prudent underwriting. It also tells investors that property values in S&T's markets are under pressure, which is precisely the condition in which commercial real estate loans can migrate to problem status.
There is no hidden legal overhang behind any of this. S&T's management stated that no pending or threatened proceedings were material to its financial condition, and its 2025 filing reported no material litigation accrual and no material weakness in internal controls.3 The credit risk is the ordinary kind that matters most for a bank: regional borrowers, commercial property and business conditions in Pennsylvania and Ohio.
The verdict is cautiously encouraging. The decline in nonperforming assets is real and has come two quarters running, but the rise in charge-offs, the exits of deteriorating commercial credits and the uptick in criticized loans mean the late-2025 problems are not yet a closed chapter. The test lies in what happens to those three commercial relationships, whether they are resolved through recoveries or losses, and whether the allowance needs to rise again. In the meantime, management made a large bet that the bank had capital to spare, and placed it on its own stock.
VII. The Buyback Made the Per-Share Story More Complicated
The timing is what makes this chapter interesting. In the same fourth quarter of 2025 in which three commercial relationships slid onto nonaccrual, S&T began buying back its own stock in size. By the end of the second quarter of 2026, it had completed that repurchase at an average price of about $42.09.15 In the second quarter alone it bought about 1.1 million shares at an average of $44.24.5 Then, in July 2026, the board authorized a fresh $100 million program to replace the old one.15 And in the third quarter, with that new authorization in hand, S&T bought nothing at all.1
To understand that sequence, it helps to meet the people making the decision. Chris McComish arrived as chief executive in late August 2021, after a search triggered by the retirement of Todd Brice, who had announced in October 2020 that he would step down at the end of March 2021.1617 In the interim, David Antolik, the bank's long-serving chief lending officer and president, ran S&T as interim chief executive from April to August 2021.14 McComish was an outsider to S&T and to small-town Pennsylvania banking. He had spent more than two decades in regional and line-of-business leadership roles at Wachovia, then led personal banking and later served as chief operating officer of personal and commercial banking at BMO Harris, ran Scottrade Bank as president and CEO, and was senior executive vice president of consumer banking at TCF Bank before joining S&T.14 His résumé is a consumer and retail banker's résumé, built in big institutions, and his emphasis since arriving on deposits, operating accounts and the customer experience reflects it. In 2025 he also became chair of the board, after Christine Toretti, who had held the role, resigned to become U.S. ambassador to Sweden; the board responded by creating a lead independent director role, filled by Jeffrey Grube.14
Beside him sit two S&T veterans. Mark Kochvar has been chief financial officer since 2010, which means he has managed the bank's balance sheet through three rate cycles, the DNB integration and the fraud of 2020.14 Antolik has spent nearly two decades in senior management at S&T.14 It is a team that blends an outside chief executive with inside institutional memory, and the capital-allocation record should be read as the product of all three.
That record has shifted in tone. In January 2024, when S&T launched a $50 million repurchase program, Kochvar described buybacks as "really our third choice," behind funding organic growth and other uses, and suggested they were best used in moments of market dislocation.10 Less than two years later, S&T was executing one of the largest buybacks in its history. The bank's capital position explains part of the change. Its common equity tier 1 ratio, the core measure of loss-absorbing capital, was 14.75% in the third quarter of 2025, far above the regulatory definition of well capitalized, and KBRA estimated that S&T's capital was running 120 to 200 basis points above its rated peers.12 With loan growth slow, that capital was earning nothing for shareholders. Returning it was a defensible choice.
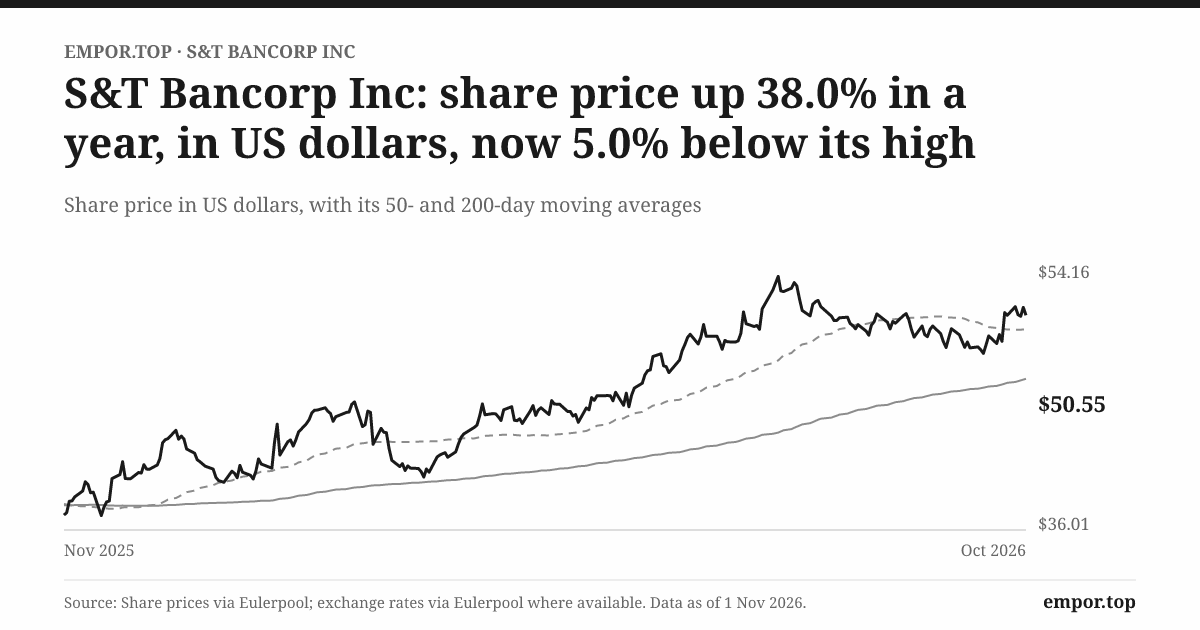
The price was also defensible, at least at the start. S&T's shares traded near $37 at their 52-week low, and the average purchase price of about $42 was roughly 1.45 times the bank's tangible book value per share, which stood near $29.1 Buying shares at a premium to tangible book reduces tangible book per share for the remaining owners slightly, but it raises earnings per share, and with a return on tangible common equity of about 15%, the bank was effectively buying back its own earnings at an earnings yield of about 9%.1 For a bank with excess capital, that is a reasonable trade. Tangible book value per share still rose over the year, from $28.69 to $29.28, because retained earnings more than offset the premium paid.1 The capital ratio, however, fell: CET1 dropped to 14.02% in the third quarter of 2026 from 14.75% a year before.1
Then the stock rose, and management changed its stance. On the July 2026 call, Kochvar told analysts that "with the stock price moving higher, the calculus does change," and said the bank would look at "stepping that back somewhat."5 By the third quarter, S&T bought no shares. On the October call, Kochvar said the bank was "evaluating a resumption of activity here in the fourth quarter," with "an eye towards at least maintaining current capital levels."4 With the stock now around $50, roughly 1.7 times tangible book, the same earnings yield calculation looks less attractive, and the stated discipline appears to be working as intended.1
A skeptic would still ask a pointed question. Why authorize another $100 million for buybacks while also guiding to loan growth and facing open credit questions? The two goals compete for the same capital. Management's answer, offered in pieces across calls, is that capital is plentiful, that it will hold capital ratios at least at current levels, and that the bank will not "take on additional risk from an asset growth standpoint," as McComish put it in July.5 That is a coherent framework. But S&T has never published an explicit return threshold for repurchases or a target CET1 ratio, so investors are asked to trust judgment rather than a rule. Kochvar described the framework in July 2026 as starting with "the regulatory definitions," then adding a cushion and stress testing.5
Incentives are the next layer of the question. In 2025, McComish's total compensation was about $2.4 million, made up of salary of roughly $806,000, stock awards of about $889,000, an annual cash incentive of about $620,000 and other benefits.14 The annual incentive is driven 60% by earnings per share, 20% by pre-provision net revenue relative to average assets and 20% by asset quality, measured as nonperforming assets relative to loans.14 In 2025, the bank's measure of EPS came in at $3.49 against a $3.20 target, and pre-provision profitability beat its goal, but asset quality, at 0.69%, missed the plan's threshold, so that piece paid nothing.14 The total payout came to 119% of target.14 The plan worked the way it should on credit: the late-2025 problem loans cost the executives part of their bonus. But the 60% weight on EPS deserves an investor's attention, because buybacks raise EPS mechanically. A plan that rewards EPS growth without adjusting for share count can reward a buyback even when it does not create value.
The long-term plan is better aligned. Half of the chief executive's long-term award is in performance-based shares that vest based on S&T's return on average equity relative to the S&P 600 bank index over three years, with a modifier of up to 30% up or down for relative total shareholder return.14 Shares granted in 2022 vested in 2025 at 172% of target, because S&T's return on equity ranked in the 66th percentile and its shareholder return in the 81st.14 Return on equity, unlike EPS, does not get a free lift from buybacks; if anything, reducing equity raises it only if earnings hold up.
Then there is ownership. McComish personally owned 8,107 shares at the start of 2026, under 1% of the company, with a further 65,167 deferred awards outstanding.14 S&T's guidelines require the chief executive to hold stock worth five times his salary, and he has until April 2029 to meet that target, which he had not yet met at the end of 2025.14 All directors and executive officers together held about 1.3% of the company.14 The large holders are passive institutions. BlackRock reported about 15%, Dimensional about 6.5% in the filings cited in the 2026 proxy, and Vanguard Portfolio Management reported about 6.7% as of March 31, 2026.1418 There is no controlling shareholder, which means management answers to a dispersed base of index funds and institutions whose votes have so far been supportive. At the May 2026 annual meeting, shareholders approved executive pay with about 25.9 million votes for and about 368,000 against.19 That near-unanimity is less a ringing endorsement than a sign of how little friction there is in S&T's governance. Insider alignment through ownership is modest, so results and incentive design have to do the work.
The dividend sits quietly beside all this. S&T raised its quarterly dividend to 37 cents in 2026, up from 34 cents a year earlier, giving a yield of about 2.9% at current prices.1 Over the twelve years through 2025, S&T paid out a median of about 37% of its earnings in dividends, with 39% in 2025 and the 205% outlier of 2020.3 The dividend is steady, and the company kept paying it through the fraud and the pandemic, but it is a return of capital, not a growth engine.
The buyback verdict is that it materially supported EPS growth and was executed at sensible prices, but the decision to authorize $100 million more, then pause, leaves the real test of capital discipline ahead. If S&T resumes buying at higher prices without a clearer return rule, the skeptics will have a point. If it holds back and lets capital fund growth, management will have shown that its discipline is not just rhetoric. Either way, the per-share story now depends on the bigger question that sits at the center of S&T's next chapter: whether the bank can grow through the $10 billion line.
VIII. Analysis & Bear vs. Bull Case
On August 28, 2026, KBRA affirmed S&T's ratings, BBB+ for the holding company's senior unsecured debt and A- for the bank's deposits, with a stable outlook.2 It was a vote of confidence, but the rationale carried a pointed warning. Management expected to cross the $10 billion asset threshold "in the near term," KBRA wrote, and with it would come an "anticipated ~$6 million annual revenue impact from the Durbin Amendment."2
The Durbin Amendment is a provision of the 2010 Dodd-Frank financial reform law that caps the interchange fees large banks can charge merchants when customers pay with a debit card. Banks with less than $10 billion in assets are exempt. Cross the line and the fee per transaction drops sharply. For S&T, that means losing about $6 million a year, which is roughly 3.6% of its 2025 pretax profit, or after tax roughly 13 to 14 cents a share, about 3% of its trailing earnings per share.23 Larger banks also face more intensive supervision, higher deposit insurance assessments in some cases and higher compliance costs. None of these is a cliff, but together they form a tollbooth.
S&T's management has been approaching that tollbooth for a long time. In January 2024, McComish said the crossing "could be, you know, within 2024, but certainly by the end of 2025," and estimated the Durbin impact at $6 million to $7 million.10 In July 2026, Kochvar said that S&T's "trajectory should take us over $10 billion in the second half" of 2026.5 By October 2026, with loans flat, Kochvar said, "given the slower loan growth this quarter, we do not expect to cross the $10 billion threshold before year end," which "would delay the Durbin impact to mid 2028 at the earliest."4 The repeated slippage is not a scandal, and it partly reflects deliberate choices, such as running off brokered deposits. But it is a pattern. The bank has guided for nearly three years to growth that has not quite arrived, and the delay in crossing the threshold is the visible consequence. That is the central tension of S&T's investment case: management says it can grow through the line, while the record shows a bank that keeps not quite reaching it.
The bull case starts with the operating evidence. The record quarter was not solely financial engineering. Net income rose about 10% year on year, the margin widened to 4.06% and the efficiency ratio improved to about 53%.1 Return on average assets of 1.55% and return on tangible equity of about 15% put S&T in the upper tier of community banks.1 KBRA's assessment supports the franchise: a granular deposit base, an above-peer margin, capital well above peers and charge-offs below 0.2% of loans every year since 2022.2 Management has guided to 2027 expense growth of about 3%, a manageable pace.4 If loans grow at even a modest rate, the margin holds above 4% and credit costs stay low, S&T could absorb the Durbin hit and still grow earnings. And with capital well above peers, the bank has the cushion to absorb a credit surprise or fund a deal.
The bear case starts with the same headline numbers and reads them differently. Earnings per share rose about 20% in the third quarter, but net income rose only about 10%; the buyback accounts for roughly half of the gain.1 Over the three years through 2025, net profit was flat.3 The decade's healthier growth rate includes the DNB acquisition and spans two management teams. The margin compression of 2023–24 showed that deposit costs can catch up with loan yields quickly, and the margin's recovery since has leaned on old assets repricing higher, a tailwind that fades as the back book turns over. Loan growth has repeatedly fallen short of guidance; in the third quarter, loans were flat and commercial and industrial balances fell. Nonaccrual loans doubled in 2025, and while problem loans have since fallen, charge-offs rose in the latest quarter and the watch list grew. And the stock already trades at a premium to its own history.
Put the case through Michael Porter's five forces and the shape of the industry comes into focus. Rivalry is intense: F.N.B., PNC, First Commonwealth, local community banks and credit unions all compete for the same depositors and borrowers, and on the October call management described holding loan spreads at the cost of slower growth.4 The bargaining power of buyers, here the depositors and borrowers, is moderate and rising. Depositors are fragmented, which limits any single customer's leverage, but the rate shock showed that collectively they can force a bank to pay up, and strong commercial borrowers shop their loans. The threat of substitutes is real: online banks for deposits, private credit and fintech lenders for loans, and payment apps for the transactions that once tied customers to a checking account. The threat of new entrants is low, because bank charters, capital requirements and regulation make it hard to start a bank, but digital banks can enter without branches. Suppliers, in banking, are mostly the providers of funding, which is to say depositors again, plus core technology vendors, whose consolidation gives them pricing power over small banks. Overall, the five forces describe a competitive, commodity-like industry in which a regional bank can earn decent returns only by having lower funding costs or better credit judgment than its rivals.
Hamilton Helmer's seven powers framework asks which of seven durable sources of advantage a company possesses: scale economies, network economies, counter-positioning, switching costs, branding, cornered resources or process power. S&T has very little of most of them. Scale economies favor its larger rivals, not S&T, because technology and compliance costs are spread over bigger balance sheets. Network economies are minimal in community banking. Counter-positioning does not apply. Branding exists locally, but it is not the kind of brand that lets a bank charge higher prices or pay lower rates for long. Cornered resources are absent. Process power, embedded organizational know-how that is hard to copy, could show up in underwriting, but S&T's record of a doubling in nonaccruals and a fraud loss in 2020 does not prove superior credit process. The one power S&T has in meaningful measure is switching costs. Moving a business's operating accounts, payroll and payments to another bank is genuinely disruptive, and the high share of noninterest-bearing deposits is the evidence. The moat, in other words, is a single power, held in moderate strength, and it works best in rural markets where alternatives are fewer. That is a credible advantage, but not a proven durable moat; it would be confirmed by deposit costs that stay below peers through the next rate cycle, and falsified by a sharp drop in the noninterest-bearing share.
A skeptical investor would push hardest on capital. Why authorize another $100 million for buybacks while guiding to mid-single-digit loan growth that keeps not arriving, and while credit remains under observation? What return threshold governs the choice? Management's answer has been that capital is abundant and it will maintain ratios at least at current levels. The activist's follow-up would be to ask whether, if the bank cannot grow loans, it should return more capital faster or pursue an acquisition, and whether an EPS-heavy annual bonus plan tilts management toward the buyback. Those are fair questions, not charges, and the answers will appear in the next few quarters of capital decisions.
Three numbers will tell whether the bull or the bear is right. The first is the margin and the deposit cost behind it: 4.06% and 2.46% for interest-bearing deposits in the third quarter, with the margin rising and the deposit cost roughly flat.1 The second is credit, tracked through nonaccrual loans, charge-offs and reserve coverage: nonperforming assets at 0.45% of loans and falling, charge-offs at an annualized 0.10% and rising, and the allowance flat at 1.16%.1 The third is per-share capital, tangible book value per share and CET1 alongside the share count and organic loan growth: tangible book at $29.28 and rising slowly, CET1 at 14.02% and down from a year earlier, loans flat in the latest quarter.1
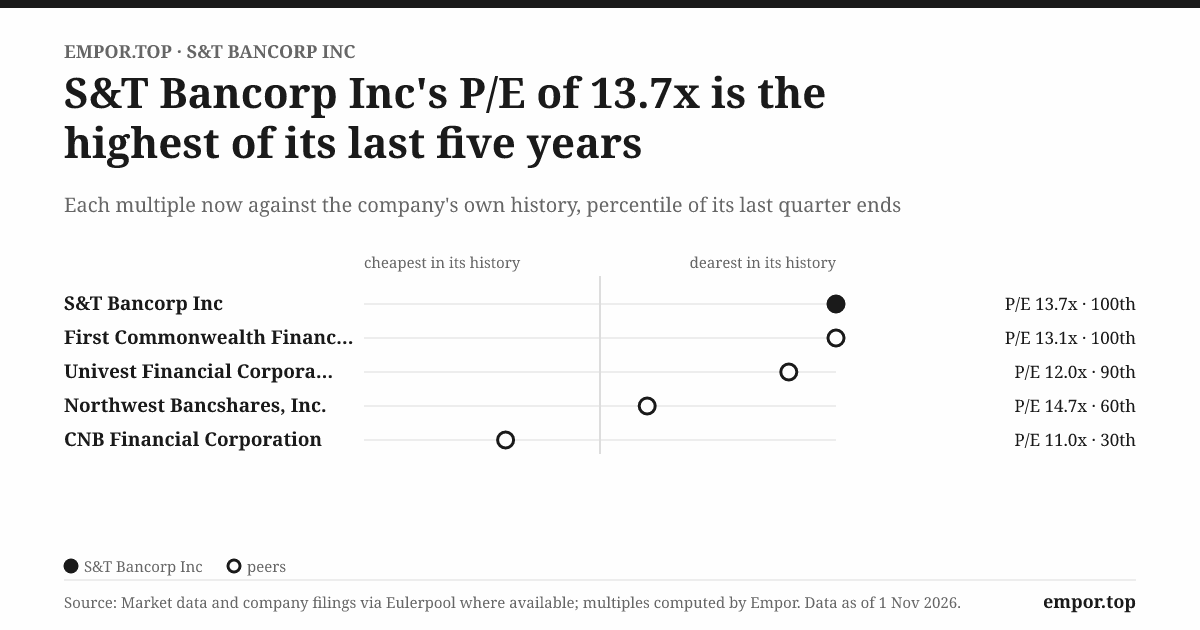
Valuation frames the stakes, without settling them. At a share price of about $50.55, S&T trades at about 13.7 times trailing earnings, against its own five-year median of about 10.5 times, and at about 1.3 times book value.3 The market, in other words, is already paying for some of the improvement. Peer comparisons from other data services show S&T and regional peers such as First Horizon, Wintrust and Fulton Financial all clustered around 11 to 12 times earnings, but those figures use a different snapshot and earnings basis and do not reconcile with the 13.7 times figure, so they are best read as context rather than a direct comparison.20 What the premium to S&T's own history appears to assume is that the recent margin and efficiency gains last, that credit stays clean and that the bank eventually grows through the threshold. If any of those three assumptions falters, the multiple has room to fall back toward its history. The lessons of S&T's story, though, reach beyond the next quarter.
IX. The S&T Lessons
Every bank balance sheet tells two stories at once. On one side, a depositor can reprice or leave at any moment. On the other, a loan can quietly deteriorate long after it was made. S&T's history over the past seven years is a case study in how those two stories interact, and it offers lessons that belong to this bank in particular.
The first lesson comes from the 2023 rate shock, when deposit costs rose and S&T's margin began to shrink despite its comparatively strong deposit base. Its customers still moved money into higher-rate accounts. A low-cost deposit is an advantage only until the customer sees a better rate. The lesson for investors is that a community bank's funding advantage is not a static asset. It is a relationship that has to be earned again every time the Federal Reserve moves, and the best measure of it is not the share of free deposits in calm times, but how fast the bank's deposit costs rise in turbulent ones.
The second lesson comes from the three commercial relationships that moved onto nonaccrual in late 2025, just as S&T began a large buyback. Despite its strong record and an improving watch list, problem loans doubled. A loan's risk often becomes visible after the growth story has moved on. For founders and investors in any lending business, the implication is that credit quality is a lagging indicator. The best years for loan growth are often the years when the seeds of future problems are sown, and the evidence of whether underwriting was sound arrives years later, often when attention has moved elsewhere.
The third lesson comes from S&T's two major capital deployments of recent history: the DNB acquisition and the buyback. Both decisions can be defended. Neither can be proven brilliant or foolish yet, because their value depends on what the acquired franchise and the remaining shares earn over many years. Capital allocation is a sequence of prices paid, not a slogan about discipline. The lesson for investors is to judge management by the prices it pays and the returns those purchases earn, not by the word "disciplined" in its prepared remarks.
The fourth lesson comes from the margin recovery after its 2024 decline. It is tempting to read that recovery as proof of a durable operating edge. But it leaned heavily on older assets repricing higher, and deposit costs have barely eased from their 2023 peak. A favorable rate cycle can look like skill. The evidence so far supports the first explanation more clearly than the second. The lesson for anyone analyzing a bank is to separate the parts of a margin that come from the cycle from the parts that come from the franchise, and to wait for a full cycle before deciding which is which.
These lessons point to a bank whose apparent stability has always been more conditional than it looks. Deposits are relationships that must be continually earned. Credit quality is recognized with a lag. And buybacks compound value only when the underlying bank can keep earning attractive returns. The coming quarters will test all three.
X. Epilogue
Tonight, S&T Bancorp stands about $110 million of assets short of the most consequential line in its recent history. Its margin is above 4%, its credit metrics are improving on some measures and worsening on others, and its shareholders own about 8% more of the bank per share than they did a year ago. The next quarterly release, which S&T has in recent years published in late January, will show where the bank ended 2026.11 Management has already said it does not expect that report to show assets above $10 billion.4
The first thing to watch is whether earnings keep growing with a stable share count. The third quarter's record came with no buybacks during the quarter, but the shares bought earlier still amplified the per-share gain. If S&T resumes repurchases in the fourth quarter, as Kochvar said it was evaluating, per-share growth will again be partly financial.4 The cleaner test is net income growth itself, and whether it continues once the year-on-year comparisons no longer include a shrinking share count. A bank that grows net income steadily without buying back stock is a bank whose franchise is genuinely improving.
The second is the fate of the commercial credits. The three relationships that moved to nonaccrual in late 2025 will be resolved one way or another, through recoveries, restructurings or charge-offs, and the specific reserves set aside for them will tell whether management's estimates were right. The exits of deteriorating commercial and industrial credits and the uptick in criticized loans in the third quarter will either fade or become the next set of problem loans.4 If nonaccruals keep falling and charge-offs stay near their recent levels, the credit episode of late 2025 will look contained. If charge-offs keep rising, the earlier improvement will look premature.
The third is the threshold itself. S&T will eventually cross $10 billion, if it grows at all, and when it does, the disclosures that follow will reveal how much debit-card revenue it loses, how much compliance and technology expense it adds and whether its return on assets holds up afterward. Management has said that it is "not going to take on additional risk from an asset growth standpoint" to get there.5 The test of that promise will be whether growth, when it comes, comes from sound lending rather than from reaching for yield.
The fourth is loan growth. In July 2026, Antolik guided to "annualized mid-single-digit loan growth for the balance of 2026."5 By October, the guidance for the fourth quarter had softened to "flat to low single-digit loan growth," with commercial and industrial pipelines showing no significant growth.4 The next guidance will reveal whether S&T's new commercial bankers are starting to produce; the company says many were hired with non-solicitation agreements that restrict how quickly they can bring over old clients.4 Growth delayed is not growth denied, but this bank has guided to growth that took longer than expected before.
Each outcome would shape the answer to the central question. If S&T crosses the threshold with its margin above 4%, credit clean and earnings growing without help from the share count, the record quarter will look like the beginning of something durable. If the margin slips, credit costs rise or the bank never quite reaches the line, the record will look like the peak of a favorable cycle, amplified by a buyback. The tension tonight is that both stories fit the same facts.
XI. Outro
On October 22, 2026, S&T Bancorp reported a record quarter just below the $10 billion line that has shaped its strategy for years.1 It is strong enough to set records and not yet big enough to face the costs that come with being bigger.
S&T is not a simple regional bank recovery story. Its challenge is to turn a modest funding advantage into lasting per-share value against much larger rivals. A smaller share count can make each share claim more of the bank. But only a healthy bank can make that claim worth more. The record quarter is a promising clue. The next credit and deposit cycle will decide whether it was the answer.
References
-
S&T Bancorp, Inc. Announces Third Quarter 2026 Results — S&T Bancorp, 2026-10-22 ↩↩↩↩↩↩↩↩↩↩↩↩↩↩↩↩↩↩↩↩↩↩↩↩↩↩↩↩↩
-
KBRA Affirms Ratings for S&T Bancorp, Inc. — KBRA, 2026-08-28 ↩↩↩↩↩↩↩↩↩↩↩↩↩↩↩↩↩
-
S&T Bancorp, Inc. 2025 Form 10-K — SEC, 2026-02-27 ↩↩↩↩↩↩↩↩↩↩↩↩↩↩↩↩↩↩↩↩↩↩↩↩↩↩↩↩↩↩↩↩↩↩↩
-
S&T Bancorp (STBA) Q3 2026 Earnings Call Transcript — The Motley Fool, 2026-10-22 ↩↩↩↩↩↩↩↩↩↩↩↩↩↩↩↩↩↩↩↩↩
-
S&T Bancorp Q2 2026 Earnings Call Transcript — Stock Analysis, 2026-07-23 ↩↩↩↩↩↩↩↩↩↩↩↩
-
S&T Bancorp, Inc. and DNB Financial Corporation Announce Merger — SEC, 2019-06-05 ↩↩↩↩↩↩↩↩
-
S&T Bancorp, Inc. Merger Proxy Statement/Prospectus for DNB Financial Corporation (Form S-4/A) — SEC, 2019 ↩↩↩↩↩↩
-
S&T Bancorp, Inc. Announces Second Quarter 2020 Results (Exhibit 99.1) — SEC, 2020-07-30 ↩↩
-
S&T Bancorp Q4 2023 Earnings Call Transcript — Stock Analysis, 2024-01-25 ↩↩↩↩↩↩↩
-
S&T Bancorp, Inc. Announces Fourth Quarter and Full Year 2023 Results — S&T Bancorp, 2024-01-25 ↩↩↩↩↩
-
The PNC Financial Services Group 2025 Form 10-K — SEC, 2026 ↩
-
S&T Bancorp, Inc. 2026 Proxy Statement — SEC, 2026-03-30 ↩↩↩↩↩↩↩↩↩↩↩↩↩↩↩↩
-
S&T Bancorp, Inc. Announces Second Quarter 2026 Results — S&T Bancorp, 2026-07-23 ↩↩
-
S&T Bancorp, Inc. Form 8-K on CEO Todd Brice's Retirement — SEC, 2020-10-02 ↩
-
S&T Bancorp, Inc. Form 8-K on Appointment of Christopher McComish as CEO — SEC, 2021-07-12 ↩
-
Vanguard Portfolio Management Schedule 13G for S&T Bancorp — SEC, 2026-04-29 ↩
-
S&T Bancorp, Inc. Annual Meeting Voting Results (Form 8-K) — SEC, 2026-05-12 ↩
 LinkedIn
 WhatsApp
 Reddit
 Hacker News
 Email
 Kindle
 RSS Feed
 Spotify
 Apple Podcasts
 Amazon Music
 Audible
 YouTube