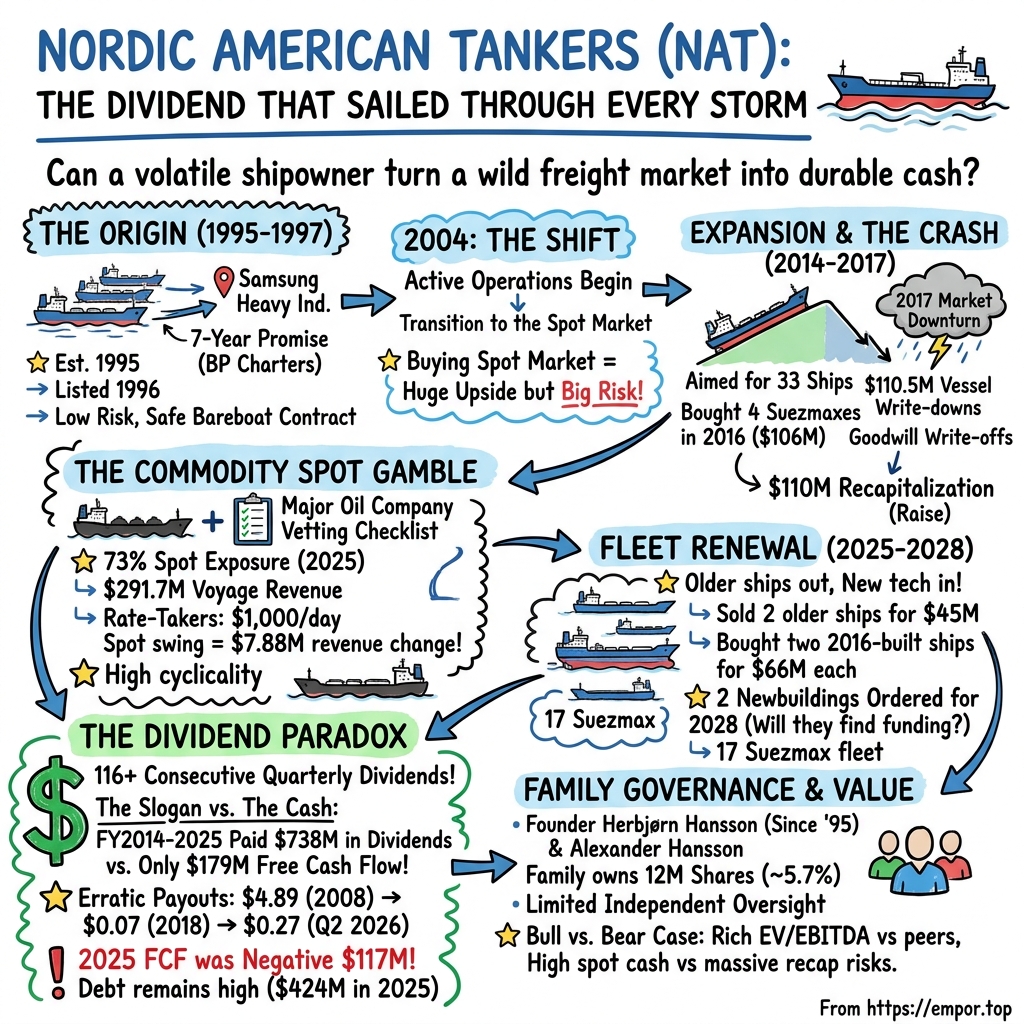
Nordic American Tankers Limited: The Dividend That Sailed Through Every Storm
I. One Dividend, Two Very Different Companies
On November 9, 2026, Herbjørn Hansson sent the market the kind of note that tanker owners wait years to write. The latest spot fixtures for Nordic American Tankers' ships, he said, averaged about $144,000 a day per vessel, with individual voyages ranging from roughly $59,000 to as much as $347,000 a day.1 To put that in perspective, a Suezmax tanker can cover its crew, insurance, maintenance and financing on a small fraction of that daily figure. Hansson, the company's founder, chairman and chief executive, titled the update in his familiar exuberant register, called it a continuing "bonanza," and told shareholders that the dividend should stay healthy.1
The dividend is the one constant in this story. By the second quarter of 2026, NAT had declared 116 consecutive quarterly dividends, a run that began in October 1997, when the first three ships had barely left the shipyard.23 Bill Clinton was in his second term. The euro did not yet exist. Every quarter since, through the Asian financial crisis, the 2008 crash, the tanker depression of the 2010s, a pandemic and two wars that rearranged the world's oil routes, NAT has sent its shareholders something.
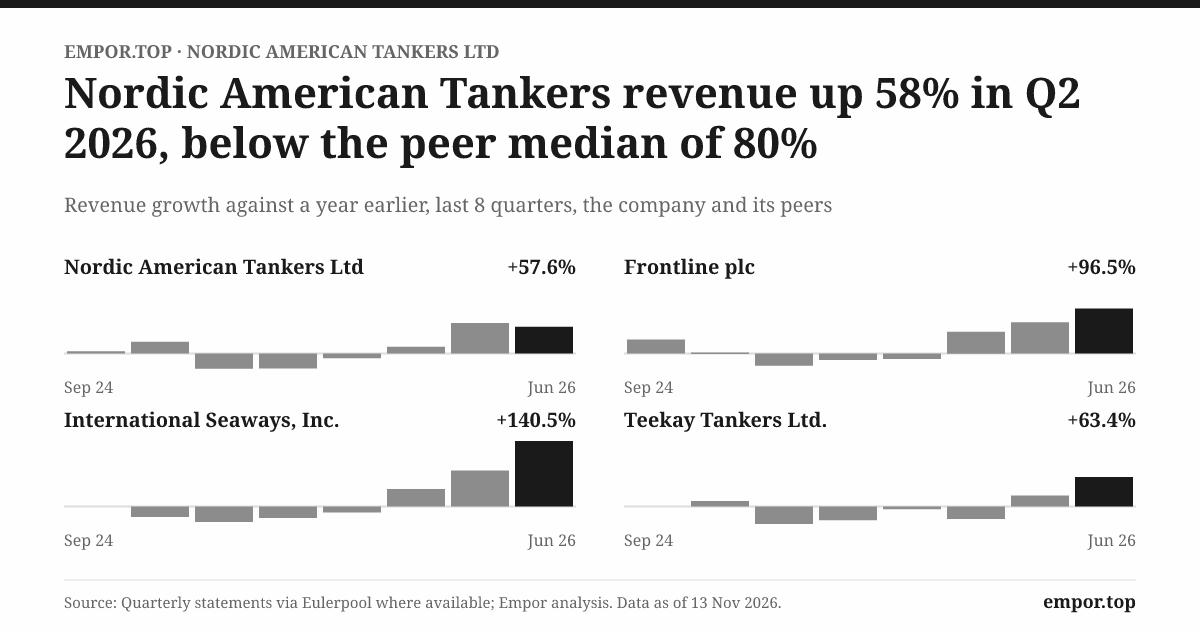
That consistency is the company's public identity. It is also the reason NAT is worth a long look, because the business underneath the dividend is anything but consistent. NAT owns crude-oil tankers and rents them out, mostly one voyage at a time, at whatever price the market will bear that week. Its earnings rise and fall with the freight rate for the next cargo. In the second quarter of 2026, NAT reported net income of $68.3 million, an extraordinary figure for a company that had earned about $12 million in the whole of 2025.23 But two items inside that quarter did a lot of the lifting: a $21.3 million gain from selling a ship and $14.6 million of loss-of-hire insurance recoveries, money paid by insurers to compensate for time a vessel could not trade.2 Take both out and roughly $32 million remains. That is still a very good quarter for a company of NAT's size. It is also less than half of the headline.
There is a second measurement trap worth flagging before the story starts. Headline revenue for that quarter, as aggregated by data providers, came to about $104 million.2 NAT itself leads with net voyage revenue, which it put at $79.3 million.2 The difference matters because on a spot voyage the shipowner pays the fuel and port bills and then recovers them in the freight; the gross number swells and shrinks with bunker prices, while net voyage revenue and its daily equivalent, the time-charter-equivalent rate, measure what the ship actually earned. This story uses the company's own voyage revenue and TCE figures wherever they are available, because those are the numbers that tell an investor what the fleet is really earning.
So there are two companies here, bound together by one promise. One is a dividend institution with a three-decade record. The other is a rate-taking shipowner whose income can triple or vanish depending on how many ships are chasing how many cargoes. The question this episode tries to answer is whether the second company can reliably fund the first.
It breaks into three parts. First, can NAT earn its keep through a full tanker cycle, not just through a boom? Second, can it renew its ships and keep paying dividends without repeatedly borrowing or issuing new shares to bridge the gap? And third, does the company's record give investors reason to trust management's confidence, which has rarely been in short supply?
Tonight's NAT is a Bermuda-incorporated company listed on the New York Stock Exchange that owned 17 Suezmax tankers as of June 2026, with two newbuildings ordered for delivery in 2028.2 A Suezmax is the largest tanker that can pass fully laden through the Suez Canal, a ship of roughly 150,000 deadweight tons that carries about a million barrels of crude. It is the middle child of the crude trade: smaller than the supertankers that run the long haul from the Persian Gulf to China, larger than the Aframaxes that shuttle around the Mediterranean and the North Sea. NAT has never owned anything else. The company describes itself as having a single operating segment, crude transportation by its Suezmax fleet.3
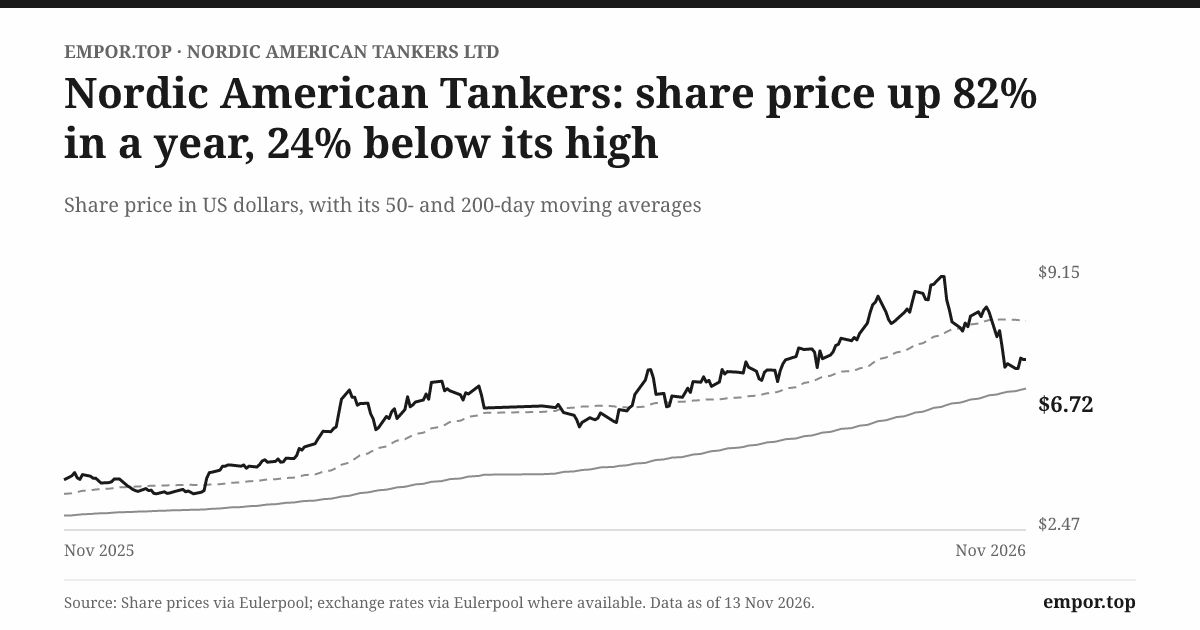
The share price on November 13, 2026 was $6.72, giving the company a market value of about $1.4 billion.4 A year earlier the shares had touched $3.37.4 That near-doubling from the low, alongside the recent dividend increases, says the market believes in the current boom. Whether it believes in the company through the next bust is a different question, and NAT's own history is the best place to look for the answer. That history starts with three ships and a contract that made the company look, for its first seven years, more like a bond than a shipping line.
 Subscribe on LinkedIn
II. Three Ships, One Seven-Year Promise
In 1997, three new Suezmax tankers slid out of Samsung Heavy Industries' yard in South Korea and went straight to work for BP.5 They did not go to work for NAT in any operational sense. The ships were leased on seven-year bareboat charters, which in shipping is the closest thing to handing someone the keys to an empty car. Under a bareboat arrangement the charterer hires the crew, pays for fuel, runs the maintenance and takes the commercial risk. The owner collects a fixed payment and waits.5
That was the original design of Nordic American Tankers. The company was formed in Bermuda on June 12, 1995 and listed its shares in 1996, using the money raised from public investors to buy the three ships.35 For its shareholders, the investment looked less like a shipping company and more like a structured income product: three hulls, one blue-chip lessee and a payment stream that did not care whether freight rates were high or low that month. The dividend declarations began in October 1997.3
The structure also came with a set of handcuffs. The BP charters and the company's own early rules limited how much additional fleet activity NAT could pursue during those first years.5 There was no room to buy cheap ships in a slump or sell expensive ones in a boom. NAT was a passive owner by design, and its fate was tied to BP's willingness to pay rather than to the swings of the spot market.
The man behind the structure was Herbjørn Hansson, and he was not a passive personality. A Norwegian economist educated at the Norwegian School of Economics, with a later diploma from Harvard Business School, he had spent his career inside the machinery of the tanker trade.3 He joined the Norwegian Shipowners' Association in 1974, served as chief economist at INTERTANKO, the global association of independent tanker owners, in the late 1970s, and was chief financial officer of the Kosmos and Anders Jahre shipping group in the 1980s.3 In 1989 he founded Ugland Nordic Shipping, which was sold to Teekay in 2001.3 He has led NAT since its establishment in 1995.3 That biography matters, because it explains a worldview: Hansson came up as an analyst of tanker markets and a financier of ships, and he built NAT around a financial promise to shareholders before he built it around operating ships.
By 2004 the BP charters were approaching expiry, and NAT faced a choice that every owner of leased assets eventually faces. It could sell the ships and wind down, re-lease them on similar terms, or take them back and run them itself. NAT chose the third path. As the charters neared their end, the company became an active shipowner, began acquiring vessels and started trading its fleet in the market.5 Hansson became a full-time executive on September 1, 2004, and in November that year NAT moved its listing from the American Stock Exchange to the New York Stock Exchange.3
Those three changes in a single year turned NAT into a different company. The passive income vehicle became an operating business with commercial exposure, a growth strategy and a CEO who now had both the freedom and the responsibility to time the market. The dividend kept the same name, but what backed it changed completely. Before 2004, a dividend was a slice of BP's lease payments. After 2004, it was a slice of whatever the ships could earn in an open market.
That is the wager that runs through the rest of NAT's story, and it has a simple but brutal arithmetic. In shipping, buying capacity in a strong market can build earnings very quickly, because a vessel bought on Monday can earn the going rate on Tuesday. But a ship is a depreciating steel asset with a working life of roughly twenty years, and it keeps aging whether freight rates are $20,000 a day or $100,000 a day. Its value in the secondhand market swings with sentiment. The financing used to buy it does not care about either. An owner who buys aggressively at the top of a cycle can spend the next decade trying to earn back the purchase price.
NAT's early history, in other words, was the low-risk prologue. The company had a growing dividend culture, a public listing and a founder with deep market knowledge. What it did not yet have was a record of how it would behave with the freedom to buy and sell ships at will. That record would be written in the decade after the global financial crisis, and its most instructive chapter began with a plan to reach 33 ships.
III. Thirty-Three Ships and a $110 Million Write-Down
By the middle of the 2010s, Herbjørn Hansson had a big idea and a tailwind to go with it. Crude tanker rates had recovered strongly in 2015, when falling oil prices encouraged stockpiling and long-haul trades. NAT's revenue that year reached about $445 million and the company earned $114 million, its best result in years.6 It paid shareholders $123 million in dividends.6 With the market strong and the dividend flowing, NAT went shopping.
The centerpiece of that shopping trip came in the spring of 2016. NAT agreed to buy four secondhand 150,000-deadweight Suezmax tankers built between 2000 and 2004 for $106 million in total, or about $26.5 million a ship.7 All four were in the fleet by July 2016.8 The same year, the company announced orders for three newbuild Suezmaxes.6 Through these purchases and orders, NAT laid out a path to a fleet of 33 vessels, the largest it had ever operated.6
Was $26.5 million a good price? The comparison most people would reach for is a new ship, and on that basis the older tankers looked cheap. On a 2023 call, Hansson said NAT had paid about $54 million to $55 million a ship for newbuildings it had ordered, and that the same order would probably cost more than $80 million by then.9 By that yardstick, NAT was buying used tonnage at roughly half the cost of a new hull. But that is precisely the wrong comparison. A tanker built in 2000 had roughly a third or less of its commercial life left by 2016, it burned more fuel than a modern design, and it faced a closer horizon for the expensive special surveys and drydockings that older ships require. Age and specification differ too much for the comparison to say whether NAT overpaid. What it does show is the bet NAT was making: that strong rates would let older, cheaper ships earn their purchase price back before they aged out.
The market did not cooperate. Tanker rates softened through 2016 and fell hard in 2017 as new ships ordered during the good years were delivered and the oil market's stockpiling trade unwound. NAT's revenue fell for two years running, from about $445 million in 2015 to about $297 million in 2017.6 Earnings did worse. NAT posted a small loss in 2016, and then in 2017 the bottom fell out, with a net loss of about $204 million.6
The scene that year was not a stormy sea but a quiet spreadsheet. Shipping companies carry their vessels on the balance sheet at historical cost less depreciation, and they must test whether that book value can be recovered from the cash the ships will earn. The fleet's carrying value exceeded brokers' estimates of the ships' charter-free market value by about $312.8 million, according to NAT's 2017 annual report.6 In plain English, if NAT had tried to sell its fleet that year, buyers would have paid hundreds of millions of dollars less than the price at which NAT was carrying the ships.
The accounting rules do not require a write-down just because market values fall. They require one when the expected future cash flows from a ship cannot cover its book value. For the oldest ships, that test failed. NAT impaired ten of its older vessels, recording about $110.5 million of vessel impairments, and wrote off $19 million of goodwill on top.6 Goodwill in a shipping company is a slightly strange creature, an accounting residue from acquisitions that represented a premium paid above the fair value of the ships. Writing it off amounted to admitting that the premium had not been worth paying.
Lenders were paying attention too. Bank loans to shipowners are secured against the ships, and loan agreements include covenants that tie the size of the debt to the market value of the collateral. When ship values fall, a company can breach those tests even while its ships are still trading. That is the moment when shipping companies tend to discover how little they control. NAT announced a recapitalization program in 2017 that combined a share issue of about $110 million in gross proceeds with changes to its financing.10 It followed with vessel sales: its 2018 annual report records eight ships sold, along with further impairment charges and losses on disposals.11 NAT lost another $95 million in 2018.11
The dividend survived, in the narrow sense that a payment was declared every quarter. In the broader sense it collapsed. Cash dividends paid fell from about $125 million in 2016 to about $9 million in 2018.11 Shareholders' equity, which had stood near $880 million in the middle of the decade, fell to about $600 million by the end of 2018.11 Part of that equity had been freshly contributed by the shareholders who bought into the 2017 raise. Put simply, the investors who had been receiving large dividends during the expansion were asked to put money back in when the expansion went wrong.
It is tempting to turn this chapter into a neat morality tale about a promoter who bought at the top. The evidence supports a narrower conclusion. NAT did not buy every ship at a peak, and some of its expansion, including the newbuildings, gave it a younger core fleet that still trades today. The tanker market of 2017 and 2018 was brutal for nearly everyone, and NAT was far from the only owner to report losses. What the record does show is a severe combination of cycle and balance sheet: a company that grew its fleet substantially, financed that growth partly with secured debt, kept paying out most of its cash, and then had to sell ships and raise equity when market values fell faster than earnings could absorb.
That combination matters for investors in 2026 because it is not unique to that decade. It is the structural risk of NAT's model. A shipowner that distributes most of its cash in good years has little buffer in bad ones, and a shipowner whose collateral values move with the freight market finds that its lenders become most demanding at exactly the moment its earnings are weakest. The 2017 impairment and equity raise are the strongest counterevidence in NAT's own record to any claim that its fleet timing is consistently disciplined.
The forward test is simple to state. NAT is once again buying, selling and ordering ships during a strong market. Whether the current fleet is being renewed at prices it can earn back across a normal market, not just a boom, is the question the next decade will answer. To understand how that earning actually happens, though, one has to follow a single tanker through a single voyage and see who decides whether it gets the cargo.
IV. A Commodity Business with a Vetting Gate
Before a Suezmax can load a million barrels of crude for an oil major, it has to pass an inspection. An inspector boards the vessel and works through a long checklist: the condition of the hull and cargo systems, the state of the mooring equipment, the quality of the crew's training records, the maintenance history, the safety management system, the paperwork that shows how the ship has been run. The findings go into a report that charterers across the industry can consult. A ship with a poor record, or an owner with a history of incidents, may be quietly passed over. The process is called vetting, and it is the closest thing crude shipping has to a gatekeeper.
NAT talks about vetting a great deal. The company presents its fleet as well-maintained, oil-major-approved tonnage, and describes strong relationships with the energy companies that charter its ships.3 That is a meaningful claim, because a shipowner that cannot pass vetting is effectively locked out of the most creditworthy cargoes. But it is worth being precise about what vetting does. It is a pass-or-fail gate, not a price premium. An oil major choosing between two approved Suezmaxes for a voyage from West Africa to Rotterdam will generally take the cheaper one that fits its schedule. NAT does not publish a relative vetting score, a measure of how often its ships are rejected, or evidence that charterers pay more for its ships than for comparable approved tonnage. Vetting gets NAT into the room. It does not obviously let NAT set the price once inside.
So how does a NAT ship actually make money? There are two ways to rent out a tanker. On a spot charter, the ship is hired for a single voyage at the going rate, and the owner pays the voyage costs, mainly fuel and port charges. On a time charter, a charterer hires the ship for a period, months or years, at a fixed daily rate and pays the voyage costs itself. The spot market is like driving a taxi that charges whatever the surge price is that hour; the time charter is like leasing the taxi to a company for a fixed monthly fee. The spot owner gets the upside in a busy city and the empty streets in a quiet one. The time-charter owner gives up the surge for predictability.
To compare the two, the industry uses the time-charter-equivalent rate, or TCE. Take the freight a ship earned on a voyage, subtract the fuel and port costs, and divide by the days the voyage took. The result is a daily figure that can be set against a time-charter rate on an even basis. When Hansson says his ships are fixing at $144,000 a day, he is talking about TCE-style daily earnings. When NAT reported a fleet-average TCE of about $63,000 a day for the second quarter of 2026, that was the blended figure across all its ships, including those on time charters and those whose voyages were booked before rates spiked.2
Follow the money down from there. Each ship has daily operating expenses for crew, insurance, stores, lubricants and routine repairs, paid through the technical managers that NAT employs to run the vessels; NAT names three such managers, and its seafarers are employed through them rather than directly.3 Every five years or so each ship must go into drydock for inspection and repairs, which takes it off hire and costs millions. Depreciation spreads the purchase price of the ship over its expected life. Interest on the debt used to buy the ships comes next, and then general and administrative costs, which are modest: NAT ran its business with a shore-based staff of about 18 people in 2025.3 Whatever is left after all of that is profit, and whatever is left after drydocks, ship purchases and loan repayments is cash available for dividends.
The key fact about NAT's version of this machine is how much of it runs on the spot market. In 2025, NAT earned about $291.7 million of voyage revenue, of which $212.0 million came from spot charters and $79.7 million from time charters.3 Roughly three dollars of every four, then, came from the taxi-at-surge-prices side of the business. That has been a deliberate choice for years. On a 2023 status call, NAT's chief financial officer, Bjørn Giæver, noted that 15 of the company's 19 tankers were trading in the spot market at the time.9 The company has quantified what that exposure means: a change of $1,000 a day in spot rates per vessel was estimated to move 2025 voyage revenue by about $7.88 million.3 When rates move by $50,000 a day, as they have in 2026, the effect on the income statement is enormous, in either direction.
NAT has some time-charter cover. At the end of 2025, the minimum revenue the company was contractually owed under its time charters came to about $127.1 million, scheduled largely between 2026 and 2029.3 That is real money, and it provides a floor under part of the fleet. But spread across several years and set against a fleet of 17 to 20 ships, it is a modest cushion compared with the swings the spot book can produce. NAT is, in its bones, a spot-market company.
Who pays NAT? The company's customers are the oil majors, national oil companies, traders and refiners who need to move crude. In 2025, two customers together accounted for about 18% of voyage revenue, down from about 22.5% for two customers in 2024 and about 20.5% from a single customer in 2023.3 At year-end 2025, six charterers accounted for about 61% of the receivables on NAT's balance sheet.3 NAT does not name these customers. Concentration of that degree makes counterparty health worth watching, because a large charterer that pays late or fails can matter. But the record does not show it has hurt NAT so far: the annual report discloses no named customer loss, no material charterer bankruptcy and no unusual payment terms, and the allowance for credit losses, at about $400,000 against $19 million of receivables, remains small.3 The right conclusion is to monitor the counterparties, not to assume concentration has already impaired revenue.
Where does NAT sit among its rivals? Not near the top by size. International Seaways, one of the larger U.S.-listed tanker companies, operated a fleet of 65 vessels across crude and product-tanker classes as of 2026.12 NAT is a focused, mid-sized Suezmax owner. It has no claim to scale leadership in tanker shipping, and the public record gives no basis for ranking its market share.
Run the industry through the classic forces once and the picture is clear. Charterers have real power, because they can choose among many qualified owners and the spot market is transparent: brokers circulate fixtures daily. Suppliers, meaning shipyards, fuel sellers, crews and insurers, have power that rises and falls with the cycle; a crowded newbuilding order book can push up yard prices just as rates fall. Entry is expensive, since a new Suezmax costs tens of millions of dollars and an owner needs safety systems and vetting history, but it is far from impossible, because ships can be bought secondhand, chartered in, or ordered by any well-financed newcomer. Substitutes for seaborne crude transport over long distances are limited; pipelines serve some routes, but a Suezmax from Brazil to Europe has no practical alternative. And rivalry is intense, because the product is close to identical and capacity is lumpy. The result is an industry in which the price is set by the balance of ships and cargoes, not by any individual owner.
What moves that balance? Three things matter most. The first is demand measured not in barrels but in ton-miles, the volume of oil multiplied by the distance it travels. A barrel moving from the Persian Gulf to India uses far less shipping than a barrel moving from the U.S. Gulf Coast to China, so changes in trade routes can tighten or loosen the market even when oil demand is flat. The second is the supply of ships: the order book of new tankers, the pace of scrapping old ones, and the size of the so-called shadow fleet, the older tankers that carry sanctioned Russian, Iranian or Venezuelan oil outside the mainstream insurance and vetting system. Those shadow ships are effectively removed from the compliant market that oil majors use, which tightens supply for owners like NAT. If sanctions ease and those ships return to mainstream trade, the opposite happens. The third is conflict and geopolitics, which can force ships onto longer routes, such as around the Cape of Good Hope instead of through the Red Sea and Suez, adding ton-miles and lifting rates while also raising insurance costs and the risks crews face. NAT's own annual report identifies trade flows, oil demand and tanker supply as the drivers that matter.3
It is fashionable to ask every company how artificial intelligence will affect it, and for NAT the honest answer is: not much, directly. No software substitutes for a hull carrying a million barrels across an ocean. The risks that actually move NAT's value are freight rates, fleet supply, safety, regulation and the cost of capital, and those are where an investor's attention belongs.
So NAT's business is fundamentally a rate-taking, capital-intensive transport operation. Its vetting record and its single-class fleet may help it secure cargoes and simplify operations, but the public evidence does not show pricing power or a durable moat. If NAT is going to create long-term value, it will not be by charging more than its rivals for the same voyage. It will be by buying, maintaining and selling ships at the right prices and by not getting caught with too much debt when the cycle turns. Which brings the story to the fleet itself, and to the curious fact that in the middle of a boom, NAT has been shrinking.
V. The Fleet Starts Shrinking Again
In 2025, two tankers joined the NAT fleet and two left it. The arrivals were the Nordic Galaxy and the Nordic Moon, both built in 2016, bought for $66 million apiece.13 The departures were the Nordic Apollo and the Nordic Castor, older vessels sold for about $45 million together, which delivered a combined accounting gain of about $16.6 million because they had been depreciated down on NAT's books.133 On paper, NAT swapped two old ships for two much younger ones and paid a net difference of roughly $87 million for the upgrade.
That exchange captures the strategic choice NAT has made in the current cycle. Rather than growing ship count, as it did in the mid-2010s, it has been renewing the fleet: selling its oldest vessels into a strong secondhand market and buying or ordering younger ones. The sales continued into 2026; the second-quarter gain of $21.3 million came from another vessel disposal.2 By June 2026, NAT owned 17 Suezmaxes, down from around 20 a year earlier, with two newbuildings on order for delivery in 2028.2 The fleet in NAT's 2025 annual report spanned ships built between 2003 and 2022, so age was a genuine issue to address.3
Is NAT getting good prices? It is natural to want a verdict, and the honest answer is that the purchase and sale prices alone do not provide one. Secondhand ship prices vary with age, yard, specification, condition and the timing of the next survey, and NAT's filings do not set its transactions against a matched set of contemporaneous Suezmax sales. Paying $66 million for a nine-year-old Suezmax looks expensive next to the $26.5 million NAT paid for older ships in 2016, and cheap next to Hansson's own 2023 estimate for a new Suezmax. Neither comparison settles the question. What can be said is that NAT bought these younger ships during a strong market, when asset prices were well above the levels of the late 2010s, and that the purchase price will need a strong market to earn back on a reasonable timeline.
The scale of the investment matters more than the per-ship price. In 2025, NAT added about $133.7 million of vessels and about $23.2 million of drydocking to its balance sheet, against voyage revenue of about $291.7 million.3 More than half of the year's revenue went into ships and the work needed to keep them trading. In 2024, by contrast, vessel additions were under $1 million and drydocking about $1.9 million.3 That swing explains a great deal of what happened to NAT's cash in 2025, and it says something important about the nature of this business. Drydocking and vessel replacement are not optional growth spending. They are the cost of staying in the game. A shipowner that skips them for a few years can report flattering free cash flow, but the bill eventually arrives, usually all at once.
How was it paid for? Largely with debt. NAT's borrowings rose from about $270 million at the end of 2024 to about $424 million at the end of 2025, while cash ended the year at about $46 million.3 The Beal Bank facility was amended in February 2025 into a five-year, $150 million secured loan.3 Shareholders' equity fell over the same period, because NAT paid out far more in dividends than it earned.3 The fleet got younger, and the balance sheet got heavier.
That is where the vetting claim from the previous scene needs to prove itself. NAT's argument for buying modern tonnage is partly that oil majors prefer younger, well-maintained ships and that those ships will keep winning cargoes after older vessels age out of charterers' preferred lists. If that is right, the evidence should show up in two places over time: fleet availability, meaning the share of days that ships are trading rather than sitting in drydock or repair, and achieved TCE relative to the market. A company assertion of quality is not the same as a demonstrated return. The test is safe, available ships that keep their access to oil-major cargoes and earn competitive daily rates, year after year.
Then there are the two 2028 newbuildings. They were ordered after the end of 2025, and when NAT published its annual report in April 2026 it said it had not yet entered into any financing agreement for them, adding that it expected to have financing in place "well in time" for delivery.3 New ships could modernize the fleet substantially and reduce fuel consumption. But they also mean that NAT is committing to a large capital outlay that will come due in a market nobody can forecast. The ships' cost, how they are funded, whether the yard delivers on time, and above all the return they earn on the capital invested will all be tests. An order placed at the top of a cycle can look brilliant in the year of the order and painful in the year of delivery.
There is a deeper accounting point here, and it ties back to the quiet spreadsheet of 2017. The value of a ship on NAT's balance sheet depends on management's assumptions about future charter rates and cash flows. NAT's auditor, KPMG, flagged exactly that judgment as the critical audit matter in its 2025 audit, noting that the fleet's carrying value of about $748 million rested on estimates of future charter rates.3 NAT identified no impairment indicators at year-end 2025, and in today's market there is no obvious reason it should have.3 But the 2017 experience showed how quickly book values and management's rate assumptions can diverge from what buyers will actually pay for a ship. Every vessel bought at today's prices raises the bar that tomorrow's market must clear.
The fleet strategy is therefore best described as a reset with a familiar risk attached. Fewer, younger ships make sense if NAT's competitive argument rests on quality and vetting. But the renewal has been financed with debt in a high-price market, and it has coincided with one of the weakest cash years in recent memory. That combination puts the spotlight on the one thing NAT has never stopped doing: paying the dividend.
VI. The Dividend That Survived the Downturn
Imagine a NAT shareholder opening a brokerage statement in late 2025. Another quarterly dividend has arrived, as it has every quarter for nearly three decades. What the statement does not show is that the company paying it generated only about $19.8 million of cash from operations that year, and after spending on ships and drydocks, its free cash flow was negative by about $117 million.3 In that same year, NAT paid out about $85 million in dividends.3 The dividend arrived on time. The cash to pay it came from somewhere other than the year's operations.
To understand how that can happen, start with what the dividend actually is. NAT has never promised a fixed amount. Its policy is to declare quarterly dividends based on the prior quarter's net operating cash flow, after reserves that the board considers appropriate and after financing obligations.3 On the 2023 call, Giæver put it bluntly: NAT has never had a payout-ratio policy, and instead it usually distributes "the excess cash that we find suitable."9 So the 116-quarter streak counts continuity of payment, not stability of amount. The size of each payment is a board decision, made quarter by quarter.
The history shows how wide those decisions have ranged. In 2008, at the peak of the previous great tanker boom, NAT paid $4.89 per share in dividends.5 By 2018, in the depths of the post-expansion bust, the figure had fallen to $0.07 per share for the whole year.5 It recovered to $0.49 per share in 2023 and then fell to $0.36 in 2025.5 A shareholder who bought for the 2008 payout and held through 2018 saw their annual income drop by roughly 98%. The streak was intact. The income was not.
Now look at the long run of cash. Across the twelve years from 2014 through 2025, NAT's operations generated about $786 million of cash, even though cumulative net profit over the same period was a loss of about $110 million.36 That gap is mostly depreciation, the non-cash charge that spreads the cost of ships over their lives, which ran at about $58 million in 2025 alone.3 It is the reason shipping executives often argue that accounting profit understates their cash generation, and in a narrow sense they are right. But depreciation is a real economic cost, deferred rather than avoided. The ships wear out, and they have to be replaced. When NAT's spending on ships and drydocks is subtracted, free cash flow across those twelve years comes to only about $179 million.36 Over the same period, NAT paid about $738 million in dividends.36
That is the central fact of NAT's financial history, and it is worth holding in mind: over twelve years, NAT paid out roughly four times the free cash flow it generated. The difference of about $559 million did not come out of a cash hoard, because cash and short-term investments actually declined slightly, by about $20 million, across the period.36 It came from the other sources a company can use: new equity, such as the 2017 raise and the at-the-market share sales of later years; new debt, such as the 2025 borrowing; and the sale of ships. In the median year since 2015, NAT paid out about 140% of its net profit as dividends; in 2025 the figure was about 706%.36
The 2022 share issuance shows the pattern in miniature. That year NAT sold about 14.3 million new shares through an at-the-market program, raising about $33.6 million in gross proceeds, while paying about $22 million in dividends.14 It sold another 2.95 million shares in 2024, raising about $9.2 million.3 The amounts are not huge, and there are legitimate reasons for a company to raise equity in a recovering market, but the effect was that some shareholders were being paid dividends while the company was selling new shares to others. Dividends paid partly with newly issued equity are not a return of earnings. They are a transfer between shareholders, with costs taken out along the way.
Here management's own forecasts become part of the story. On March 7, 2023, NAT held a status call in a strong tanker market. Hansson said that "objective number one is to become debt free," and that the company expected "very clearly to be a debt-free company in a year or two, being able then to raise dividends significantly."9 Giæver added that once the Beal facility was paid back at maturity, "you could easily see our payout double from today's levels."9 Hansson also said that he did not think he had "seen a better condition than now" in the tanker market.9
What happened next did not match that timeline. Rather than being repaid, the Beal facility was amended in February 2025 into a new five-year secured loan of $150 million.3 NAT borrowed to finance the two 2016-built ships. By December 2025, reported debt was about $424 million, the highest year-end figure since 2018.311 The debt-free goal, stated with considerable confidence, did not materialize within the one-to-two-year window. NAT described the refinancing in terms of the liquidity and flexibility it provided, and there is a reasonable case that buying younger ships in 2025 was a better use of capital than paying off debt on an aging fleet. But a forecast is a forecast, and this one was missed by a wide margin. Investors weighing management's current statements about the strength of the market and the health of the dividend should hold that episode in mind.
None of this means the dividend is a fiction. In good years NAT does generate large amounts of cash, and the dividend rises accordingly. Operating cash flow was about $139 million in 2023 and about $128 million in 2024, and dividends paid in those years were well covered by operating cash.3 The problem is the bad years, when the dividend keeps being paid but cash from operations does not keep up, and the gap is closed with balance-sheet resources.
There is a useful way to think about what a sustainable payout would look like for a company like this. Picture NAT's business as two buckets. The first bucket is what the ships earn after running costs and interest. The second is what the ships consume over time: drydocks every few years, and eventually a replacement for every hull as it ages out. Depreciation of nearly $60 million a year is the accountant's rough estimate of that second bucket.3 A payout that is genuinely self-funding over a cycle is one that comes from the first bucket after the second has been filled. NAT's habit has been to pay from the first bucket and to fill the second, when the time comes, with debt, equity or ship sales. That approach can work for years in a rising market, because ship values rise too and lenders are happy to refinance. The 2017 recapitalization showed what happens when a weak freight market and falling ship values arrive together.
The current boom is the friendliest possible backdrop. NAT's first-quarter 2026 dividend rose to $0.22 per share and the second-quarter payment to $0.27, as fleet TCE jumped and the company booked sale gains and insurance recoveries.215 At those levels, and with spot fixtures well above the second-quarter fleet average, the dividend is plausibly covered by current cash generation. The real test, though, is what payout coverage looks like when rates normalize: dividends measured against operating cash after drydocks, vessel replacement and debt service, through a full cycle rather than a single bonanza year. NAT's record gives no evidence yet that the payout is self-funding through a downturn. If anything, it shows the opposite.
That raises a governance question as much as a financial one. A dividend this central to the company's identity, set quarter by quarter at the board's discretion, puts a great deal of weight on who sits on that board and whose interests they represent. In NAT's case, that means looking closely at the Hansson family.
VII. The Founder's Confidence Meets the Boardroom
Herbjørn Hansson has run Nordic American Tankers for more than thirty years, and he has never been a quiet chief executive. His market updates carry exclamation-point energy and confident headlines; his conference calls mix market commentary with reminders that the dividend is the company's priority. "Dividend is, and has been, and will remain our priority," he told investors in 2023.9 He is the founder, chairman, president and CEO, all at once.3 Beside him on the board sits his son, Alexander Hansson, who joined the company as an employee in 2009, became a director in November 2019 and has been vice-chairman since February 2024.3 Alexander has run shipping and trading offices for the company in London and Monaco.3
The CFO, Bjørn Giæver, joined in October 2017, in the middle of the recapitalization.3 He came with more than thirty years in shipping finance, including stints as a partner at Fearnley Securities, a senior corporate adviser within the John Fredriksen group and a shipping analyst at DNB Markets.3 That background matters because Giæver has been the voice on the financing side of the story, including the 2023 prediction that the payout could double once the Beal loan was repaid. The rest of the board is small. Jim Kelly, a former managing editor of Time magazine, has been a non-executive director since 2010.3 Jenny Chu, a wealth-management veteran with more than 25 years at firms including Morgan Stanley, UBS, JP Morgan and Merrill Lynch, joined the board in 2022.3
Start with the alignment argument, because it is real. The Hansson family put its money where its mouth is. In October 2026, NAT announced that the family collectively owned 12 million shares, after Alexander bought another 300,000, and described the family as the company's largest private shareholder group.16 Against the roughly 211.8 million shares outstanding at the record date for the 2026 annual meeting, that is about 5.7% of the company.17 The family's stake has grown over time: the 2024 annual report put it at 9.2 million shares, about 4.3%.14 At $6.72 a share, the family's holding is worth about $80 million, a substantial personal exposure to the same dividend and share price that outside investors depend on.
But 5.7% is not control. Institutional managers hold stakes of a similar size: the 2025 annual report listed BlackRock at about 5.6% and Dimensional Fund Advisors at about 5.6%, based on their year-end filings.3 NAT reported only 377 U.S. holders of record in April 2026, but that figure includes nominee accounts like Cede & Co., which hold shares on behalf of thousands of beneficial owners, so it says little about how widely the shares are actually held.3 The family's stake is an alignment signal, not a controlling block. The family's influence comes less from its votes than from its seats: the CEO is also chairman, and his son is vice-chairman.
Compensation offers the next test. NAT discloses pay only as a total for its directors and executive officers as a group, not CEO-specific figures. In 2024, cash compensation to five directors and officers totaled about $11.9 million, plus about $2.76 million of option expense; that year also saw the settlement of 3.855 million options at $1.15 each.314 In 2025, cash compensation fell to about $7.8 million.3 The direction was right: pay fell as net income dropped from about $46.6 million to about $12.3 million.3 But the level is striking for a company with 18 shore-based employees and a market value that, through most of 2025, was well below today's. In 2024, the group's cash pay amounted to roughly a quarter of NAT's net income. And because the company does not disclose individual pay or a formal link between pay and long-run shareholder returns, outside investors cannot judge whether the incentive structure rewards cash generation through the cycle or simply the size of the payout in good years.
Oversight is where the structure looks thinnest. NAT is incorporated in Bermuda and relies on home-country governance exemptions available to foreign private issuers on the NYSE. The 2026 proxy identifies Jenny Chu as the independent director chairing the audit committee.17 The company has no independent nominating or governance committee, and its non-management directors do not regularly meet in executive session without management present.3 For a company in which the founder holds all three top executive roles and his son is vice-chair, those are meaningful gaps. Nobody independent of the family has a formal mandate to evaluate the CEO, plan for succession or challenge capital-allocation decisions in a setting where management is not in the room. Hansson has led the company since its founding, and with a son already in a senior board role, succession is a live but undiscussed question.
One related-party arrangement deserves a mention because it is concrete. NAT paid a company owned by a board member about $1.3 million in 2023 and about $1.8 million in 2025 in operating costs for the use of an asset in corporate and marketing activities, with no balance owed at year-end.3 The company does not identify the asset or describe the terms as arm's-length. The amounts are small relative to NAT's revenue, but the arrangement has been growing, and without disclosure of the pricing, outside shareholders have no way to judge whether they are getting fair value.
The shareholder meeting is the obvious place to look for dissent, but the timing does not help yet. NAT's 2026 annual general meeting was scheduled for November 20, after the date of this story, so the vote outcomes, including the support each director receives, are not yet known.17 The proxy describes what shareholders will be asked to approve; it is not evidence of how they voted.
On the accounting side, the signal is clean. KPMG issued an unqualified opinion on NAT's 2025 financial statements and an opinion that its internal controls over financial reporting were effective.3 The critical audit matter it highlighted was the vessel impairment assessment, which reflects how sensitive NAT's balance sheet is to assumptions about future charter rates rather than any reporting failure.3 NAT also says it is not party to any lawsuit that would be material to its financial position.3
Put together, the governance picture is mixed and specific. Long tenure and a growing family stake create real alignment with the share price and the dividend. But a combined chair and CEO, a son as vice-chair, a single independent director on the audit committee, no independent nominating committee, aggregate-only pay disclosure and a missed debt-free forecast leave the credibility of management's guidance and the quality of oversight as open tests rather than settled strengths. That is the human backdrop against which the market now has to decide what NAT is worth.
VIII. Analysis & Bear vs. Bull Case
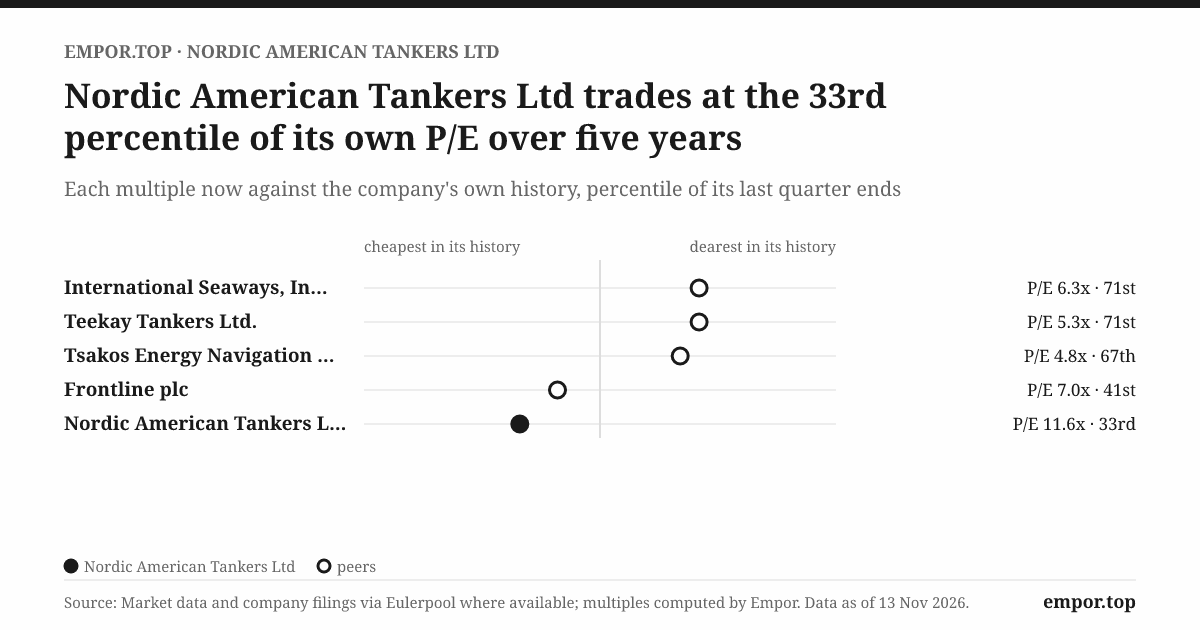
On November 13, 2026, NAT's shares closed at $6.72, about 24% below their 52-week high.4 At that price, the stock traded at about 11.6 times trailing earnings, below its own five-year median of about 12.8 times.4 Taken alone, that looks like a stock priced modestly against its history. But switch to the measure that most tanker investors prefer, enterprise value relative to EBITDA, which captures debt as well as equity and strips out depreciation, and the picture flips. NAT traded at about 9.4 times EV/EBITDA, while a same-date comparison of listed crude-tanker peers put Teekay Tankers at about 4.1 times, International Seaways at about 4.9, DHT at about 5.4, Okeanis Eco Tankers at about 5.7 and Frontline at about 7.6.4 On that yardstick, NAT is the most expensive name in the group.
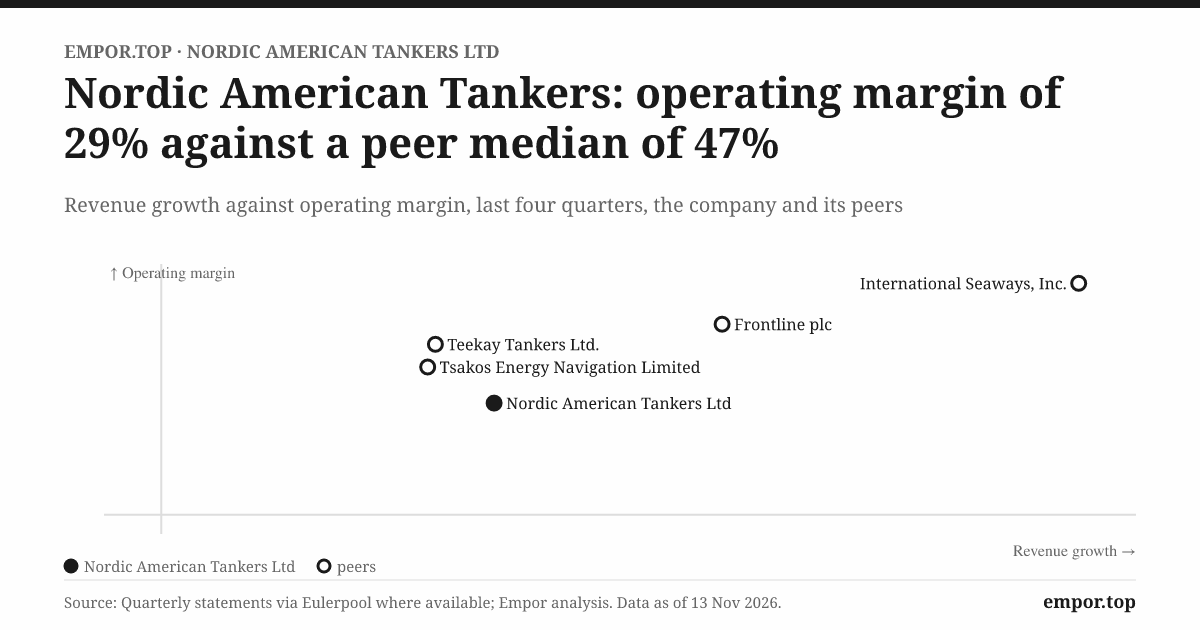
The two signals are not contradictory so much as differently distorted. NAT's trailing earnings are flattered by vessel-sale gains and insurance recoveries, which lower the P/E. Its EBITDA over the trailing period includes the weak quarters of 2025, which raises the EV/EBITDA ratio when compared with peers whose earnings recovered sooner or whose fleets carry more time-charter cover. Peer differences in fleet age, vessel class, charter mix and debt also matter a great deal. A supertanker owner like Frontline captures a different slice of the crude trade than a pure Suezmax owner, and a company with more ships on fixed-rate time charters will look cheaper on trailing cash earnings in a rising market simply because it has sold part of its upside in advance. What the valuation does make clear is that NAT is not an obvious bargain relative to its competitors. The market is paying a premium for NAT's spot exposure, its dividend identity, or both. NAT's price-to-book ratio of about 3.0 tells a similar story: investors are paying about three dollars for every dollar of book equity, a bet that today's ship values and earnings are well above what the balance sheet records.4
Start with the case for a durable recovery, because it begins with the market. The compliant tanker fleet, meaning ships that oil majors will charter under mainstream insurance and vetting, has been tight, as sanctions push older tankers into the shadow trade and conflict lengthens voyages. New tanker supply ordered in the early 2020s was limited; Hansson argued in 2023 that there would be "almost no increase" in the fleet over the following few years.9 Long-haul crude trades from the Atlantic basin to Asia add ton-miles. In that kind of market, a spot-heavy Suezmax owner earns extraordinary rates on every voyage, and NAT's $144,000-a-day fixtures are the result.1
Translate that into money. The company's own sensitivity says each $1,000 a day of spot rate moves annual revenue by about $7.9 million.3 If a 17-ship fleet were to average $40,000 a day more than it did in 2025 for a full year, the arithmetic implies roughly $250 million of additional revenue, much of which would fall straight through to cash because the costs of running the ships barely change with the rate. That is the operating leverage that makes tanker stocks so explosive in booms. Add the younger fleet, the oil-major customer base and the vetting record, and the bull argues that NAT can pay large dividends, fund the 2028 newbuildings and reduce debt, all at once, for as long as the market stays strong. Return on equity over the twelve months to June 2026 was already about 26%.4
The case for caution starts with the same spot exposure. Operating leverage works in reverse, and NAT's history shows that it does not need a crisis to bite: an ordinary soft year like 2025 cut operating cash flow to about $20 million.3 The fleet needs continuous capital for drydocks and replacement, and the two newbuildings will require funding that NAT had not arranged as of its annual report. Debt at the end of 2025 was higher than at any year-end since 2018, and it carries floating rates: a one-percentage-point rise in SOFR or the Federal Funds Rate was estimated to add about $4.2 million to annual interest expense.3 The Beal facility and the Ocean Yield financing on eight vessels carry covenants tied to minimum liquidity, adjusted equity and vessel values, and NAT has identified minimum liquidity as historically its most sensitive test.3 The Beal loan also includes excess-cash sweeps, which can divert cash to lenders before it reaches shareholders.3
The downside scenario does not need imagination, because NAT's own record supplies it. In a prolonged weak market, the sequence would likely look familiar: vessel values fall, covenant headroom narrows, lenders demand repayment or more collateral, and the company sells ships into a weak market or raises equity at a depressed share price. That is what happened in 2017 and 2018, and NAT's renewed at-the-market program, which became effective in 2025, means the mechanism for issuing new shares is already in place.3 The 2017 equity raise, the at-the-market share sales of 2022 and 2024, and the minimum-liquidity covenants all point to the same conclusion: in a downturn, the cost of maintaining the dividend and the fleet tends to land on shareholders through dilution, asset sales or a much smaller payout.
The cleanest way to test NAT's competitive position is to ask which of Hamilton Helmer's seven sources of durable advantage it can claim. Scale economies? No: NAT is a mid-sized fleet in an industry where larger, diversified owners exist, and the costs of running a ship are largely the same for everyone. Network effects? None; one more customer does not make NAT more valuable to another. Counter-positioning? NAT's spot-heavy model is a choice that rivals can and do replicate. Switching costs? Minimal, because a charterer can move its next cargo to any approved owner without friction. Branding? The vetting record matters, but it is a qualification many competitors also hold, not a premium-price brand. Cornered resource? NAT owns no unique asset; Suezmaxes can be bought by anyone with capital. Process power? A single-class fleet may simplify operations and crewing, but NAT does not publish evidence of lower costs or higher earnings per ship than peers as a result.
The honest conclusion is that there is no demonstrated structural moat. That is not unusual for a shipowner; it is the normal condition of the industry. It does mean that NAT's long-term value depends on capital allocation through the cycle rather than on any competitive edge that protects returns. The two questions that matter are when NAT buys and sells ships, and how much cash it keeps versus pays out.
Three measures will tell investors more about NAT's trajectory than any market commentary. The first is achieved TCE alongside the number of spot and time-charter days booked. The second-quarter 2026 fleet average was about $63,000 a day, and November fixtures suggested a sharp further rise.21 The second is operating cash after drydocking, vessel spending and debt service, compared directly with dividends paid. In 2025 that measure was deeply negative, with free cash flow of about minus $117 million against dividends of about $85 million.3 The third is fleet count and age measured against debt, liquidity and covenant headroom. As of mid-2026, the fleet was 17 ships with two on order, and debt at the end of 2025 stood at about $424 million.23
The decisive "why win" and "why not" are simple. NAT can win from here if its ships stay qualified and available, if rates remain favorable long enough for current cash flows to fund the dividend, the newbuildings and a reduction in debt, and if the board resists the temptation to pay out every boom dollar. It may not, if rates reverse before the dividends and replacement spending are covered by cash, because in that case the company's record suggests the gap will once again be filled by borrowing, ship sales or new shares. The current share price, at a premium to peers on cash earnings, seems to assume the former outcome more than the latter.
IX. Playbook: Business & Investing Lessons
Put three moments from NAT's history side by side. In 2008, at the top of a tanker boom, the company paid $4.89 a share in dividends and looked like an income machine.5 In 2017, it wrote down about $110.5 million of vessel value and asked shareholders for $110 million of fresh equity.610 In 2025, it kept paying its quarterly dividend while its free cash flow ran deep into negative territory.3 All three moments share the same dividend streak. They tell very different stories about the business beneath it.
The first lesson is that a dividend streak measures continuity, not coverage. NAT's 116 consecutive quarters are a real achievement and a real commitment to shareholders. But in 2025, the year it paid more than seven times its net profit and about $85 million against negative free cash flow, the streak said nothing about whether the payments were being funded by the business or by the balance sheet. For any company that markets a dividend record, the question to ask is not how many quarters it has paid, but how many of those payments came from free cash flow after the business paid its own bills. A streak can be maintained by borrowing; coverage cannot.
The second lesson is that a ship bought in the boom has to earn through the bust. In 2016, NAT bought four older Suezmaxes at what looked like half the cost of a new ship, laid out a path to 33 vessels, and within two years was impairing ten older ships and selling eight more.611 The purchase price of a cyclical asset is not tested in the year it is bought; it is tested in the worst year of its life. NAT's current fleet renewal, with younger ships bought at $66 million each and two newbuildings due in 2028, will be judged the same way. Founders and investors in any capital-intensive cyclical business should demand that every asset purchase pencil out at mid-cycle rates, not at the rates prevailing on the day of the deal.
The third lesson is that a forecast is a promise with a clock. In March 2023, NAT's chief executive said the company expected "very clearly" to be debt-free within a year or two, and its CFO said the payout could double once the Beal loan was repaid.9 By the end of 2025, the Beal facility had been refinanced for five more years and total debt was higher, not lower.3 Management may well have had good reasons to change course; buying younger ships may prove to be the better decision. But investors should treat stated timelines as commitments to be checked against outcomes, and weigh a management team's current confidence by the accuracy of its past predictions.
The fourth lesson is the one investors can apply every quarter: count the dividend after the drydock. Depreciation makes a shipowner's accounting profit look worse than its cash, and that often leads investors to treat operating cash flow as distributable. It is not. Ships need drydocks, replacement and debt service, and those costs arrive in lumps. NAT's twelve-year record, in which operating cash of nearly $800 million shrank to less than $200 million of free cash flow while dividends ran to more than $700 million, shows how wide that gap can be.36 Headline yield is only a return if it is paid from cash the business can spare.
X. Epilogue
Tonight, NAT is sitting in the sweetest spot a tanker owner can occupy, with booming fixtures, a sharply higher share price and rising dividends.14215 Every incentive in the room points toward optimism.
The next few weeks will put that optimism on the record. On November 20, 2026, shareholders will vote at the annual general meeting, with the outcome, including the level of support for each director, to be disclosed afterward.17 On November 30, NAT is scheduled to report its third-quarter results.1 Those results will show the third-quarter fleet-average TCE, the number of spot days booked, operating cash flow, and the size of any vessel-sale gains or insurance recoveries that might once again inflate headline profit. Later results will show whether the fixtures Hansson described are flowing into the numbers that matter. The new dividend will be the most visible number. The operating cash behind it will be the most important.
Several outcomes would strengthen the case that this cycle is different. If NAT reports operating cash flow that covers the dividend with room to spare after drydocks and debt service, the 2025 shortfall starts to look like a temporary hole rather than a pattern. If it arranges financing for the two 2028 newbuildings on reasonable terms and uses some of the boom to reduce debt rather than only to raise the payout, it would be showing the kind of balance-sheet discipline its history has lacked. If it avoids selling new shares through its at-the-market program while the share price is strong, that would also be telling.
Other outcomes would point the other way. A payout that rises to absorb nearly all operating cash, debt that stays near its 2025 high, newbuildings financed with more secured borrowing and continued at-the-market share sales would suggest that NAT is repeating its familiar pattern: paying out the boom and borrowing through the bust.
Management has framed the current market as potentially one of the best in the company's history. That claim deserves to be judged against normalized earnings, not just against the spot fixtures of a single exceptional month. The real question for NAT is not whether it can earn a lot of money in a great tanker market. It plainly can. It is whether it will leave the boom with a stronger balance sheet, a younger fleet that is paid for, and a dividend that is covered by cash, rather than with a longer streak and the same vulnerabilities as before.
XI. Outro
Somewhere tonight, a NAT Suezmax is sitting off a loading terminal, waiting for its next cargo. When it sails, it may earn at rates that would have seemed absurd in 2018 and may seem absurd again in a few years' time. The dividend has arrived every quarter for nearly three decades.
That streak is NAT's identity, and it is a genuine one. But the dividend does not decide how much cash it can carry. The sea does, and so does the balance sheet. Nordic American Tankers has made its dividend a promise to the world, while the next voyage, the next drydock and the next loan payment decide, quarter by quarter, how much of that promise the business can actually keep.
References
-
Nordic American Tankers Ltd (NYSE: NAT) – The Tanker Bonanza Continues — Nordic American Tankers / GlobeNewswire, 2026-11-09 ↩↩↩↩↩↩
-
2Q 2026 Results, Form 6-K Exhibit 1 — Nordic American Tankers / SEC, 2026-08-27 ↩↩↩↩↩↩↩↩↩↩↩↩↩
-
Annual Report 2025, Form 20-F — Nordic American Tankers / SEC, 2026-04-29 ↩↩↩↩↩↩↩↩↩↩↩↩↩↩↩↩↩↩↩↩↩↩↩↩↩↩↩↩↩↩↩↩↩↩↩↩↩↩↩↩↩↩↩↩↩↩↩↩↩↩↩↩↩↩↩↩↩↩↩↩↩↩↩↩↩↩↩↩↩↩↩↩
-
Crude Tanker Peer Comparison and Market Data — Frontier, refreshed 2026-11-14 ↩↩↩↩↩↩↩↩
-
Investor Relations and Fleet History — Nordic American Tankers ↩↩↩↩↩↩↩↩↩
-
Annual Report 2017, Form 20-F — Nordic American Tankers / SEC, 2018 ↩↩↩↩↩↩↩↩↩↩↩↩↩↩↩↩
-
NAT Acquires Four 150,000 dwt Tankers — MarineLink, 2016-05-02 ↩
-
Status Update Conference Call Transcript — Nordic American Tankers / StockAnalysis, 2023-03-07 ↩↩↩↩↩↩↩↩↩
-
NAT's 2017 Recapitalization Program, Form 6-K — Nordic American Tankers / SEC, 2017 ↩↩
-
Annual Report 2018, Form 20-F — Nordic American Tankers / AnnualReports.com, 2019 ↩↩↩↩↩↩
-
Annual Report 2024, Form 20-F — Nordic American Tankers / SEC, 2025-04-29 ↩↩↩
-
The Hansson Family Now Collectively Own 12 Million NAT Shares — Nordic American Tankers, 2026-10-06 ↩
-
2026 AGM Notice and Proxy Statement, Form 6-K — Nordic American Tankers / SEC, 2026-09-28 ↩↩↩↩
 LinkedIn
 WhatsApp
 Reddit
 Hacker News
 Email
 Kindle
 RSS Feed
 Spotify
 Apple Podcasts
 Amazon Music
 Audible
 YouTube