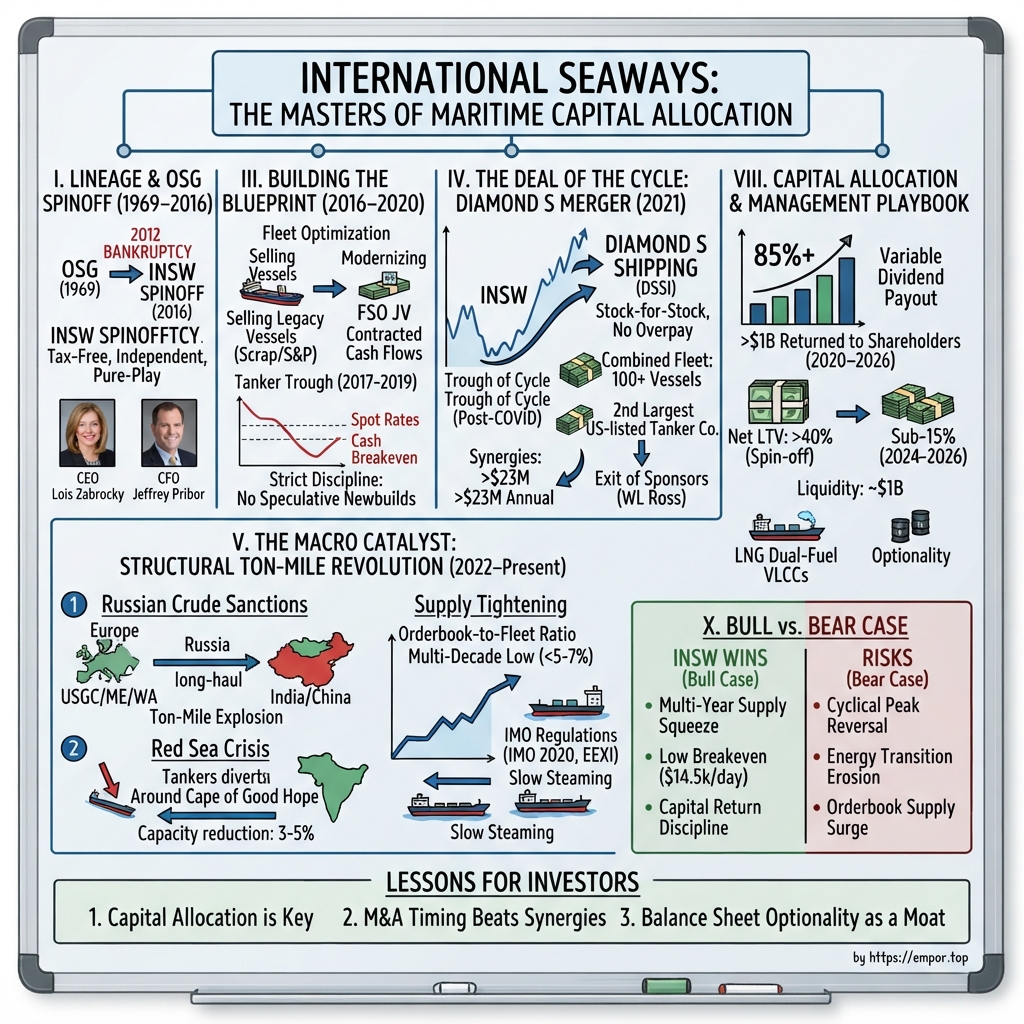
International Seaways: The Masters of Maritime Capital Allocation
I. Introduction & Episode Roadmap
On the morning of Monday, August 10, 2026, a conference call operator named Chase opened the line for International Seaways' second-quarter earnings, and for the next forty minutes the numbers that came out of New York sounded less like a shipping company and more like a royalty stream on global disorder.
Record net income of $295 million. Record adjusted EBITDA of $345 million. Record quarterly free cash flow of $261 million — a figure that beat the company's previous best by nearly $100 million. And then the punchline: a quarterly dividend of $5.05 per share, the largest in the company's history, payable September 24, 2026, on a stock that had spent most of the prior decade being ignored by generalist investors.1
For context on how strange that is: over the trailing twelve months International Seaways declared $12.61 per share in dividends. Against the share price, that was a running yield of roughly 21%.1 Companies do not normally pay out a fifth of their market capitalization in a year unless something is either very wrong or very unusual. In this case it was the latter.
Five years earlier, on March 30, 2021, the same company's stock closed at $18.36, and its pro forma market capitalization after a transformational merger was expected to be "close to $1 billion."2 In late August 2026 the shares traded near $100 and the market capitalization sat just under $5 billion — after paying out well over a billion dollars in cash along the way.3
That is the surface story, and it is the one management tells: a disciplined capital allocator that fixed its balance sheet, renewed its fleet, bought a competitor at the bottom of the cycle, and then handed the winnings to shareholders instead of ordering ships at the top. Chief Executive Lois Zabrocky put it on the Q2 call in almost exactly those words: "It took us nearly 5 years to return our first $1 billion to shareholders and just 6 months to return another $0.5 billion in 2026 alone."[^4]
The harder question — the one this piece is actually about — is how much of that outcome belongs to International Seaways and how much belongs to the world.
Because the other thing that happened in 2026 is that the Strait of Hormuz closed. On March 2, 2026, following U.S. and Israeli strikes on Iran, Iranian forces shut the chokepoint through which roughly a fifth of the world's seaborne oil moves. Very large crude carrier rates from the Middle East to Asia promptly hit their highest levels since the U.S. Energy Information Administration began collecting the data in November 2005. Loaded tankers were trapped inside the Persian Gulf, war-risk insurance costs exploded, and effective global tanker capacity fell off a cliff.4
A tanker company reporting record profits in that environment is roughly as informative as an umbrella vendor reporting record profits during a hurricane. The interesting analytical work is separating the umbrella vendor's merchandising skill from the weather.
So here is the frame. International Seaways is a spot-market commodity shipping business with essentially no pricing power, no switching costs, no customer lock-in, and a product — moving a barrel of oil from A to B — that is indistinguishable from what dozens of rivals sell. Whatever edge exists cannot live in the revenue line. If it exists at all, it lives in three places: the cost of the ships (what you paid and when), the cost of the money (how much leverage sits against those ships), and the discipline of the payout (whether the cash gets returned or re-plowed into steel at the wrong moment).
Those are the only three levers a tanker owner really controls. This episode tests whether International Seaways has actually pulled them better than its peers, or whether a decade of favorable timing has been retrofitted into a strategy narrative.
The route we will take:
- The lineage. How a 2016 tax-driven spin-off from a bankrupt American shipping institution created a debt-light, orphaned pure-play — and why the first three years as an independent company were financially miserable rather than triumphant.
- The blueprint. The 2017–2020 stretch when the company bought modern tonnage cheaply, sold old tonnage, monetized joint ventures, and installed scrubbers — while its market capitalization sank to $700 million.
- The deal. The all-stock merger with Diamond S Shipping in 2021, executed into the worst tanker market in three decades, and whether "bought at the bottom" is genuine skill or comfortable hindsight.
- The macro. Russia, the Red Sea, and now Hormuz — three consecutive re-routings of global energy trade, and the mechanism (ton-miles) by which shipping companies get paid for geopolitical inefficiency.
- The unit economics. Crude versus products, what a commercial pool actually is, and why a sub-$14,500 daily break-even is the single most important number in the business.
- The governance fight. John Fredriksen's arrival with a 16%-plus stake, the board's poison pill, and the genuinely uncomfortable 2023 shareholder vote that followed.
- The playbook and the stress test. How management is paid, what it has actually done with the cash, and what a skeptical investor would attack.
- The spine. Why this business wins from here, what breaks it, and the two or three numbers that will tell you which way it is going.
Let us start where the company started: inside a bankruptcy.
 Subscribe on LinkedIn
II. Lineage & The OSG Spinoff (1969–2016)
In the autumn of 2012, Overseas Shipholding Group was a 43-year-old New York institution, one of the last great American-flag shipping houses, with a fleet that spanned protected domestic Jones Act trades and the wide-open international tanker market. Then, in October, the company withdrew three years of financial statements. Weeks later it filed for Chapter 11.
The proximate cause was not a freight-rate collapse. It was a paragraph in a credit agreement.
For more than a decade, OSG's loan documents had made a controlled foreign subsidiary jointly and severally liable for the parent's debt. Under Section 956 of the U.S. Internal Revenue Code, that kind of guarantee is treated as the foreign subsidiary effectively investing its untaxed offshore earnings in U.S. property — which triggers current U.S. tax. The Internal Revenue Service filed a claim in the bankruptcy for hundreds of millions of dollars. The Securities and Exchange Commission later concluded that the issue had caused OSG to understate its cumulative deferred tax liability by roughly $512 million, about 17% of total liabilities, and brought charges against the company and its former chief financial officer in 2017.5
It is worth sitting with that for a moment, because it sets the tone for everything that follows. A shipping company with real ships, real customers, and real cash flows was destroyed by a financing technicality. Not by freight rates. By a guarantee clause. If you wanted to design an origin myth for a management team that would later become almost fanatical about balance-sheet structure, you could not do better.
The separation
OSG emerged from bankruptcy in 2014, and by October 21, 2016, its board had approved a plan to split the company in two. The logic was clean: the U.S.-flag Jones Act business was protected, cabotage-shielded, and slow-growing, valued on stable contracted cash flow. The international-flag fleet was the opposite — violently cyclical, globally competitive, and valued on where you thought spot rates were going. Housing both inside one entity meant each was permanently mispriced and each had to compete for the same capital and the same management attention.
On November 10, 2016, in the letter accompanying the information statement, Zabrocky — then President of the entity about to be cut loose — described what shareholders were being handed: a fleet of 55 vessels totaling roughly 6.5 million deadweight tons, plus joint-venture interests in four liquefied natural gas carriers and two floating storage and offloading units.6 Every OSG holder received 0.3333 shares of International Seaways for each OSG share held on the November 18 record date, and the distribution became effective at 5:00 p.m. Eastern on November 30, 2016.67
Spin-offs of this shape are interesting to long-term investors for a structural reason rather than a promotional one. The new entity arrives with a shareholder register full of people who did not choose it — index funds that must sell, OSG holders who wanted domestic stability and got global volatility, event-driven funds unwinding a bankruptcy trade. That produces indiscriminate selling unrelated to value. It also arrives, if the separation is done properly, without the parent's legacy tax exposure or conglomerate discount.
What it does not arrive with is a good market. And that is the part of the spin-off story that usually gets edited out.
The people
Two executives defined what International Seaways became, and both are worth knowing properly.
Lois K. Zabrocky did not arrive from consulting or private equity. She holds a degree from the United States Merchant Marine Academy and a Third Mate's license, and she began her career sailing as third mate aboard a U.S.-flag chemical tanker. She joined OSG in 1992 and spent twenty-five years there, running the international product carrier and gas business, then serving as chief commercial officer of the international flag unit from 2011, then as head of that unit and co-president of OSG from August 2014 — with responsibility for roughly 50 vessels and 300 shore staff — before taking the chief executive role at the spin-off.8
That biography matters because of what it implies about how she thinks. Zabrocky's formative expertise is commercial: fixing ships, reading routes, understanding which trade lane will be short of tonnage in three weeks. On earnings calls she still talks like a chartering manager rather than a chief executive. Asked in May 2026 why the company's medium-range product tankers were outperforming market indices, she gave a four-word answer that no strategy consultant would have written: "we were advantageously positioned."[^10]
Jeffrey D. Pribor, the chief financial officer, is the mirror image — a career maritime financier whose employment agreement was signed on November 9, 2016, three weeks before the spin.8 From 2013 he had been Global Head of Maritime Investment Banking at Jefferies. Before that he spent nearly nine years as chief financial officer of General Maritime, one of the world's leading tanker owners, followed by senior transportation banking roles at DnB NOR Markets, ABN AMRO, and ING Barings.8
Pribor's General Maritime tenure is the important line on the résumé. He was CFO of a tanker company through the 2008 collapse and its long, grinding aftermath — a company that would ultimately restructure. A CFO who has watched a tanker balance sheet fail from the inside tends to have specific, non-theoretical views about leverage. Those views became the company's defining constraint.
What the lesson actually was
The conventional spin-off lesson is that cyclical businesses freed from a parent create entry points. The honest version, in this case, is more qualified. International Seaways was handed a genuinely clean structure — and then spent three consecutive years losing money, reporting net losses of $106 million in 2017, $89 million in 2018, and a small loss in 2019 as spot rates for older, unscrubbered tonnage traded at or below cash break-even.9
The structural gift of the spin-off was not immediate value. It was optionality: an unlevered-enough balance sheet and a management team with no legacy obligations, sitting in front of a market that was about to get very interesting. What they did with the three lean years is the actual story.
III. The Blueprint: Building a Modern Pure-Play Tanker Titan (2016–2020)
By the end of March 2020, with the world locking down and oil briefly worth less than nothing, International Seaways was a public company worth $700 million. It had roughly $150 million of liquidity, including $17 million of restricted cash and a $40 million undrawn revolver. Its fleet-wide cash break-even for 2019 had been $20,400 per day. Its net loan-to-value stood at 41% at year-end.10
That is not the balance sheet of a fortress. It is the balance sheet of a company that has spent everything it had.
And it had. In the investor deck accompanying its first-quarter 2020 results, the company summarized the preceding three years in one line: it had invested roughly $600 million renewing its fleet at the bottom of the cycle, without issuing a single share of equity.10 For a shipping company, that last clause is the whole point. The industry's default response to a downturn is a discounted equity raise that permanently transfers value from existing holders to new ones. International Seaways instead funded fleet renewal by recycling assets.
Selling old, buying modern
The mechanics were unglamorous and repeated relentlessly. In the second quarter of 2018 alone the company sold and delivered a 2000-built VLCC, a 2001-built Aframax, a 2004-built MR, and a 2003-built ULCC.11
The offsetting purchase was the defining trade of the period. On June 14, 2018, International Seaways completed the acquisition of six 300,000-deadweight-ton VLCCs — five built in 2016 and one in 2015 — from Euronav for $434 million, inclusive of assumed debt. The structure is where the discipline shows: $311 million of the consideration was the assumption of existing debt secured by the vessels under a China Export & Credit Insurance Corporation facility funded by the Export-Import Bank of China, Bank of China's New York branch, and Citibank. Only the balance was cash.11
Translated: the company swapped a portfolio of fifteen-to-twenty-year-old ships nearing the end of their economic lives for six of the most modern crude carriers afloat, at a moment when nobody wanted them, and paid for most of it with debt already attached to the hulls. The vessels came out of Euronav's absorption of Gener8 Maritime — a forced-seller situation created by someone else's consolidation. Buying from a motivated seller in a bad market is not a strategy you can execute on demand. It is a strategy you can only execute if you are solvent and paying attention when the opportunity appears.
Harvesting the joint ventures
International Seaways inherited two categories of non-core assets from OSG, and it monetized both.
The first was a stake in four LNG carriers, sold for $123 million in cash — proceeds that went straight into deleveraging and fleet renewal.10
The second was the floating storage and offloading business: two converted ULCCs, the FSO Asia and FSO Africa, jointly owned with Euronav and moored at Qatar's Al Shaheen (الشاهين) field, where they had served without interruption since 2010. In May 2017 the joint ventures signed two five-year contracts with North Oil Company — the field's operator, owned by Qatar Petroleum and TotalEnergies — expected to generate more than $360 million of EBITDA for the ventures over their duration.12 In April 2018 the FSO joint ventures closed a credit facility from which International Seaways received $110 million of proceeds.11
These were genuinely contracted, non-cyclical cash flows — the opposite of the spot fleet. Which makes what happened next instructive. In 2022, with the tanker cycle turning, International Seaways sold its entire 50% equity interest in the floating storage joint venture to Euronav for net cash proceeds of $140.1 million, and in the same year doubled its regular quarterly dividend from six cents to twelve.13
A management team that valued stability for its own sake would have kept the FSOs. This one sold its most stable asset at the moment the cyclical assets were about to earn multiples of it. That is a coherent position — own the volatility, sell the annuity, keep the balance sheet clean enough to survive the volatility — but it is a position, and it is worth naming as one rather than treating it as obviously correct. It leaves shareholders with essentially undiluted exposure to spot tanker rates and no meaningful contracted floor.
The scrubber bet
The last piece of the 2016–2020 blueprint requires a short technical detour, because it is the kind of thing that decides shipping profits and gets skipped in most write-ups.
From January 1, 2020, the International Maritime Organization capped the sulfur content of marine fuel worldwide at 0.5%, down from 3.5%. Owners had two choices. Burn compliant very-low-sulfur fuel oil, which is more expensive. Or install an exhaust gas cleaning system — a "scrubber" — which washes sulfur out of the exhaust and lets the ship keep burning the cheap high-sulfur stuff.
The economics are pure arbitrage on the price spread between the two fuels. A scrubber is a fixed capital cost; the payoff is proportional to how much fuel the ship burns. Which is why the decision is not fleet-wide but vessel-specific: it makes sense on the biggest, thirstiest ships on the longest voyages, and rarely on small ships doing short hops.
International Seaways read it exactly that way, planning ten scrubber installations concentrated on its modern VLCCs — vessels representing roughly 40% of total fleet fuel consumption — and budgeting approximately $37 million for scrubbers and ballast water treatment systems in 2020 against $20 million of drydock spend.10 The program was then extended across the enlarged fleet: by the end of 2022, twelve vessels carried scrubbers, including a 2012-built Suezmax inherited from the Diamond S transaction.13
That sequence — commit to the capital project, then delay it when the opportunity cost spikes — is a small thing. But small operational decisions compound in a business where a ship off-hire earns nothing.
What it added up to
By the eve of the 2020s the company had a young crude fleet, a scrubber advantage on its largest vessels, no equity dilution, and a first dividend — initiated at six cents a quarter, later doubled to twelve. Pribor's framing years later was that twelve cents was deliberately chosen as an amount "that is permanent that we're confident through the cycle."[^4]
What it did not have was scale, liquidity depth, or a product-tanker business of any consequence. In March 2021 it went and bought one.
IV. The Deal of the Cycle: Merging with Diamond S Shipping (2021)
Consider the situation on March 31, 2021, when International Seaways and Diamond S Shipping announced their merger.
Global oil demand had cratered the year before. The floating-storage boom that briefly rescued 2020 tanker earnings had ended, and the barrels stored at sea were now being drawn down — which meant ships that would otherwise be carrying new cargo were instead delivering old inventory. Spot rates were at levels that would produce, for International Seaways, a full-year 2021 net loss of $134 million on revenue of just $273 million.9 Tanker equities were unloved to the point of invisibility.
This is precisely when consolidation is cheapest and hardest. Cheapest because asset values and share prices are depressed. Hardest because every board is frightened, every balance sheet is stressed, and nobody wants to be the buyer who catches the falling knife.
The structure
The transaction was all-stock. International Seaways shareholders would own approximately 55.75% of the combined company and Diamond S holders 44.25%, based on fully diluted share counts as of March 30, 2021 — an exchange ratio of 0.55375 International Seaways shares per Diamond S share. Enterprise value of the combined entity was put at approximately $2 billion. Pro forma, the company would operate 100 vessels aggregating 11.3 million deadweight tons, with shipping revenues above $1 billion and more than 2,200 employees, making it the second-largest U.S.-listed tanker company by vessel count and third-largest by deadweight.2
Management guided to annual cost synergies in excess of $23 million and revenue synergies of $9 million, both fully realizable within 2022. Pro forma combined net leverage at year-end 2020 would have been 42%, described as among the lowest in the tanker sector, with over $300 million of combined cash. Estimated pro forma market capitalization: close to $1 billion.2 The deal completed on July 16, 2021, with International Seaways surviving as the parent, retaining the name, the New York listing, and Zabrocky as chief executive.14
Did they overpay?
The honest answer requires separating four different questions that usually get collapsed into one.
Did they pay a control premium? No. This was a stock-for-stock exchange struck close to relative net asset value, with no cash consideration and no cash-out for either shareholder base. In an industry where cyclical buyers routinely pay cash premiums at peaks using debt raised against peak asset values, refusing to do either is the single most important structural feature of the deal. It is also the least glamorous.
Did they take on toxic leverage? No. The combined pro forma net leverage of 42% was high by the standards of the company today but ordinary by the standards of 2021 shipping, and it came without a new debt package layered on to fund a premium.2
Did the synergies materialize? Management said they did, and the guided targets were modest relative to deal size — roughly $32 million of combined cost and revenue synergies against a $2 billion enterprise value, or about 1.6%. That is a low bar deliberately set. Investors should be skeptical of synergy claims in shipping generally, because vessel operating costs are largely fixed per ship and the genuine savings are duplicate public-company overhead: one board, one audit fee, one listing, one general and administrative structure. Those savings are real but small, and they were never the reason to do this deal.
Was the timing good? Here the record is more interesting than the marketing. The merger closed into an extraordinarily bad market and stayed in one for another six months. The combined company's 2021 results were a loss. Anyone marking the deal at the end of its first full quarter would have concluded that management had doubled down at exactly the wrong moment. It was only from mid-2022 onward — after Russia's invasion of Ukraine rewired global crude and product flows — that the fifty-odd medium-range product carriers acquired from Diamond S became the single best-performing asset class in the fleet.
That distinction matters. The bull version of this story is that management brilliantly identified the trough. The defensible version is that management bought assets at replacement-cost-discounted prices using paper, without leverage, at a time when doing so was survivable if the recovery took three more years — and then got a geopolitical accelerant it did not forecast. The skill was in the structure, which was entirely within management's control. The magnitude of the payoff was in the timing, which was not.
By May 2022 the company was describing the effect plainly: the Diamond S acquisition "doubled our net asset value, tripled our fleet size, and enhanced our earnings power, in particular by adding attractive product tankers that are now leading the market recovery."15
The sponsors' exit
There is a second-order feature of this deal worth flagging, because it explains why the transaction was available at all.
Diamond S had reached the New York Stock Exchange in 2019 through a combination with Capital Product Partners' tanker fleet rather than a conventional initial public offering, and its register was consequently dominated by holders with finite patience. As of June 1, 2021, affiliates of WL Ross & Co. beneficially owned 22% of Diamond S, and shareholders affiliated with Capital owned another 6.9%; both signed voting and support agreements committing their shares to the merger.16
International Seaways had a mirror-image problem of its own. Cyrus Capital Partners — a distressed-debt investor that had come in through the OSG restructuring — beneficially owned roughly 14.3% of International Seaways as of the same date and signed its own support agreement, and its partner Joseph Kronsberg sat on the board.16 Both companies, in other words, were part-owned by funds that needed an exit.
Private equity holding a fifth to a quarter of a small-cap shipping company is an overhang problem with no good solution. Selling into the open market crushes the price. Holding forever is not an option. A merger into a larger, more liquid vehicle converts an illiquid concentrated stake into a liquid diversified one that can be distributed over time.
For International Seaways this cut both ways. It made the seller motivated — which is why the terms were achievable — but it also imported a shareholder base structurally inclined to sell. Craig H. Stevenson, Jr., Diamond S's chief executive, joined the International Seaways board, where he still serves and where, as of April 2026, he held 192,820 shares.17
The combined company that emerged in July 2021 had scale, a genuinely diversified fleet across crude and clean trades, and a balance sheet that could survive another two bad years. What it got instead was the largest re-routing of seaborne energy since the closure of the Suez Canal.
V. The Macro Catalyst & Structural Ton-Mile Revolution (2022–Present)
To understand why the last four years have been so extraordinary for tanker owners, you have to understand a measure that almost never appears in consumer news coverage: the ton-mile.
Here is the simplest way to think about it. A shipping company does not sell barrels. It sells ship-days. If the world consumes exactly the same amount of oil next year but every cargo has to travel twice as far to reach its buyer, then the world needs roughly twice as many ship-days to move it — and the effective supply of ships is halved without a single vessel being scrapped. Demand for tankers is not oil demand. It is oil demand multiplied by distance.
Since 2022 the distance term has been repeatedly, structurally increased by geopolitics. Three times.
Act one: Russia, 2022
Before the invasion of Ukraine, Russian crude moved from Baltic and Black Sea ports to European refineries on short voyages measured in days. Western sanctions, the G7 price cap, and the European Union's embargo did not eliminate those barrels. They redirected them. Russian crude began sailing to India and China on voyages measured in weeks. Europe, meanwhile, replaced the lost volumes with crude from the U.S. Gulf Coast, West Africa, and the Middle East — also long-haul.
The oil kept flowing. The map got longer. Ton-mile demand expanded sharply with no increase in global consumption. This was the mechanism that turned International Seaways' 2021 loss into 2022 net income of $388 million and then 2023 net income of $556 million on revenue of $1.07 billion — the company's most profitable year on record until 2026.9
A second-order effect emerged alongside it. A large fleet of ageing, opaquely owned tankers — the so-called dark or shadow fleet — began carrying sanctioned barrels outside the mainstream market. On the February 2026 call, Zabrocky noted that more than 150 VLCCs sat on the U.S. Office of Foreign Assets Control sanctions list, and Chief Commercial Officer Derek Solon added that a good portion of them were over twenty years old, running at low utilization.[^20] The analytically important point is that these vessels are simultaneously competition for cargo and, because they are old and increasingly unemployable, future scrapping candidates that shrink long-run supply.
Act two: the Red Sea, 2023–2024
The second lengthening came at باب المندب Bab-el-Mandeb, the strait at the southern end of the Red Sea. Houthi attacks on commercial shipping from late 2023 made the Suez Canal route between the Middle East, Asia, and Europe unacceptably risky for many operators, who diverted around the Cape of Good Hope instead — adding on the order of ten to fourteen sailing days per voyage. The mechanism is identical to the Russian rerouting: same cargo, longer distance, more ship-days consumed, less effective capacity available to everyone else.
Act three: Hormuz, 2026
And then the third act, which is qualitatively different in scale.
On the May 2026 call Zabrocky framed it directly: "The current tanker market is as volatile as it has been in some time, particularly in reaction to the conflict in the Strait of Hormuz." She noted that roughly 15 million barrels per day of crude — nearly 40% of seaborne volumes — normally transit the strait, and that partial offsets had emerged, including Saudi barrels moving west to Yanbu on the Red Sea, inventory draws, and the release of Russian barrels that had accumulated on the water. Her conclusion was blunt: those sources "have not fully replaced the volumes typically moving through the street."[^10]
The market consequence was visible in the numbers. Peak March 2026 rates for VLCCs out of the Middle East were the highest in the two decades the EIA has tracked, driven by physical attack risk, extreme war-risk insurance costs, and the fact that laden vessels were trapped inside the Gulf, removing them from global supply. Rates from the U.S. Gulf Coast hit records too, as charterers scrambled for any hull anywhere. Clean tanker and gas carrier rates rose in sympathy. The U.S. Department of Homeland Security issued a temporary Jones Act waiver on March 17, 2026.4
By August, management was describing Hormuz plus renewed Houthi activity at Bab-el-Mandeb as together disrupting waterways that had historically handled nearly 25 million barrels per day of crude and products.[^4]
The uncomfortable part
Here is where a neutral reading diverges sharply from the promotional one.
Management itself laid out the two-sided nature of this on the August call, and deserves credit for doing so. If disruptions ease, inventory replenishment becomes a new source of tanker demand as governments rebuild strategic reserves that have been heavily drawn down. If disruptions persist, "the risk shifts to consumption" — a sustained dislocation of this magnitude could damage the global economy and oil demand itself.[^4]
Read that carefully. The company's best quarter in history was produced by an event that, if it continues long enough, destroys the demand base underneath it. That is not a durable competitive advantage. It is a windfall with a fuse attached, and the fuse length is unknowable.
Solon's answer on the reopening scenario was more textured than a bull would like and more constructive than a bear would expect. He argued that when Hormuz reopens, more ships will be able to call the Arabian Gulf, more barrels will flow, and the resulting congestion as hundreds of laden vessels finally discharge into Asia will itself absorb capacity — while depleted inventories and a global push for supply-chain resilience should drive restocking demand.[^10] That is a plausible chain of reasoning. It is also, unavoidably, a forecast from a party with an interest in the answer.
The supply side — and a correction worth making
The bull case in tanker shipping has for four years rested on a historically small orderbook. That premise now requires updating, and to management's credit they updated it publicly rather than quietly.
On the May 2026 call, Zabrocky acknowledged that with a fleet this old and earnings this strong, "it is natural to see that the order book is creeping up," and put it at roughly 16% of the existing fleet, up from the end of 2023.[^10] By August the framing had shifted to context rather than denial: yes, the orderbook has grown, and yes, an attractive financing environment is encouraging owners to order — but each year of scheduled deliveries is matched by a comparable or larger cohort of ships turning twenty. Roughly 30% of the world tanker fleet is over twenty years old today, and by 2030 that figure is expected to exceed 50%.[^4]
The removal-versus-delivery arithmetic is the crux of the supply argument, and it is genuinely strong. But investors should hold it loosely for one reason: scrapping is a choice, not a mechanical event. Twenty-year-old tankers do not disintegrate. In a market paying $100,000 a day, owners will keep them trading — inside the sanctioned trades if necessary — for years past what any orderbook chart implies. The removal cohort only removes itself when rates fall. Which means the supply cushion the bulls rely on arrives precisely when it is least needed.
Two further supply constraints are more concrete. Korean yards — 한화오션 Hanwha Ocean, 삼성중공업 Samsung Heavy Industries, HD현대중공업 HD Hyundai Heavy Industries — have limited berth capacity and competing high-value work in gas carriers, which caps how fast tanker supply can respond. And environmental regulation, in the form of the IMO's efficiency and carbon-intensity requirements, pushes older vessels toward slower steaming and retrofit downtime, both of which absorb effective capacity.
Whatever the eventual resolution, the mechanism that makes International Seaways money is now clear. The next question is how that mechanism translates into cash at the vessel level.
VI. Segment Deep Dive & Unit Economics: Crude vs. Product Carriers
Strip away the geopolitics and a tanker company is a rental business with two product lines and one number that decides everything.
The two product lines are dirty and clean. Crude tankers carry unrefined oil from wellhead regions to refineries. Product carriers — "clean" ships — carry the refined output: gasoline, diesel, jet fuel, naphtha. The cargo tanks are coated differently, the cleaning regimes differ, and once a ship has carried crude it is expensive and slow to convert it back to clean service. So the two fleets are effectively separate markets that happen to rhyme.
International Seaways is deliberately in both. As of August 1, 2026, its operating fleet consisted of 27 crude tankers — ten VLCCs, thirteen Suezmaxes, four Aframaxes, about 5.5 million deadweight tons — and 37 product carriers made up of one LR2, eight LR1s, and 28 medium-range tankers, roughly 2.1 million deadweight tons. Six more LR1 newbuildings sat on order, taking the total operating and newbuild fleet to 70 vessels and just over 8.0 million deadweight tons.1
The crude side: convexity
A very large crude carrier holds roughly two million barrels of oil. A Suezmax carries about half that; an Aframax about a third. These are the biggest, most capital-intensive assets in the fleet, and they behave like leveraged options on tanker scarcity.
The reason is simple arithmetic. Vessel operating costs are close to fixed — crew, insurance, stores, maintenance. Voyage costs are largely fuel and port charges. The daily rate a ship earns after voyage costs, the time charter equivalent or TCE, is therefore almost pure contribution margin above a fixed cost base. When the market is short of ships, charterers bid the rate to whatever they must, because a refinery with no feedstock loses far more than the freight differential.
The 2026 numbers demonstrate the point with unusual clarity. In the second quarter, International Seaways' spot VLCCs earned an average of $118,883 per day, its spot Suezmaxes $100,543, and its spot Aframaxes $69,127. In the same quarter a year earlier, those figures were $39,303, $36,830 and $30,747.1 That is roughly a tripling of the revenue line on a cost base that barely moved.
The company also runs three VLCCs on long-term time charters to an oil major, and here the structure is more interesting than a fixed rate. Those charters carry a base rate plus a market-linked profit-share, split fifty-fifty above the base with no cap on the upside, as Chief Commercial Officer Derek Solon explained on the February 2026 call.[^20] In the second quarter of 2026 that mechanism delivered an average of $214,216 per day on the fixed VLCCs — dramatically more than the spot fleet earned — because the profit share settles against market benchmarks that had gone vertical.1 Management noted that profit sharing contributed $51 million of the quarter's crude revenue and lifted blended VLCC economics above $150,000 per day.[^4]
The lesson for investors is not "time charters are better." It is that the structure of a charter matters as much as the rate. A flat seven-year fixed charter signed in 2021 would have looked prudent and cost shareholders an enormous amount of money in 2026. An uncapped profit-share preserved the upside while providing a floor.
The product side: frequency over size
Product carriers are smaller, call at more ports, and carry cargoes for a wider set of customers. Historically that has made them steadier and less binary than the big crude ships — the medium-range market rarely goes to zero and rarely goes to the moon.
Rarely, not never. In the second quarter of 2026 International Seaways' spot medium-range tankers earned $60,342 per day and its LR1s $79,180, against $18,941 and $32,802 a year earlier.1 Zabrocky observed in May that the dislocation had been extreme enough that "MRs and VLCC rates can now be shown on the same scale, quite an exception."[^10]
The structural driver underneath the clean trades is a slow-moving change in where the world refines. Refineries have been closing in Europe and, to a degree, the United States, while enormous new complexes have opened in the Middle East and Asia. Every closure converts a short domestic pipeline movement into a long international voyage. Layered on top in 2026 were three shorter-term forces management flagged: Ukrainian strikes on Russian refineries removing barrels, difficulties exporting Middle Eastern products, and a United States refining system running flat out and exporting roughly 1.5 million barrels a day of diesel and close to a million of gasoline — trades concentrated in medium-range tonnage. Zabrocky also noted China resuming product exports in July after a long absence, another medium-range market.[^4]
What a pool actually is
The word "pool" appears constantly in tanker disclosure and is almost never explained.
Think of it as a co-operative dispatch desk. Independent owners contribute ships of a similar class to a single commercial manager, which markets the combined fleet to charterers, fixes the cargoes, and then distributes the earnings among members according to each vessel's technical specification and the number of days it made available. Members keep ownership and technical operation; they outsource the chartering.
Why bother? Because in spot shipping, the enemy is the empty leg. A ship that discharges in the Caribbean and has no cargo out of the Caribbean must sail empty to find one, earning nothing for a week. A pool with fifty ships sees far more cargo enquiries than an owner with five, and can therefore match ships to cargoes with less waste. Higher utilization, better voyage chaining, and real-time market intelligence are the product.
As of the end of 2022, International Seaways participated in six commercial pools — Tankers International, Dakota, Penfield, Panamax International, the Clean Products Tankers Alliance, and the Norden Tanker Pool — each chosen for expertise in a specific segment.13
Then, on January 27, 2026, it did something more consequential. A wholly owned subsidiary acquired sole ownership of Tankers International, the VLCC pool founded in 2000 that operates one of the world's largest fleets of modern large crude carriers, with offices in London, New York and Singapore. Tankers International simultaneously launched a new pool to commercially manage Suezmaxes, into which International Seaways contributed its spot-trading Suezmax vessels.118
The economics of that move are worth pulling apart, because it is the closest thing in this business to buying a platform rather than an asset. Pool management generates commission income from third-party members — the company added guidance for "other revenue" representing Tankers International commissions to offset the associated general and administrative costs.[^10] By the second quarter, International Seaways controlled a majority of the vessels in the new Suezmax pool and therefore began consolidating that entity, grossing up both revenues and expenses for third-party ships without changing its own underlying economics.[^4]
A skeptic should ask whether owning the pool creates conflict. Tankers International's own chief executive, Charlie Grey, emphasized at the time that the pooling model retains equal voting rights for members — a governance point that matters, because third-party owners will not contribute ships to a pool controlled by a competitor unless they trust the allocation.18 Whether independent owners keep joining is the test of whether this was a platform acquisition or an expensive act of vertical integration.
The one number that matters
Everything above resolves into a single figure: the fleet-wide spot cash break-even. This is the daily rate the spot ships must collectively earn to cover vessel operating expenses, general and administrative costs, drydocking, maintenance capital expenditure, and full debt service — principal as well as interest.
International Seaways has guided to a break-even below $14,500 per day over the coming twelve months.[^4] Compare that with the $20,400 per day it needed in 2019, and the improvement — roughly $6,000 a day of margin manufactured across a fleet of this size — is the single clearest piece of evidence for the capital-allocation thesis.10 It came from three sources that are all within management's control: newer, more efficient ships; a far smaller debt load; and the removal of the oldest, most maintenance-hungry tonnage.
Operating leverage does the rest. In 2020, with 38 conventional tankers, the company calculated that each $5,000 per day improvement in fleet-wide TCE produced about $68 million of incremental EBITDA and $2.32 of annual earnings per share.10 The fleet is larger now, so the multiplier is bigger — which is precisely why a business earning a blended spot rate of $79,000 per day in the second quarter of 2026, against a break-even under $14,500, converted 74% of its EBITDA straight into free cash flow.[^4]1
There is also a small, easily missed third business: full-service lightering in the U.S. Gulf, where large inbound tankers are partially discharged into smaller vessels so they can enter shallow ports. It contributed about $5 million of EBITDA on $13 million of revenue in the second quarter — immaterial to earnings, but a genuine asset-light service franchise with customer relationships attached.[^4]
The economics, then, are straightforward and brutally cyclical. What is not straightforward is who gets to decide what happens to the cash. In 2022, someone tried to change that.
VII. The Activist Showdown: John Fredriksen vs. The Board (2022–2023)
On April 27, 2022, a Schedule 13D landed at the Securities and Exchange Commission. Famatown Finance Limited — a Cyprus-registered vehicle indirectly controlled by trusts settled by the Norwegian-born shipping billionaire John Fredriksen, and part of the Seatankers group — disclosed that it and its affiliates beneficially owned approximately 16.2% of International Seaways.19
Nobody had seen it coming. The stake had been assembled quietly since March.
To understand the temperature in the room, you need to know who Fredriksen is in this industry. He is the closest thing tanker shipping has to a sovereign — the controlling figure behind Frontline, Golden Ocean, and a constellation of listed vehicles, a man who built his fortune moving Iranian crude during the Iran–Iraq war and who has spent four decades consolidating fragmented shipping markets by buying blocking stakes and then applying pressure. In the same period he was pursuing a very public and ultimately unsuccessful campaign to combine Frontline with the Belgian owner Euronav.
So when Fredriksen affiliates appear on your register with a sixth of the company, the question is not whether they intend to be passive. It is what they want.
The pill
International Seaways' board did not wait to find out. On May 6, 2022 the directors approved, and on May 9 the company announced, a limited-duration stockholder rights plan.20
The mechanics of a poison pill are worth explaining in plain terms, because the name is more dramatic than the machinery. Every shareholder receives a right attached to each share. The rights lie dormant. If any person or group acquires beneficial ownership above a defined threshold without board approval, the rights held by everyone else become exercisable — allowing them to buy stock at a steep discount, which massively dilutes the acquirer. No rational buyer ever triggers a pill. Its purpose is not to be used; it is to force a would-be acquirer to negotiate with the board.
The threshold was set at 17.5% — barely above Famatown's disclosed position, with existing ownership grandfathered at its then-current level but any further purchase triggering the rights. The plan was to expire on May 7, 2023.20
Two days later, after Famatown published an open letter, International Seaways responded publicly. It described the rights plan as a reaction to Famatown's "stealth accumulation of more than 16% of the Company's outstanding shares," argued that no stockholder should gain control through open-market accumulation without paying all holders a control premium, and noted pointedly that this was "particularly appropriate where, as here, affiliates of one of the company's competitors have quickly and secretly amassed a significant stake."15
That last clause is the crux of the board's case, and it is a serious argument rather than boilerplate. Fredriksen is not a hedge fund seeking a re-rating. He is a competitor. A competitor accumulating a blocking stake in a rival can pursue outcomes — a merger on terms favorable to his own vehicles, for instance — that are not identical to what other shareholders would choose.
The counter-argument is equally serious. A pill entrenches incumbents. It removes the disciplining threat of a takeover, which in a business trading persistently below net asset value is precisely the discipline shareholders might want. And the fact that the trigger was set just above the activist's existing stake makes it hard to characterize as a general governance measure rather than a targeted defense.
The 2023 vote
Reasonable people disagreed, and in 2023 they got to vote.
Seatankers escalated in late May with an open letter accusing the board of "a disheartening level of entrenchment, self-interest, and a steadfast refusal to even consider" value-enhancing initiatives, calling the ten-member board bloated, and announcing it would withhold votes from two directors: A. Kate Blankenship and Zabrocky herself. International Seaways rejected the allegations as misleading and noted that Seatankers had chosen to target two of the board's three female directors.21
There is an irony here that is easy to miss. Blankenship has spent much of her career as a director of Fredriksen-affiliated shipping companies. Targeting her looked, to observers, less like a governance critique than a signal.
The results of the June 6, 2023 annual meeting are the most revealing documents in this whole episode, and they do not support a simple "management won" narrative.
Of roughly 40.8 million shares represented, Zabrocky received 23.78 million votes for and 12.54 million withheld. Blankenship received 23.58 million for and 12.74 million withheld. Every other director drew withhold votes in the four-to-six million range. Because withheld votes are treated as abstentions rather than votes cast, all ten directors were duly elected.22
But look at the other two ballot items. The advisory vote on 2022 executive compensation passed with 23.05 million shares in favor and 13.21 million against — support of roughly 64%, a level that in most large-cap contexts would trigger a formal shareholder-engagement response. And the resolution ratifying the amended rights agreement passed with 19.81 million for and 16.46 million against: support of about 55%.22
A poison pill ratified by 55% of votes cast is not a mandate. It is a warning. Roughly one share in three that voted was unhappy with the board's compensation decisions, and something close to 45% of votes cast opposed the takeover defense. Fredriksen alone could not produce those numbers; ordinary institutional holders had to be voting with him.
Where it stands in 2026
Three years on, the situation has evolved in ways that complicate both sides of the argument.
Fredriksen never went away and never escalated. As of a Schedule 13D filed March 12, 2026, Famatown and affiliated entities held 7,810,494 shares, roughly 15.8% of the company — a slightly smaller percentage than in 2022 and still the largest single position on a register that also includes BlackRock at 12.3%, Fidelity's FMR at 9.5%, Vanguard at 8.9% and Dimensional at 6.5%.17 The stake has, in effect, become a long-term holding rather than a raid.
The board, meanwhile, has both liberalized and extended its defense. On April 9, 2026 it amended and restated the rights agreement for a second time, extending final expiration from April 10, 2026 to April 8, 2029 and raising the exercise price from $50 to $95. Critically, the trigger threshold — raised at some point after the original plan to 20% — was left unchanged, as was a "qualifying offer" provision that allows a fully financed, all-shares tender or exchange offer held open for at least ninety business days to proceed without triggering the rights.19
That qualifying-offer carve-out is a meaningful concession. It means a genuine bid for the whole company at a real price is not blocked; only creeping accumulation is.
Shareholders were asked again. At the June 8, 2026 annual meeting, the second amended rights agreement was ratified by 27.24 million shares for against 14.46 million against — approximately 65% support, better than 2023 but still leaving roughly a third of voting shares opposed.23
Everything else at that meeting went the board's way emphatically. Nine directors were elected with withhold votes in the tens of thousands rather than the millions; Zabrocky drew 41.67 million for and just 72,527 withheld. The advisory vote on 2025 executive compensation passed with 41.22 million for and 476,858 against — roughly 99% support, against 64% three years earlier.23
Two changes explain that swing, and only one of them is governance. The board shrank from ten members to nine and its composition turned over, with Kristian K. Johansen and Darron M. Anderson added and several 2023-era directors, including the Cyrus-affiliated Kronsberg, no longer standing.2317 The other explanation is simpler: it is much easier to win a compensation vote in a quarter when the dividend is $5.05 a share.
The honest conclusion is that the governance question was not resolved on the merits. It was resolved by the tanker cycle. A shareholder base collecting a 21% yield does not agitate. Whether the same base would accept the same defenses at $20,000-a-day rates is untested — and that is exactly the sort of latent risk that only becomes visible when conditions turn.
Which brings us to the thing shareholders are actually being paid on.
VIII. Capital Allocation & Management Playbook
In February 2026, an analyst asked Jeffrey Pribor a question that most chief financial officers would have deflected: given how strong the balance sheet had become, why not just raise the fixed dividend?
Pribor's answer was unusually candid about the company's own history. The regular dividend, he recalled, had started at six cents a quarter and been raised to twelve — "in a year where there wasn't much net income, but we said, let's put out an amount that is, as you say, permanent that we're confident through the cycle." Everything above that had been variable. And the reason not to touch the fixed component now was communication discipline: "we didn't want to confuse the message. We want to stay on message, 85% is the expectation."[^4]
That exchange contains the entire capital allocation philosophy, and it is worth taking seriously rather than at face value.
The evolution of the payout
The company's distribution policy was not handed down fully formed. It was built, publicly, over six years, and the trajectory is documented in its own filings.
The regular dividend began at six cents a quarter and was raised to twelve cents in June 2022, alongside a $1.00 supplemental dividend in December of that year — total dividends of $69.8 million for 2022, plus $20.0 million of buybacks at an average price of $29.08.13 Payouts then scaled with earnings: $308.2 million distributed in 2023, $284.4 million in 2024, and $144.6 million in 2025 as profits normalized.9
Then came the formalization. In the fourth quarter of 2025 the board declared a combined $2.15 per share — a payout ratio of 87% of adjusted net income, and the sixth consecutive quarter at or above 75%. Zabrocky explicitly linked the increase to two prior decisions: the balance sheet no longer required cash for deleveraging, and only about $30 million of company cash was needed to take delivery of the remaining newbuildings.[^20] Paying that dividend crossed the $1 billion cumulative-returns milestone since 2020.24
In May 2026 the policy was made explicit: a standing payout ratio of 85% of adjusted net income, plus a discretionary top-up in exceptional quarters.24 By August, the company had delivered a third consecutive quarter at 85% or better.1
What should an investor take from that sequence? Two things, one favorable and one cautionary.
The favorable read is that the policy is genuinely formulaic and therefore hard for management to game. Tying distributions to adjusted net income rather than to a fixed dollar amount means the payout falls automatically in bad quarters. That is a feature, not a bug: it protects the balance sheet without requiring a humiliating dividend cut.
The cautionary read follows directly. This is not a dividend in the sense that a utility investor understands the word. It is a variable distribution that will fall by 80% or more in a normal market, and the 2025 step-down from $284 million to $145 million is the proof. Anyone anchoring on a 21% trailing yield is anchoring on a number that the company itself does not claim is repeatable. Pribor said as much: "there will eventually be a down cycle, right?"[^10]
There is also a legitimate question about the choice of instrument. The company has had a $50 million share repurchase authorization running to the end of 2026 and has barely used it — $6.1 million of buybacks in 2025 against $144.6 million of dividends.91 Asked directly in May 2026 about buybacks versus dividends, Pribor's reasoning was that net asset value kept rising and the share price had been rising with it "and perhaps beyond it," so the discretionary capital leaned toward dividends.[^10] That is a defensible answer — buying back stock above net asset value is value-destructive — but it is also an answer that shareholders should re-test if the stock ever trades at a wide discount again.
Balance sheet: the actual transformation
The deleveraging is the least glamorous and most consequential thing in this story.
At the end of 2022, consolidated net debt to asset value was 23.9%.13 At the end of 2025 it was approximately 13%, with gross debt of $578 million and 31 unencumbered vessels.[^20] By June 30, 2026, net loan-to-value had fallen to roughly 6% — about $250 million of net debt against a fleet third-party appraisers valued at nearly $4 billion, versus roughly $2 billion of vessel cost on the books.[^4]1
Two mechanics did that work. The first was ordinary repayment and refinancing: a $250 million bond issued in the third quarter of 2025 that unencumbered six VLCCs and lowered the cost of debt, followed by repayment of $258 million of sale-leaseback obligations on those same vessels in the fourth quarter.[^20] The second was asset sales — ten older vessels sold in 2025 for $131 million, then seven more in early 2026 (five medium-range tankers averaging eighteen years and two VLCCs averaging fifteen) for $216 million of net proceeds, generating an $88 million book gain.[^20]1
Note the second-order effect that gets little attention: when asset values rise, loan-to-value falls even if no debt is repaid. Pribor acknowledged this directly — "values keep going up. So even without paying down additional debt, we de-lever a little more."[^10] A 6% net loan-to-value is therefore partly an artifact of a peak-cycle appraisal. In a downturn where vessel values fall by a third, the same debt produces a materially higher ratio without a single dollar changing hands. The absolute figures — roughly $250 million of net debt, nearly $1 billion of liquidity, no meaningful maturity until the 2030s, debt almost entirely fixed or hedged at a total cost around 5.5% — are the more durable measures.[^4]
An investor should also register what the deleveraging cost: the fleet shrank. From 100 vessels at the 2021 merger to 84 in mid-2022 to 74 at the end of that year to 70 today.220131 Management frames this as high-grading, and the break-even data supports that framing. But a company that has sold more ships than it has bought for five straight years is running a harvest strategy, not a growth strategy, and shareholders should price it accordingly.
Fleet renewal: the two real capital projects
Against that harvest, two genuine investments stand out.
The first was three dual-fuel LNG VLCCs built at Daewoo Shipbuilding & Marine Engineering — since renamed 한화오션 Hanwha Ocean — delivered in 2023 and placed on seven-year time charters with Shell. The company described them as roughly 40% more efficient than a ten-year-old VLCC and 20% more efficient than a conventionally fueled newbuild, with LNG cutting carbon dioxide emissions about 22% versus conventional marine fuel.13 Those are the vessels carrying the uncapped profit share that produced $214,216 per day in the second quarter of 2026 — a contracted downside floor combined with full participation in the upside, which is close to the ideal structure in a cyclical business.
The second is the LR1 program. Six scrubber-fitted, dual-fuel-ready LR1s were ordered in Korea at an aggregate contract price of approximately $359 million; four had delivered by mid-2026, with the final two due in the third quarter, financed almost entirely through a twelve-year export-credit facility arranged with DNB Bank and K-Sure at SOFR plus 125 basis points on a twenty-year amortization profile.1
Then in the second quarter of 2026, the company ordered four more from K Shipbuilding for $244 million, delivering in the second half of 2028. Zabrocky's justification on the August call was the most concrete evidence in the whole story that this management team thinks in cycle-adjusted terms: the company secured the vessels "at essentially the same price we paid 3 years ago, even as newbuildings prices across the industry increased by double digits," at a yard it knows, for deployment into the Panamax International Pool, which had averaged more than $70,000 per day over the preceding nine months.[^4]
That is the correct way to order ships in a hot market — replacing an ageing cohort at a negotiated price, financed at attractive terms, in a niche where the company has demonstrated pricing outperformance. It is also, unavoidably, ordering ships in a hot market. Four vessels is a modest commitment against a $5 billion market capitalization. But if the discipline story is going to break, this is the line item where it will start.
Incentives
How management is paid is the cleanest available evidence on whether the stated philosophy is real.
International Seaways splits annual equity awards evenly between time-vesting restricted units and performance units. The performance half is itself split in two: one portion vests on three-year return on invested capital, the other on three-year total shareholder return measured against a defined performance peer group of twelve listed owners — Ardmore Shipping, CMB.TECH, DHT Holdings, Frontline, Hafnia, Odfjell, Nordic American Tankers, Scorpio Tankers, SFL, Tsakos Energy Navigation, Teekay Tankers, and TORM. For the March 2025 grants, the cumulative three-year return-on-invested-capital target was 8.72%, with 5.72% paying out at half and 11.72% at 150%. Relative return targets pay 50% at the 25th percentile, 100% at the median and 150% at the 90th.17
Two observations. First, using return on invested capital rather than an earnings or EBITDA measure is the right choice for a capital-intensive cyclical business — it penalizes buying assets expensively, which is exactly the failure mode this industry is prone to. Second, the peer group is unusually honest: rather than restricting comparison to U.S.-listed companies with public compensation data, the board built a separate group that includes the company's actual competitors regardless of jurisdiction.17 That is a deliberate choice to make the bar harder.
The awards that vested on December 31, 2025 paid out at 150% on the return-on-capital half and 112.5% on the relative-return half — strong on absolute capital returns, only modestly above median against peers.17 That split is itself informative: International Seaways has been a good allocator, but in a sector-wide bull market it has not been dramatically better than the sector.
Ownership requirements run to five times base salary for the chief executive and two times for senior vice presidents, and the company states that all directors and executive officers have met them.17 In absolute terms, Zabrocky held 208,745 shares as of the April 2026 record date, Pribor 131,697, and all directors and officers together 842,045 shares — about 1.7% of the company.17 Salaries were raised effective January 1, 2026, with Zabrocky's base moving to $850,000 and her annual equity target opportunity to 400% of salary.23
For context on whether that is aggressive: a chief executive with roughly $21 million of stock at current prices and a $850,000 salary is overwhelmingly paid in equity outcomes rather than cash. The 2023 Seatankers complaint about compensation inflation had real support in the vote count at the time; the 2026 vote suggests the objection has either been addressed or drowned out by performance.
The playbook, then, is coherent and mostly evidenced. Whether it constitutes a durable advantage is a different question — and that requires looking at the industry structure itself.
IX. Strategic Analysis: 7 Powers & Porter's 5 Forces
Here is an uncomfortable exercise for any tanker bull: take Hamilton Helmer's framework, which asks what allows a company to sustain differential returns, and apply it honestly to a business that rents identical steel boxes at a market-clearing price.
Most of the boxes come back empty.
Switching costs: none. A charterer choosing between two modern, well-vetted Suezmaxes for the same voyage faces essentially no cost in picking the cheaper one. There is no installed base, no data lock-in, no integration. This is the defining fact of the industry and no amount of narrative changes it.
Branding: minimal, but not zero. Oil majors run vetting regimes — inspections, safety records, incident histories — and a poor record can disqualify an owner from a customer's approved list entirely. That creates a threshold effect rather than pricing power. Clearing the bar is necessary; clearing it beautifully does not command a premium. The company's stated primary objective is "safe and reliable vessel operations," which is best read as maintaining the license to compete rather than as an advantage.13
Network economies: weak, with an interesting exception. Pools do exhibit a mild network effect — more ships attract more cargo enquiries, which improves matching for all members, which attracts more ships. Owning Tankers International outright converts a share of that effect into a proprietary asset and a commission stream. But pool membership is voluntary and portable; a member unhappy with allocations can withdraw its vessels. Call this a real but shallow moat.
Scale economies: moderate. Real, and located in two places. General and administrative cost per vessel falls with fleet size — the central justification for the Diamond S synergy target. And larger, better-capitalized owners borrow more cheaply, which flows directly into the break-even. A cost of debt around 5.5% with no near-term maturities is a genuine competitive input, not a vanity metric.[^4] Scale in chartering, however, does not confer pricing power, because the market clears on spot supply and demand.
Cornered resource: limited and contingent. Two candidates. First, access to quality shipyard slots at negotiated prices — the ability to order four LR1s at three-year-old pricing from a known Korean yard is a relationship asset that a first-time buyer cannot replicate.[^4] Second, the management team's commercial experience. Neither is proprietary in the way a patent or an ore body is.
Process power: the strongest claim, and still contestable. The compounding operational discipline that took the fleet-wide break-even from $20,400 to under $14,500 per day is not a single decision; it is hundreds of them, sustained across a decade. Peers have not all achieved it. But process power in Helmer's sense requires that rivals cannot copy the process, and nothing here is secret. It is simply hard and boring.
Counter-positioning: the most interesting and the most overstated. The bull argument is that a low-leverage, high-payout model is something debt-laden peers cannot imitate without abandoning growth ambitions their sponsors demand. There is something to this: a company that pays out 85% of earnings cannot simultaneously order twenty ships, and the discipline is structural rather than discretionary. But counter-positioning requires that incumbents be unable to respond. In this industry, several peers have adopted similar variable-payout policies. The model is imitable, and increasingly imitated.
The honest summary is that International Seaways possesses a modest cost-and-balance-sheet advantage and a small commercial-platform advantage, in an industry where the dominant variable is a freight rate nobody controls. That is not nothing. It is also not a moat in the way software investors use the word.
Porter's five forces: the war game
Threat of new entrants — moderate, and rising. The classic barrier in shipping is not capital; it is shipyard capacity and delivery lead times. Berth availability at quality Korean yards is genuinely constrained by competing high-value gas-carrier work. But the barrier is time, not permanence. And the barrier is visibly weakening: management itself acknowledged the orderbook rising to roughly 16% of the fleet, with an attractive financing environment pulling new capital in.[^10] Anyone with equity and patience can enter. They just have to wait three years.
Supplier power — moderate to high. Two supplier groups matter. Shipbuilders in Korea, China and Japan operate as a concentrated oligopoly with the pricing power that comes from a full order book; newbuild prices have risen by double digits.[^4] Bunker fuel suppliers price off refined product markets that owners cannot influence — which is precisely why scrubbers, which arbitrage the fuel spread, mattered so much. Crew is a third and under-discussed constraint: qualified seafarers for large tankers are in structurally short supply.
Buyer power — moderate. Customers are oil majors, national oil companies, refiners and trading houses — sophisticated, well-informed, and perfectly capable of playing owners against each other. In a slack market their power is close to absolute. In a tight one it inverts entirely. Zabrocky's February 2026 observation captured the shift: charterers were moving from relaxed to actively "making sure that they have access to vessels," a change she read as structurally positive for owners.[^20] A striking illustration came in August 2026, when she noted Abu Dhabi buying VLCCs outright — customers vertically integrating into ownership because chartering had become too uncertain.[^4]
Threat of substitutes — low. Pipelines are geographically fixed and cannot cross oceans. No alternative exists for intercontinental movement of crude and refined products at commercial scale. The genuine substitution risk is not modal but volumetric: less oil consumed means less oil shipped. Note also that the Hormuz crisis has spurred Gulf producers to accelerate bypass pipeline projects — Zabrocky described "a lot of CapEx being put to work for long-term solutions," while adding that none of it had translated into long-term charters.[^4] Those projects are substitutes for a specific route, not for seaborne transport.
Rivalry — high and structurally fragmented. The compensation peer group alone lists twelve listed competitors, and the listed universe is a minority of the market; most tanker tonnage is privately held.17 Fragmentation prevents supply discipline: no owner can restrain the fleet, so every owner orders when returns look good, which is what produces the cycle in the first place.
One dynamic is worth flagging as genuinely new. Consolidation is beginning. Asked about Sinokor Merchant Marine's accumulation of VLCC tonnage, Zabrocky called it "a restructuring of the ownership base" and "a fundamental shift" in a historically fragmented market, arguing that a large owner gathering unsanctioned tonnage strengthens the position of all compliant owners.[^20] If concentration continues, the industry's worst structural feature — its inability to restrain supply — could soften. That would be a genuine change in the forces above. It has not happened yet.
X. Bull vs. Bear Case, Key KPIs & Risk Radar
Every cyclical investment eventually reduces to a single argument about duration: how long does the good part last, and what does the business look like on the other side. For International Seaways in August 2026, that argument has unusually sharp edges, because the proximate cause of its record earnings is a war.
Why it wins from here
The supply arithmetic is genuinely favorable, even after the orderbook grew. The bull case does not require the orderbook to stay at historic lows. It requires deliveries to be smaller than removals. Management's framing is that each year of scheduled deliveries is matched by a comparable or larger cohort of vessels turning twenty, that roughly 30% of the world tanker fleet is already over twenty years old, and that the figure should exceed 50% by 2030.[^4] Layer on the 150-plus VLCCs sitting on sanctions lists — mostly old, poorly maintained, and running at low utilization, per the company's own commercial team — and the pool of vessels that must eventually leave the compliant trade is large.[^20]
The cost position is measurable and durable. A break-even under $14,500 per day is not a forecast; it is an outcome of decisions already made — debt already repaid, old ships already sold, newbuildings already financed at fixed spreads with no maturity wall until the next decade.[^4] It means the company survives rate environments that would push leveraged competitors into restructuring, and it means an enormous share of every incremental dollar of freight reaches equity holders.
The capital-return framework structurally prevents the industry's classic error. Distributing 85% of adjusted net income mechanically removes the cash that would otherwise fund peak-price ordering. This is the most credible single element of the thesis, because it is a constraint rather than an intention.
Commercial platform ownership is a new, if modest, source of non-freight income. Consolidating Tankers International converts pool participation into a business with third-party commission revenue and a widened cargo book.
What breaks the case
Resolution is the biggest risk, and it is the one nobody can time. If Hormuz reopens durably, if the Red Sea normalizes, if a Russia–Ukraine settlement restores short-haul European crude flows, then ton-miles compress and the fleet that was too small becomes adequate overnight. Management's counter — that reopening brings congestion, restocking demand, and depleted inventories that must be rebuilt — is coherent and was argued in detail on the May 2026 call.[^10] But it is a company's argument about its own tailwind, and it should be weighed as such. The bear's version is simpler: the rate spike was caused by a chokepoint closure, and closures end.
The demand base can be damaged by the very disruption that inflates rates. This is management's own stated risk. A sufficiently prolonged dislocation "could ultimately weigh on the global economy and oil demand," which would hurt tanker demand through the volume term even as the distance term stays elevated.[^4] Notably, commercial inventories have held up largely because strategic petroleum reserves have absorbed the shock — a buffer that is finite.[^4]
Supply responds, with a lag. The orderbook has climbed from its trough to roughly 16% of the fleet.[^10] Vessels ordered in 2026 deliver in 2028 and 2029. If rates stay extraordinary for another two years, ordering accelerates, and the industry does what it has always done — builds its way out of a bull market. The removal-versus-delivery math that supports the bull case depends on owners actually scrapping old ships, which they will not do while those ships are profitable.
Asset-value risk is embedded in the balance sheet metrics. A 6% net loan-to-value flatters the picture because the denominator is a peak-cycle appraisal. Book value of the fleet is roughly half its appraised value.1 In a normalization, the equity value of the company falls with vessel prices regardless of what happens to the debt.
Long-run demand. Electrification of transport and improving efficiency put crude volume growth into question over a decade-plus horizon. This is a slow variable and a poor reason to trade, but it matters for terminal value: the residual worth of a twenty-year-old tanker depends on the world still needing tankers in the 2040s. Product carriers may prove more resilient than crude carriers here, since refined-product trade patterns are driven as much by refinery geography as by aggregate volume.
Governance remains an unresolved question rather than a settled one. A rights plan extended to 2029 with roughly a third of voting shares opposed, alongside a competitor holding 15.8% who has neither exited nor escalated, is a stable equilibrium only while returns are extraordinary.1917
Concentration and disclosure caveats. Two second-order items deserve a mention. The consolidation of the Tankers International Suezmax entity grosses up reported revenues and expenses with third-party vessels' economics, which management excludes from its per-day metrics — a reasonable treatment, but one that makes headline revenue less comparable across periods.[^4] And the difference between reported net income and adjusted net income can be large: the first quarter of 2026 showed $286 million reported versus $194 million adjusted, the gap driven largely by vessel-sale gains.24 Since the dividend policy is set against the adjusted figure, the definition of "adjusted" is a live governance detail, not an accounting footnote.
The three numbers that matter
An investor tracking this company does not need a dashboard. Three series carry almost all the information.
1. Blended fleet-wide spot TCE versus the stated cash break-even. This is the cash engine, and both halves are disclosed every quarter, including bookings-to-date for the current quarter. The gap between the two — $79,000 per day against under $14,500 in the second quarter of 2026 — is what converts into free cash flow and therefore into the dividend.[^4] Watch the direction and the width, not the absolute level. A narrowing gap is the earliest warning available.
2. The global orderbook-to-fleet ratio, read alongside removals. This is the industry's supply clock, and the single leading indicator of whether the current environment persists into 2028 and beyond. The number is only meaningful in context: an orderbook of 16% against a fleet where 30% of vessels are over twenty years old is very different from the same 16% against a young fleet. Track the ratio of scheduled deliveries to genuine removal candidates, and treat actual demolition activity — not the theoretical age profile — as the confirming evidence.
3. Net loan-to-value. The solvency and optionality gauge. It answers whether the company can survive a two-year trough without dilution and whether it retains capacity to buy assets when others are forced sellers. Read it skeptically at cycle peaks, when rising appraisals do the work, and read it carefully on the way down, when the same debt against lower values tells you how much cushion actually existed.
Everything else — quarterly earnings, dividend headlines, individual vessel transactions — is downstream of those three.
XI. Epilogue & Lessons for Investors
There is a moment in the August 2026 earnings call that captures what International Seaways has become, and it is not the record dividend.
An analyst from BTIG, looking at a balance sheet with almost no debt and nearly a billion dollars of liquidity, asked whether the company would consider growth outside conventional crude and product tankers. Zabrocky started to hand the question to her chief financial officer, then took it back. The answer was that the company continues to look for niche opportunities where it can gain an advantage, "but right now, we're sticking to the oil tanker space."[^4]
In an industry whose history is a graveyard of owners who diversified into dry bulk, offshore, containers or gas at precisely the wrong point in each of those cycles, declining to expand your circle of competence while sitting on a mountain of cash is a real decision. It may not be the profit-maximizing one. It is the one least likely to destroy capital.
Three lessons generalize beyond shipping.
Structure beats timing, and structure is what you actually control. The Diamond S transaction is remembered as a bottom-of-the-cycle masterstroke, and in outcome terms it was. But the decision that made it survivable was structural: all stock, near relative net asset value, no cash premium, no new leverage. Had the recovery taken three more years, the company would still have been standing. Investors evaluating cyclical acquirers should look first at how a deal is financed and only second at when it was struck, because management can be judged on the first and merely lucky on the second.
In commodity businesses, the payout policy is the strategy. International Seaways has no pricing power and no switching costs. What it has is a mechanism that removes cash from the building before it can be spent on ships at the wrong price. The relevant comparison is not against companies with moats; it is against the version of this company that would have retained the 2023 and 2024 windfalls and ordered a dozen VLCCs at peak prices. That counterfactual has destroyed more shipping equity than any freight-rate collapse ever has.
A low break-even is the only moat available in a market-clearing industry. When everyone sells the same product at the same price, the only durable edge is being able to earn a profit at a rate that costs a competitor money. The journey from $20,400 per day to under $14,500 was not a strategy announcement. It was a decade of unglamorous debt repayment, vessel sales, and refinancing. It is also the reason the company can promise, credibly, to survive whatever comes after this cycle.
What International Seaways has not proven — and cannot prove until the next trough — is that this is a permanently better business rather than a well-run one that caught three consecutive geopolitical tailwinds. A total shareholder return compounding at over 30% annually since 2016 is a genuine number, and one that management now leads with.[^4] It is also a number measured from a spin-off in a depressed market to a peak produced by a closed strait.
The company's own framing on that August call was more careful than the headline figures suggested: markets will evolve, disruptions may ease or persist, and the priorities remain what they have been — allocate with discipline, renew the fleet, preserve flexibility, return capital.[^4] That is the right list. Whether it is executed as faithfully when the blended spot rate begins with a two rather than a seven is the question that will determine whether this decade was a strategy or a season.
References
-
International Seaways Reports Second Quarter 2026 Results — Form 8-K, Exhibit 99.1, SEC, 2026-08-10 ↩↩↩↩↩↩↩↩↩↩↩↩↩↩↩
-
International Seaways and Diamond S Shipping Announce Merger — Form 425, Exhibit 99.1, SEC, 2021-03-31 ↩↩↩↩↩
-
International Seaways (NYSE: INSW) Company Profile & Market Data — Bloomberg ↩
-
Middle East crude oil tanker rates reach record highs — U.S. Energy Information Administration, Today in Energy, 2026-03-26 ↩↩
-
Shipping Conglomerate and Former CFO Charged With Failure to Recognize Hundreds of Millions in Tax Liabilities — U.S. Securities and Exchange Commission, Press Release 2017-29 ↩
-
International Seaways, Inc. Information Statement — Form 10-12B/A, Exhibit 99.1, SEC, 2016-11-10 ↩↩
-
OSG Completes Spin-Off of its International Business, International Seaways — Business Wire, 2016-12-01 ↩
-
International Seaways, Inc. Annual Report on Form 10-K for 2019 — SEC, 2020-03-03 ↩↩↩
-
International Seaways, Inc. — Annual and quarterly reports filed with the SEC (CIK 0001679049) ↩↩↩↩↩
-
International Seaways First Quarter 2020 Earnings Update Presentation — Form 8-K, Exhibit 99.1, SEC, 2020-05-08 ↩↩↩↩↩↩
-
International Seaways Reports Second Quarter 2018 Results — Form 8-K, Exhibit 99.1, SEC, 2018-08-08 ↩↩↩
-
International Seaways Announces Execution of Five Year Contracts for its FSO Joint Venture — Form 8-K, Exhibit 99.1, SEC, 2017-05-17 ↩
-
International Seaways, Inc. Annual Report on Form 10-K for 2022 — SEC, 2023-03-01 ↩↩↩↩↩↩↩↩
-
International Seaways Completes Merger with Diamond S Shipping — Business Wire, 2021-07-16 ↩
-
International Seaways Reiterates Commitment to Delivering Shareholder Value — Form 8-K, Exhibit 99.1, SEC, 2022-05-11 ↩↩
-
International Seaways / Diamond S Shipping Joint Proxy Statement and Prospectus — Form 424(b)(3), SEC, 2021-06-14 ↩↩
-
International Seaways, Inc. Proxy Statement for the 2026 Annual Meeting — Form DEF 14A, SEC, 2026-04-29 ↩↩↩↩↩↩↩↩↩↩
-
International Seaways Acquires Tankers International, Expands Into Suezmax Market — gCaptain, 2026-01-27 ↩↩
-
International Seaways, Inc. Second Amended and Restated Rights Agreement — Form 8-K, SEC, 2026-04-09 ↩↩↩
-
International Seaways Adopts Limited Duration Stockholder Rights Plan — Form 8-K, Exhibit 99.1, SEC, 2022-05-09 ↩↩↩
-
Tanker Billionaire Fredriksen Clashes With International Seaways — gCaptain, 2023-05-31 ↩
-
International Seaways, Inc. Results of 2023 Annual Meeting of Stockholders — Form 8-K, SEC, 2023-06-08 ↩↩
-
International Seaways, Inc. Results of 2026 Annual Meeting of Stockholders and Compensation Actions — Form 8-K, SEC, 2026-06-12 ↩↩↩↩
-
International Seaways Reports First Quarter 2026 Results — Form 8-K, Exhibit 99.1, SEC, 2026-05-07 ↩↩↩
 LinkedIn
 WhatsApp
 Reddit
 Hacker News
 Email
Email Kindle
 RSS Feed
 Spotify
 Apple Podcasts
 Amazon Music
 Audible
 YouTube