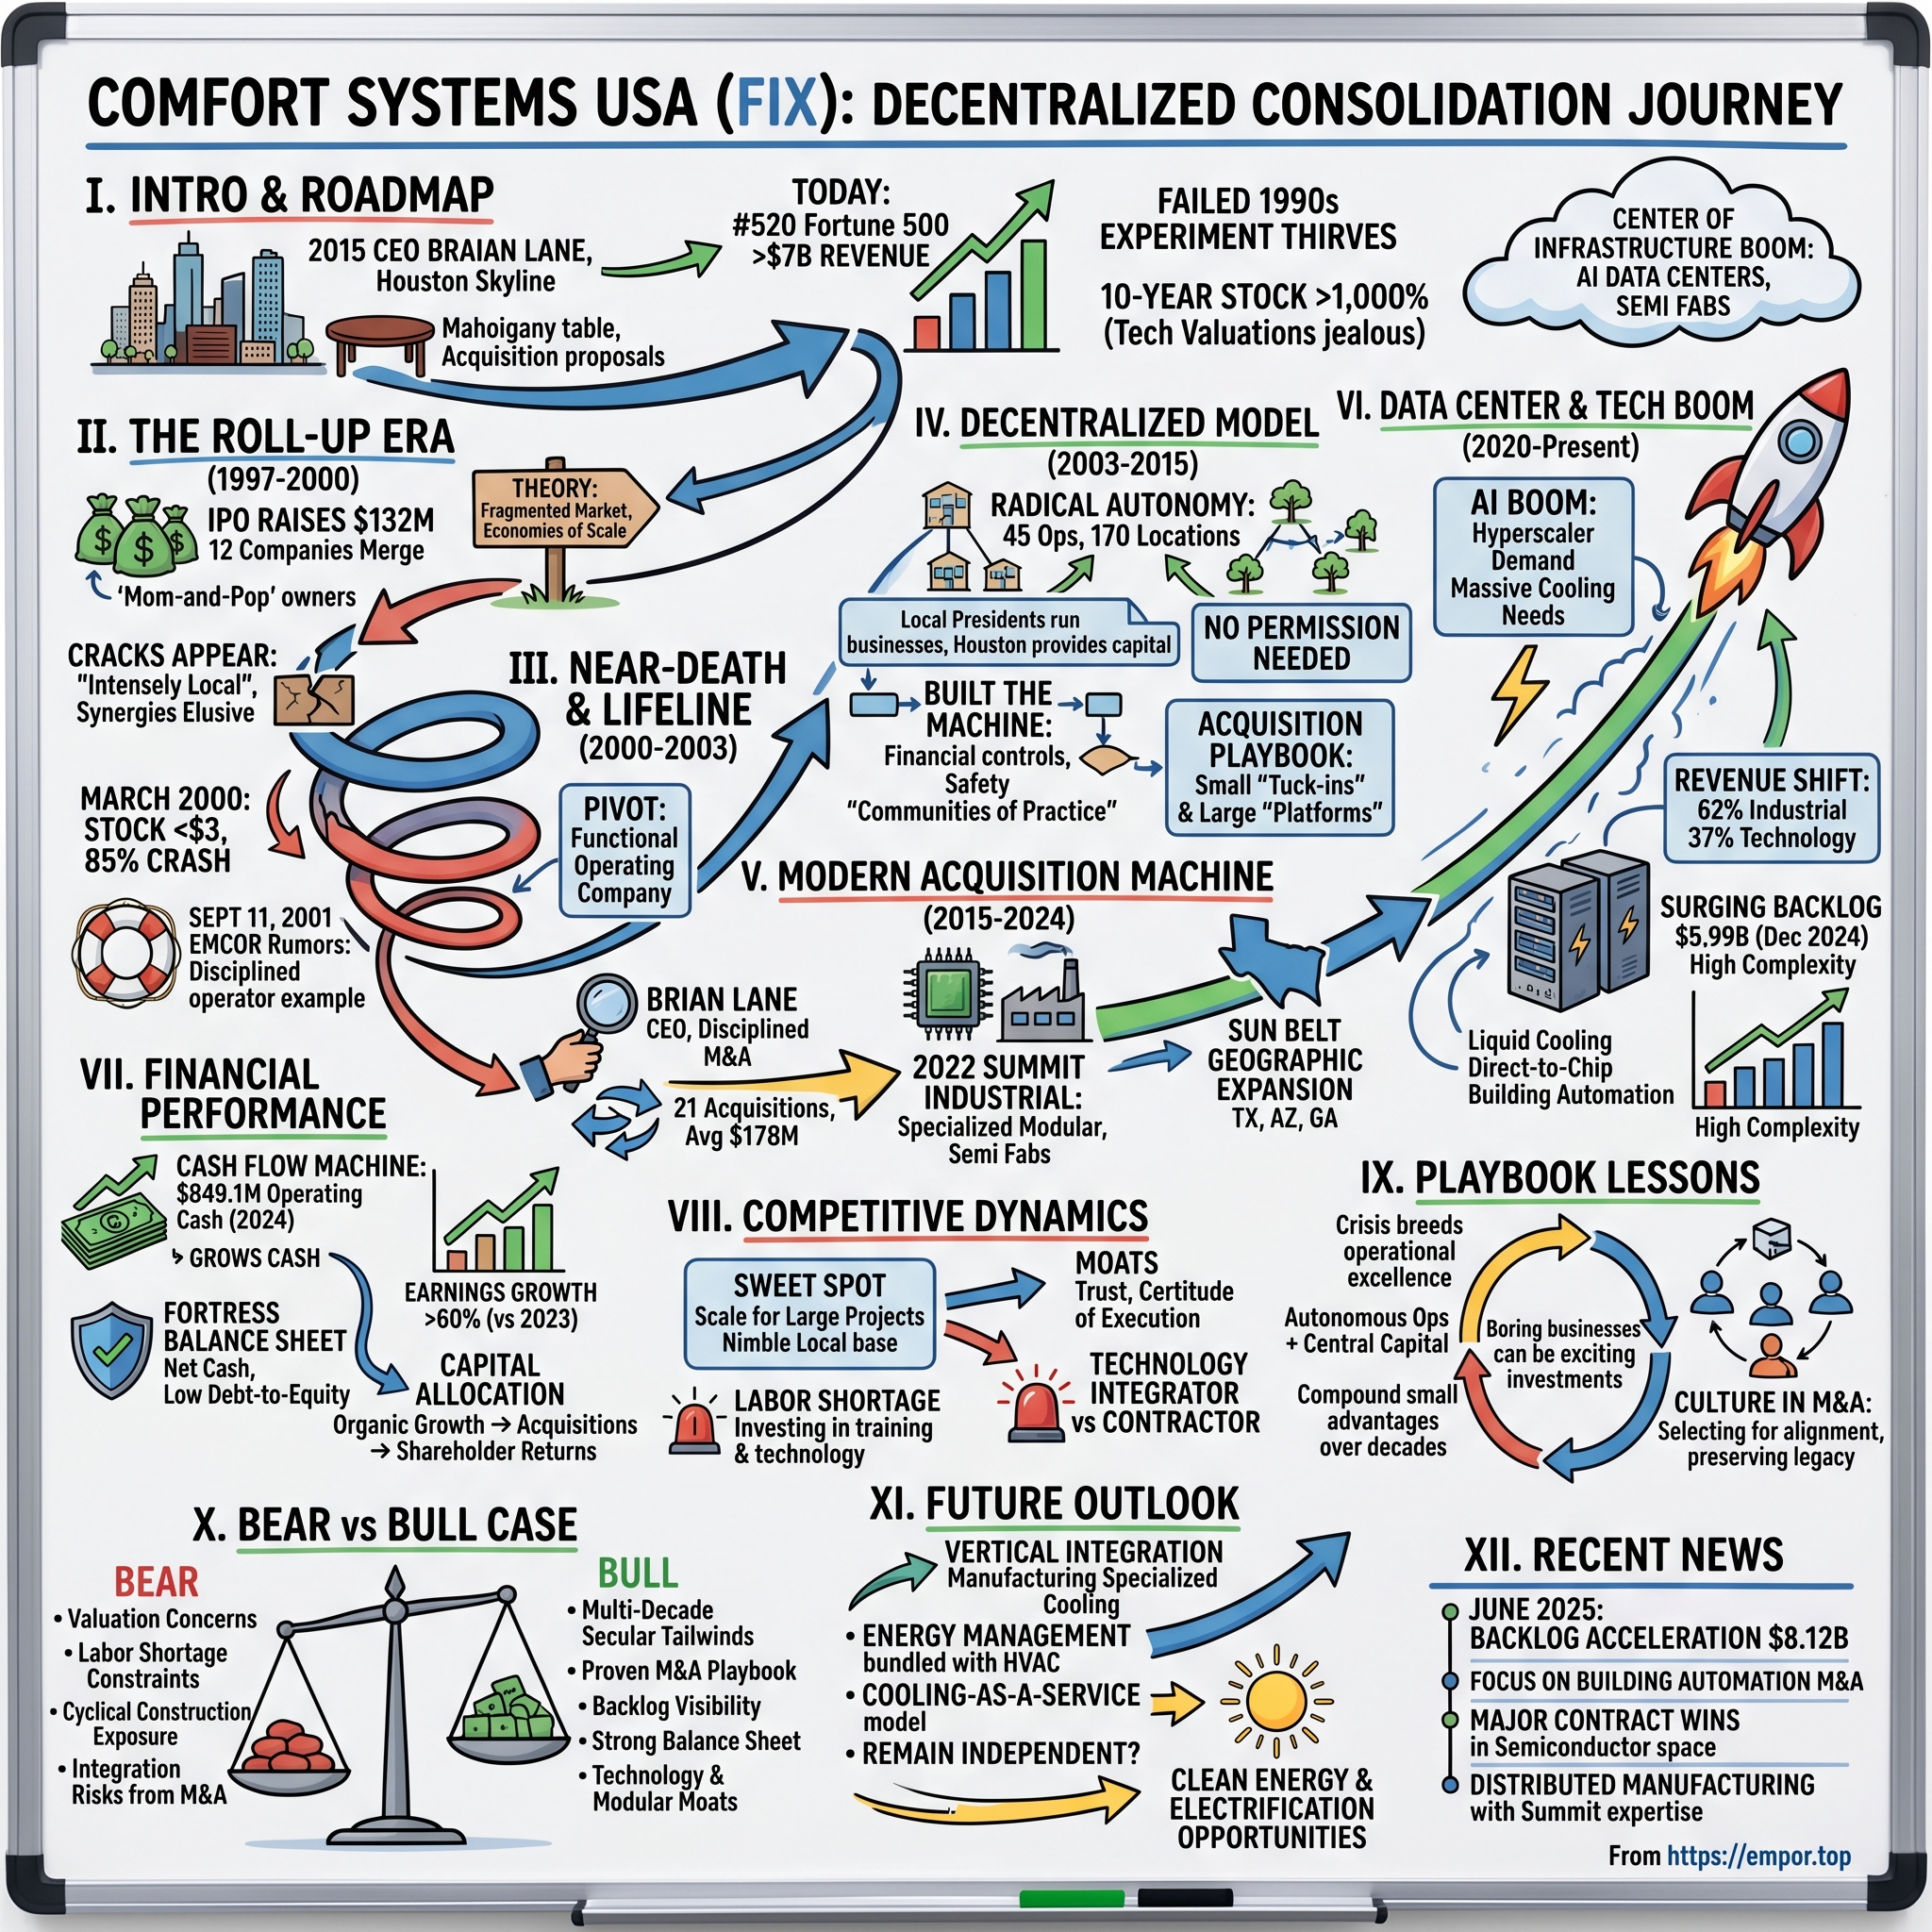
Comfort Systems USA: Building America's Industrial & Tech Infrastructure Engine
I. Introduction & Episode Roadmap
Somewhere in a warehouse-sized building on the outskirts of an American Sunbelt city, under fluorescent lights with the air conditioning running, a crew of pipefitters welds a chilled-water skid onto a steel frame. The skid will never be assembled on a construction site. It will be craned onto a flatbed truck, driven several hundred miles, lifted into place inside a windowless concrete hall, and bolted to identical modules that arrived from the same floor the week before. The hall will eventually hold tens of thousands of graphics processors that generate immense heat and require precise cooling infrastructure to operate. The welders do not work for a technology company; they are employed by a mechanical contractor that few investors could have named a decade ago.
That contractor is Comfort Systems USA, and the contrast between its traditional trade reputation and its current role in high-tech infrastructure defines its corporate trajectory.
Consider the financial trajectory. In fiscal 2024, Comfort Systems reported revenue of $7.03 billion—up from $5.21 billion the prior year—alongside operating income of $749.4 million and an operating margin of 10.7 percent.[^1] By fiscal 2025, revenue reached $9.10 billion, operating income rose to $1.31 billion, and the operating margin expanded to 14.4 percent.1 In the second quarter of 2026, the company generated $3.27 billion in revenue—nearly half of its total pre-2025 annual volume—at a 17.1 percent operating margin, while delivering more than $1 billion in operating cash flow over ninety days.2 Backlog, representing contracted work yet to be performed, stood at $14.06 billion as of June 30, 2026, compared to $8.12 billion a year earlier.2
Public markets responded accordingly. Shares traded in the low $1,600s in September 2026, giving the company a market capitalization in the mid-$50 billion range—a remarkable valuation for a business whose core business involves mechanical assembly, electrical wiring, and airflow systems.3
The central question is how a specialized trade contractor reached such scale. Comfort Systems was founded in June 1997 as a Wall Street roll-up, combining twelve independent heating and air-conditioning contractors to capitalize on industry fragmentation. That initial model collapsed: by 2001, the equity was nearly worthless, the balance sheet carried debt the business could not service, and survival required selling nineteen operating units—including its largest division—to a competitor.4 That transaction closed in 2002.5 A quarter-century later, that same corporate entity provides critical physical infrastructure for artificial intelligence data centers.
This transformation was not driven by a single strategic pivot. Instead, it resulted from a near-death restructuring that enforced strict financial discipline, a shift from centralized management to local operational autonomy, two strategic acquisitions that expanded core capabilities, offsite modular manufacturing that addressed skilled-labor shortages, and a massive, well-timed surge in external demand that the company did not create.
The sections that follow examine this evolution: the initial roll-up era and the breakdown of its economic model; the EMCOR divestiture and the resulting operational framework; the subsequent decade of disciplined tuck-in acquisitions; the expansion into electrical contracting and offsite modular prefabrication; the technology investment cycle that expanded earnings; the underlying segment economics and cash mechanics; executive incentives and governance; market competition; and a systematic evaluation of potential risks using historical operational evidence.
Understanding Comfort Systems requires recognizing its business model. The company does not own the facilities it services, build power plants, manufacture industrial chillers or switchgear, or hold long-term take-or-pay agreements. It operates as a project contractor: bidding work, executing projects with direct labor, billing progressively, and re-earning revenue with every contract. Because every dollar of revenue must be continuously secured, evaluating the company requires focusing on backlog rather than an installed base.
A final analytical consideration applies. Exceptional recent performance can create a narrative bias, leading observers to assume structural transformation where cyclical tailwinds exist. While Comfort Systems has strengthened its operational capabilities, its recent results also reflect one of the largest industrial construction waves in modern U.S. history. Disentangling secular operational improvements from favorable market cycles remains central to analyzing the business.
 Subscribe on LinkedIn
II. The Roll-Up Era & The 1990s Consolidation Trap (1997–2001)
To understand 1997, picture an investment banker with a spreadsheet and a thesis. The thesis was sold repeatedly across a dozen industries that decade: take a fragmented service business—funeral homes, auto dealers, staffing agencies, waste haulers, lawn care, or mechanical contracting—buy a critical mass of local operators simultaneously at five or six times earnings, float the combined entity at fifteen or twenty times, and capture the multiple arbitrage on day one. From there, continuous acquisitions financed at private multiples and valued at public multiples produced accounting-driven earnings growth without requiring operational improvements.
Comfort Systems USA went public in June 1997 as exactly this construction: twelve founding HVAC contractors combined in a single simultaneous transaction, listed on the New York Stock Exchange, headquartered in Houston.6 The industrial logic sounded plausible: commercial heating and cooling was performed by thousands of small family businesses, most with a few dozen employees and a single metropolitan service area. A national entity, proponents argued, could buy sheet metal and equipment cheaper, consolidate administrative overhead—accounting, insurance, bonding, and legal—and win enterprise accounts seeking a single nationwide contractor.
The stock initially reflected that optimism before reality set in. Shares that traded near $20 during the initial euphoric phase collapsed to under $1 by 2001 as the acquisition model consumed more cash than the underlying operations generated.
The breakdown stemmed from specific structural failure modes:
Purchasing power was largely illusory. Mechanical contractors do not buy commodities at national scale the way retailers do. Large equipment—chillers, air handlers, switchgear—is sold by manufacturers through regional representative networks with territorial pricing, giving manufacturers little incentive to grant national discounts that undercut their own representatives. Pipe, duct, and fittings are purchased locally from distributors on short lead times. Consolidating dozens of purchasing departments produced savings measured in mere basis points against a cost structure dominated by labor, not materials.
Bidding power was strictly local, and remains so. A commercial developer in Cincinnati awards mechanical work based on past performance, trusted superintendents, crew availability in a given quarter, and local licensing and bonding. The parent company's corporate logo is irrelevant. Comfort Systems learned this lesson at great cost when it pushed local units toward a common corporate brand: stripping founding family names from trucks and letterheads severed customer relationships built over decades and accelerated the departure of key operators.
Corporate overhead grew faster than gross profit. The central promise of the roll-up was administrative leverage. In practice, integrating dozens of independent companies with differing accounting systems, job-costing conventions, union agreements, and risk appetites required building an expansive corporate apparatus. Administrative costs arrived immediately, while anticipated synergies failed to materialize.
Debt escalated while cash flow stalled. Acquisitions were funded increasingly with borrowed money against cash flows that proved highly cyclical. By 2000, total debt climbed past $200 million while free cash generation stalled.
Applying a strict falsification test to the original roll-up thesis demonstrates its flaws. Claim: Consolidating fragmented trade contractors generates back-office synergies and national pricing power. Disconfirming evidence: Corporate overhead expanded faster than gross margins, win rates showed no national brand premium because purchasing decisions remained local, debt rose while cash conversion deteriorated, and equity value nearly vanished between 1998 and 2001. Verdict: Rejected. Scale alone in commoditized local trade contracting confers virtually no pricing power. This historical reality is critical for evaluating the company today: modern arguments framing Comfort Systems simply as a scale player in a fragmented market ignore the evidence from its initial four years. Any durable competitive advantage must originate elsewhere.
The collapse offers a broader lesson for corporate consolidation. Roll-ups succeed when acquired units share genuinely transferable advantages—a technology platform, a shared brand, an exclusive distribution channel, or genuine purchasing leverage. They fail when the combination exists purely on a financial statement. Consolidated funeral homes could share embalming facilities; consolidated waste haulers shared scarce, permitted landfills. Consolidated HVAC contractors shared virtually nothing beyond a stock ticker and corporate overhead.
The model was further destabilized by accounting dynamics. Debt- and stock-financed acquisitions produced initial earnings growth regardless of the underlying quality of the acquired companies, forcing the business to maintain acquisition volume to sustain reported growth. When the stock price dropped, the acquisition currency devalued, growth halted, and the debt remained. The underlying operations were exposed for what they had been all along: solid local contractors burdened by corporate overhead and reduced operational autonomy.
The exit of founding entrepreneurs compounded these operational challenges. Many had accepted stock as part of their payout, watching their equity lose value rapidly. As corporate management retired legacy family names, key founders departed, taking with them institutional knowledge, customer relationships, and crew oversight—the primary assets the company intended to acquire.
By late 2001, the core question was no longer whether the roll-up thesis could be validated, but whether the company could avoid insolvency.
III. The EMCOR Lifeline & Near-Death Reset (2001–2004)
By the autumn of 2001, commercial construction faced severe headwinds as the technology capital cycle turned and office building slowed. Following the September terror attacks, project activity nationwide stalled. Comfort Systems confronted bank debt maturities exceeding $200 million, backed by an operating engine unable to generate sufficient cash to meet those obligations.
A company in that position has three options: raise equity regardless of dilution, restructure through bankruptcy court, or sell assets rapidly to retire debt. Equity markets were effectively closed to a distressed roll-up in 2001. Avoiding court reorganization required finding a single buyer with the capital, operational knowledge, and willingness to absorb nineteen operating units in a single transaction.
That buyer was EMCOR Group, a New York-based mechanical and electrical contractor that had emerged from the bankruptcy of its predecessor, JWP Inc., a decade earlier. EMCOR understood distressed trade-contracting assets from experience. In late February 2002, EMCOR agreed to acquire nineteen Comfort Systems operating units for approximately $186.25 million, structured as $164.25 million in cash plus the assumption of roughly $22 million of debt.4 The deal was finalized the following month.5 The sold assets were concentrated in the Midwest and the New York–New Jersey corridor, and included Shambaugh & Son, an Indiana-based industrial contractor that represented Comfort Systems' largest single operating unit.
Evaluated strictly on strategic terms, the divestiture was a capitulation. Comfort Systems excised roughly a third of its revenue base and handed a competitor a durable industrial platform; Shambaugh went on to become a cornerstone of EMCOR's growth over the following two decades. This transaction provides crucial context for any assessment of Comfort Systems' capital allocation record: its first decisive capital decision was selling its premier industrial asset under distress to undo prior overextension. The proceeds did not fund expansion; they purchased survival.
Solvency, however, created space for structural reform. With bank debt retired, management could re-evaluate the core business without the pressure to sustain acquisition-led growth. The resulting operational overhaul reshaped the enterprise around four core shifts.
First, management recognized that a disciplined specialty contractor can operate with negative working capital. Customers pay progress billings in advance of or alongside work performed, while suppliers and subcontractors are paid on standard vendor terms. When projects are estimated accurately and billed promptly, expansion releases cash rather than consuming it. Conversely, a poorly managed contractor inverts this dynamic: underbilled work, disputed change orders, and cost overruns transform working capital float into a cash drain just as profitability falls. In trade contracting, working capital is less an administrative treasury function and more a direct metric of job estimating and field execution.
Second, executive leadership inverted the management structure. Where the roll-up had centralized authority at headquarters, the new model established corporate headquarters as a service provider to local operating unit presidents. Headquarters assumed responsibility for treasury management, surety bonding, insurance, capital allocation, legal compliance, and cross-unit best practice sharing. Corporate ceased instructing local leadership on specific project bids or personnel choices. Local brand names, licensing, and hiring authority remained intact.
Third, cash conversion replaced revenue expansion as the primary performance metric—a shift that distinguished Comfort Systems from peer roll-ups that failed to survive the era. Local presidents were incentivized to decline unprofitable or high-risk projects, establishing a bidding discipline that sacrificed near-term top-line volume to protect operating margins.
Fourth, the company redefined operational risk. During the roll-up era, risk management focused primarily on balance sheet leverage and debt covenants. The revised framework assessed risk at the individual contract level: identifying unlimited liability clauses, aggressive liquidated damages tied to external schedule delays, project owners with histories of disputing change orders, or technical scopes outside a local unit's core expertise. Unprofitable projects, masked by percentage-of-completion accounting, often present greater solvency risks to trade contractors than broader economic downturns.
Enforcing this discipline required adjusting executive compensation. Paying operating unit presidents solely on revenue volume encouraged reckless bidding, while paying on operating income alone incentivized aggressive volume growth without accounting for capital efficiency. Comfort Systems tied local leadership compensation to both operating income and return on capital employed. Under this structure, winning a large, low-margin project that tied up working capital penalized the operating unit president, enabling corporate management to align local project selection with capital efficiency without dictating local pricing.
These structural changes did not immediately capture Wall Street's attention. Through the mid-2000s, Comfort Systems remained a small-cap contractor generating low single-digit margins on a deleveraged balance sheet. Yet beneath the quiet valuation, the company had constructed a durable operating system—setting the stage for the execution that followed over the next decade and a half.
IV. Building The Machine: Decentralized Autonomy & Capital Allocation (2004–2018)
The period following the EMCOR restructuring was defined by deliberate execution rather than high-profile transactions. Between 2004 and 2018, Comfort Systems pursued a disciplined sequence: identify a well-run regional contractor whose founder faced succession, acquire the business through direct negotiation rather than competitive auction, preserve local operations, and structure payments over several years based on realized earnings.
By the end of 2025, that steady acquisition strategy produced a network of 50 operating units across 190 locations in 142 American cities, employing approximately 22,700 people.6 Rather than operating as a centralized national contractor with regional divisions, the company functions as a decentralized federation. Each unit retains its brand, customer relationships, estimating staff, and profit-and-loss accountability. Operating unit presidents are compensated based on their specific unit's operating income and return on capital—a mechanism that maintains financial control across a decentralized footprint.
Decentralization succeeds in trade contracting because the industry's economic characteristics penalize centralized control. First, trade licensing and prevailing-wage regulations are locally mandated, preventing centralized compliance. Second, skilled labor recruitment relies on local field supervisors and established crew relationships that central management cannot easily replicate. Third, job bidding depends on local operational knowledge—such as general contractor payment histories, municipal inspection cadences, and regional labor market conditions—that loses context when filtered through corporate headquarters. While corporate management cannot improve local project bidding, it provides distinct structural advantages: lower bonding costs, shared insurance risk across 50 units, capital allocation oversight to block unprofitable bids, and the ability to transfer operational innovations like prefabrication across units.
The acquisition framework maintained consistent parameters. Target companies were established market leaders rather than turnaround opportunities, and transactions were negotiated directly with owners to avoid auction premiums. Purchase structures routinely incorporated seller notes and multi-year earn-outs tied to post-closing financial milestones. This structure remained evident in subsequent transactions, such as the October 2025 acquisition of Feyen Zylstra, a Midwest and Southern electrical contractor, for a preliminary $109.8 million—comprising $99.0 million in closing cash, $4.3 million in seller notes, an earn-out provision, and a working capital adjustment.7 Contingent payouts served a dual purpose: capping downside risk if performance lagged while keeping former owners aligned with long-term financial targets.
Brian E. Lane led executive management through much of this development, joining Comfort Systems in 2003 shortly after the EMCOR transaction and becoming chief executive in December 2011.[^9] Unlike traditional trade contractor executives, Lane brought a background in management consulting and oilfield services. His operational emphasis focused consistently on cash conversion, return on invested capital, and bidding discipline over multi-year revenue targets. Alongside Lane, William George served as chief financial officer for more than two decades, providing continuity for a conservative balance-sheet strategy centered on minimal structural debt and non-dilutive, cash-funded acquisitions across multiple economic cycles.
Decentralized operations also carry inherent operational trade-offs. The model creates duplicate administrative functions across 50 units, limits enterprise-wide system standardization, and slows corporate visibility into emerging operational issues. Management effectively accepted administrative inefficiencies and delayed reporting to avoid the far more damaging failure mode: centralized corporate officers making flawed local bidding decisions at scale.
The financial mechanics of this tuck-in strategy drove compounding returns. Acquiring regional contractors at mid-single-digit earnings multiples using internally generated cash—without issuing equity or incurring long-term debt—rendered transactions immediately accretive. Executing this approach consistently over fifteen years while supporting organic growth enabled earnings expansion with minimal share dilution. During the 2004–2018 period, value creation resulted less from operating margin expansion, which remained in the mid-single digits, and more from purchasing cash flows at attractive valuations while enforcing strict job execution.
Evaluating this operational framework requires testing it against a major economic contraction.
Claim: A decentralized serial acquirer in a cyclical trade industry will inevitably overextend and face severe financial distress during a recession.
Disconfirming evidence: The 2008–2010 commercial construction downturn provided a test of the model. As U.S. nonresidential construction activity contracted sharply, Comfort Systems' revenue dropped roughly 20 percent from its peak, and operating margins compressed. However, the company maintained debt covenant compliance, avoided dilutive equity financing, and continued generating positive operating cash flow. Because project billings and collections unwind faster than vendor payables during a contraction, disciplined billing under a negative working capital structure generates cash as revenue declines.
Verdict: Modified. While revenue and operating margins remain subject to cyclical swings, the cash-flow dynamics during a contraction counter balance-sheet strain. The company demonstrated during the 2008 financial crisis that its capital structure prevents distressed asset sales at the bottom of a cycle. A key forward test for this model remains whether operating cash flows can stay positive during a future industry downturn without triggering goodwill impairments from accumulated acquisitions.
That stress test has not recurred since 2009. The market environment in subsequent years turned highly favorable, setting the stage for the strategic expansion that followed.
V. The Strategic Pivot: Modular Construction & Electrical Expansion (2019–2022)
By the late 2010s, the primary constraint on Comfort Systems was neither demand nor capital; it was labor availability.
Decades of demographic declines in American skilled trades had reduced the supply of pipefitters, sheet metal workers, and electricians, creating severe shortages in regions with heavy construction activity. For a specialty contractor, top-line growth is mechanically tied to billable field hours multiplied by hourly rates; without additional labor capacity, revenue expansion stalls regardless of backlog size.
Physical job sites also introduce structural productivity limits. Traditional field installation occurs in unconditioned environments subject to weather delays, congested workspaces shared among multiple trades, delayed material deliveries, and logistical inefficiencies. As a result, field labor hours frequently yield lower productivity than controlled industrial settings.
To bypass these operational bottlenecks, Comfort Systems executed two strategic acquisitions between 2019 and 2021 that reshaped its service capabilities.
First, the company expanded into electrical contracting. In 2019, Comfort Systems acquired Walker Engineering, a Texas-based electrical contractor, adding large-scale capabilities in power distribution, high-voltage systems, and complex cabling. While initially viewed as revenue diversification, the transaction allowed Comfort Systems to bid unified mechanical and electrical contracts—an increasingly essential capability for complex industrial facilities where power delivery and thermal management are tightly integrated.
Second, Comfort Systems acquired Summit Industrial Construction in 2021. The Texas firm specialized in offsite modular fabrication for industrial and advanced technology clients. Beyond physical capacity, Summit introduced an offsite manufacturing framework: designing complex mechanical and piping systems as standardized, factory-built assemblies rather than custom field installations.
The operational shift from field construction to factory prefabrication fundamentally alters project execution. In traditional construction, a facility's mechanical room is built in place: crews measure, cut, weld, and fit piping on ladders within an unfinished structure. Under a modular approach, engineers design systems in three-dimensional digital models before breaking them into transportable components—such as pump skids, pipe racks, and pre-wired electrical rooms. Factory crews assemble these modules in climate-controlled plants using overhead cranes, standardized jigs, and continuous quality checks, before transporting the completed units to job sites for final installation.
This manufacturing model shifts project economics in four key ways. First, labor productivity per hour increases as factory workflows eliminate idle movement and site delays. Second, safety incident rates drop sharply in controlled indoor environments, lowering workers' compensation costs and helping the firm meet stringent corporate client safety criteria. Third, project schedules compress because factory fabrication runs parallel with site foundation and structural work rather than sequentially. Fourth, offsite plants can utilize specialized assembly technicians who can be trained faster than traditional journeyman pipefitters, easing the skilled-labor constraints that limit field-based competitors.
Modular production has become a substantial driver of enterprise scale. By mid-2026, management reported operating more than 3.5 million square feet of modular manufacturing space, with plans to expand beyond 4 million square feet by year-end 2026 and reach approximately 5 million square feet by late summer 2027, while modular projects accounted for roughly 17 percent of year-to-date revenue.8
Evaluating the competitive impact of prefabrication requires testing its strategic limits.
Claim: Modular manufacturing establishes an unassailable economic moat against traditional trade contractors.
Disconfirming mechanism: Offsite prefabrication transforms variable labor costs into fixed overhead. While field labor can be adjusted rapidly to match project volumes, factory facilities incur ongoing lease, equipment, and standing overhead expenses regardless of utilization. If a customer alters project specifications mid-fabrication or delays site delivery, factory throughput drops, reducing overhead absorption and eroding gross margins. Recognizing this operating risk, management has stated that expansion occurs only "when customers provide us meaningful multi-year commitments"—highlighting that unutilized plant capacity presents significant downside risk in a market contraction.8
Verdict: Claim narrowed. Prefabrication provides a meaningful operating advantage in execution speed, job safety, and labor leverage, but it does not constitute a permanent moat. Competitors such as EMCOR, large private specialty contractors, and private-equity-backed platforms are also expanding offsite modular facilities. Because prefabrication techniques are unpatented, modular capability represents a capital and operational threshold that excludes smaller regional contractors, narrowing the bidding pool for large-scale projects to a limited tier of contractors. The key metric testing this advantage will be whether Comfort Systems can maintain gross margins when facility schedules slip or utilization declines, rather than during periods of full plant capacity.
This modular transition alters the fundamental operating model in ways not immediately apparent on financial statements. A traditional trade contractor acts primarily as a distributor of skilled field labor, whereas a modular contractor operates partially as an industrial manufacturer. Consequently, operational evaluation shifts toward factory utilization rates, throughput, and scrap yield rather than billable field hours alone. This evolution increases capital intensity, changes internal performance tracking, and requires broader supply-chain management. While Comfort Systems has integrated this framework into its existing corporate structure, the long-term returns on current factory capital expenditure will depend on sustained capacity utilization over multi-year cycles.
By 2022, Comfort Systems possessed integrated electrical capability, expanding modular manufacturing capacity, and a low-debt balance sheet. The company had assembled an operational framework tailored for large, complex, schedule-sensitive industrial projects—just as external demand for specialized technology infrastructure accelerated sharply.
VI. The AI Data Center & Advanced Technology Super-Cycle (2022–Present)
While the generative artificial intelligence capital cycle is typically framed around semiconductor breakthroughs, its physical reality relies on power and water. A conventional enterprise server rack draws five to ten kilowatts. A rack densely populated with modern AI accelerators can draw ten times that amount. Because air cooling cannot carry heat away fast enough at that density, the industry relies on liquid cooling—piping coolant directly to cold plates on processors and circulating it through heat exchangers, chillers, and cooling towers. An AI data center functions less like an office building housing servers and more like an industrial process plant. Operating these facilities requires extensive chilled-water systems, redundant pumps, high-voltage distribution, switchgear, generators, and thousands of feet of large-diameter piping, all installed to precise tolerances on schedules dictated by chip depreciation.
This physical requirement aligned directly with the capabilities Comfort Systems assembled between 2019 and 2022.
The shift in revenue composition reflects this alignment. In fiscal 2025, technology clients generated 45.0 percent of total revenue, followed by manufacturing at 22.1 percent, healthcare at 8.9 percent, education at 7.3 percent, government at 5.0 percent, and traditional office construction at 5.0 percent.6 By the first half of 2026, technology-related projects—primarily data centers—reached 58 percent of revenue, while broader industrial clients accounted for roughly three-quarters of total volume.8 Commercial office and retail construction, the foundation of the company's early business, represented only a minor fraction of operations.
Backlog growth accelerated over the same period. At year-end 2023, backlog stood at $5.16 billion, expanding 14 percent to $5.99 billion by year-end 2024.[^1] The expansion steepened in 2025, reaching $8.12 billion at mid-year, $9.38 billion by September, and $11.94 billion at year-end—with same-store backlog reaching $11.58 billion, indicating that growth was driven organically rather than through acquisitions.1 By March 2026, backlog rose to $12.45 billion, reaching $14.06 billion by June 30, 2026, with same-store backlog at $13.70 billion.2
For six consecutive quarters, new contract bookings significantly outpaced project completion, driven almost entirely by organic demand.
Financial performance followed this backlog expansion. In the second quarter of 2026, revenue rose 50 percent year over year to $3.27 billion, while gross margin expanded from 23.5 percent to 25.9 percent. Selling, general, and administrative expenses decreased from 9.7 percent to 8.8 percent of revenue despite absolute spend rising to $287 million. Operating income reached $558 million, representing an operating margin of 17.1 percent, and diluted earnings per share rose 92 percent year over year to $12.53.2 Operating cash flow for the first six months of 2026 reached $1.53 billion, compared to $164.5 million in the prior-year period.2
Evaluating these results requires distinguishing structural operational changes from cyclical conditions across three levels of analytical confidence.
First, with high confidence, Comfort Systems holds temporary pricing power resulting from constrained execution capacity in the trade labor market. Gross margins do not expand from 21 percent to nearly 26 percent solely through operational productivity. Instead, expansion occurs because clients compete for scarce execution capacity. On the second-quarter 2026 earnings call, executive management attributed performance to field execution by skilled trade labor; however, market dynamics suggest that when data center developers face multi-month schedule delays on facilities housing substantial semiconductor capital, client price sensitivity diminishes.8
Second, with medium confidence, operating leverage offers partial permanent gains. Maintaining overhead below 9 percent of revenue while integrating six acquisitions over eighteen months indicates structural efficiency in corporate overhead, a portion of which should persist during lower-volume periods.
Third, with low confidence, current operating margin levels represent a long-term structural baseline. Operating margins of 17 percent are without precedent in mechanical and electrical contracting history, including for Comfort Systems, which reported a 10.7 percent operating margin in fiscal 2024.[^1] Unprecedented margin expansion typically reflects temporary capacity shortages rather than permanent structural baselines.
Management's commentary on the second-quarter 2026 earnings call was more cautious than the headline financial results. Executives guided full-year same-store revenue growth to the mid- to high-30 percent range, implying slower second-half growth against higher prior-year comparisons. Addressing local regulatory moratoriums on data center construction, executives noted that affected projects might shift locations rather than be cancelled—an acknowledgment that regulatory friction exists, even if treated as project displacement rather than cancellation.8
The scope of work explains both revenue growth per project and margin dynamics. On major AI data center campuses, Comfort Systems provides central utility plants—including chillers, cooling towers, pumps, and large-diameter piping, delivered primarily as prefabricated modules—alongside internal data hall mechanical systems, coolant distribution units, pre-assembled electrical switchgear rooms, and integrated control systems. Rather than executing third-party designs, the firm engineers, fabricates, delivers, and commissions integrated thermal and electrical infrastructure.
This expanded scope demonstrates how the prior electrical acquisition complemented the core mechanical business. Clients seeking to consolidate project accountability under a single schedule often pay a premium for unified mechanical and electrical delivery, contributing directly to gross margin expansion.
However, aggregate backlog metrics conceal underlying portfolio concentration. In fiscal 2025, the company managed 8,427 projects with a combined contract value of approximately $24.17 billion, reflecting an average contract value of $2.9 million and typical project durations of six to nine months.6 These averages mask a split between a large volume of small commercial contracts and a small number of high-value technology and industrial projects that drive revenue growth and carry concentrated execution risk.
Furthermore, demand remains concentrated among a small buyer base. The fiscal 2025 Form 10-K disclosed that a single customer accounted for approximately 12.8 percent of consolidated revenue.6 Consequently, recent operational performance remains closely tied to discretionary capital expenditure decisions by a limited group of major technology clients.
VII. Segment Economics, Financial Mechanics & Capital Deployment
Behind the narrative of high-tech expansion, Comfort Systems operates fundamentally through two reporting segments powered by a specialized cash-conversion engine.
Mechanical Services—comprising HVAC installation, process piping, plumbing, modular skids, and building maintenance—accounted for 73.3 percent of fiscal 2025 revenue and $2.30 billion in the second quarter of 2026, representing roughly 70 percent of total volume.69 This legacy core has expanded substantially as industrial and data center projects have layered onto traditional mechanical contracting.
Electrical Services—covering power distribution, switchgear, controls, technical cabling, and modular electrical rooms—generated 26.7 percent of fiscal 2025 revenue and $969 million in the second quarter of 2026.69 Built almost entirely after 2019, the segment accounts for nearly a third of total revenue and has driven recent acquisitions, including Feyen Zylstra, Meisner Electric in October 2025, and R.C. Hunt Electric in May 2026.9 The strategic logic reflects data center project dynamics: electrical scope is expanding faster than mechanical scope, and self-performing both disciplines allows Comfort Systems to capture a larger share of total project spend rather than competing for separate trade subcontracts.
Beneath both primary segments sits a more stable revenue stream: recurring service and maintenance on existing facilities. Existing-building service accounted for 36.8 percent of fiscal 2025 revenue, compared to 63.2 percent from new construction.6 Service contracts carry higher gross margins than new installation work, generate predictable recurring revenue, and remain relatively insulated from economic contractions—facility owners must maintain operating chillers regardless of broader commercial construction activity. This recurring mix provides an operational floor during cyclical downturns.
Operating leverage reflects straightforward financial mechanics. Fiscal 2025 gross margin rose to 24.1 percent from 21.0 percent in fiscal 2024, while selling, general, and administrative expenses stood at 9.7 percent of revenue—expanding the operating margin to 14.4 percent from 10.7 percent.1[^1] By the second quarter of 2026, SG&A expenses declined to 8.8 percent of revenue while gross margin reached 25.9 percent, lifting the operating margin to 17.1 percent.2 Because corporate overhead has expanded at a far slower rate than top-line revenue, incremental gross profit has converted directly into operating income.
Cash flow mechanics present a distinct analytical picture. Fiscal 2024 operating cash flow reached $849.1 million compared to net income of $522.4 million.[^1] In fiscal 2025, operating cash flow grew to $1.19 billion alongside net income of $1.02 billion.1 The first half of 2026 generated $1.53 billion in operating cash flow and $1.24 billion in free cash flow against $812 million in net income—a cash conversion rate exceeding 150 percent.2 Executive management attributed these results on the second-quarter earnings call to favorable payment terms and advance customer billings tied to major project orders.8
This management commentary highlights the distinction between earnings quality and working capital timing. For a contractor, cash conversion exceeding 100 percent of net income reflects customer prepayments during a period of rapid top-line growth rather than structural profitability alone. When project owners fund work in advance, the balance sheet accumulates billings in excess of costs—a working capital liability that resolves as project milestones are completed. If revenue growth decelerates, this advance billing float stops accumulating and can reverse, causing operating cash flow to trail net income temporarily even if operational execution remains unchanged. Consequently, projecting first-half 2026 cash conversion as a permanent baseline confuses growth velocity with long-term earnings capability.
Balance sheet strength has increased alongside operational expansion. As of June 30, 2026, Comfort Systems held $1.85 billion in cash against $54 million in long-term debt, up from $981.9 million in cash and $139.1 million in debt at year-end 2025.21 Carrying a net cash position of approximately $1.8 billion—in an industry where specialty contractors historically operated with minimal net liquidity—presents management with a new capital allocation challenge.
Capital deployment follows a distinct hierarchy. First, management prioritizes internal capacity expansion, with capital expenditures running at approximately 5 percent of revenue in 2026, directed primarily toward offsite modular fabrication facilities.8 On an annualized revenue pace exceeding $12 billion, this implies a capital program approaching $600 million annually—significantly above historical maintenance capex levels and representing the firm's largest organic investment. Second, tuck-in acquisitions continue at a steady pace, though recent transactions—such as the roughly $110 million purchase of Feyen Zylstra—absorb only a small fraction of available cash.7 Third, dividend payouts have expanded, rising from $1.20 per share in fiscal 2024 to $1.95 in fiscal 2025, with the quarterly dividend increased by an additional $0.10 to $0.90 per share in mid-2026.18 Fourth, share repurchases have moderated sharply: the company spent $111.3 million on share buybacks in the first half of 2025, compared to $8.2 million in the first half of 2026.9
This shift in share repurchases illustrates management's approach to capital allocation. Rather than deploying expanding cash balances into shares regardless of market price, management curtailed buybacks following the equity re-rating while redirecting capital toward organic manufacturing capacity and higher cash dividends. Dividend increases return capital to shareholders without signaling equity valuation expectations. Whether driven by price sensitivity or a preference for factory expansion, this behavior aligns with the company's historical capital discipline.
The central question remains how management will deploy the $1.8 billion net cash reserve over a full operational cycle. Holding substantial cash yields modest returns, and historical precedents in specialty contracting urge caution when companies accumulate large reserves alongside expanding capital programs. The company's own founding history demonstrates the risks of aggressive capital deployment in trade contracting—setting the context for examining executive incentives and corporate governance.
VIII. Management Credibility, Incentives & Governance Audit
Brian Lane has led Comfort Systems for nearly fifteen years, overseeing a transition in which the company's equity expanded from a small-cap trade contractor into one of the top-performing industrial stocks in the United States. Evaluating whether this performance reflects operational skill, organizational structure, or favorable market conditions requires analyzing management decisions alongside financial results.
Lane joined the company in 2003, shortly after the asset sales that restored solvency, and was appointed chief executive in December 2011.[^9] Having worked in management consulting and energy services rather than the building trades, Lane brought a perspective focused on capital allocation and operational governance rather than direct field supervision. This background supported the preservation of local operational autonomy; corporate leadership avoided intervening in daily project management, maintaining headquarters primarily as an allocation and risk-oversight platform.
Three operational practices illustrate this approach.
First, management avoids long-dated numerical targets. Comfort Systems does not publish multi-year revenue or margin goals, providing only short-horizon guidance and qualitative commentary on backlog. While omitting multi-year targets reduces explicit public benchmarks, it prevents management from bidding aggressively on lower-margin or high-risk contracts to meet artificial growth milestones—a key risk control in a fixed-price contracting environment.
Second, executive communications acknowledge operational limits. Across recent earnings calls, management has identified labor availability as the primary constraint on growth, while tying capital investments for offsite prefabrication directly to multi-year customer commitments rather than speculative demand forecasts.8 Maintaining this operational posture across both moderate and rapid expansion periods reflects a consistent capital discipline.
Third, financial reporting relies on standard GAAP metrics. Comfort Systems reports primary results through GAAP operating income and margins rather than leading with adjusted EBITDA figures that exclude standard operational costs. The company's audit record shows no financial restatements or material weakness disclosures in recent periods. However, percentage-of-completion accounting—standard across the contracting sector—inherently requires management judgment regarding total estimated costs to complete projects. Across a 2025 portfolio of 8,427 jobs representing roughly $24.17 billion in total contract value, minor shifts in cost estimates can materially influence reported operating margins.6 Monitoring these job-cost estimations remains essential for evaluating earnings quality.
Executive compensation is structured around operating income, return on invested capital, and cash conversion rather than top-line revenue growth.10 This design limits incentives to acquire unprofitable contract volume simply to expand top-line scale. In fiscal 2025, Lane's total compensation reached approximately $10.6 million, comprising $1.25 million in base salary, roughly $3.1 million in non-equity incentive compensation, and about $6.2 million in stock awards—a structure weighted 59 percent toward equity.[^13] Against a doubling of net income during the fiscal year, this 30 percent increase in executive compensation remains within modest bounds relative to peer performance.
Succession planning has entered an active phase, representing a key governance transition. On June 22, 2026, the company announced that Craig Sasser—regional vice president for the Atlantic region, who joined in September 2018 after 34 years at a major mechanical, electrical, and plumbing firm—would become chief operating officer effective July 1, with Briston Blair moving to chief strategy and innovation officer and Trent T. McKenna continuing as president.11 Creating a chief operating officer role establishes a structured framework for an eventual executive transition. While initiated from a position of balance-sheet strength, the transition will test whether the company's bidding discipline and decentralized autonomy persist beyond the tenure of current leadership.
A broader governance consideration involves capital allocation during periods of high profitability. The 2025 proxy framework reinforces operational discipline by tying incentive compensation to operating income, return on invested capital, and cash flow—auditable metrics resistant to volume inflation.10 However, executive compensation structures cannot fully insulate a company from the strategic temptations of a $1.85 billion cash balance and a record equity valuation. With substantial acquisition currency available, management faces the challenge of maintaining capital discipline; historically, major operational missteps in trade contracting occur when elevated stock prices encourage overextension.
Skeptical analytical perspectives emphasize three operational risks. First, holding $1.85 billion in uncommitted cash represents a deferred capital allocation decision, increasing internal pressure to pursue larger acquisitions. Second, the reduction in share repurchases, while consistent with valuation discipline, limits direct cash returns to shareholders during a period of historic cash generation. Third, maintaining fifty decentralized operating units alongside an expanding factory footprint creates ongoing execution risk; in trade contracting, sudden losses typically stem not from gradual margin decay, but from unhedged cost overruns on a single complex project.
These risk factors do not indicate immediate operational breakdown, but they define the analytical criteria for assessing corporate governance during a cyclical peak.
IX. Competitive Dynamics, Porter's 5 Forces & Helmer's 7 Powers
The bid list for a 300-megawatt artificial intelligence data center campus is notably short. The combined mechanical and electrical scope frequently totals hundreds of millions of dollars, requiring bonding capacity that most contractors cannot obtain, offsite prefabrication facilities that take years and substantial capital to build, and strict schedule penalties that would threaten a mid-sized firm with insolvency. As a result, only a half-dozen credible contractors nationwide possess the scale to bid on such projects, and all are operating near capacity.
This narrow pool defines the competitive landscape at the top of the market. Key public comparables include EMCOR Group—which acquired Comfort Systems' distressed assets in 2002 and currently operates a substantially larger revenue base under a similar mechanical and electrical model—alongside Quanta Services in electrical infrastructure, APi Group in specialty services, and the smaller Limbach Holdings. Below this top tier sit private-equity-backed consolidators attempting trade roll-ups, many of which are encountering the integration and overhead challenges that disrupted the industry in the late 1990s.
Evaluating the business through Michael Porter's Five Forces framework clarifies these underlying industry dynamics:
Threat of new entrants: Low. Entering local commercial heating and cooling contracting requires minimal capital—primarily a trade license, basic equipment, and local labor. By contrast, entering hyperscale industrial mechanical, electrical, and plumbing contracting presents formidable structural barriers. Entrants require massive bonding capacity, a balance sheet capable of absorbing hundreds of millions of dollars in work-in-process, a trained workforce, and an expansive offsite manufacturing footprint—capabilities that require years of deliberate capital deployment to assemble.
Bargaining power of buyers: Cyclically low, but structurally moderate. Hyperscale data center developers currently face severe schedule constraints and capacity shortages, inverting traditional contractor-client dynamics and expanding contractor gross margins. However, these technology clients represent sophisticated procurement organizations buying from a concentrated vendor pool. They maintain strong incentives to cultivate alternative suppliers, standardize facility designs, and eventually push module fabrication toward equipment original equipment manufacturers. The 12.8 percent single-customer concentration disclosed for 2025 highlights this structural vulnerability.6 Low buyer power currently reflects temporary supply constraints rather than a permanent structural advantage.
Bargaining power of suppliers: Moderate. Major equipment manufacturers—such as Trane, Carrier, Vertiv, Johnson Controls, and primary switchgear producers—control long-lead items where supply shortages have been acute. A national contractor with substantial order volume receives preferential equipment allocations compared to regional firms, representing a real but bounded operational advantage.
Threat of substitutes: Very low. Software solutions cannot dissipate physical heat or deliver power. Data center processors require physical liquid cooling, chillers, and high-voltage electrical distribution installed by licensed tradespeople. Technological acceleration in semiconductor density has increased, rather than reduced, the physical intensity of mechanical and electrical infrastructure work.
Competitive rivalry: Moderate overall, but concentrated at the top. While the broader specialty contracting industry remains highly fragmented, the hyperscale industrial tier functions as an oligopoly. The primary constraint on participants is skilled labor availability rather than project demand, which temporarily suppresses aggressive price competition—a dynamic likely to reverse if market demand normalizes.
flowchart TD
    subgraph Powers["Assessed Powers of Comfort Systems USA"]
        A["Process Power:<br>Offsite prefabrication workflows<br>and BIM-driven modular design"]
        B["Cornered Resource:<br>~22,700 skilled trades employees<br>amid a national labor shortage"]
        C["Scale Economies:<br>Bonding capacity, insurance,<br>procurement allocation"]
        D["Counter-Positioning:<br>Factory assembly vs.<br>traditional field labor model"]
    end
    A --> E["Currently elevated margins<br>and schedule certainty"]
    B --> E
    C --> E
    D --> E
    E --> F["Durability contingent on:<br>labor scarcity persisting and<br>hyperscaler demand continuing"]
Applying Hamilton Helmer's Seven Powers framework yields a similarly nuanced assessment:
Process Power: Present, but imitable. Integrating three-dimensional building information modeling with offsite factory prefabrication represents complex organizational knowledge accumulated across numerous projects. However, these manufacturing workflows are neither patented nor proprietary, and competing top-tier contractors are making similar investments. This capability provides an operational lead rather than an unassailable moat.
Cornered Resource: The strongest current advantage, but highly cyclical. Employing approximately 22,700 people—most of them licensed tradespeople—during a national skilled-labor shortage represents the company's most constrained operational asset.6 However, the durability of this advantage depends entirely on ongoing labor scarcity. A broader construction downturn would increase trade labor availability across the market, diluting this competitive edge.
Scale Economies: Real in risk absorption, rather than purchasing. Unlike the 1997 roll-up model that failed to secure national purchasing discounts on materials, modern scale provides substantial advantages in surety bonding capacity, self-insurance reserves, and balance-sheet risk absorption. These economies of scale enable Comfort Systems to bid on multi-hundred-million-dollar projects and maintain a $14 billion backlog, functioning as an entry barrier to project selection rather than a discount on materials.
Counter-Positioning: Weak. Counter-positioning requires that incumbent competitors cannot adopt a new model without damaging their core business economics. Traditional specialty contractors face no such economic penalty in adopting offsite modular fabrication; they are limited primarily by capital constraints and management execution. Established peers such as EMCOR and large private firms are expanding their prefabrication footprint without structural impediment.
Identifying the powers absent from Helmer's framework is equally instructive. Comfort Systems possesses no Branding power; trade contracts are awarded based on price, capability, and track record, and the corporate name rarely appears on job sites. Switching Costs are minimal, as projects are re-bid individually, and satisfied clients remain free to award future contracts to competitors. No Network Economies exist. Consequently, the company's competitive advantages remain operational—centered on execution capacity, balance-sheet strength, and workforce scale—rather than structural. Operational advantages can be eroded over time as well-capitalized competitors deploy capital to build competing capabilities.
EMCOR provides a key reference point, having executed a similar strategy at scale over a longer timeframe. The presence of a direct peer pursuing identical mechanical, electrical, and prefabrication capabilities demonstrates that Comfort Systems' market position is actively contested. The critical analytical question is whether Comfort Systems can sustain higher returns on capital than comparable peers over a full market cycle, or whether recent outperformance reflects a temporary advantage in project mix during an unprecedented technology investment surge.
Net Assessment: Comfort Systems maintains a strong, defensible position among the small group of specialty contractors equipped to execute hyperscale industrial projects, supported by its workforce, balance sheet, and offsite manufacturing capacity. However, these capabilities do not constitute a structural economic moat that would protect peak operating margins through an industry downturn. Current market valuations appear to price the business as if operational market leadership equates to permanent structural protection.
X. Historical Falsification & Skeptical Investor Stress Test
Every core investment thesis surrounding Comfort Systems requires evaluation against the strongest historical counter-evidence in the company's record. Four primary claims define the bull case.
Claim one: decentralized serial acquisitions compound value. The strongest counter-evidence appears in the company's initial corporate period from 1997 to 2002, when twelve founding contractors were acquired at elevated valuations, total debt climbed past $200 million, equity value dropped by more than 95 percent, and management was forced to sell nineteen operating units, including its largest division.45 That sequence provides a direct refutation of uncritical roll-up logic. The acquisition thesis holds only under specific constraints: targets must retain local operating autonomy and established brand names, sellers must remain aligned through multi-year earn-outs, transactions must be negotiated directly rather than auctioned, and the enterprise must avoid structural debt leverage. While the original roll-up violated each of these principles, modern operations adhere to them. The forward evaluation depends on tracking two specific metrics: whether any portion of the $1.10 billion in recorded goodwill as of June 30, 2026, faces future impairment, and how backlog growth splits between acquired units and same-store operations.9
Claim two: prefabrication creates an unassailable economic moat. As established in the analysis of offsite modular operations, prefabrication functions as a capital-intensity hurdle with inherent fixed-cost obligations rather than a permanent competitive moat. The primary test of this capability will occur during a quarter when customer schedules delay project delivery and modular plants operate below optimal capacity. Because Comfort Systems has not yet encountered a sustained utilization drop in its expanded facilities, this thesis remains unproven rather than verified. The absence of an operational stress event does not demonstrate structural resilience.
Claim three: technology infrastructure demand insulates the business from broader construction cycles. Corporate history contains two major counter-examples. During the tech downturn in 2001, a sharp contraction in nonresidential building contributed directly to the liquidity strain that brought the firm near insolvency. A second contraction occurred between 2008 and 2010, when revenue fell by approximately 20 percent. While current market commentary frames artificial intelligence infrastructure as a secular growth engine immune to broader economic swings, hyperscale capital investment has historically progressed in waves punctuated by capacity digestion periods. Hyperscale developers can quickly alter capital spending plans in response to shifting market conditions. Verdict: The absolute claim of insulation is rejected; technology exposure alters the timing and magnitude of the company's business cycle rather than eliminating cyclicality itself. The key indicator to monitor is whether same-store book-to-bill ratios drop below 1.0 for more than two consecutive quarters. With backlog expanding from $8.12 billion to $14.06 billion over a twelve-month period, book-to-bill remains elevated, making any future sequential decline in backlog a critical operational signal.2
Claim four: fixed-price contract risk has been largely eliminated. Management highlights contract mitigants including negotiated billing terms, cost-plus arrangements, guaranteed-maximum-price structures, material escalation clauses, and short execution cycles—noting that most construction backlog is performed within 18 to 24 months.8 While these mechanisms reduce project exposure, the fiscal 2025 Form 10-K explicitly confirms that Comfort Systems "bears the risk of cost overruns in most of our contracts."6 Consequently, contract risk has been mitigated rather than eliminated. Severe losses in trade contracting rarely stem from gradual margin compression; they occur when execution assumptions fail on a single large project, forcing immediate loss recognition. Verdict: The claim is narrowed. The primary operational metric to track is quarter-to-quarter gross margin volatility, particularly within the Electrical Services segment, which manages the company's newest and largest contract scopes.
The skeptical investor's case highlights three central vulnerabilities:
Valuation expansion represents the primary market risk. Comfort Systems historically traded at low double-digit earnings multiples reflecting its identity as a cyclical specialty contractor. Modern trading levels assign the enterprise a valuation multiple typical of a durable growth industrial company, backed by net income that quadrupled over a three-year span. Share prices ranging from roughly $757 to $2,074 over a twelve-month period indicate significant market uncertainty regarding appropriate valuation.3 Valuation multiple compression presents a clear downside risk: should annual revenue growth slow from the mid-30 percent range toward single digits and equity markets re-rate the stock toward traditional contractor averages, market capitalization could contract significantly even if underlying earnings remain stable. Strong operational execution provides no direct buffer against equity re-rating.
Customer and market concentration present a secondary risk. With a single technology client generating 12.8 percent of fiscal 2025 revenue and the technology sector accounting for 58 percent of total volume, overall corporate trajectory remains heavily dependent on procurement decisions by a small group of hyperscale developers.6 Shifts toward standardized equipment manufacturing by original equipment producers or capital spending reductions by major data center operators would register in total backlog within two quarters.
The third risk involves an expanding fixed-cost base. Annual capital expenditures running at 5 percent of revenue, an offsite manufacturing footprint expanding toward 5 million square feet, and a workforce of approximately 22,700 employees represent an operating cost structure built to support peak demand volume.86 Management notes that facility expansion occurs only against multi-year customer commitments; however, commercial contracts remain subject to counterparty strategic revisions over full market cycles.
In summary, Comfort Systems operates an efficient contracting business backed by a strong net-cash balance sheet and a disciplined managerial record established over more than two decades. However, historical performance does not indicate that current peak operating margins represent a permanent structural baseline. The evidence indicates that Comfort Systems is positioned to navigate an industry downturn more effectively than less capitalized competitors—a meaningful operational strength, but a more measured outlook than current equity valuations suggest.
XI. Playbook: Business & Investing Lessons
Six transferable lessons emerge from this corporate history, each carrying distinct operational and investment implications.
First: rescuing a failed roll-up requires structural divestiture rather than incremental cost-cutting. When a leveraged acquisition platform faces insolvency, the standard temptation is to trim overhead and attempt to grow into the debt load. Comfort Systems instead divested roughly a third of its operations—including its premier industrial division—to a competitor at a distressed valuation, using the proceeds entirely to retire bank debt.4 In a cyclical trade-contracting business with limited pricing power, balance-sheet solvency is the prerequisite for all other strategic options. When survival depends on debt obligations the company cannot service, management must sell marketable assets to eliminate leverage, regardless of asset quality or execution pain.
Second: when labor is the binding constraint, alter the work environment. Most trade contractors respond to labor shortages by bidding up hourly wages, increasing project costs without expanding output. Prefabrication shifts the underlying productivity equation: offsite assembly increases output per labor hour and expands the candidate pool by transferring complex assembly tasks from ladder-bound field jobs to factory settings. The operational trade-off converts variable field labor into fixed facility overhead, yielding economic benefits only while factory utilization remains high.
Third: negative working capital provides capital efficiency while serving as an early indicator of execution quality. A contractor that estimates accurately and bills promptly operates on customer-funded working capital. This dynamic enabled Comfort Systems to expand revenue substantially over a decade while avoiding structural debt and equity dilution. However, deteriorating cash conversion provides the earliest signal of job-cost overruns or delayed billing—appearing in cash flow statements quarters before impacting reported operating margins.
Fourth: category errors distort valuation in both expansionary and contractionary phases. Investors who categorized Comfort Systems strictly as a legacy commercial heating contractor between 2019 and 2024 overlooked its strategic positioning within advanced computing supply chains. Conversely, treating the business purely as a secular technology firm risks ignoring its core realities as a labor-intensive, fixed-price contractor whose margins reflect temporary capacity shortages. Accurately evaluating the enterprise requires accounting for both its operational trade characteristics and its technology exposure.
Fifth: observe how management treats premier assets under duress. The most informative event in Comfort Systems' history was the 2002 sale of its primary industrial unit. Management teams reveal core risk priorities under financial strain. A leadership team willing to sell its crown jewel to achieve financial solvency demonstrates a fundamental risk discipline. The subsequent two decades of low debt leverage, disciplined bidding, and selective acquisition underwriting stem directly from that restructuring experience.
Sixth: operational preparation requires an external market catalyst to generate outsized returns. Comfort Systems maintained disciplined execution for nearly two decades before three years of accelerating data center demand transformed its financial results. The prefabrication footprint, electrical capabilities, net-cash balance sheet, and decentralized bidding framework were fully established before hyperscale spending accelerated. Operational capacity without immediate market demand can appear modest for long periods—explaining why such preparation is rarely priced in advance, yet creates substantial operating leverage when demand arrives.
XII. Future Outlook, Forward Risk Radar & Key KPIs to Watch
As of September 2026, Comfort Systems enters its next operational phase with $14.06 billion in backlog, $1.85 billion in cash, a modular factory footprint expanding toward 5 million square feet, and a newly appointed chief operating officer.2811 The forward strategy relies on clear priorities: expanding modular fabrication capacity across Sunbelt corridors hosting data center and semiconductor facility construction, deepening liquid-cooling and high-voltage electrical capabilities, acquiring regional trade contractors in the $50 million to $150 million valuation range, and converting contracted backlog into revenue within labor constraints.
The operational risk radar, ordered by potential financial impact:
Hyperscaler capital spending digestion — high impact, unknown timing. This represents the primary structural exposure. A spending slowdown would manifest first as decelerating backlog growth, followed by a sequential backlog decline, pricing pressure on new contract awards, and ultimately margin compression—a lag of four to six quarters from initial demand shifts to reported financial statements. Investors waiting for income statement confirmation will react well after the operational shift occurs.
Labor and wage inflation — medium impact, continuous. Wages for skilled trades continue to rise, and the company's ability to pass on cost increases depends on persistent labor scarcity. Prefabrication mitigates field labor requirements but does not eliminate wage pressure.
Fixed-cost absorption on the modular footprint — medium impact, coupled to capital spending cycles. A capital expenditure program running at 5 percent of revenue is structured for continued volume expansion.8 Should revenue growth stall, fixed facility overhead and equipment depreciation will persist regardless of plant utilization.
Regulatory and local opposition to data center development — low-to-medium impact. Municipal moratoriums and utility interconnection delays create tangible project friction. Management's assertion that affected projects relocate rather than cancel remains a strategic hypothesis rather than a verified market finding.8
Valuation re-rating — high impact on investment returns, zero impact on operations. Multiple compression requires no operational deterioration to reduce market capitalization, separating equity valuation risks from underlying business execution.
Succession execution — medium impact, multi-year horizon. The decentralized operating structure depends on corporate leadership refraining from operational intervention. Whether that discipline persists following executive transitions remains an unverified operational test.
Three key performance indicators offer the clearest signals of business trajectory:
1. Same-store backlog and sequential backlog direction. Same-store figures exclude acquisitions, isolating organic performance. The critical metric is not the rate of growth—which will moderate from peak 2025–2026 levels—but the initial sequential decline in total backlog, signaling a broader turn in the demand cycle.
2. Operating cash flow relative to net income. Operating cash conversion above 100 percent confirms that clients continue to provide advance billings and that project cost estimation remains accurate. A decline below 100 percent indicates either decelerating growth velocity or field execution challenges, providing an early signal before reported margins compress.
3. Gross margin stability, particularly in the electrical segment. A gross margin of 25.9 percent reflects the current supply-demand imbalance in high-tech contracting.2 Monitoring whether margins hold or compress—and whether reductions occur gradually or through discrete project write-downs—tests whether offsite modular manufacturing has permanently altered trade contracting economics or temporarily benefited from peak demand.
Comfort Systems addressed its foundational existential risk in 2002 by divesting a third of its operations to retire bank debt. The remaining challenge is operational discipline: maintaining bidding rigor and capital allocation through the most favorable demand environment in the company's history.
References
-
Comfort Systems USA Reports Fourth Quarter and Full Year 2025 Results (Form 8-K Exhibit 99.1) — SEC EDGAR, 2026-02-19 ↩↩↩↩↩↩
-
Comfort Systems USA Reports Second Quarter 2026 Results (Form 8-K Exhibit 99.1) — SEC EDGAR, 2026-07-23 ↩↩↩↩↩↩↩↩↩↩↩
-
Comfort Systems USA Company Profile & Market Data — Reuters ↩↩
-
EMCOR Group To Acquire 19 Companies From Comfort Systems USA — PM Magazine, 2002-02-27 ↩↩↩↩
-
EMCOR / Comfort Systems Deal Finalized — ACHR News, 2002-03-18 ↩↩↩
-
Comfort Systems USA, Inc. Annual Report on Form 10-K for fiscal year ended December 31, 2025 — SEC EDGAR, 2026-02-19 ↩↩↩↩↩↩↩↩↩↩↩↩↩↩
-
Comfort Systems USA, Inc. Quarterly Report on Form 10-Q for the period ended September 30, 2025 — SEC EDGAR, 2025-10-23 ↩↩
-
Earnings call transcript: Comfort Systems USA tops Q2 2026 estimates — Investing.com, 2026-07-23 ↩↩↩↩↩↩↩↩↩↩↩↩↩↩
-
Comfort Systems USA, Inc. Quarterly Report on Form 10-Q for the period ended June 30, 2026 — SEC EDGAR, 2026-07-23 ↩↩↩↩↩
-
Comfort Systems USA DEF 14A Proxy Statement — SEC EDGAR, 2025-04-24 ↩↩
-
Comfort Systems Announces Leadership Transitions and Appointments Effective as of July 1, 2026 — StockTitan, 2026-06-22 ↩↩
 LinkedIn
 WhatsApp
 Reddit
 Hacker News
 Email
Email Kindle
 RSS Feed
 Spotify
 Apple Podcasts
 Amazon Music
 Audible
 YouTube