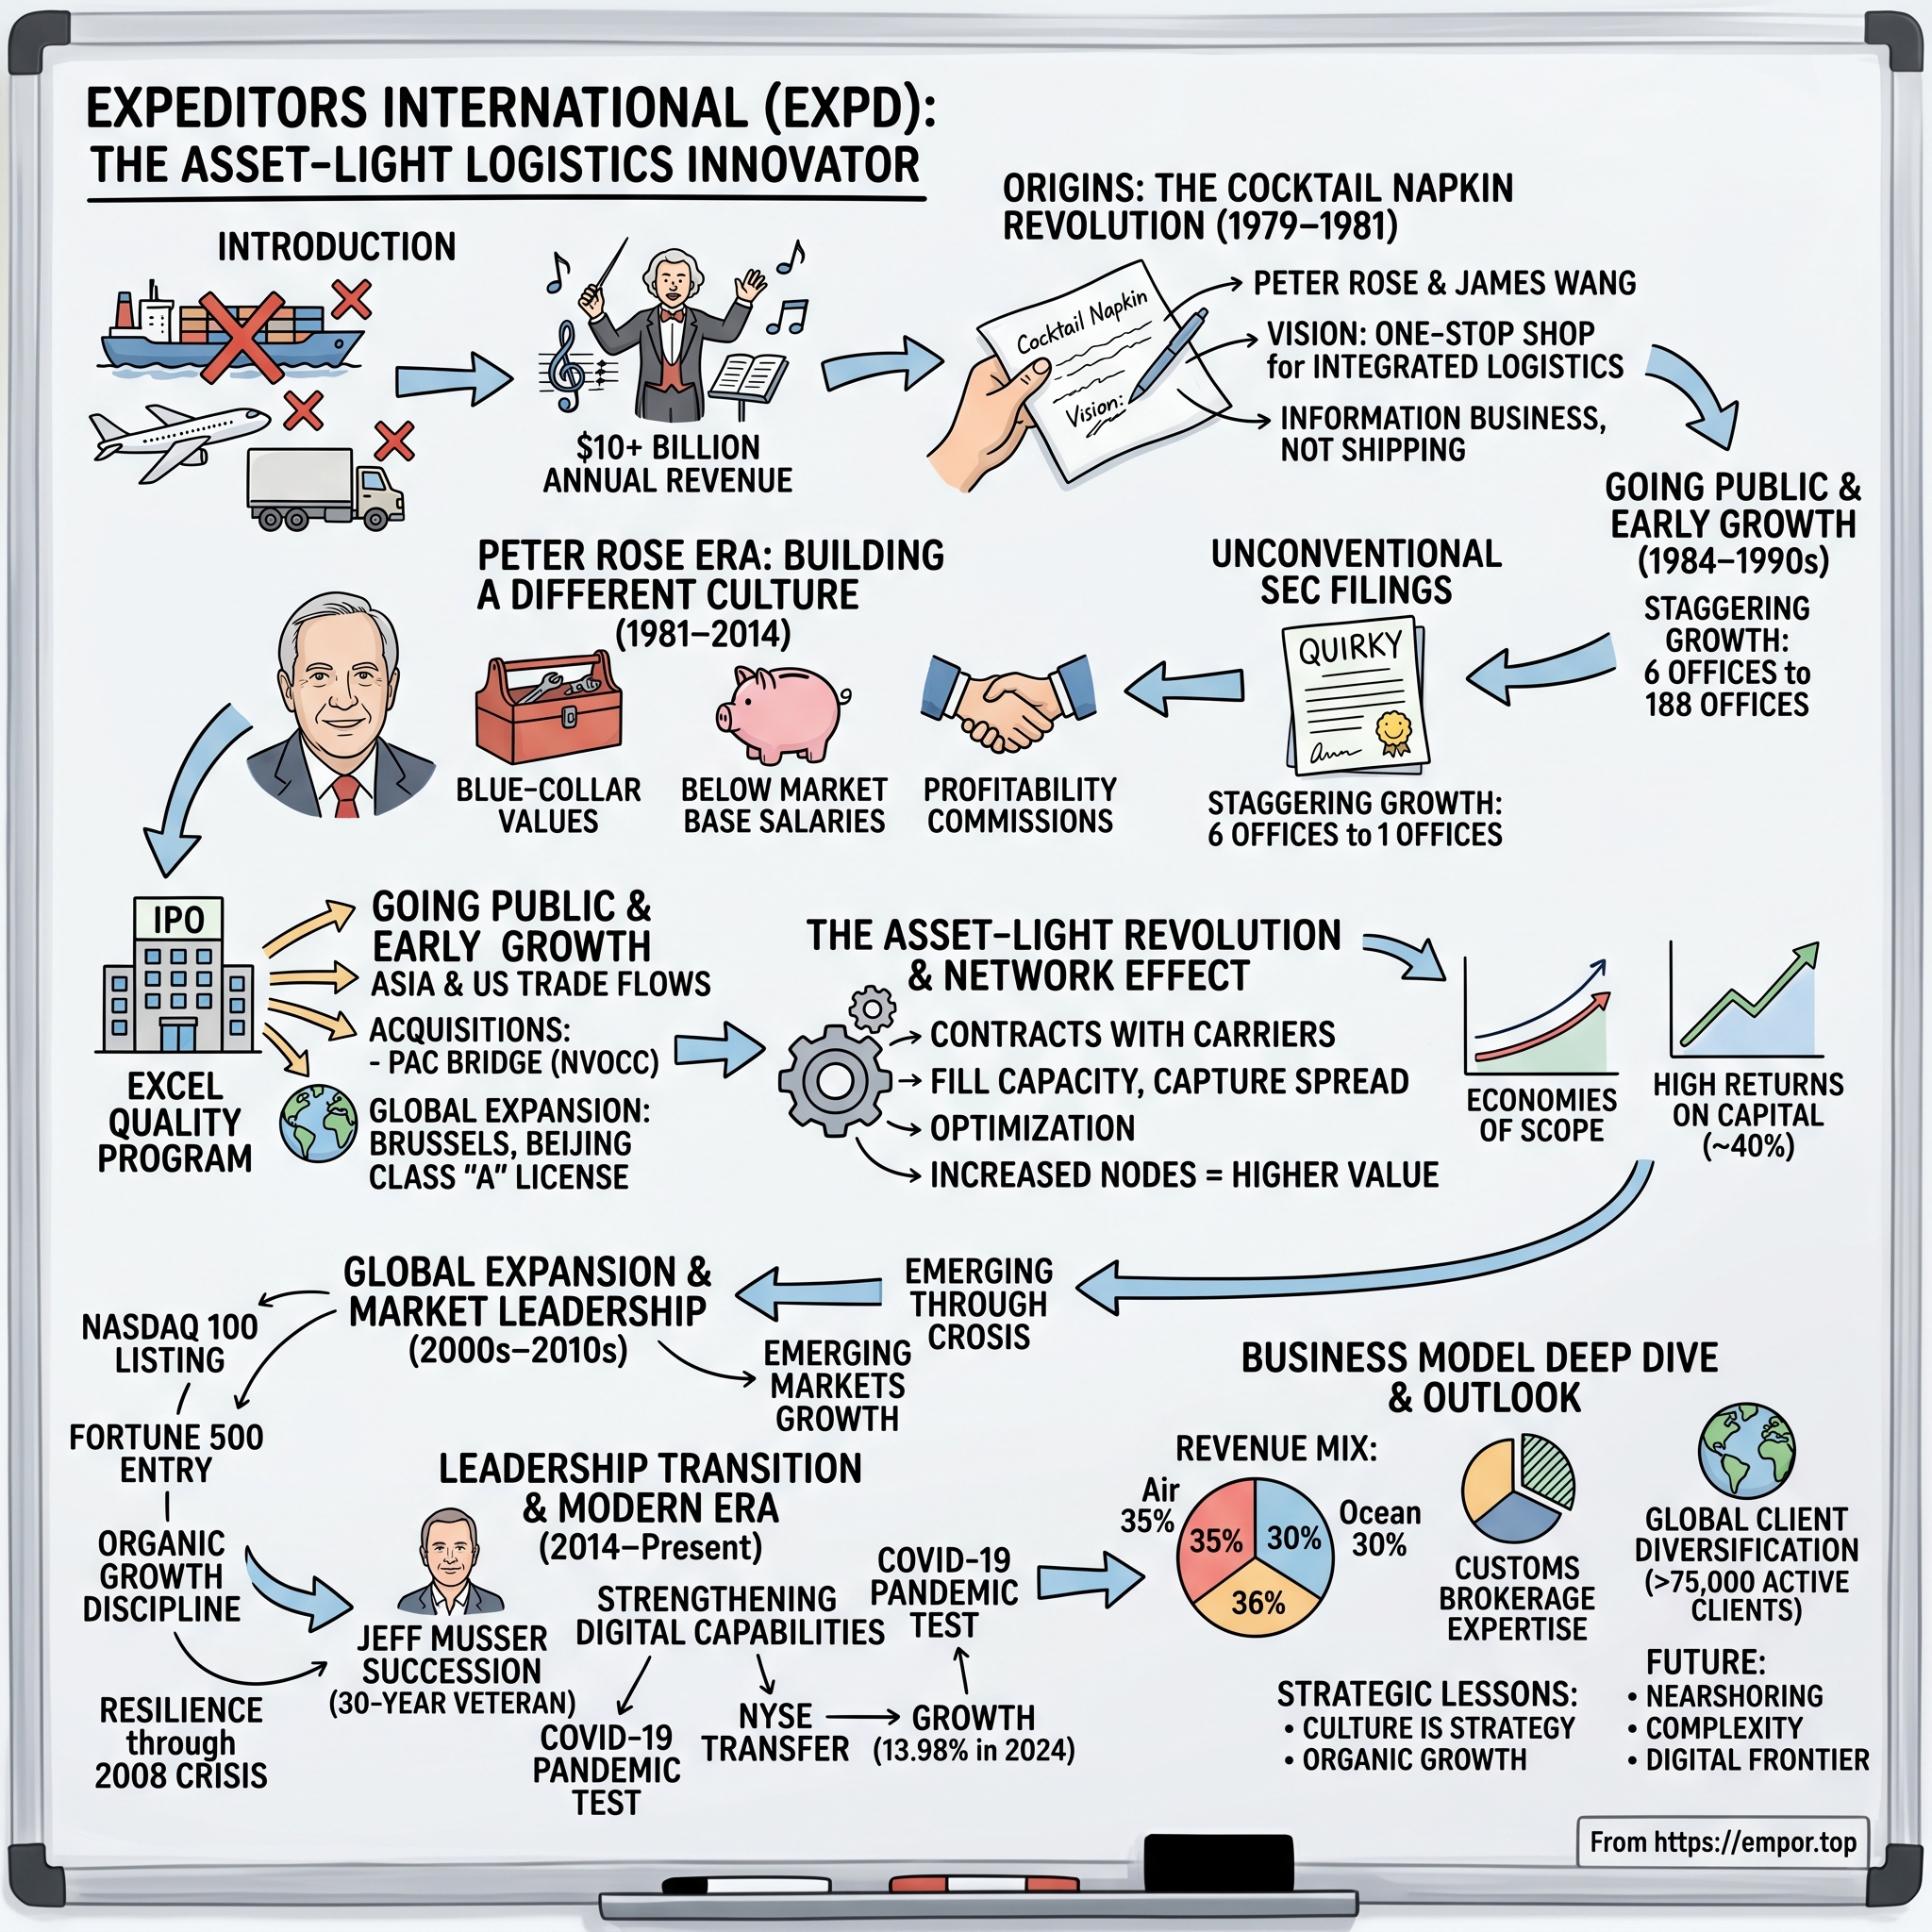
Expeditors International: The Asset-Light Logistics Powerhouse
I. Introduction & Episode Roadmap
There is a particular kind of business that makes professional investors uncomfortable, and Expeditors International of Washington has done so for more than four decades.
Consider the physical footprint. Expeditors manages a major share of global high-value air and ocean freight without owning cargo aircraft, container ships, port terminals, long-haul trucks, or delivery fleets. Its headquarters sits in Bellevue, Washington — across Lake Washington from Seattle, far from traditional shipping hubs. The business relies on roughly 20,400 full-time equivalent employees operating across more than 335 locations in about 100 countries, all connected by a single proprietary information system.12
For most of its history as a public company, Expeditors has generated returns on invested capital well above those of asset-heavy carriers and manufacturers, largely because its asset base is small. When the primary capital inputs are office leases, an IT network, and employees trained to classify goods under complex tariff schedules, capital employed remains minimal.
The company's corporate governance and communications also diverge from peer standards. For decades, Expeditors answered shareholder questions directly inside its SEC filings using an unvarnished written Q&A format. It has consistently refused to provide forward earnings guidance. Furthermore, it maintained a balance sheet free of meaningful long-term debt through economic downturns, trade disputes, the COVID-19 pandemic, and a major 2022 cyberattack that disrupted its global network. Unlike many logistics peers that rely on large-scale M&A, Expeditors has avoided transformational acquisitions.
This divergence in capital allocation remains a central strategic question in 2026. While Expeditors expanded organically, European rivals grew primarily through acquisitions. Danish logistics group DSV acquired UTi Worldwide, Panalpina, and Agility’s Global Integrated Logistics division before committing approximately €14.3 billion for DB Schenker — a transaction making DSV the world's largest freight forwarder by volume.[^3] Meanwhile, Kuehne + Nagel leads in ocean freight volumes, and DHL Global Forwarding benefits from the backing of a major postal incumbent. Measured purely by cargo tonnage and container volumes, Expeditors has surrendered market rank. Measured by return on capital and cash returned per share, however, its financial performance remains distinct.
The thesis under examination is specific and testable. Expeditors attributes its performance to three main advantages: a branch-level compensation model designed to align incentives with profit generation, a unified global IT platform that links network operations, and trade-compliance expertise that gains relevance during periods of tariff volatility. Each claim has been tested throughout the company's operating history. This analysis evaluates each factor, outlining the empirical evidence required to validate or challenge these assumptions.
The roadmap covers: the company's origins; the Peter Rose era and the mechanics of its compensation model; the operational realities of freight forwarding and why net revenue is the key metric; the impact of the COVID-19 demand surge and the February 2022 cyberattack; the current management under Chief Executive Officer Daniel R. Wall; an evaluation of management claims against historical execution; competitive positioning; risk factors; and the key performance indicators shaping the bull and bear investment cases.
The story begins with a small founding team driven by frustration with existing industry practices.
 Subscribe on LinkedIn
II. Origins: The Lantau Napkin & The Seven Founders (1979–1984)
Consider a bar on Lantau Island, Hong Kong, in July 1981. Lantau at the time was vastly different from its modern state—it had no international airport, major theme park, or high-speed rail connection. It was a large, quiet island reached by ferry, offering a retreat from the density of Kowloon. Two men sat there addressing a problem they had each encountered from opposite sides of transpacific shipping.
One was Peter Rose, an American in his late thirties who had entered the freight business as a courier, learning the industry from loading docks upward rather than through an academic business program. The other was James Wang, who understood the origin side of Asian trade: factory logistics, cargo consolidators, drayage trucking, customs bureaucracy, and the operational frictions connecting an Asian manufacturing plant to a North American warehouse.
They were analyzing the same structural flaw from complementary perspectives. An American importer buying goods from Asia in 1981 had to manage a fragmented chain of independent intermediaries: one company handled factory pickup, another consolidated cargo, a third booked capacity with airlines or ocean carriers, a fourth cleared U.S. customs, and a fifth provided inland trucking. Every transfer introduced risks of miscommunication, lost accountability, and margin leakage. When operational failures occurred, no single entity assumed responsibility for the end-to-end outcome.
The concept Rose and Wang outlined relied on operational integration rather than technological innovation: consolidate origin cargo management, air freight forwarding, ocean freight forwarding, and U.S. customs brokerage under a single organization with unified documentation and single-point accountability. By controlling shipments from factory loading docks in Asia, a company could secure operational economics through to destination delivery docks in North America.
The corporate vehicle for this strategy was established two years prior. Expeditors International was established in Seattle in 1979 as a modest ocean freight forwarder serving Pacific Northwest importers.2 It was initially small and undercapitalized, but possessed an advantageous geography: Seattle served as a primary North American gateway for transpacific trade, providing a physical foundation for the strategy developed after 1981.
The coalition
The founding group assembled to execute this strategy was unusually broad for an early-stage logistics firm: Rose and Wang were joined by Kevin Walsh, Hank Wong, George Ho, Robert Chiarito, and Glenn Alger. In freight forwarding—a relationship-driven business operating across multiple regulatory jurisdictions—this geographical dispersion proved critical. A single executive could not simultaneously manage operations in San Francisco, Chicago, Hong Kong, Taipei, and Singapore. The seven founders each took responsibility for a specific network node and operated it semi-autonomously, establishing a structure that defined the company for decades: operational authority resided at the local branch rather than corporate headquarters.
While traditional logistics companies of that era operated as centralized hub-and-spoke hierarchies, Expeditors functioned more like a decentralized federation. Corporate management established the software platform, compliance rules, and incentive formulas, while individual branch managers determined target accounts, carrier selection, and localized pricing. This decentralized structure emerged not from abstract management theory, but from the practical necessity of coordinating seven founders across ten time zones without centralized micromanagement.
Going public in 1984
Expeditors listed on NASDAQ in 1984 with modest initial operating scale: six branch offices, approximately 20 employees, and an initial capital base of about $300,000. The public offering was designed not to generate liquidity for the founders or fund corporate acquisitions, but to raise capital to expand the international branch network required to service both ends of key trade corridors.
In its first full year as a public entity, Expeditors generated over $50 million in gross revenues and $2.1 million in net earnings. That performance—yielding roughly four cents of net profit per dollar of gross revenue—highlights a fundamental characteristic of freight forwarding economics examined later in this analysis. The majority of gross revenue represented pass-through freight charges paid to underlying ocean lines and air carriers rather than retained top-line revenue.
At the time of the IPO, the founders established a capital allocation policy that remained intact through subsequent executive leadership: all network expansion would be funded strictly through internal operating cash flow. The company avoided debt-financed growth and leveraged acquisitions. International branches, such as a new location in Rotterdam, were opened only when generated cash flow could cover setup costs out of pocket.
In 1984, this policy reflected conservative risk management in an industry subject to recurring cyclical downturns, where leveraged forwarders frequently failed during demand contractions. Four decades later, this zero-debt mandate stands as either Expeditors' core balance-sheet strength or a constraint on inorganic growth, depending on peer benchmarks. The executive who codified this capital discipline into a core corporate philosophy assumed the chief executive role the year after the initial public offering.
III. The Peter Rose Era: Culture, SEC Filings, & The Flywheel (1984–2014)
To understand Peter Rose's leadership style, one can look to an Expeditors 10-Q from the mid-2000s — specifically the section following the financial statements, where the company published written questions from investors and analysts alongside direct management responses.
While peer companies rarely used that space for more than standardized disclosures, Rose used it to challenge prevailing Wall Street norms. When asked for quarterly earnings guidance, he argued at length that the practice encouraged managers to prioritize short-term targets over core operations. When asked to model upcoming yield margins, he noted that because the company could not forecast airline rate changes from month to month, predicting short-term earnings was speculative rather than analytical. His responses were candid, pragmatic, and frequently critical of financial modeling detached from operational realities.
This unconventional disclosure strategy served a strategic purpose. By consistently refusing to issue earnings guidance, Rose insulated local operators from short-term quarterly pressure. A branch manager in Antwerp who knows headquarters has committed to a quarterly earnings target faces different operational incentives than one operating without such corporate constraints. Whether this policy yielded superior long-term returns remains an empirical question, but it represented a deliberate structural design rather than mere corporate eccentricity.
The compensation architecture
The primary engine of the company's operating model was its compensation structure, which rested on two principles rarely combined among large public corporations.
First, Expeditors set base salaries below market averages while allocating a fixed 10% share of local operating profit directly to the branch employees who generated it. Under this framework, a branch manager in Chicago functioned less like a standard salaried employee and more like a franchise operator backed by corporate infrastructure, with compensation tied directly to local profitability. Winning a major account increased branch payouts that quarter, while cost overruns directly reduced compensation.
This mechanism provided essential flexibility to the company's cost structure. In an asset-light business where personnel represents the primary expense, tying a large portion of compensation to branch operating profit allowed the cost base to contract automatically during industry downturns — mitigating the need for widespread layoffs or restructuring charges. When global trade volumes collapsed in 2009, Expeditors' compensation expenses declined in tandem with net revenue, absorbing margin pressure through pre-established variable pay formulas.
Second, senior executives did not receive equity grants or stock options. Instead, executive incentive compensation was tied to cash growth in enterprise-wide operating income rather than share-price performance, reducing management incentives to manipulate stock values through share repurchases or aggressive accounting. Consequently, Expeditors maintained exceptionally low equity dilution compared to other major U.S. public companies.
While this compensation structure aligns branch incentives with incremental margin growth on every shipment, it also carries operational risks. During cyclical downturns, an employee's total compensation can decline significantly regardless of individual performance — a dynamic that presents retention challenges during industry contractions when operational continuity is critical.
The China license and the network build
A pivotal development of the Rose era was geographic and regulatory rather than financial. In 1993, Expeditors secured a Class "A" license in Beijing, granting it direct operating rights in mainland China at a time when most Western logistics competitors relied on joint ventures and local agents. Direct control over origin cargo management inside China during its rapid manufacturing expansion positioned Expeditors at the primary origin point of transpacific trade. Securing that first-mile management allowed the company to control customer relationships for freight originating across Chinese industrial centers.
Around this core trade corridor, Expeditors systematically built out its global network: Asian origin stations connected to North American destinations, a European gateway operation anchored in Brussels, and expanding footprints in Latin America and the Middle East. Each additional branch increased network density. Higher cargo volumes across established trade lanes enabled tighter consolidations, improved load factors for ocean containers and air unit load devices purchased at wholesale rates, and stronger bargaining leverage when negotiating block space agreements with carriers.
By the time Rose stepped down as chief executive in 2014 after more than three decades leading the firm, Expeditors had grown from its initial $300,000 capital base to nearly $6 billion in gross revenues, operating 188 offices across six continents and generating double-digit growth in operating income in most of its years as a public company.
That track record established the company's market reputation, but it also introduced strategic complexity. Decades of steady compounding fostered a strong corporate belief that internal methodology alone drove success, potentially obscuring the role played by China's rapid industrial expansion. Disentangling management model performance from secular macroeconomic trends requires examining the underlying mechanics of freight forwarding operations.
IV. Anatomy of Freight Forwarding: Industry Structure & Economics
Here is the single most misleading number in the freight forwarding industry, and it sits right at the top of the income statement.
In 2025, Expeditors reported revenues of approximately $11.07 billion.34 That figure offers little insight into how the company actually performed. To understand why, one must look at how freight forwarding revenue is constructed.
Buying wholesale, selling retail
Consider an airline flying a Boeing 777 from Hong Kong to Chicago. Below the passenger deck sits cargo space the carrier needs to fill. Selling that capacity in small increments to hundreds of individual shippers creates administrative overhead, so the airline sells large cargo blocks at wholesale rates to a select group of freight forwarders.
Expeditors buys those blocks and fills them by consolidating shipments from multiple clients—combining medical devices, consumer electronics, or semiconductor components—and charging each customer a retail rate. The spread between the wholesale rate paid to the carrier and the retail rate charged to the shipper represents the company's true economic revenue.
Under standard accounting rules, however, the full amount billed to the client is reported as gross revenue, while payments to carriers are categorized as transportation costs. When airfreight rates spike—whether due to passenger fleet groundings during a pandemic or ocean cargo diversions during a Red Sea shipping crisis—Expeditors' reported gross revenue surges, even if cargo volume and net spreads remain unchanged. Conversely, when freight rates drop, top-line revenue contracts sharply without reflecting a fundamental change in underlying business activity.
The critical metric for evaluating performance is net revenue: gross revenue minus carrier transportation costs. This figure serves as the industry's effective top line, often designated as gross profit in company reporting. In 2025, against $11.07 billion in gross revenue, Expeditors generated roughly $1.69 billion in net revenue.3 In practical terms, about 85 cents of every reported gross revenue dollar represented pass-through carrier costs rather than retained revenue.
Understanding this distinction reframes the company's financial trajectory. In 2023, reported gross revenue dropped approximately 43% year-over-year to $9.3 billion, appearing severe on a headline basis. Yet operating income that year stood at $940 million, matching the $940 million earned in 2020.3 While the top line tracked volatile freight rates, operating income reflected the underlying stability of the business.
The three product lines
Expeditors reports operating results across three main segments, with the mix shifting toward higher-value services.
Airfreight accounted for roughly 36% of 2025 revenues.4 As the highest-velocity and most rate-volatile segment, airfreight is highly sensitive to urgent high-value cargo movements. In 2025 and 2026, demand was heavily driven by technology hardware supporting artificial intelligence data center expansion, which required shipping high-cost, time-critical equipment across transpacific and transatlantic lanes.
Ocean freight and ocean services generated about 25% of 2025 revenues,4 operating primarily under non-vessel operating common carrier (NVOCC) status. As an NVOCC, Expeditors issues its own bills of lading to customers and assumes carrier liabilities, while purchasing physical container slots from ocean shipping lines. This structure functions as a carrier on contract and a customer in practice—providing margin flexibility when shipping capacity is abundant, but exposing margins to pressure when vessel space becomes constrained.
Customs brokerage and other services represented roughly 39% of 2025 revenues,4 becoming the company's largest business segment. This division encompasses trade compliance, tariff classification, entry filing, duty drawback management, distribution, order management, and specialized cargo handling.
Customs brokerage carries lower rate volatility and higher per-transaction technical requirements than freight transportation. Revenue in this segment scales primarily with regulatory complexity rather than cargo volume. As tariff schedules expand, exemption rules change, and origin verification requirements tighten, international shipments require additional processing and documentation. Management has highlighted this dynamic, and reporting from 2026 reflects it: customs brokerage, transborder freight, distribution, and order management each generated double-digit revenue growth in the first and second quarters of 2026.56
Which of the seven powers actually apply
Evaluating Expeditors through Hamilton Helmer's 7 Powers framework requires applying its concepts strictly against operational realities.
Counter-positioning is present but incomplete. An asset-light structure allows Expeditors to shift cargo across carriers as freight rates fluctuate without maintaining vessel or aircraft fleets during demand contractions. While asset-heavy carriers retain capital costs during market downturns, Expeditors simply reduces booked space. However, this is not counter-positioning in the strict strategic sense, as major logistics peers operate under similar asset-light models. The structure represents an industry-wide position rather than a proprietary competitive advantage.
Process power represents the company's strongest strategic claim. Four decades of localized branch execution, a unified global IT platform, and specialized trade-compliance knowledge are difficult for competitors to replicate quickly. This advantage is reflected in Expeditors' ability to generate consistently higher operating margins on net revenue than most scale competitors over extended periods. Conversely, the vulnerability of relying on a single, centralized IT architecture was exposed during the February 2022 global network disruption.
Network economies present a weaker explanation for outperformance. While an expanded branch network enhances cargo consolidation density and carrier purchasing power, that scale logic inherently favors the largest operators. Expeditors no longer holds top market share by volume; rivals such as DSV and Kuehne + Nagel manage larger networks. Because these larger competitors do not consistently outpace Expeditors in operating margin, network scale appears secondary to operational execution.
The most defensible competitive moat is therefore a combination of switching costs and process power. Shippers with order management and customs workflows integrated into Expeditors' software—and supported by branch teams familiar with their product catalogs and supplier networks—face friction when switching providers. This competitive advantage is narrower than pure scale, and its durability was put to a direct operational test during the February 2022 system outage.
V. Modern Inflection & COVID Supercycle: From Peak Yields to Cyber Crisis (2014–2023)
On February 20, 2022, Expeditors initiated an unprecedented operational pause by disabling its global IT network.
A severe cyber incident had breached company systems. To prevent malware from spreading across its single integrated operating platform, management shut down most operating systems worldwide.7 The centralized technology architecture that served as the company's core operational asset suddenly became a single point of failure, forcing operations offline at a critical juncture in global supply chains.
Understanding the gravity of this disruption requires examining the extraordinary operating conditions of the preceding two years.
The handoff and the supercycle
Peter Rose retired as chief executive officer in 2014, handing leadership to Jeffrey S. Musser, a 30-year company veteran who had advanced through branch operations and information technology. The internal succession reflected corporate policy: promoting long-tenured operators preserved the branch-level compensation culture without requiring external strategic resets.
During Musser's initial five years, financial results expanded steadily, with operating income rising from the mid-hundreds of millions to $767 million by 2019.3 The onset of the COVID-19 pandemic in early 2020 subsequently triggered an unprecedented disruption across global trade lanes.
Passenger airlines grounded fleets en masse, eliminating roughly half of global air cargo belly capacity overnight. Concurrently, consumer spending shifted rapidly toward physical goods, causing severe port congestion, container misallocation, and schedule cancellations.
Freight spot rates escalated sharply. Because Expeditors purchases transportation capacity at wholesale rates and resells it at retail prices, both sides of its spread expanded. Retail rates increased faster as shippers paid premium rates to secure scarce transportation capacity. Forwarders with established carrier relationships and committed block space agreements commanded significant pricing leverage.
This dynamic generated historic financial performance. Gross revenue reached $16.5 billion in 2021 and $17.1 billion in 2022, while operating income expanded to $1.91 billion and $1.82 billion in those respective years.3 Compared to the $767 million earned in 2019, operating income more than doubled within two years without debt accumulation or inorganic acquisitions.
Analytical evaluation indicates this performance represented an industry-wide cyclical windfall rather than a permanent expansion of market position. Competitors across the logistics sector posted record earnings during this period. What distinguished Expeditors was its capital allocation: management returned the excess cash flow to shareholders through dividends and share repurchases rather than deploying capital into peak-cycle acquisitions.
The outage
The February 2022 cyberattack hit during this period of elevated freight activity. For approximately three weeks, clients could not track shipments, process customs entries, or manage inventory through Expeditors' digital platforms. The company relied on manual workarounds where feasible, but cargo delays mounted across major gateways.
Management ultimately quantified the financial impact at approximately $65 million, comprising roughly $47 million in operational charges and $18 million in remediation costs and client claims.8 Operations were substantially restored by early March 2022.[^10] The outage prompted subsequent client litigation, including claims filed by robotic appliance manufacturer iRobot.
While brief operational disruptions are often absorbed in multi-decade customer relationships, the three-week outage exposed a structural risk. The unified IT system that drove operational efficiency also created systemic vulnerability. Importers that had relied exclusively on Expeditors diversified their logistics providers to mitigate single-vendor exposure, introducing multi-sourcing strategies that persisted after system recovery.
The unwind and the exchange move
As freight spot rates normalized through 2023, reported gross revenue contracted by approximately 43% to $9.3 billion.3 Net revenue and profitability proved more resilient; operating income of $940 million remained comfortably above pre-pandemic levels. Tying branch compensation to operating profit allowed variable pay expenses to adjust automatically alongside net revenue, absorbing margin pressure without requiring corporate restructuring programs.
In November 2023, Expeditors transferred its stock listing from NASDAQ, where it had traded since its 1984 initial public offering, to the New York Stock Exchange.9 While the transfer had negligible impact on trading mechanics or index inclusion, it symbolically reinforced the company's positioning as an established industrial services firm rather than a high-growth technology stock.
The 2014–2023 period demonstrated both the structural resilience of Expeditors' flexible cost model and the operational vulnerability of its centralized technology infrastructure. The subsequent transition in executive leadership would test management's ability to maintain capital discipline while addressing these architectural risks.
VI. Current Management, Governance, & Capital Allocation under Daniel Wall (2023–Present)
On April 1, 2025, Daniel R. Wall became President and Chief Executive Officer of Expeditors International, succeeding Jeffrey Musser, who retired on March 31.
Wall brought 38 years of internal experience to the role, having most recently served as President of Global Geographies, overseeing the branch network. Eugene K. Alger, another long-tenured insider, stepped into the role of President of Global Services.
Wall marks the third consecutive chief executive promoted directly from the branch system. Proponents view this tradition as essential for preserving an operating culture rooted in localized incentives and execution. Skeptics argue that four decades of internal promotions risk institutional myopia during a period defined by industry consolidation, rapid digitization, and shifting global trade routes. Ultimately, evaluating management requires examining operational choices, and Wall's first 18 months in office produced notable shifts in corporate posture.
The CFO transition and a $12 billion record
In August 2025, Expeditors announced that Senior Vice President and Chief Financial Officer Bradley S. Powell would retire on September 30, with David A. Hackett—Vice President of Finance since May 2024—assuming the CFO role on October 1.10
Powell's 17-year tenure provided clear empirical evidence of capital discipline. During his time as CFO, the annual dividend expanded from $0.32 to $1.54 per share, and the company returned approximately $12 billion to shareholders through combined share repurchases and dividends.10
Conversely, that $12 billion outlay represents capital withheld from large-scale acquisitions or physical asset expansion. Whether this distribution reflects disciplined capital allocation or missed growth opportunities remains a central debate among industry analysts.
What Wall has actually done
A notable strategic pivot occurred in the second quarter of 2026, when Expeditors recorded a $25 million pretax restructuring charge—part of an expected $27 million in total charges—to reorganize its Global Technology function, aiming for approximately $50 million in annual savings, representing nearly a tenth of corporate overhead.116
Management framed the reorganization around technology capabilities rather than expense control. CFO David Hackett stated that the action was designed "to modernize and reshape our Global Technology function for the future," emphasizing that the shift was "not driven by cost reduction" and that realized savings would be reinvested in artificial intelligence, technology talent, and software development.11
This announcement presents contrasting interpretations. On one hand, a business reliant on a single unified IT platform may simply be restructuring legacy systems for modern software demands. On the other hand, taking a restructuring charge marks a departure for a firm historically averse to non-recurring operational adjustments, making claims of non-cost-driven motives questionable alongside a $50 million reduction. Operational adjustments were scheduled to concentrate headcount reductions in the third quarter of 2026, following a period where total staffing remained flat at approximately 20,400 full-time equivalents across the first and second quarters.6
Evaluating the initiative requires monitoring whether technology expenditures increase as a proportion of net revenue over subsequent quarters. If realized savings flow directly to operating margin, the reorganization functions primarily as expense management; if deployed into system development, it signals genuine strategic reinvestment.
The balance sheet and the buyback
Expeditors maintained its conservative balance sheet into mid-2026, holding approximately $1.03 billion in cash and cash equivalents, $1.45 billion in working capital, and no long-term debt beyond lease liabilities.12 Effective July 1, 2026, the board authorized a new $3.0 billion share repurchase program to replace an expiring authorization.12
Capital distributions accelerated during 2026. In the second quarter alone, Expeditors returned $461 million through share repurchases and dividends, raising total first-half distributions to $748 million.6 Contextualized against full-year 2025 net income of $813 million,3 this payout rate meets or exceeds ongoing annual earnings power, supported by accumulated cash reserves.
This consistent buyback activity significantly reduced share count over the long term. Diluted shares outstanding fell from approximately 182.7 million in 2016 to 136.2 million in 2025, retiring roughly 25% of equity over nine years.3 For a business operating in a mature, cyclical market, share reduction served as the primary driver of per-share earnings growth, which rose from $2.36 to $5.95 over that span, outpacing total operating income expansion.
While share retirement effectively compounds per-share financial metrics, it remains subject to structural limits—a boundary that becomes central when evaluating the company's long-term competitive trajectory.
VII. Historical Falsification Pass: Stress-Testing Moats, Compensation, & Organic Dogma
Every company tells a story about itself. The standard analytical exercise is to test each load-bearing claim against the most challenging disconfirming evidence from the company's operating history rather than competitor marketing or abstract theory.
Three core claims underpin the Expeditors investment case, and each survives only after significant qualification.
Test 1: Does software integration create unbreakable switching costs?
The claim. Deeply integrated customs, order management, and visibility systems embed Expeditors into customer operations so thoroughly that switching becomes prohibitively disruptive.
The disconfirming evidence. February 2022 provided a direct operational test. Following a major cyber incident, the company disabled its global operating systems for roughly three weeks.7 Shippers that appeared locked into the platform were forced to maintain operations without it. Some clients filed customs entries through rival brokers, others shifted cargo to Kuehne + Nagel, DHL, and Flexport, and several initiated litigation. The direct financial impact reached approximately $65 million.8
The verdict — narrowed, not rejected. The key analytical finding lies in the aftermath: Expeditors retained the bulk of its customer base. Operating income in 2023—the first full post-crisis year at normalized freight rates—reached $940 million, surpassing every pre-pandemic fiscal year.3 Shippers returned once systems were restored. However, the outage establishes a clear boundary condition: switching costs depend strictly on system availability. Integration creates stickiness only while software remains operational. A recurring multi-week disruption, particularly during peak shipping season, would test whether clients retain the alternative logistics providers added during 2022.
The revised claim holds that switching costs are genuine but contingent, imposing an ongoing requirement for infrastructure redundancy. The critical indicator to monitor is any future disclosed system disruption, alongside whether the Global Technology reorganization enhances or impairs system resilience.
Test 2: Does the compensation model align incentives without creating risk?
The claim. Low base salaries paired with a fixed 10% branch operating profit pool transform employees into owner-operators, aligning staff incentives with shareholders at minimal corporate cost.
The disconfirming evidence, part one. The structure introduces severe compensation volatility during industry contractions. During the 2009 freight downturn and the 2023 rate normalization—when reported revenue fell by nearly half3—local profit pools contracted sharply. While this mechanism serves as an automatic cost stabilizer for shareholders, it imposes financial pressure on branch personnel, increasing exposure to recruitment efforts by competitors such as DSV and Kuehne + Nagel that offer higher fixed salaries. While Expeditors reports that over half of its workforce has at least five years of service,2 this static tenure metric does not indicate whether top-performing operators were retained through cyclical troughs.
The disconfirming evidence, part two. Delegating profit accountability to local branches in an industry driven by discretionary fees and surcharges creates regulatory compliance risks. Expeditors was among several forwarders involved in multi-district civil antitrust litigation over international air cargo surcharges, resulting in major class-action settlements between 2010 and 2013.13 Although the company avoided U.S. criminal charges, the case highlighted a structural tension: local profit incentives require rigorous corporate compliance oversight.
The verdict — intact, but with identifiable costs. The model remains effective, as evidenced by 2023 results where operating margins on net revenue held up through a sharp rate decline far better than fixed-cost competitors. However, the assertion that the model operates without downside is inaccurate; its costs manifest as cyclical retention risks and continuous compliance overhead. The key metric that would challenge the model's validity is voluntary turnover among branch leadership during a freight recession—a figure the company does not publicly detail.
Test 3: Is organic-only growth superior to M&A?
The claim. Abstaining from acquisitions preserves corporate culture and yields higher long-term returns on invested capital than acquisitive roll-up strategies.
The disconfirming evidence. European competitors pursued aggressive consolidation. DSV acquired UTi Worldwide, Panalpina, Agility's Global Integrated Logistics division, and DB Schenker in a transaction valued at approximately €14.3 billion, becoming the world's largest freight forwarder by volume.[^3] Over the same period, Expeditors' volume rankings dropped to between sixth and eighth globally, depending on the metric. Scale in carrier purchasing provides tangible commercial advantages: a forwarder tendering double the volume to an ocean carrier secures more favorable contract rates, which can determine winning bids on commodity trade lanes.
The verdict — narrowed, with strategic trade-offs. The claim holds within specific parameters. Expeditors achieves returns on invested capital that balance-sheet-heavy competitors carrying acquisition goodwill cannot match, having avoided major impairment write-downs. Returning approximately $12 billion to shareholders over seventeen years10 represents a disciplined deployment of capital.
However, the strategy must be redefined: organic growth generates superior returns on capital, but comes at the cost of absolute volume scale and purchasing power. Optimizing strictly for return metrics while ceding market share risks narrowing the addressable market over time. The primary disconfirming indicator would be sustained net revenue growth trailing overall trade growth, signaling market share erosion on the yield line.
Recent operating performance presents a counter-narrative. In the second quarter of 2026, airfreight tonnage expanded 14% year-over-year while airfreight revenues rose 32%, alongside flat ocean container volumes.6 Chief Executive Daniel Wall attributed the growth to operational execution, stating that the results demonstrated the company's strategy was "working and allowing us to take market share."5 Although management assertions regarding market share require scrutiny, a 14% quarterly tonnage increase in a moderate growth environment indicates volume gains relative to peers.
Whether Expeditors can sustain those gains against larger consolidated rivals remains the central competitive test.
VIII. Competitive Landscape & M&A Strategy: EXPD vs. The Consolidation Machines
Picture the tender process for a large multinational's global freight contract. A consumer electronics company with manufacturing facilities across Southeast Asia, distribution centers on three continents, and a product cycle that punishes transit delays by millions of dollars a week puts its logistics business out to bid. Five or six global forwarders respond. This is where competitive positions translate into operational realities.
DSV enters with the largest volume footprint in the world following its acquisition of DB Schenker, commanding the industry's lowest carrier rates.[^3] Its commercial pitch relies on scale arithmetic: few competitors purchase shipping capacity at lower cost. Its primary vulnerability stems from recurring integration demands; ongoing corporate consolidations mean software platforms in transition, reorganized account teams, and operational service levels that vary depending on legacy regional structures.
Kuehne + Nagel maintains dominance in ocean freight alongside extensive global coverage. It operates as the most direct peer on complex, service-intensive accounts, with net revenue margins serving as the primary benchmark against Expeditors' operational performance.
DHL Global Forwarding leverages the backing of an international postal and express parent, benefiting from an integrated last-mile network while managing a corporate structure designed around express transport economics.
C.H. Robinson represents a distinct business model, operating primarily as a North American surface transportation and truckload broker rather than an international cross-border forwarder. While overlap occurs at network edges, C.H. Robinson's recent strategic focus centered on cost reductions and headcount discipline, whereas Expeditors maintained its core staffing levels.
Flexport and the broader digital forwarding cohort raised significant venture capital on the premise that traditional logistics was an antiquated sector requiring a modern software layer. That model offered genuine improvements in customer-facing visibility tools, but underestimated operational friction during severe trade disruptions. When global port congestion worsened and carrier capacity was rationed during 2021 and 2022, shippers required long-standing carrier relationships to secure vessel space and local origin personnel to resolve factory-floor delays. The disruption demonstrated that the final link in global freight forwarding relies on localized operational execution rather than software interfaces alone.
Where Expeditors wins and loses
The pattern in competitive bidding is reflected in the composition of Expeditors' customer portfolio.
Expeditors wins contracts where cargo values are high, delivery schedules are tight, and regulatory requirements are complex: semiconductors, consumer electronics, healthcare equipment, aerospace components, and premium retail. On these lanes, freight costs represent a minor fraction of total inventory value, leading shippers to prioritize delivery reliability over the lowest transportation bid. The company's expansion into Critical Logistics Services — including aircraft-on-ground capabilities for urgent airline components and temperature-controlled facilities for pharmaceuticals — represents a strategic push further up this value curve.6
Conversely, Expeditors loses bids where freight transportation is a commodity service and procurement decisions depend strictly on container rates. On high-volume ocean lanes moving durable, non-urgent goods, mega-forwarders exercise decisive purchasing leverage, rendering Expeditors' premium service model uncompetitive on price.
This dynamic has driven a deliberate business mix shift. Ocean container volumes were flat in the second quarter of 2026 after declining 4% in the first quarter, whereas customs brokerage, transborder freight, distribution, and order management each generated double-digit revenue growth across both quarters.56 Rather than competing in low-margin ocean shipping, Expeditors has concentrated resources on specialized service lines where regulatory expertise and local execution determine commercial outcomes.
That strategy provides a logical response to carrier purchasing disadvantages, but it also narrows the company's competitive field. Concentrating operations in high-value niches leaves performance increasingly sensitive to disruptions across its specialized trade corridors.
IX. Risk Radar & Skeptical-Investor Stress Test
Evaluating the investment case for Expeditors requires examining specific operational and macroeconomic risks rather than generic industry headwinds. Three structural vulnerabilities are particularly load-bearing.
Geopolitical and tariff volatility — a risk that cuts both ways
The intuitive assumption is that international trade friction inherently harms a logistics provider. Operational evidence reveals a more nuanced dynamic.
Tariff escalation, shifting regulatory exemptions, and country-of-origin disputes have historically expanded billable demand for customs brokerage, as every regulatory modification requires administrative processing. Higher entry volumes and tariff-related complexity drove revenue increases in customs brokerage in the first quarter of 2026.5 Shippers re-evaluating supply chains—shifting production from China to Southeast Asia, India, or Mexico—require logistics providers to reconfigure routing and documentation workflows, generating fee revenue for technical advisory services.
The primary risk is not regulatory complexity, but absolute volume contraction. Transactional complexity generates net revenue, whereas total volume declines reduce gross fee opportunities. If protectionist policies eventually suppress the absolute volume of goods crossing transpacific trade lanes, or if nearshoring converts long-haul international freight into short-haul domestic trucking, Expeditors' addressable market contracts regardless of per-shipment processing complexity. The company's historical concentration in transpacific trade leaves it more exposed to regional trade shocks than European peers with broader geographic diversification. The critical metric distinguishing operational complexity from market contraction is cargo tonnage and container volume growth relative to global trade indices, rather than customs brokerage revenue alone.
Freight rate cyclicality and overcapacity
The ocean freight market entered a capacity surplus in the second half of 2025 that extended into 2026, with pricing and volume both declining in the first quarter.5 This downturn reflects standard shipping industry cyclicality: ocean ocean carriers added vessel capacity ordered during peak demand periods, which entered service after freight growth normalized.
For an asset-light forwarder, overcapacity presents conflicting operational dynamics. Lower carrier buy rates reduce transport costs, but heightened market competition exerts downward pressure on sell rates, compressing net spreads when shippers recognize abundant capacity. The financial impact at Expeditors was evident in declining ocean freight revenue, which was offset by growth across other service lines.4
Conversely, segment concentration introduces separate cyclical risks. Airfreight growth in 2026 was driven substantially by technology customers shipping artificial intelligence hardware and data center equipment.12 Because capital expenditure cycles in technology infrastructure are subject to sharp pullbacks, relying on specialized hardware shipments leaves high-margin airfreight performance vulnerable to spending shifts within a single industry.
Cybersecurity
The 2022 network outage demonstrated the company's single architectural vulnerability. The underlying cause—a unified global IT operating platform—remains central to Expeditors' cost structure and operational advantage.
While management subsequently invested in system redundancy, disaster recovery, and enhanced security protocols, the resilience of these measures cannot be fully verified outside an active crisis. Unlike risks facing diversified peers, technology platform vulnerability at Expeditors represents a documented operational precedent rather than a theoretical hazard.
The activist case
A rigorous assessment of Expeditors requires evaluating the skeptical investor case, which presents a structural challenge to management's long-term capital strategy.
Critics point out that Expeditors maintained over $1 billion in cash reserves with zero debt while competitors deployed capital to secure market share. Over the past decade, DSV built the world's largest freight forwarder through four major acquisitions, whereas Expeditors completed no significant transactions. While management frames this as capital discipline, skeptical investors view the result as slow net revenue expansion, market share erosion in total cargo volume, and per-share earnings growth driven primarily by retiring 25% of the equity base rather than expanding fundamental operating scale. From this perspective, continuous share repurchases function as financial engineering rather than an operational growth strategy, while the organic-only policy remains insulated from internal challenge due to four decades of executive succession drawn exclusively from within the firm.
The counter-argument rests on empirical performance. Inorganic roll-ups in relationship-driven service businesses carry documented integration risks, including goodwill write-downs, corporate culture dilution, and customer attrition when key account managers depart. Expeditors avoided impairment charges entirely and returned approximately $12 billion to shareholders over seventeen years while maintaining double-digit returns on invested capital.10
The key analytical vulnerability in management's defense lies in its testability. By refusing to engage in M&A, management has not demonstrated that it can integrate acquisitions efficiently, relying instead on the premise that inorganic growth inherently destroys value. Furthermore, the second-quarter 2026 technology reorganization introduces strategic ambiguity: executing a major corporate restructuring departs from the firm's historical posture of continuous operational optimization. This shift suggests either that corporate overhead required adjustment or that current leadership is open to operational modifications avoided by prior management.
Resolving these opposing arguments requires examining empirical operational metrics, which serve as the foundation for the final investment evaluation.
X. Playbook: Strategic & Investing Lessons
Beyond company-specific operations, Expeditors offers five transferable strategic and investment lessons, each carrying an important structural caveat.
1. Incentive design can substitute for direct management control. Allocating a fixed 10% branch profit pool achieves operational alignment that corporate supervision alone cannot replicate: it encourages local employees to care about incremental margins across thousands of daily decisions. In businesses where choices are decentralized and high in volume, aligning local compensation directly with branch profitability outperforms centralized oversight. The caveat is that variable compensation transfers industry cyclicality onto personnel, while requiring robust corporate oversight to prevent profit-motivated branch operators from taking compliance risks.
2. Asset-light intermediation compounds when underlying physical capacity is commoditized. Expeditors generates high returns on invested capital by positioning itself between fragmented shippers and capital-intensive carriers, capturing net spreads without owning depreciating transport assets. However, this structure depends on carriers remaining unable or unwilling to disintermediate the forwarder. Ocean carriers and airlines generally avoid building and maintaining direct sales and service relationships with thousands of smaller shippers. Should carrier consolidation or direct digital platforms alter that dynamic, forwarder net spreads would contract accordingly.
3. Focus on net revenue rather than pass-through top line. In any intermediary business—whether freight forwarding, insurance brokerage, or advertising—gross revenue reflects supplier pricing rather than corporate value creation. Expeditors' performance in 2023 illustrates this distinction: reported gross revenue fell 43% year-over-year, yet operating income matched 2020 levels.3 Evaluating such businesses purely on gross top-line movement misinterprets both cyclical booms and market downturns.
4. Disciplined M&A avoidance must be judged against the counterfactual. Expeditors established a clear operational record in capital allocation: no goodwill write-downs, no integration disruptions, and no equity dilution from debt-fueled acquisitions. That discipline preserved high returns on capital. However, whether acquiring competitors would have destroyed shareholder value remains unprovable because management never tested the strategy. Rigorous analysis requires distinguishing between observable operational risk management and unverified hypotheses about forgone acquisitions.
5. Zero debt secures optionality, but optionality carries an operational cost. Maintaining an unlevered balance sheet ensured that Expeditors never faced refinancing walls, avoided dilutive capital raises during downturns, and retained liquidity to repurchase shares when market valuations contracted. Conversely, avoiding debt meant the firm declined low-cost capital during a decade of near-zero interest rates, while acquisitive rivals leveraged cheap debt to secure market-share dominance. Whether return metrics or absolute volume scale ultimately determines long-term survival in global logistics remains the defining industry question for the decade ahead.
XI. Analysis, KPIs to Watch, & Bull vs. Bear Case
The three things worth tracking
Evaluating Expeditors requires isolating operational signal from headline noise. Three key performance indicators provide the clearest view of fundamental performance.
1. Operating income as a percentage of net revenue — the conversion ratio. This internal efficiency metric offers the cleanest test of whether the company's operating model and cost structure remain effective. By excluding pass-through carrier transportation costs from both the numerator and denominator, the conversion ratio isolates core operational productivity. In the second quarter of 2026, Expeditors reported an operating conversion ratio of 32.2%.11 The critical signal lies in the multi-year trend: if the conversion ratio holds in the low thirties through the next freight recession, the variable compensation structure is functioning as designed. If it compresses into the twenties, the automatic cost stabilizer has failed, undermining a central premise of the investment thesis.
2. Airfreight tonnage and ocean container volume growth versus the market. This metric evaluates market share in physical units, serving as an objective test of whether organic growth is keeping pace with consolidated rivals. While reported revenue can fluctuate on freight rates alone, cargo volume cannot. Recent operational metrics show divergent performance across modes: airfreight tonnage rose 14% year-over-year while ocean container volumes remained flat in the second quarter of 2026, compared to a 5% increase in airfreight tonnage and a 4% decline in ocean volume in the first quarter.56 Benchmarking these figures against IATA air cargo statistics and global ocean container throughput indices distinguishes genuine market-share expansion from temporary technology investment waves.
3. Net revenue yield per unit — per 100 kilograms of air freight and per ocean container. This metric measures whether Expeditors is expanding net spreads per shipment or handling higher physical volumes at narrower margins. Yield per unit is directly exposed to the bear case: if digital competitors or mega-forwarders exert downward pricing pressure on carrier spreads, the compression will manifest in unit yields before appearing in broader financial statements.
Porter's five forces, honestly applied
Rivalry: intense and structurally increasing. International freight forwarding remains fragmented among smaller regional brokers while consolidating at the top tier. Scale consolidation widens the carrier purchasing advantage held by market leaders over mid-tier operators. Expeditors competes by avoiding direct price competition on commodity trade lanes.
Supplier power: rising on the ocean side, moderate in air. Ocean container shipping has consolidated into major vessel-sharing alliances. Carriers have periodically attempted to sell capacity directly to cargo owners or acquire internal forwarding capabilities—representing the carrier disintermediation risk outlined in prior strategic lessons.
Buyer power: high and growing. Multinational shippers maintain dedicated procurement teams, conduct regular contract tenders, and—following global logistics disruptions in 2022—increasingly enforce multi-sourcing policies. This structural shift has permanently reduced pricing power across incumbent freight forwarders.
Substitutes: limited but real. The primary substitute for third-party logistics intermediation is an in-house corporate logistics division. Large multinational shippers frequently maintain internal supply-chain management capabilities, placing a natural ceiling on individual customer account expansion.
New entrants: barriers higher than projected in 2019. The emergence of venture-backed digital forwarders demonstrated that capital and software interfaces alone cannot replace localized origin-station operations or regulatory expertise. Industry entry barriers stem from accumulated compliance knowledge across international jurisdictions and physical operational execution at network nodes.
Applying Hamilton Helmer's 7 Powers framework reinforces a narrow strategic assessment: process power and conditional switching costs are supported by empirical evidence, whereas network economies remain unproven because larger consolidated networks do not consistently out-earn Expeditors. Meanwhile, counter-positioning represents an industry-wide asset-light posture rather than a proprietary advantage.
The bull case
The bull thesis rests on the premise that expanding global trade complexity increases the economic value of cross-border regulatory management, positioning Expeditors in high-margin segments of the logistics value chain.
Empirical reporting supports several elements of this thesis. Customs brokerage and specialized services expanded to roughly 39% of net revenue by 2025, establishing it as the company's largest operating segment.4 Airfreight tonnage grew 14% year-over-year in the second quarter of 2026 while ocean container volumes stagnated.6 Diluted earnings per share rose 51% year-over-year in that same quarter on 32% gross revenue growth, reflecting operating margin expansion alongside volume gains.12 The balance sheet maintains approximately $1.03 billion in cash and cash equivalents with no long-term debt beyond lease liabilities, backed by a $3.0 billion share repurchase authorization following a half-year in which the company returned $748 million to shareholders.126 Should valuation metrics compress during a freight downturn, the firm retains both capital reserves and board authorization to execute aggressive share buybacks.
The strongest variation of the bull case asserts that ongoing artificial intelligence hardware infrastructure expansion provides a multi-year volume tailwind for high-margin airfreight services while major competitors remain focused on post-merger integration.
The bear case
The bear thesis contends that long-term volume scale dictates transportation economics, and that Expeditors is managing a gradual retreat into a profitable niche market.
Supporting operational evidence highlights structural challenges. DSV's acquisition of DB Schenker established a global competitor with carrier purchasing leverage that Expeditors cannot replicate organically.[^3] Ocean freight results reflected declining pricing and volumes in early 2026.5 Per-share earnings growth has relied significantly on retiring approximately 25% of outstanding equity since 2016—a financial strategy with finite long-term runway.3 Furthermore, the 2022 network disruption prompted clients to adopt multi-sourcing logistics strategies, weakening switching-cost retention. Concentrating airfreight growth within technology hardware logistics also leaves performance vulnerable to cyclical pullbacks in corporate capital expenditure.
The governance dimension of the bear case argues that four decades of internal executive succession have produced a leadership team bound to historical practices, at a moment when global industry structure has shifted substantially.
Weighing it
The empirical evidence does not support a definitive verdict in either direction, and declaring one would introduce false precision.
Operating history confirms a series of qualified findings. The compensation model's automatic cost-stabilizer function held up through the 2023 freight market normalization. The switching-cost moat remains genuine but strictly conditional on continuous technology platform availability—a vulnerability demonstrated during the 2022 network outage. The organic-growth policy has protected returns on capital and avoided integration write-downs, but it has ceded global volume market share without demonstrating that management can execute alternative acquisition strategies.
The identified key performance indicators provide the framework for future evaluation. If the conversion ratio remains in the low thirties through an industry downturn while cargo tonnage outpaces global trade growth, the bull thesis will be validated. Conversely, if the conversion ratio compresses into the twenties while volume growth trails broader trade indices, the bear thesis will prevail—demonstrating that the decentralized branch compensation model served primarily as an efficient mechanism for harvesting a contracting market position.
XII. Epilogue & Final Reflections
Forty-five years separate the modest Seattle ocean forwarding office established in 1979 from the global enterprise that returned $748 million to shareholders in the first half of 2026.6 Despite that expansion, the underlying operating model has changed remarkably little over four decades.
What Peter Rose and James Wang framed in 1981 was neither a proprietary technology nor a complex financial vehicle. It was a thesis on value creation in international trade: that economic returns accrue not to owners of physical aircraft or ocean vessels, but to intermediaries capable of navigating complex border regulations and cargo routing on schedule. The company's core practices — decentralized branch profit pools, refusal to issue forward earnings guidance, a debt-free balance sheet, and avoidance of acquisitions — were operational structures designed around that central premise.
That framework has proven resilient through multiple macroeconomic disruptions, including the Asian financial crisis, the 2009 global trade contraction, the COVID-19 pandemic, a three-week system shutdown following the 2022 cyberattack, and ongoing industry consolidation. The result is a rare corporate profile among major public firms: four decades of compounding growth sustained without long-term debt, large-scale acquisitions, or quarterly earnings guidance.
The remaining test is whether an organic-only doctrine can withstand competition from consolidated rivals operating at significantly larger volume scale. A successful integration of DB Schenker by DSV would test the limits of Expeditors' standalone model, whereas operational friction during that integration could validate the Bellevue strategy for another cycle. That competitive dynamic will ultimately be measured in cargo tonnage and conversion ratios rather than corporate strategy statements.
For corporate strategists, the company's trajectory demonstrates that an asset-light service business with tightly aligned branch incentives can generate sustained capital returns without owning transport fleets. For investors, the analytical challenge remains distinguishing disciplined cultural continuity from structural resistance to change. Evaluating that distinction requires tracking operational metrics across full freight cycles rather than relying on historical corporate narratives.
References
-
Expeditors Reports Second Quarter 2026 EPS of $2.03 — Expeditors Investor Relations, 2026-08-04 ↩
-
About Expeditors: History, Culture, and Mission — Expeditors International ↩↩↩
-
SEC EDGAR Company Filings: Expeditors International of Washington (CIK 0000746515) — U.S. Securities and Exchange Commission ↩↩↩↩↩↩↩↩↩↩↩↩
-
Expeditors Form 10-K Annual Report for Fiscal Year Ended December 31, 2025 — SEC EDGAR, 2026 ↩↩↩↩↩↩
-
Expeditors Reports First Quarter 2026 EPS of $1.71 — Businesswire, 2026-05-04 ↩↩↩↩↩↩↩
-
Expeditors Reports Second Quarter 2026 EPS of $2.03 — Businesswire, 2026-08-03 ↩↩↩↩↩↩↩↩↩↩↩
-
Expeditors International Investor Relations Portal — Expeditors International ↩↩
-
Expeditors Cyberattack Cost Company $65M in Operations and Claims — Supply Chain Brain, 2022-11-10 ↩↩
-
Expeditors International of Washington Inc (EXPD) Listing Page — New York Stock Exchange ↩
-
Expeditors Appoints David A. Hackett as CFO — Businesswire, 2025-08-06 ↩↩↩↩
-
Expeditors Expects Restructuring to Lower Costs by About $50M a Year — StockTitan, 2026-08-04 ↩↩↩
-
Expeditors Posts 32% Revenue Jump in Q2 2026 — EXPD Quarterly Report (10-Q) — StockTitan, 2026 ↩↩↩↩↩
-
Air Freight Forwarders Settle Long-Running Antitrust Price-Fixing Litigation — Reuters, 2013-05-16 ↩
 LinkedIn
 WhatsApp
 Reddit
 Hacker News
 Email
Email Kindle
 RSS Feed
 Spotify
 Apple Podcasts
 Amazon Music
 Audible
 YouTube