Enerpac Tool Group: The Force It Couldn’t Afford to Lose
I. One Tool, One Question: What Is Enerpac Now?
Picture a bridge girder the size of a city bus sitting a few centimetres out of position. Or a wind-turbine flange with dozens of bolts that all have to be tightened to the same tension, because one weak bolt can loosen the whole ring. Or a steel pipe in a refinery that has to be cut, bevelled and readied for welding on site, where nothing can be carried back to a workshop. None of these jobs is glamorous, and none of them forgives a mistake. A load that slips, a cylinder that fails or a bolt that stretches past its limit can stop a project or hurt someone. The people who do this work want a tool that delivers exactly the force it promises, and someone who knows how to use it.
That is the business of Enerpac Tool Group. Its signature products are high-pressure hydraulic tools: cylinders, pumps, jacks, bolting tools, and lifting and positioning systems that let a handful of technicians move, hold or fasten things that would otherwise need a crane, a crowd or a miracle.1 Around those products sits a smaller service and rental business, technicians who arrive at a plant, a pipeline or an offshore platform to machine, bolt, test and maintain, and fleets of equipment rented out for jobs too short to justify buying.2
Hydraulics are an old idea dressed in modern steel. Push a small amount of oil through a narrow pump and the pressure travels undiminished to a wider piston, where it becomes an enormous force. A technician working a hand pump can raise a load many hundreds of times their own weight, slowly and in control. The physics is a century old. What customers pay for is the confidence that the tool in front of them will behave exactly as rated, every time, in a refinery shutdown at three in the morning.
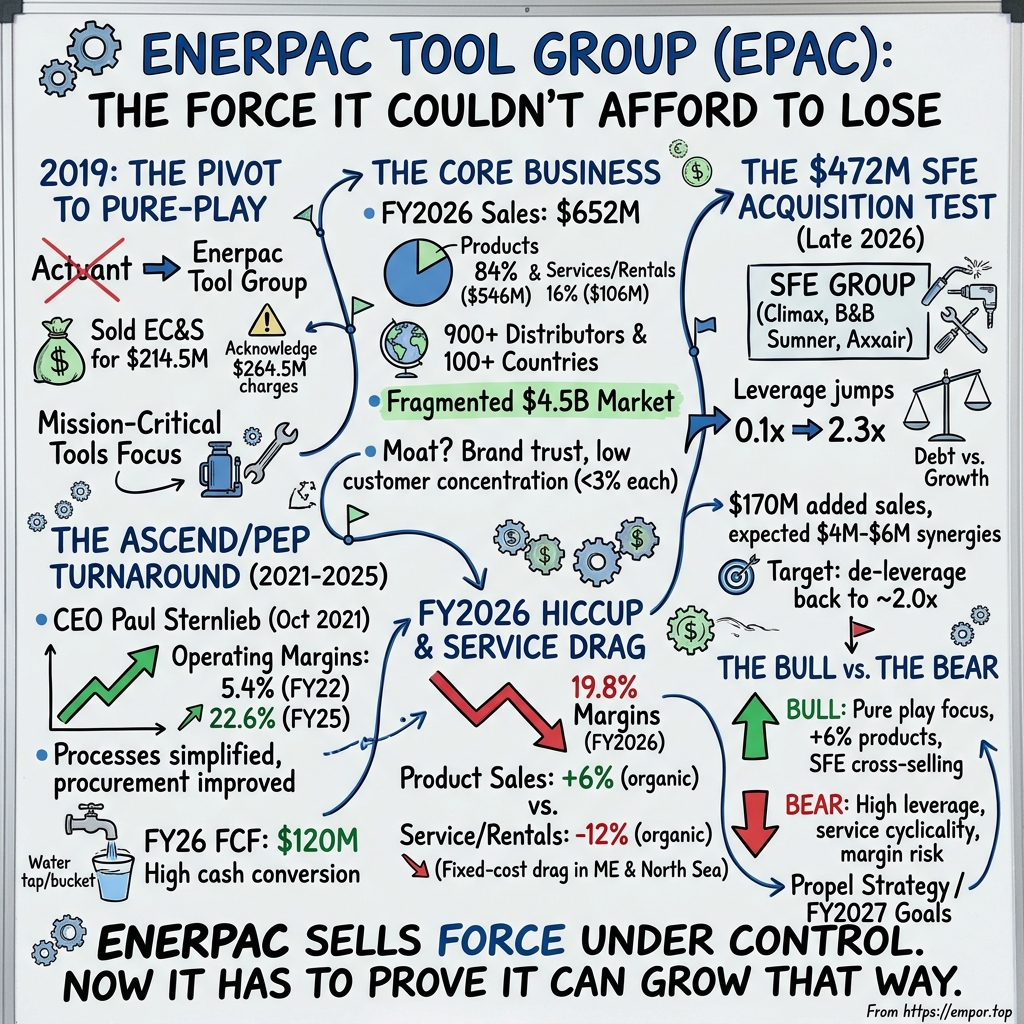
By the fiscal year that ended in August 2026, that business generated about $652 million of sales.1 Roughly $546 million came from products and about $106 million from services and rentals, which means that for every five dollars Enerpac collected, more than four came from selling tools and their accessories.2 It sells into more than 100 countries.3 Yet for all that reach it remained, before its newest acquisition, a sub-$1 billion company, a specialist rather than an industrial giant.
Then, on October 28, 2026, Enerpac completed the purchase of SFE Group, a maker of portable machining, welding and material-handling tools that adds about $170 million of annual sales.4 In one step the company became roughly a quarter larger, and it borrowed most of the money to do it.
So this story has three questions running through it. The first is about the past. In 2019 a broad industrial conglomerate called Actuant decided to sell most of what it owned and become a focused tools company under the Enerpac name. Did that focus actually make the surviving business better, or did it simply make it smaller? The second is about the present. Enerpac’s product engine grew in fiscal 2026 even as its service business shrank sharply. Can strength in tools carry a service arm that swings with oil, gas and geopolitics? The third is about the future. SFE is the largest acquisition of Enerpac’s focused era. Will it earn an adequate return on the debt used to buy it while the company works its leverage back toward its target?
It helps to say plainly what this story is not. Enerpac is not a hidden software platform or a biotech lottery ticket. The company owns Cortland Biomedical, a small maker of specialty fibre and textile components for medical devices, and Cortland grew by about a quarter in each of the first three quarters of fiscal 2026 and by double digits again in the fourth.5678 Those are impressive growth rates on a tiny base. Enerpac does not break out Cortland’s revenue in its headline results, and nothing in the reported numbers suggests it is large enough to drive the investment case.2 The case lives or dies on industrial execution: how well Enerpac designs, sells and services its tools, and how wisely it spends the cash those tools throw off.
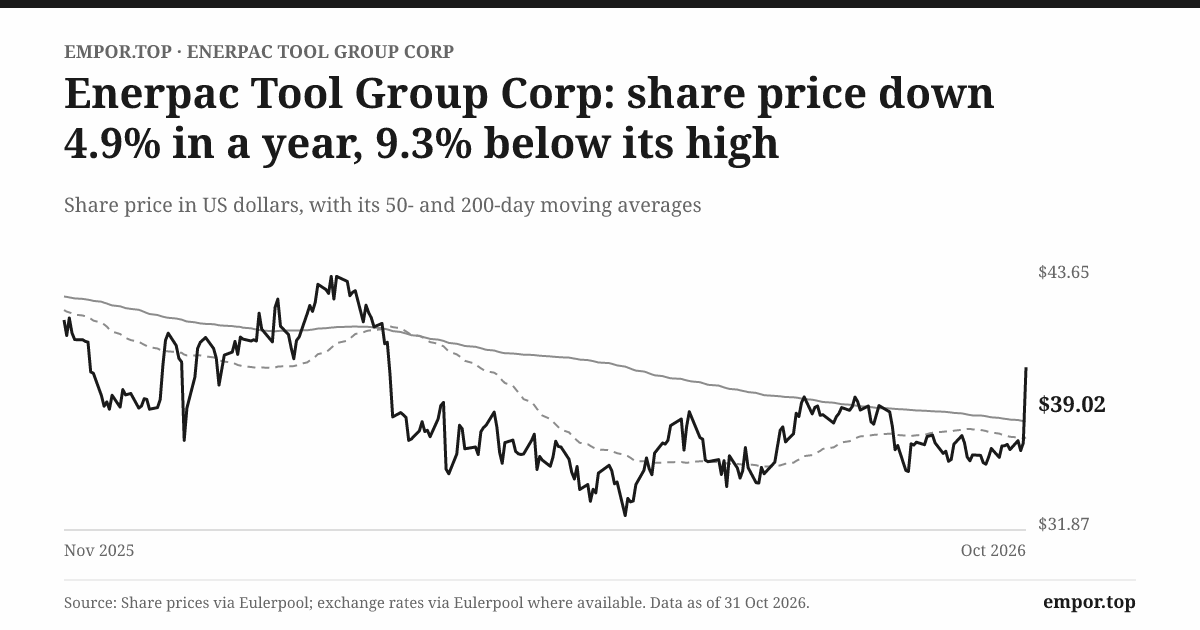
The market has a view. As of October 31, 2026, Enerpac’s shares stood at $39.02, giving the company a market value of about $2.1 billion, roughly 23 times its last twelve months of earnings.1 That is not a distressed price, and it is not a euphoric one. It is the price of a business investors believe has been fixed, but have not yet decided how far it can grow.
The verdict to test across the episode is simple enough to hold in one sentence. Enerpac is now a focused industrial-tools company with real scale in a niche where reliability matters more than price. The open question is whether its products, its service crews and its dealer network can earn an adequate return on a newly leveraged, much larger balance sheet. To see why that question carries so much weight, the story has to go back to the moment Enerpac’s owners decided to give away most of the company.
 Subscribe on LinkedIn
II. The $214 Million Decision to Become a Tools Company
For most of its life, Enerpac was a brand inside something else. The hydraulic tools sat within Actuant, a Wisconsin industrial group whose portfolio had sprawled across truck cab-tilt systems, recreational-vehicle components, electrical products, offshore mooring equipment and a long tail of engineered parts. Conglomerates of that kind were built on a theory: own many businesses in many end markets, and the cycles will cancel out. By the late 2010s, investors had largely stopped believing that theory. Diversification often meant complexity, overhead and a share price that reflected the weakest business rather than the best one.
Actuant had already been pruning. In fiscal 2017 it sold Viking SeaTech, an offshore mooring and rope business that had been hammered by the oil-price collapse, and the company recorded about $117 million of impairment and divestiture charges as it reshaped the portfolio.9 That episode matters to the story because it shows that Actuant’s portfolio choices had a history of costing money on the way out. Buying into the offshore boom had looked sensible in good years. Exiting it in a bad one meant writing down much of the value.
The bigger decision came in 2019. On July 9 of that year, Actuant announced that it had agreed to sell most of its Engineered Components and Systems segment, known inside the company as EC&S, for about $214.5 million.10 Months later the company adopted the name Enerpac Tool Group, taking its identity from the tools brand that had become the crown jewel of what remained.11 Actuant the conglomerate was gone. In its place stood a pure-play industrial tools and services company.
The headline price hid a harder truth. In fiscal 2019, the company recorded $264.5 million of impairment and divestiture charges.9 Those charges came from writing down the carrying value of the businesses being sold, which sat on the books at more than buyers would pay, and from recognising accumulated currency losses that had built up in shareholders’ equity while the company owned foreign operations. Put simply, the businesses Enerpac sold were worth less to the market than the company had once paid or recorded for them. The accounting loss was larger than the sale price itself.
The easy reading is that the exit was a disaster. The more careful reading is that the loss was a bill for decisions made earlier, not a judgment on what was left behind. A write-down tells you that the old portfolio had been carried at too high a value. It does not tell you that the tools business was a poor asset. If anything, the divestiture forced the market to look at Enerpac without the noise of businesses that had been dragging on returns.
At its 2019 Investor Day, management set out the reset in practical terms.11 Enerpac and Hydratight, the bolting and machining service business Actuant had bought years earlier, would be integrated rather than run as separate fiefdoms. The company would walk away from unprofitable service work, reduce corporate costs that had been sized for a much larger conglomerate, and use the sale proceeds to pay down debt, buy back shares and pursue strategic acquisitions that fit the tools platform.11 The plan promised a smaller company with cleaner economics and a sharper identity.
The balance sheet shows the reset in motion. Borrowings were about $533 million at the end of fiscal 2018; by the end of fiscal 2021 they were about $227 million.912 Revenue, meanwhile, fell by almost half between fiscal 2018 and fiscal 2019 as the discontinued businesses dropped out of the reported figures.9 That is why the company’s ten-year revenue record shows a decline of about 5.5% a year: the number is a record of what was sold, not of how the remaining tools business performed.
Then came the test nobody had planned for. The pandemic arrived months after the new identity did. Industrial customers postponed maintenance, closed sites and cancelled projects. In fiscal 2020 Enerpac’s sales fell to about $493 million, and operating cash flow turned slightly negative.12 The newly focused company, freshly stripped of the diversification that was supposed to cushion it, had to prove its economics in one of the sharpest industrial downturns in decades.
There is an irony here worth sitting with. The theory of the conglomerate was that diversity protects against shocks. Enerpac had just thrown that protection away, and almost immediately it faced a shock. Yet the company survived the downturn without a rescue, partly because the sale proceeds had already reduced its debt. Focus did not make Enerpac immune to the cycle. It made the company’s exposure to the cycle easier to see, and easier to manage.
The verdict on 2019 is therefore narrower than either champions or critics tend to put it. The change gave the surviving company a clearer identity and released cash for debt reduction and reinvestment. The $264.5 million of charges is the honest price of exiting businesses at a weak moment. Whether focus created value depends on what Enerpac did with the business it kept, and that requires understanding what, exactly, it sells.
III. The Tool Is Only Half the Product
Imagine a maintenance manager at a power plant with a turbine casing to open. The bolts are huge, seized by heat and years of service, and they have to be removed and later re-tightened to precise tension in a specific sequence. The manager can buy a generic torque wrench from a catalogue. Or the manager can call a distributor who knows which Enerpac bolting tool fits that flange, which pump pairs with it, and whether a technician should come along to do the job. The tool costs money. The wrong tool, or the right tool used badly, costs a shutdown.
That moment explains the economic logic of Enerpac better than any slide. The product is a piece of steel that delivers controlled force. The other half of the product is the knowledge around it: the application engineering, the distributor who stocks it, the training that comes with it and the confidence that it will perform.
Start with how the money arrives. Most product revenue is recognised when a tool or system ships to a customer or distributor. Some customised products with little alternative use, such as engineered heavy-lifting systems built for a particular job, are recognised over time as the work progresses. Service revenue is booked as technicians perform their work, generally measured in labour hours. Rentals are usually recognised over contracts shorter than a year.2 Enerpac does not disclose a standard contract length, minimum purchase commitments or a share of recurring revenue. The business depends on industrial activity, maintenance budgets and project work, not on subscriptions.
Products account for most of the business.2 Service matters more than its size suggests because a technician on site sees the customer’s problems first and can pull products behind the work. But it is also the less predictable half. A service crew is a fixed cost that has to be paid whether or not the next job materialises, and service revenue depends on access to sites, on project timing and on the health of customers in energy and heavy industry.
Enerpac describes its market as fragmented, sizes its addressable opportunity at roughly $4.5 billion, and says it reaches customers through more than 900 distributors.13 Those are the company’s own claims, and they are worth testing rather than simply accepting. Against a $4.5 billion market, Enerpac’s pre-SFE product sales would represent a meaningful but far from dominant share, which fits the picture of a leader in a crowded field rather than a monopolist.
The field is crowded indeed. Enerpac competes with specialist hydraulic-tool makers such as SPX FLOW’s Power Team, the Dutch firm Holmatro and Hi-Force, as well as broader industrial suppliers such as Bosch Rexroth.13 Some competitors are larger and more diversified; others are niche specialists with loyal local customers. No reliable like-for-like market-share data establishes a single leader across all of Enerpac’s categories, and the company does not publish its own share.
The war-game, then, looks like this. A customer facing a routine job, such as lifting a machine onto blocks, can choose among many reasonable tools, and price competition will be real. A customer facing a high-consequence job, such as synchronised lifting of a bridge span or bolting a critical flange, cares far more about reliability, application support and availability. Enerpac’s strongest ground is the second kind of job. Its weakest is the first.
Run the forces once through that lens. Buyer power is softened by customer dispersion: no single customer exceeded 3% of sales in fiscal 2024, 2025 or 2026.2 But dispersion is not loyalty, because buyers can usually find a substitute, and Enerpac does not disclose top-five customer concentration or how dependent it is on its largest distributors. Supplier power appears modest; the company buys components and does light assembly, and its supplier contracts mainly oblige it to take remaining inventory if a product is discontinued.2 The threat of new entrants is limited by brand and channel, since a new hydraulic-tool maker would need years to earn the trust of safety-conscious buyers and the shelf space of distributors. Substitutes exist in the form of cranes, mechanical tools and electric alternatives, but for many jobs hydraulics remain the practical answer. Rivalry is the force that bites hardest, precisely because the market is fragmented.
In the language of Hamilton Helmer’s seven powers, Enerpac’s candidate advantages are branding, in the sense that buyers pay for the confidence of a name, and a version of cornered resource in its distributor network and application know-how. Switching costs are plausible but unproven: a customer whose crews are trained on Enerpac pumps and fittings may prefer to stay within one system, yet the company publishes no retention data, no price realisation and no measure of share gains. Scale economies exist relative to small specialists but not relative to the largest industrial groups.
That leaves a fair conclusion. Enerpac holds a differentiated niche position, supported by brand, channel and expertise. The evidence does not prove a lock on customers. The business depends on repeat trust in performance and availability, and the company has not published the customer-level measures that would show how durable that trust is. Whether the trust translates into economic power shows up most clearly in margins, and Enerpac’s margin story is one of the more dramatic turnarounds in mid-cap industrials.
IV. From Cost Reset to 22 Percent Margins
In October 2021, a new chief executive walked into a company that had shrunk, survived a pandemic and still had not shown what it could earn. Paul Sternlieb succeeded Randy Baker, who retired after leading the company through the divestitures.14 Sternlieb was not a hydraulics lifer. He came from a career running operating businesses inside large, process-driven industrial companies, including leadership roles at JBT, the food-processing equipment maker, Illinois Tool Works and Danaher, three companies famous for turning management systems into margin.14 That background tells you what kind of leader the board wanted. Not a visionary, but an operator who believed that standard work, pricing discipline and simplification could unlock profit already inside the business.
When he arrived, the business needed it. Operating margin in fiscal 2022 was only about 5.4%.115 For a company with a premium brand in a safety-critical niche, that was a strange result. Either the brand was weaker than claimed, or the company was wasting much of what it earned on cost and complexity.
The answer Sternlieb’s team gave was ASCEND, a transformation programme that ran through fiscal 2024.13 Its aims were plain and unglamorous: standardise operations, improve procurement and manufacturing, simplify processes and cut out work that did not earn its keep. When ASCEND ended, the company rolled its lessons into the Enerpac Performance Excellence system, or PEP, meant to make continuous improvement a habit rather than a project.13
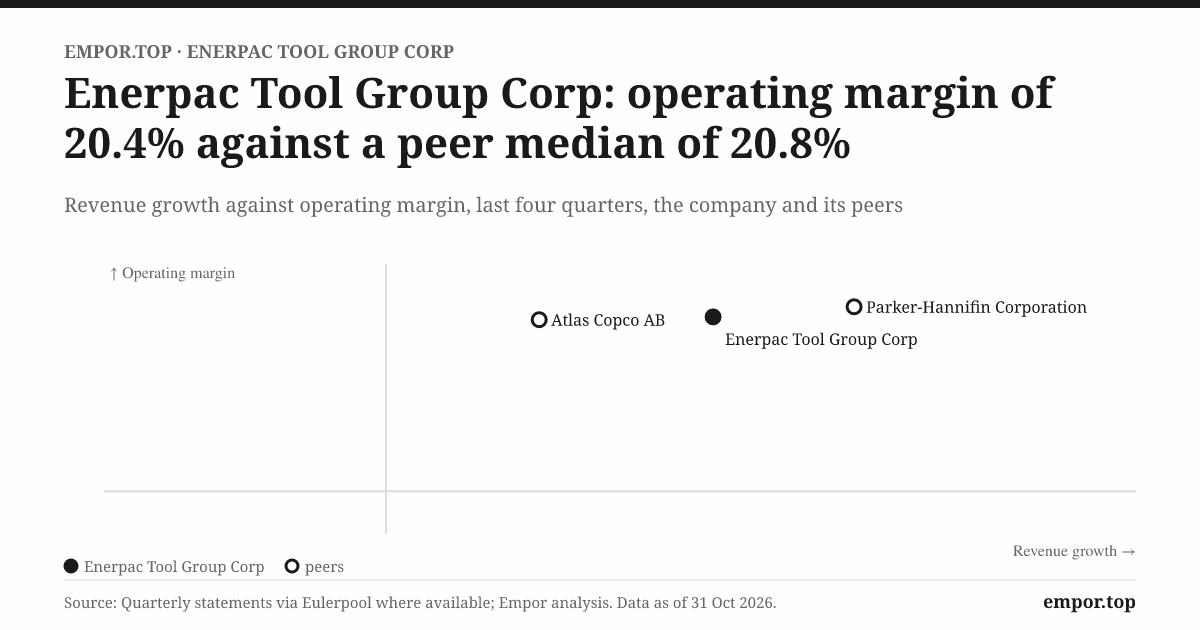
The results arrived quickly. Operating margin climbed from about 14% in fiscal 2023 to about 22.6% in fiscal 2025, when operating profit reached roughly $139 million.151312 Set that against the long record and the scale of the change becomes clearer. Operating profit was negative in fiscal 2016 and fiscal 2017, during the conglomerate’s painful exits, and recovered unevenly through the divestiture and the pandemic.9 In three years Sternlieb’s team took the margin from roughly one-twentieth of sales to more than one-fifth.
Why could margins move so far, so fast? Because Enerpac is an asset-light industrial company. Its manufacturing is mainly light assembly, which means a big share of its costs sit in purchased components, overhead and selling expense rather than in heavy factories.2 When a company like that tightens procurement, removes duplicate structures and prices its products for the value they provide, the savings drop through to operating profit with little need for new investment. Small process gains move earnings more than the modest factory footprint suggests.
Then fiscal 2026 broke the upward line. Operating margin fell to 19.8%, and operating profit slipped to about $129 million.1 The cost lines show where the pressure came from. Cost of products sold rose from about 49% to about 51% of sales, and gross margin fell by about 130 basis points. Selling, general and administrative expense rose from about 27% to about 28% of sales, even as restructuring charges fell from roughly $6 million to about $3 million.2 Management’s explanation was specific: lower service activity, a product mix tilted toward heavier lifting equipment with lower margins, transaction costs tied to SFE, higher incentive compensation and currency effects.18
That decomposition matters because it separates the structural claim from the annual noise. The company argues that the transformation improved its earnings power. Part of the fiscal 2026 decline is plainly noise: deal costs are one-off, and incentive compensation swings with results. But part of it reflects the business itself. Service has high fixed costs, and heavier-lifting systems carry thinner margins than the core hydraulic tools. If Enerpac grows those businesses faster, margins can fall even when execution is good. The heavy-lifting point deserves a closer look, because it is the part of the margin story that comes from success rather than failure. Enerpac’s heavy-lifting technology business sells the big engineered systems: synchronised jacks, gantries, skidding systems and the E-Movers that data-centre equipment makers have been reordering. On the fourth-quarter call, Kozik said those products earn gross margins "in the mid-40s."8 Enerpac as a whole earned a gross margin of around 49% in fiscal 2026, and closer to 51% the year before.2 So every extra dollar of heavy-lifting sales arrives with a lower margin than the average dollar, even if it is very good business in its own right. The irony is sharp. The faster Enerpac wins in the growth markets it most likes to talk about, the more its headline margin can drift down. Investors watching only the margin percentage could mistake a healthy shift in demand for a deterioration in execution, or the reverse.
The first-quarter numbers had already shown this tension. Gross margin was about 50.7% that quarter, and management told analysts that the second quarter would "probably look more like" the first before margins improved later in the year.5 They did improve, but not back to fiscal 2025 levels: the fourth-quarter adjusted EBITDA margin was about 22.6%, against about 26.5% a year earlier, with management citing mix, bonus expense, higher research spending and investments in its new strategy.8
The fiscal 2025 margin is therefore a demonstration of what the business can earn in a favourable mix, not yet a proven floor.
Cash is where the transformation looks most convincing. In fiscal 2026 Enerpac generated about $130 million of operating cash flow and about $120 million of free cash flow, against net earnings of about $90 million.12 Over the twelve years from fiscal 2015 to fiscal 2026, operating cash flow added up to roughly $996 million while net profit totalled about $206 million.29 That gap looks spectacular, but it needs a caveat. The twelve-year sum includes years of large non-cash write-downs that depressed profit without consuming cash, plus working-capital swings as businesses were sold. In fiscal 2026, the company attributed much of its cash improvement to working capital, especially lower inventory, and to collections.2 Inventory days fell from about 93 to about 78 in a year, a release that cannot repeat indefinitely.2 The long-run ratio is strong evidence that earnings are real. It is not a recurring annual conversion rate.
Inflation and tariffs added a further test during the year, and here the evidence leans in the company’s favour. With new U.S. tariffs raising the cost of imported components, management said early in fiscal 2026 that pricing and productivity had offset the dollar impact.5 By the fourth quarter, Kozik told analysts that cost inflation was "not as exorbitant as some may be led to believe."8 A business that can pass through cost increases without losing volume is showing a modest form of pricing power, and Enerpac’s product sales kept growing through the tariff year. The caveat is that offsetting costs in dollars is not the same as protecting the margin percentage, and gross margin still fell.
The reinvestment profile is restrained. Research and development spending was about $15.4 million in fiscal 2026, roughly 2.4% of sales, and capital expenditure was about $10.6 million, about 1.6% of sales.2 Headcount held at roughly 2,100 across fiscal 2025 and fiscal 2026 while revenue rose.2 That is the profile of a company harvesting operating improvements, not building capacity. It is also a profile that invites a question analysts raised directly on the fourth-quarter call: is a company that spends this little on innovation investing enough to keep its products ahead?8
The margin story leaves a clear verdict. The recovery from the post-divestiture trough is substantial and backed by cash. Enerpac is a much better business than it was in fiscal 2022. But fiscal 2026 showed that margins remain exposed to service mix, incentives and growth investments, which hands the next chapter its question. If service and heavier products dilute margins, how much growth can Enerpac buy before the quality of its earnings changes? The service business answered part of that question in fiscal 2026, and the answer was uncomfortable.
V. The Service Business Misses Its Turn
Somewhere in the Gulf during fiscal 2026, an Enerpac service crew should have been working through a run of maintenance jobs at energy facilities. Instead, conflict in the region restricted access to sites, and work that had been planned was paused.68 In the North Sea, where offshore platforms provide steady bolting and machining work, activity was softer in the first half of the year as customers consolidated.8 A service business can survive one soft region. Two at once, in the same months, expose its fixed costs.
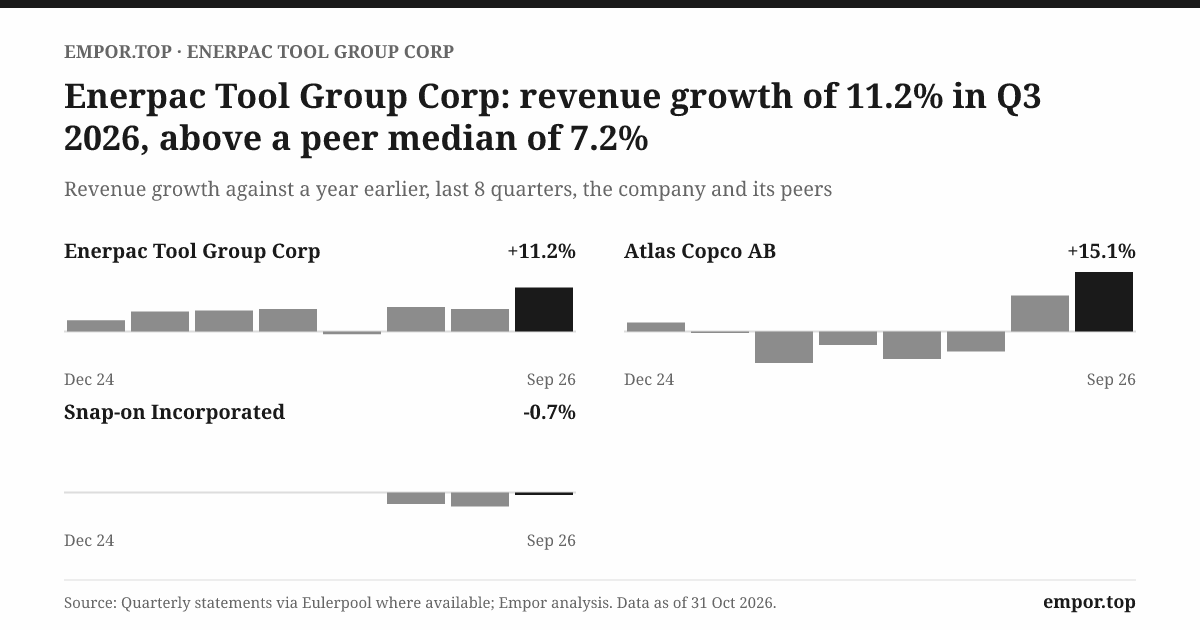
The first quarter of fiscal 2026 told the story in stark terms. Organic product sales grew about 4%, but service revenue fell about 26%, mainly in the Europe, Middle East and Africa region.5 Organic growth strips out the effects of currency and acquisitions, so it is the cleanest measure of whether the underlying business is selling more. A product line growing while a service line shrinks by a quarter is not one business having a bad quarter. It is two businesses moving in opposite directions.
Management’s explanation was causal rather than vague. The Middle East conflict restricted access to jobs; North Sea activity was soft; and because service carries high fixed costs tied to technicians, equipment and regional infrastructure, a drop in revenue produced a disproportionate drop in profit.58 That is the operating leverage that works so well on the way up. On the way down, it compresses margins faster than revenue.
Management also made a choice that deepened the dip on purpose. On the first-quarter call, it told analysts that part of the service decline came from a contracting UK market and from passing on lower-margin projects rather than chasing volume.5 That is consistent with the promise made at the 2019 reset to leave unprofitable service work behind. It also means a share of the lost revenue was revenue the company decided it did not want, which makes the 26% fall look less like collapse and more like a business being pruned while it was also being squeezed.
By the second quarter the scale of the regional exposure was clearer. Management said the Middle East accounted for about a tenth of total revenue, and that some service work there had been paused and, in its words, "pushed to the right," meaning delayed rather than cancelled.6 Service revenue was still down about 17% organically in that quarter, and gross margin fell by about 410 basis points, to roughly 46%, almost entirely because the fixed cost of the service network was spread over less work.6 The company took a restructuring charge of about $3.3 million, mainly in service, and its finance chief said the action would pay back in roughly a year.6 There was also a reason for patience in the North Sea: management described a new UK contract worth several million dollars a year, with revenue due to start in the fourth quarter.6
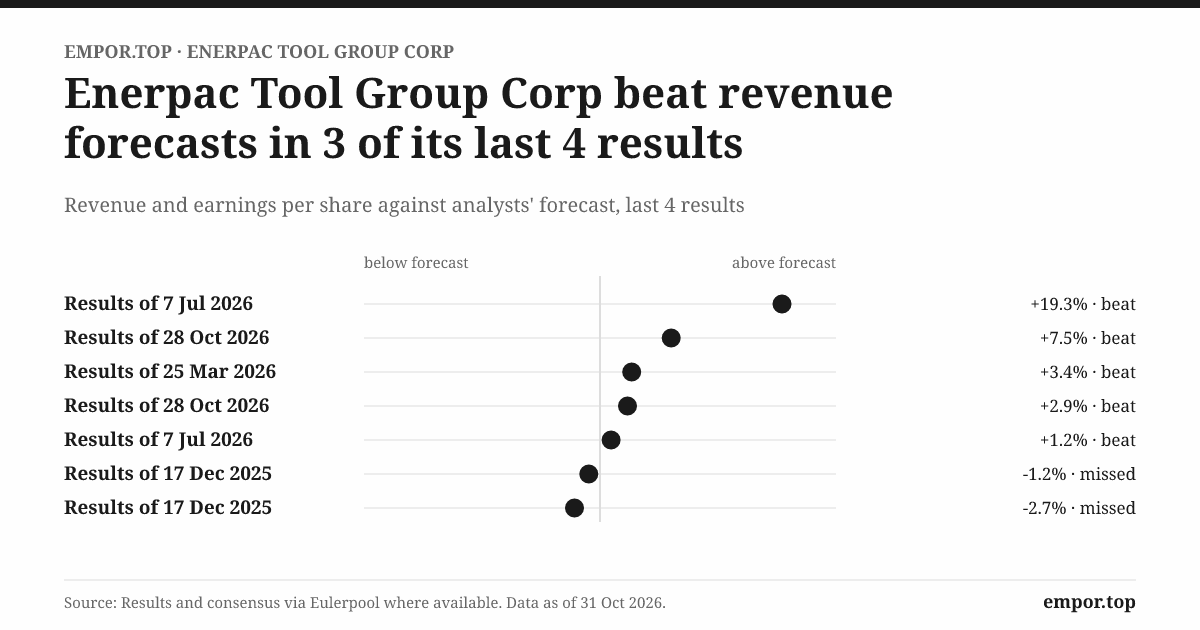
The guidance record through the year is worth telling, because it reveals how management handled bad news. In December 2025 the company guided to organic growth of 1% to 4% for fiscal 2026 and adjusted earnings per share of $1.85 to $2.00.5 In March it narrowed the range to organic growth of 1% to 3% and earnings of $1.85 to $1.92.6 In July it cut again, to organic growth of 1% to 2% and earnings of $1.84 to $1.89, with adjusted EBITDA guidance trimmed to $151 to $156 million.7 Three quarters, three steps down. Then the fourth quarter came in far stronger than the company had signalled, and full-year organic growth landed at about 4%, above even the original range.8 A cynic would say management lowered the bar so it could clear it. A fairer reading is that the company was quick to tell investors when service was failing to recover, and conservative about calling the turn. Either way, investors learned that this management team will cut guidance rather than hope, which is a habit worth more than a perfect forecast.
Through the year, management pointed to sequential improvement. By the third-quarter call in July 2026, it described service as getting better quarter on quarter, while acknowledging that conflict and access restrictions were still weighing on the business.7 In the fourth quarter, service returned to growth for the first time in the fiscal year, and total organic sales in the tools business rose about 10%, driven by the Americas.18 Even in Europe, the Middle East and Africa, service grew in the fourth quarter, helped by maintenance work on liquefied natural gas facilities, although Sternlieb still described the Middle East as carrying "near-term uncertainty."8 Those are real signs of recovery. But the full year still told the harder story: service and rental sales fell about 12% organically for fiscal 2026, while product sales grew about 6% organically.1
The contrast between the two lines is the heart of this chapter. The product engine carried the top line through a service downturn, which is evidence that the core tools business has genuine demand. Yet service weakness, together with a product mix tilted toward heavier lifting equipment, helped push gross margin down.18 So the year proved one thing and left another unproven. Products can carry the company through a service slump. Service has not yet shown that it can reliably add profitable growth.
Management offered a new growth story alongside the service problems: data centres. The construction of large computing facilities has created demand for moving and positioning heavy equipment such as generators, transformers and cooling units. On the fourth-quarter call, management described repeat orders for mobile gantries and E-Movers, the battery-powered machines that shift heavy loads across a floor.8 It is worth being precise about how that demand reaches Enerpac. Its tools are rarely installed permanently inside a data centre. They are used by equipment manufacturers, installers and transport firms to build, move and position the heavy gear that goes in. That makes data-centre demand a real but indirect driver, and management did not quantify its contribution to revenue.8 A trend investors like to hear about is not the same as a revenue line they can measure.
Currency added another layer. A weaker U.S. dollar lifted fiscal 2026 sales by about $13 million, because revenues earned in euros and other currencies translated into more dollars.2 That helped the reported numbers without reflecting more tools sold. The company’s own sensitivity estimate puts the risk in proportion: a 10% broad decline in foreign currencies against the dollar would reduce sales by about $30 million and operating profit by about $4 million.2 Currency is a real factor for a company with most of its cash held abroad and a large European footprint, but it is bounded. It does not explain the service slump, and it should not be used to excuse it.
So the operating measure that settles this chapter is narrow and specific. Total revenue in fiscal 2027 will be inflated by SFE, which makes it a poor guide to the health of the original business. What will matter is organic service growth and the gross profit service contributes, especially in Europe, the Middle East and Africa. If service grows profitably, the fiscal 2026 margin decline will look like a temporary dent. If it does not, products will keep carrying a business line that dilutes the rest. And Enerpac has now added a much larger new variable to that equation.
VI. Sternlieb’s New Growth Plan Meets a $472 Million Test
On October 28, 2026, Enerpac published two announcements on the same day. One reported its fourth-quarter and full-year results.1 The other said it had completed the acquisition of SFE Group.4 The next morning, on the earnings call, investors heard about the year that had ended and the much bigger company that had just begun.8 That sequencing captured the moment: the last year of the old Enerpac, and the first day of a larger, more leveraged one.
The deal itself had been public since July 7, 2026, when Enerpac announced a definitive agreement alongside its third-quarter results.47 The seller was SFEG Holdings, a portfolio company of Gladstone Investment Corporation, a listed private-equity-style investor.4 On the July call, management described the transaction as completely proprietary, meaning it was negotiated directly rather than won in an auction, and said the seller had not been planning to sell.7 Proprietary deals are what every acquirer wants to claim, because they suggest a fair price without a bidding war. They are also impossible for outsiders to verify. What can be verified is the price, and that comes later in this chapter.
The deal did not arrive out of nowhere. It was the next step in a sequence Sternlieb had built since taking over. First came ASCEND, the margin programme. Then PEP, the operating system meant to make improvement a habit. Then a modest acquisition, DTA, a European maker of horizontal load-movement systems, bought in September 2024 for about €24 million plus a potential earn-out, or roughly $26.7 million in dollar terms.132 Then a heavier pace of share buybacks. And now SFE.
The strategy behind that sequence was spelled out in the 2024 annual report. Enerpac would target infrastructure, rail, industrial maintenance, repair and operations, and wind energy, and it would buy products or capabilities that filled gaps in its offering.13 DTA was the textbook example. Enerpac’s tools were strong at lifting things vertically; DTA’s systems moved heavy loads horizontally across a floor. Put the two together, and a customer could lift a transformer off a truck and slide it into position with one supplier’s equipment.
SFE extended the same logic on a much bigger scale. Its brands include Climax, known for portable machine tools that bring the workshop to a large component in the field, B&B Sumner and Axxair, and its products span fabrication, welding, machining and material handling.4 Think of a technician who needs to resurface a giant flange on an offshore platform or cut and bevel a pipe before welding. Instead of shipping the part to a machine shop, SFE’s portable tools clamp on and machine it in place. That sits naturally next to Enerpac’s bolting and lifting tools in the same customer’s toolkit. With about $170 million of sales in the twelve months to March 2026, SFE adds roughly a quarter to Enerpac’s pre-deal annual revenue.4
The rest of the profile fills in the picture. SFE is headquartered in Houston, employs about 350 people and runs five production facilities and seven rental depots, under a dozen brands that also include Mathey Dearman, Magnatech, Bortech and Calder.4 Its customers sit in aerospace and defence, power generation, semiconductors and data centres, oil and gas, utilities, shipping and mining.4 About three-quarters of its revenue comes from the Americas, which matters for a company whose own exposure to Europe has been its biggest source of uncertainty; management called Europe, roughly 40% of the business, the "wild card" in its fiscal 2027 outlook.8 Management said SFE adds about $1 billion to Enerpac’s addressable market, lifting the company’s estimate from about $4.5 billion to about $5.5 billion.78 That figure is a company estimate, and should be held as loosely as the original one.
SFE is also a profitable business. Its roughly $44 million of adjusted EBITDA on about $170 million of sales implies a margin near 26%, above Enerpac’s own reported operating margin, though the two are measured differently.4 Sternlieb described it on announcement as "an exceptional business with premium brands, strong margins, complementary products, and a proven track record of growth."4 That is the language every buyer uses. What the numbers do support is that Enerpac did not buy a turnaround. It bought a business that, on its stated figures, already earns margins similar to its own, which means the deal cannot be justified by fixing SFE. It has to be justified by growing it.
The price was about $472 million: roughly $452 million in cash plus about $20 million of equity awards to key SFE personnel.42 Against SFE’s trailing adjusted EBITDA of about $44 million, that was about 10.6 times earnings before interest, tax, depreciation and amortisation, or about 9.5 times after counting $4 to $6 million of expected synergies in year three.4 Enerpac’s own shares, by comparison, traded at about 16.9 times enterprise value to EBITDA on October 31.1
The comparison is tempting and needs care. On the surface, Enerpac paid around ten times for a business while its own stock is valued at around seventeen times, which looks like buying cheap and wearing an expensive currency. But private-company adjusted EBITDA often includes add-backs that a public company would not make, SFE’s growth and margin profile are not disclosed in detail, and the two multiples are measured on different bases and at different times. The gap is a useful reference point, not proof that the buyer got a bargain. A deal only proves its discipline after it delivers.
The funding is where the risk becomes concrete. Enerpac paid for SFE with cash on hand, a new $300 million term loan and $312 million drawn under its revolving credit facility.24 The facility itself was new: in October 2026 lenders supported a five-year, $850 million arrangement made up of a $550 million revolver and the $300 million term loan, with an option to expand by another $425 million.2 At the end of fiscal 2026, Enerpac’s borrowings of about $182 million were almost matched by about $175 million of cash, putting net leverage at roughly 0.1 times EBITDA. After closing, management estimated net leverage at about 2.3 times.82 In one transaction the company went from almost no net debt to a balance sheet that will need a couple of years of cash generation to repair. It is worth noting that the outcome was better than the plan: when the deal was announced in July, management had estimated pro forma leverage of about 2.8 times, and the strong fourth-quarter cash flow brought the figure at closing down to about 2.3 times.78
The deal also carries costs that do not appear in the purchase price. Enerpac expects about $8 million of transaction costs and $10 to $14 million of integration costs, plus recurring spending to bring SFE’s finance, reporting and legal functions up to the standard of a listed company.48 Management says the deal will add to adjusted earnings per share in fiscal 2027.4 But on the fourth-quarter call, the finance chief was candid that SFE’s contribution of roughly 20 cents a share over ten months, once interest costs and reinvestment are counted, "might get you to something that is a little bit less."8 Adjusted accretion that excludes integration costs and depends on interest rates is a weaker claim than the headline suggests.
There is no public credit rating to weigh that leverage against; the company has no rated bonds, and its bank lenders are the practical credit judges.16 Their willingness to commit $850 million is evidence of confidence. It is not an independent view of risk.
Now test management’s credibility against its behaviour. On the positive side, Enerpac generated about $120 million of free cash flow in fiscal 2026 and has reduced borrowings substantially over time.1 On the other side, it repurchased about 2.1 million shares for roughly $81 million in fiscal 2026 and about 1.7 million shares for roughly $68.7 million in fiscal 2025.2 Put together, the company spent around $150 million buying back its own stock in the two years immediately before borrowing heavily to buy SFE. A skeptical holder could fairly ask whether that cash would have been better kept to reduce the debt the deal required. A defender could answer that the buybacks were made at prices that now look reasonable and that the deal was opportunistic. Both views can be true, which is exactly why the next two years matter.
The dividend barely enters the conversation. Enerpac paid about $2.1 million of dividends in fiscal 2026, a token amount next to its free cash flow.2 Buybacks and acquisitions are the real capital-allocation levers, and both are discretionary. The question is whether buybacks, integration spending and debt reduction can all coexist, or whether one will have to give way. With $119.7 million still authorised for repurchase at fiscal year-end, the board has left itself room to keep buying stock even as it pays down debt.2
Alignment and governance offer modest reassurance. Sternlieb beneficially owned 335,156 shares, and executive officers and directors as a group held about 1.5% of the company, according to the FY2025 proxy.14 His reported compensation was about $6.55 million in fiscal 2025, including about $4.52 million of stock awards, which ties much of his pay to share-price performance.14 That was down from about $9.61 million in fiscal 2023, a year inflated by new-hire awards, while net earnings from continuing operations roughly doubled over the same span.14 Shareholders appeared comfortable: at the February 2026 annual meeting, say-on-pay passed with only about 1.9% of votes cast against.17 The highest director dissent was directed at board chair E. James Ferland, with about 1.9 million votes withheld, a signal worth noting but not a revolt.17 There is no controlling shareholder, and the company disclosed no material related-party transactions in fiscal 2025.14
The ownership register looks like a typical mid-cap industrial: large index and active managers such as BlackRock, Vanguard, Kayne Anderson Rudnick, Capital International and Neuberger Berman, with BlackRock reported at about 14.5%.1418 No activist or concentrated owner is visible in those filings.
The earnings call was where analysts did their probing. They pressed management on the margin decline, on the leverage SFE created, on guidance, on the real size of data-centre exposure and on the low absolute level of research and development spending.8 Management’s answers on margins and leverage were concrete: it decomposed the margin pressure into service, mix, deal costs and incentives, and set out a path for debt reduction. Its answers on data-centre demand and product innovation were less precise, describing customer wins and pipelines without revenue figures. That pattern is not evasive, but it does show where the evidence is firm and where it remains a narrative.
A few exchanges are worth hearing in more detail. Asked about capital allocation, Darren Kozik, the finance chief who joined in October 2024, said "debt paydown is top of mind," while buybacks and small bolt-on acquisitions remained "on the table."814 Asked by Argus about data-centre wins, Sternlieb said "I do think we are taking share," and argued that being on approved-vendor lists makes Enerpac "the easy button" for equipment makers in a hurry.8 He also said availability matters more than price to those customers, which is a revealing remark about where Enerpac’s pricing power comes from: not from being cheaper, but from having the right gantry in stock when a generator maker needs it.8 Asked about research and development, he pointed to spending growth of about 11% a year over three years and to eleven product launches in fiscal 2026, up from five the year before, and promised to "continue to increase our level of investment."8 That is a fair answer to a fair challenge. It does not yet show what those launches earn, because the company does not disclose sales from new products.
On pricing, Sternlieb said the company typically takes one to two price increases a year, set by geography and product line.8 It had taken a low single-digit increase in December 2025 in the Americas and Europe, and early in the year management said pricing and productivity had offset the dollar cost of tariffs.5 In the third quarter, results were also flattered by about $6 million of expected refunds on tariffs, a one-off benefit worth about 8 cents of adjusted earnings per share.7 Regular price increases that stick are the closest thing in Enerpac’s disclosures to evidence of pricing power. They are still a far cry from proof, because the company does not split growth into price and volume.
The targets are now on the record. For fiscal 2027, Enerpac guided to revenue of $825 to $845 million, adjusted EBITDA of $195 to $205 million and adjusted earnings per share of $2.00 to $2.15, with organic growth of about 4% to 6%.8 Management said it aims to bring net leverage back to about 2.0 times by fiscal year-end, within a stated long-term range of 1.5 to 2.5 times.8 Those numbers include about ten months of SFE, which is why revenue jumps so far above fiscal 2026. Management said the midpoint of the EBITDA guide implies a margin of about 24%, which would mean the combined company earns more on each dollar of sales than Enerpac did alone in fiscal 2026.8 That is an ambitious claim in a year that also carries integration costs, and it is the single most testable promise on the record.
That leaves the question an activist would ask, framed plainly. Enerpac bought back about $150 million of stock over two years, then borrowed about $600 million to buy SFE. What evidence will show that each next dollar of capital earns more in integration and growth than it would have earned simply paying down debt or buying back more shares? The answer will not come from management’s presentations. It will come from SFE’s cash generation, realised synergies and the leverage ratio a year from now. And to judge whether those numbers deserve the market’s current price, the story has to weigh the whole case, bull and bear.
VII. The Case for Enerpac, and the Case Against It
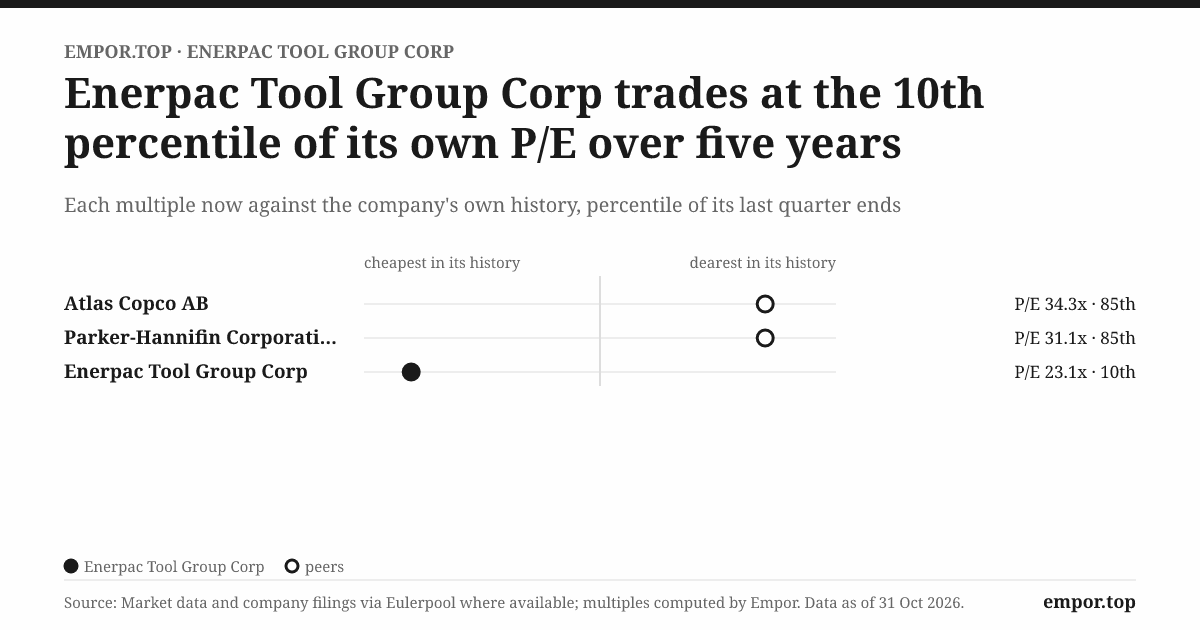
On October 31, 2026, Enerpac’s stock closed at $39.02, about 9% below its 52-week high of $43.02 and well above its low of $32.50.1 At that price investors were paying about 23 times trailing earnings, below the company’s own five-year median of about 27.5 times, and about 16.9 times enterprise value to EBITDA.1 The book value per share was about $8.32, so the market valued the company at more than four and a half times what its accounts say shareholders own.1 That gap is normal for an asset-light business whose value sits in brand, channel and know-how rather than in factories. It also means the price depends on earnings, not on assets to fall back on.
For context, on October 30 Snap-on traded at about 18.5 times trailing earnings, Lincoln Electric at about 26.6 times and SPX Technologies at about 27.1 times.192021 Their EV-to-EBITDA multiples ranged from about 12.9 to about 17.4 times.192021 Enerpac sits in the middle of that loose group. None of those companies is a like-for-like peer: Snap-on sells hand tools and diagnostics to mechanics, Lincoln Electric makes welding equipment, and SPX makes heating, ventilation and detection systems. But together they suggest the market is pricing Enerpac as a solid industrial, neither as a turnaround nor as a high-growth compounder. The discount to its own five-year median earnings multiple suggests investors have trimmed their expectations after the fiscal 2026 margin dip and the SFE leverage.
Start with the bull case, told without management’s language. The focused product business grew about 6% organically in fiscal 2026, even while service shrank.1 Free cash flow reached about $120 million, a yield of roughly 5% on the market value.1 Margins, even after the fiscal 2026 dip, sit near 20%, roughly four times where they were in fiscal 2022.1 Returns on invested capital above 20% suggest the business earns well on the money tied up in it.1 And SFE adds complementary brands, customers and channels, creating a real opportunity to sell machining and welding tools through Enerpac’s distributors and Enerpac’s tools to SFE’s customers. If that cross-selling works and the debt comes down on schedule, Enerpac in two years could be a larger, more diversified tools company with similar margins and lower leverage.
The bear case deserves equal force. Service fell about 12% organically and has high fixed costs.1 Operating margin declined from 22.6% to 19.8% in a single year, which shows that the transformation’s gains are not immune to mix and cost pressure.1 Post-deal leverage of about 2.3 times means that a downturn in European industry or energy markets would hit a balance sheet with much less cushion than before.8 Research and development spending is low, which may leave Enerpac exposed if competitors move faster on electric, connected or digital tools. And the history of the predecessor company includes expensive portfolio choices, which makes a debt-funded acquisition worth watching rather than celebrating.
The moat, already weighed at the power-plant turbine where a manager chooses between a catalogue wrench and an Enerpac distributor, can be summarised here as a verdict rather than argued again. Distribution through more than 900 dealers, product breadth, brand and application expertise are credible advantages, but they are company-reported, and retention, share gains and price realisation are not quantified.13 The disclosed customer concentration is low, which reduces single-customer risk without proving loyalty. The honest version of the moat is narrower than the confident version: a strong niche position in high-consequence jobs, with competitive pressure in routine ones.
Geography sharpens both cases. In fiscal 2026 the Americas tools business grew about 10% organically, while Europe, the Middle East and Africa fell about 3% and Asia-Pacific slipped about 1%.8 Management attributed the American strength to U.S. industrial activity, data centres, power generation, defence and the reshoring of manufacturing.8 The bull reads that as evidence that Enerpac’s brand wins where demand is strongest. The bear notes that Europe and its neighbours remain about 40% of the business, and that the company’s fiscal 2027 outlook depends on a region management itself calls a "wild card."8 SFE, with about three-quarters of its sales in the Americas, tilts the combined company toward the stronger region. That is a sensible hedge. It is also a reminder that the acquisition was, among other things, a way to buy growth the original business was not producing in Europe.
Management credibility belongs on the scale too. Over fiscal 2026 the team cut its organic growth guidance twice and then beat even its original range; it estimated 2.8 times leverage at the SFE announcement and closed at 2.3 times.78 It explained its service decline with specific regions, specific causes and a restructuring with a stated payback, rather than vague references to macro conditions.6 Those are good habits. Against them stand the fiscal 2026 margin decline, which came after three years of promises that the transformation was structural, and the decision to spend heavily on buybacks shortly before borrowing for SFE. The record supports a management team that reports honestly and runs operations well. It does not yet support a team that has proven its judgment on large capital decisions, because this is the first one it has made.
The historical record is the right place to test whether the focused strategy deserves trust. The 2019 divestiture and its $264.5 million of charges show how much the old portfolio cost when it was unwound.9 The 2017 Viking write-downs show a pattern of buying into cycles and paying to leave them.9 Against that, the focused era under Sternlieb has so far featured only small acquisitions, a margin recovery and steady debt reduction, until SFE. Neither the old losses nor the new leverage alone disproves the focused strategy. What the record does is narrow the claim. Enerpac’s management has proven it can run the existing business well. It has not yet proven it can buy and integrate a large business well, because it had not tried until now.
Receivables offer a smaller but useful test of earnings quality. In the fiscal 2023 filing, Enerpac disclosed that a delinquent agent accounted for about 11.3% of receivables, fully reserved after no payment since February 2021.15 In fiscal 2025 the company wrote off about $12.9 million of old credit-loss allowances relating to charges incurred before fiscal 2023, effectively closing out that episode.12 By the end of fiscal 2026, the allowance for credit losses was about $3 million and bad-debt expense had stayed below 0.5% of sales in each of the past three years.2 Contract assets, which represent revenue recognised before billing, rose from about $11.8 million to about $16.9 million.2 That rise is not alarming on its own, but it is worth tracking, because revenue booked ahead of invoices depends on the work actually being billed and paid. Enerpac does not publish an ageing table, so the market cannot see how much of its receivables are overdue.
The audit and legal overhang is contained. Enerpac’s auditor issued unqualified opinions on the fiscal 2026 financial statements and internal controls, with no material weakness reported.2 One legal matter remains open: a Dutch sanctions proceeding tied to fiscal 2019 sales linked to Crimea, which the company voluntarily disclosed. The parallel U.S. investigation closed, the company recorded an expense in fiscal 2021 at the low end of a reasonable penalty range, and it did not change that estimate in fiscal 2026.2 It is a reputational reminder rather than a financial threat.
If an investor wanted to watch only three numbers, the evidence points to these. The first is organic product growth, which was about 6% in fiscal 2026 and is the clearest signal of the core brand’s health.1 The second is service growth and its margin contribution, which fell about 12% organically for the year before turning positive in the fourth quarter.1 The third is SFE’s cash generation and synergy delivery, tracked through net leverage, which jumped from about 0.1 times to about 2.3 times at closing.8 Those three together tell you whether the company is growing, whether its weakest line is healing and whether its biggest bet is paying back.
The risk radar is short. European industrial demand matters because much of the business sits there. Access to Middle Eastern service work matters because conflict already cost Enerpac a year of service growth. Currency matters, within the limits already described. Integration execution and the cost of debt matter because SFE is large and borrowed. Artificial intelligence and cybersecurity, fashionable themes in many industrial stories, do not appear to be central drivers here; Enerpac sells physical tools that are hard to substitute with software.
The investment spine comes down to this. Enerpac has delivered a real operating recovery, and its shares trade at a moderate discount to their own historical earnings multiple. But it is not yet a proven compounder after an acquisition, because the acquisition has only just closed. The story so far teaches some lessons that are worth drawing out before looking at what comes next.
VIII. Business & Investing Lessons
Seven years separate two scenes: the sale of EC&S and the purchase of SFE.104 In between, it went from shrinking to buying, from conglomerate to focused tools company, and from a 5% operating margin to more than 20%. Each turn in that journey carries a lesson that belongs to Enerpac rather than to industrial companies in general.
The first lesson comes from the portfolio exit. The costly EC&S sale remains the clearest example.9 The temptation, for executives and investors alike, is to treat a write-down as an accounting technicality, a non-cash charge to adjust away. Enerpac’s write-down was something else: a receipt for decisions made years earlier, when the conglomerate bought or built businesses at values the market later refused to honour. Focus did clarify the business that remained. But the cost of the clarification was real, and it was paid by shareholders who had owned the old story. Focus can clarify a business, but a write-down tells you what the old story cost.
The second lesson comes from the margin recovery. The improvement showed that operational changes could unlock earnings without a new factory or product category.1512 The broader point for founders and investors is that in some industrial businesses, the asset base hides how much earnings power is locked inside the operations. In an asset-light industrial company, small process gains can move earnings more than the factory footprint suggests.
The third lesson comes from fiscal 2026’s split between products and service.1 That made the year look acceptable on the headline. But the margin decline showed the cost of carrying a service line that cannot grow when access to its customers is blocked. A company can recover on the strength of its products and still have a structurally fragile service model. A product-led recovery is not the same thing as a resilient service model.
The fourth lesson comes from the buybacks and SFE. Enerpac’s buybacks before the acquisition totalled about $150 million.2 Whether that sequence was wise will be decided by results that have not arrived yet: SFE’s cash generation, the synergies, the leverage a year from now. Management can describe its discipline, but the evidence comes only after the money has been spent. Capital discipline is measured after the cheque clears.
The fifth lesson comes from cash conversion. Over twelve years, Enerpac’s operating cash flow was nearly five times its net profit.2 That is a powerful sign that its earnings, when it had them, were real. But much of the gap came from write-downs that did not consume cash and from working-capital releases that cannot repeat forever, including the inventory reduction that flattered fiscal 2026. Investors who extrapolate a long-run sum into an annual forecast will be disappointed. Cash is evidence of quality, but a long-run sum is not a promise about next year.
Those lessons point to the same conclusion. Enerpac’s story so far supports a lesson in focus and operational discipline. Its next lesson depends on whether it can turn a larger balance-sheet risk into per-share value, and the first answers are only days away.
IX. Epilogue
On the October 29 earnings call, management closed by pointing investors to a date: November 4, 2026, when Enerpac will hold an Investor Day to set out its Propel strategy and multi-year objectives.8 It was a fitting way to end a call that had looked both backward and forward. Fiscal 2026 was the last year of the old Enerpac. Propel will be the language of the new one.
Tonight, Enerpac stands at a hinge. It has a recovered margin, a strong cash record, a service business that has just returned to growth, and a balance sheet that went from almost unlevered to meaningfully indebted in a single week. Its fiscal 2027 guidance calls for revenue of $825 to $845 million and adjusted earnings per share of $2.00 to $2.15, with SFE’s year-three synergies targeted at $4 to $6 million.84 Those are management’s numbers. The next twelve months will decide whether they become the company’s.
The Investor Day is the first moment that matters. Investors will want to see multi-year targets for organic growth and margins, a credible plan for integrating SFE, detail on the innovation pipeline that analysts asked about on the call, and a Q&A that tests the plan rather than reciting it. If Propel comes with measurable goals and specific milestones, it will give the market a way to hold management to account. If it is mostly aspiration, the market will discount it accordingly.
The quarterly results that follow will matter more. The first test is whether management’s organic growth guide of about 4% to 6% arrives with service recovery or is carried mainly by products and the newly added SFE.8 Growth carried by acquisition is not the same as growth earned by the original business, and investors will need to separate the two in every quarterly report. The second test is whether SFE performs against its baseline of about $44 million of adjusted EBITDA and moves toward its synergy target.4 The third is net leverage, which management aims to bring down to about 2.0 times by the end of fiscal 2027, within its stated range of 1.5 to 2.5 times.8
The leverage arithmetic is worth doing in plain numbers, because it shows how much room the company really has. Start from the pieces already on the record: Enerpac entered the deal with borrowings of about $182 million and cash of about $175 million, then paid about $452 million in cash for SFE.24 That leaves net debt in the neighbourhood of $450 million, which is consistent with 2.3 times a combined adjusted EBITDA of roughly $200 million. If fiscal 2027 adjusted EBITDA lands near the $200 million midpoint of guidance, reaching 2.0 times means bringing net debt down to about $400 million, a reduction of around $50 million.8 On paper that is easy: Enerpac generated about $120 million of free cash flow in fiscal 2026 alone.1 In practice, integration costs, higher interest payments and any further buybacks will eat into that cash, and management has said free cash flow tends to arrive in the second half of the year.8 The target is achievable without heroics. Missing it would therefore say more about priorities than about circumstances.
Each outcome tells a different story. If margins recover toward fiscal 2025 levels while integration costs and Propel investments rise, the transformation will look durable and the SFE deal will look like a well-timed extension of a strong platform. If margins stay near 20% but leverage falls on schedule, Enerpac will look like a solid company that bought growth at a fair price. If margins slip further and leverage stalls, the old conglomerate pattern of expensive expansion will return to the conversation.
Capital allocation will be watched closely. The company still has repurchase authority available, and investors will want to see whether it shifts toward debt repayment after two years of heavy buybacks.2 A choice to keep buying back stock while leverage sits above target would tell the market something about management’s priorities.
One smaller question remains open, and only because the company has not published the answer. Enerpac does not disclose an ageing table for its receivables, nor the conversion of its rising contract assets into billed revenue. Those numbers would settle whether the old agent loss was a one-off or a symptom of channel risk. Until the company publishes them, the question stays alive, quietly.
There is a detail about the Investor Day itself worth noting. Enerpac chose to hold it at the New York Stock Exchange, and to follow it within a week with an appearance at the Baird Global Industrial Conference in Chicago on November 10.8 Management described Propel as resting on three pillars: growth in attractive end markets through commercial excellence, differentiation through product-first innovation, and expansion through operational excellence, including the PEP system and tighter inventory management.8 Each pillar maps onto a question this story has already raised. Commercial excellence is the test of whether the brand and the dealer network can win share in data centres, power and defence. Product-first innovation is the answer to analysts who think the company spends too little on research. Operational excellence is the claim that the margin gains of fiscal 2023 to 2025 can be repeated inside a bigger business. Propel’s value will lie entirely in whether it comes with numbers that can be checked.
The tension that remains is simple. Enerpac has proven it can run a focused tools business well. It has not yet proven it can grow that business through a large acquisition without weakening the very discipline that made it worth owning.
X. Outro
Go back to the girder that opened this story, sitting a few centimetres out of place. A technician sets the cylinders, works the pump and watches the gauge. The load rises slowly, held by controlled pressure, and moves exactly as far as it should and no further. The customer trusts the tool, the distributor who sold it and the know-how behind both. That is what Enerpac has always sold: force that does what it promises.
Now the company carries a different kind of load. It has taken on debt to buy SFE, promised synergies and set targets for growth, margins and leverage. The same qualities that make a hydraulic lift safe—precision, control and patience—will decide whether that new weight lands where it should. Enerpac sells force under control. Now it has to prove it can grow that way.
References
-
Enerpac Tool Group Reports Fourth Quarter and Full Year Fiscal 2026 Results — Enerpac Tool Group, 2026-10-28 ↩↩↩↩↩↩↩↩↩↩↩↩↩↩↩↩↩↩↩↩↩↩↩↩↩↩
-
Enerpac Tool Group Corp. FY2026 Form 10-K — StockTitan copy of SEC filing, 2026-10-29 ↩↩↩↩↩↩↩↩↩↩↩↩↩↩↩↩↩↩↩↩↩↩↩↩↩↩↩↩↩↩↩↩↩↩
-
Enerpac Tool Group Completes Acquisition of SFE Group — Enerpac Tool Group, 2026-10-28 ↩↩↩↩↩↩↩↩↩↩↩↩↩↩↩↩↩↩↩
-
Enerpac Tool Group Q1 FY2026 earnings call transcript — Stock Analysis, 2025-12-18 ↩↩↩↩↩↩↩↩
-
Enerpac Tool Group Q2 FY2026 earnings call transcript — Stock Analysis, 2026-03-26 ↩↩↩↩↩↩↩↩
-
Enerpac Tool Group Q3 FY2026 earnings call and SFE acquisition transcript — Stock Analysis, 2026-07-08 ↩↩↩↩↩↩↩↩↩
-
Enerpac Tool Group Q4 FY2026 earnings call transcript — Stock Analysis, 2026-10-29 ↩↩↩↩↩↩↩↩↩↩↩↩↩↩↩↩↩↩↩↩↩↩↩↩↩↩↩↩↩↩↩↩↩↩↩↩↩↩↩↩↩↩↩↩↩
-
Actuant Corporation FY2019 Form 10-K — SEC, 2019-10 ↩↩↩↩↩↩↩↩↩
-
Actuant announces sale of EC&S segment businesses, Exhibit 99.1 — SEC, 2019-07-09 ↩↩
-
2019 Investor Day presentation — Enerpac Tool Group, 2019 ↩↩↩
-
Enerpac Tool Group Corp. FY2025 Form 10-K — SEC, 2025-10-17 ↩↩↩↩↩
-
Enerpac Tool Group Corp. FY2025 Proxy Statement — SEC, 2025-12-22 ↩↩↩↩↩↩↩↩
-
Enerpac Tool Group Corp. FY2023 Form 10-K — SEC, 2023-10-20 ↩↩↩↩
-
2026 Annual Meeting Voting Results, Form 8-K — SEC, 2026-02-05 ↩↩
-
Vanguard Portfolio Management Schedule 13G for Enerpac Tool Group — SEC, 2026-04-29 ↩
-
Lincoln Electric valuation statistics — Stock Analysis, 2026-10-30 ↩↩
-
SPX Technologies valuation statistics — Stock Analysis, 2026-10-30 ↩↩
 LinkedIn
 WhatsApp
 Reddit
 Hacker News
 Email
 Kindle
 RSS Feed
 Spotify
 Apple Podcasts
 Amazon Music
 Audible
 YouTube