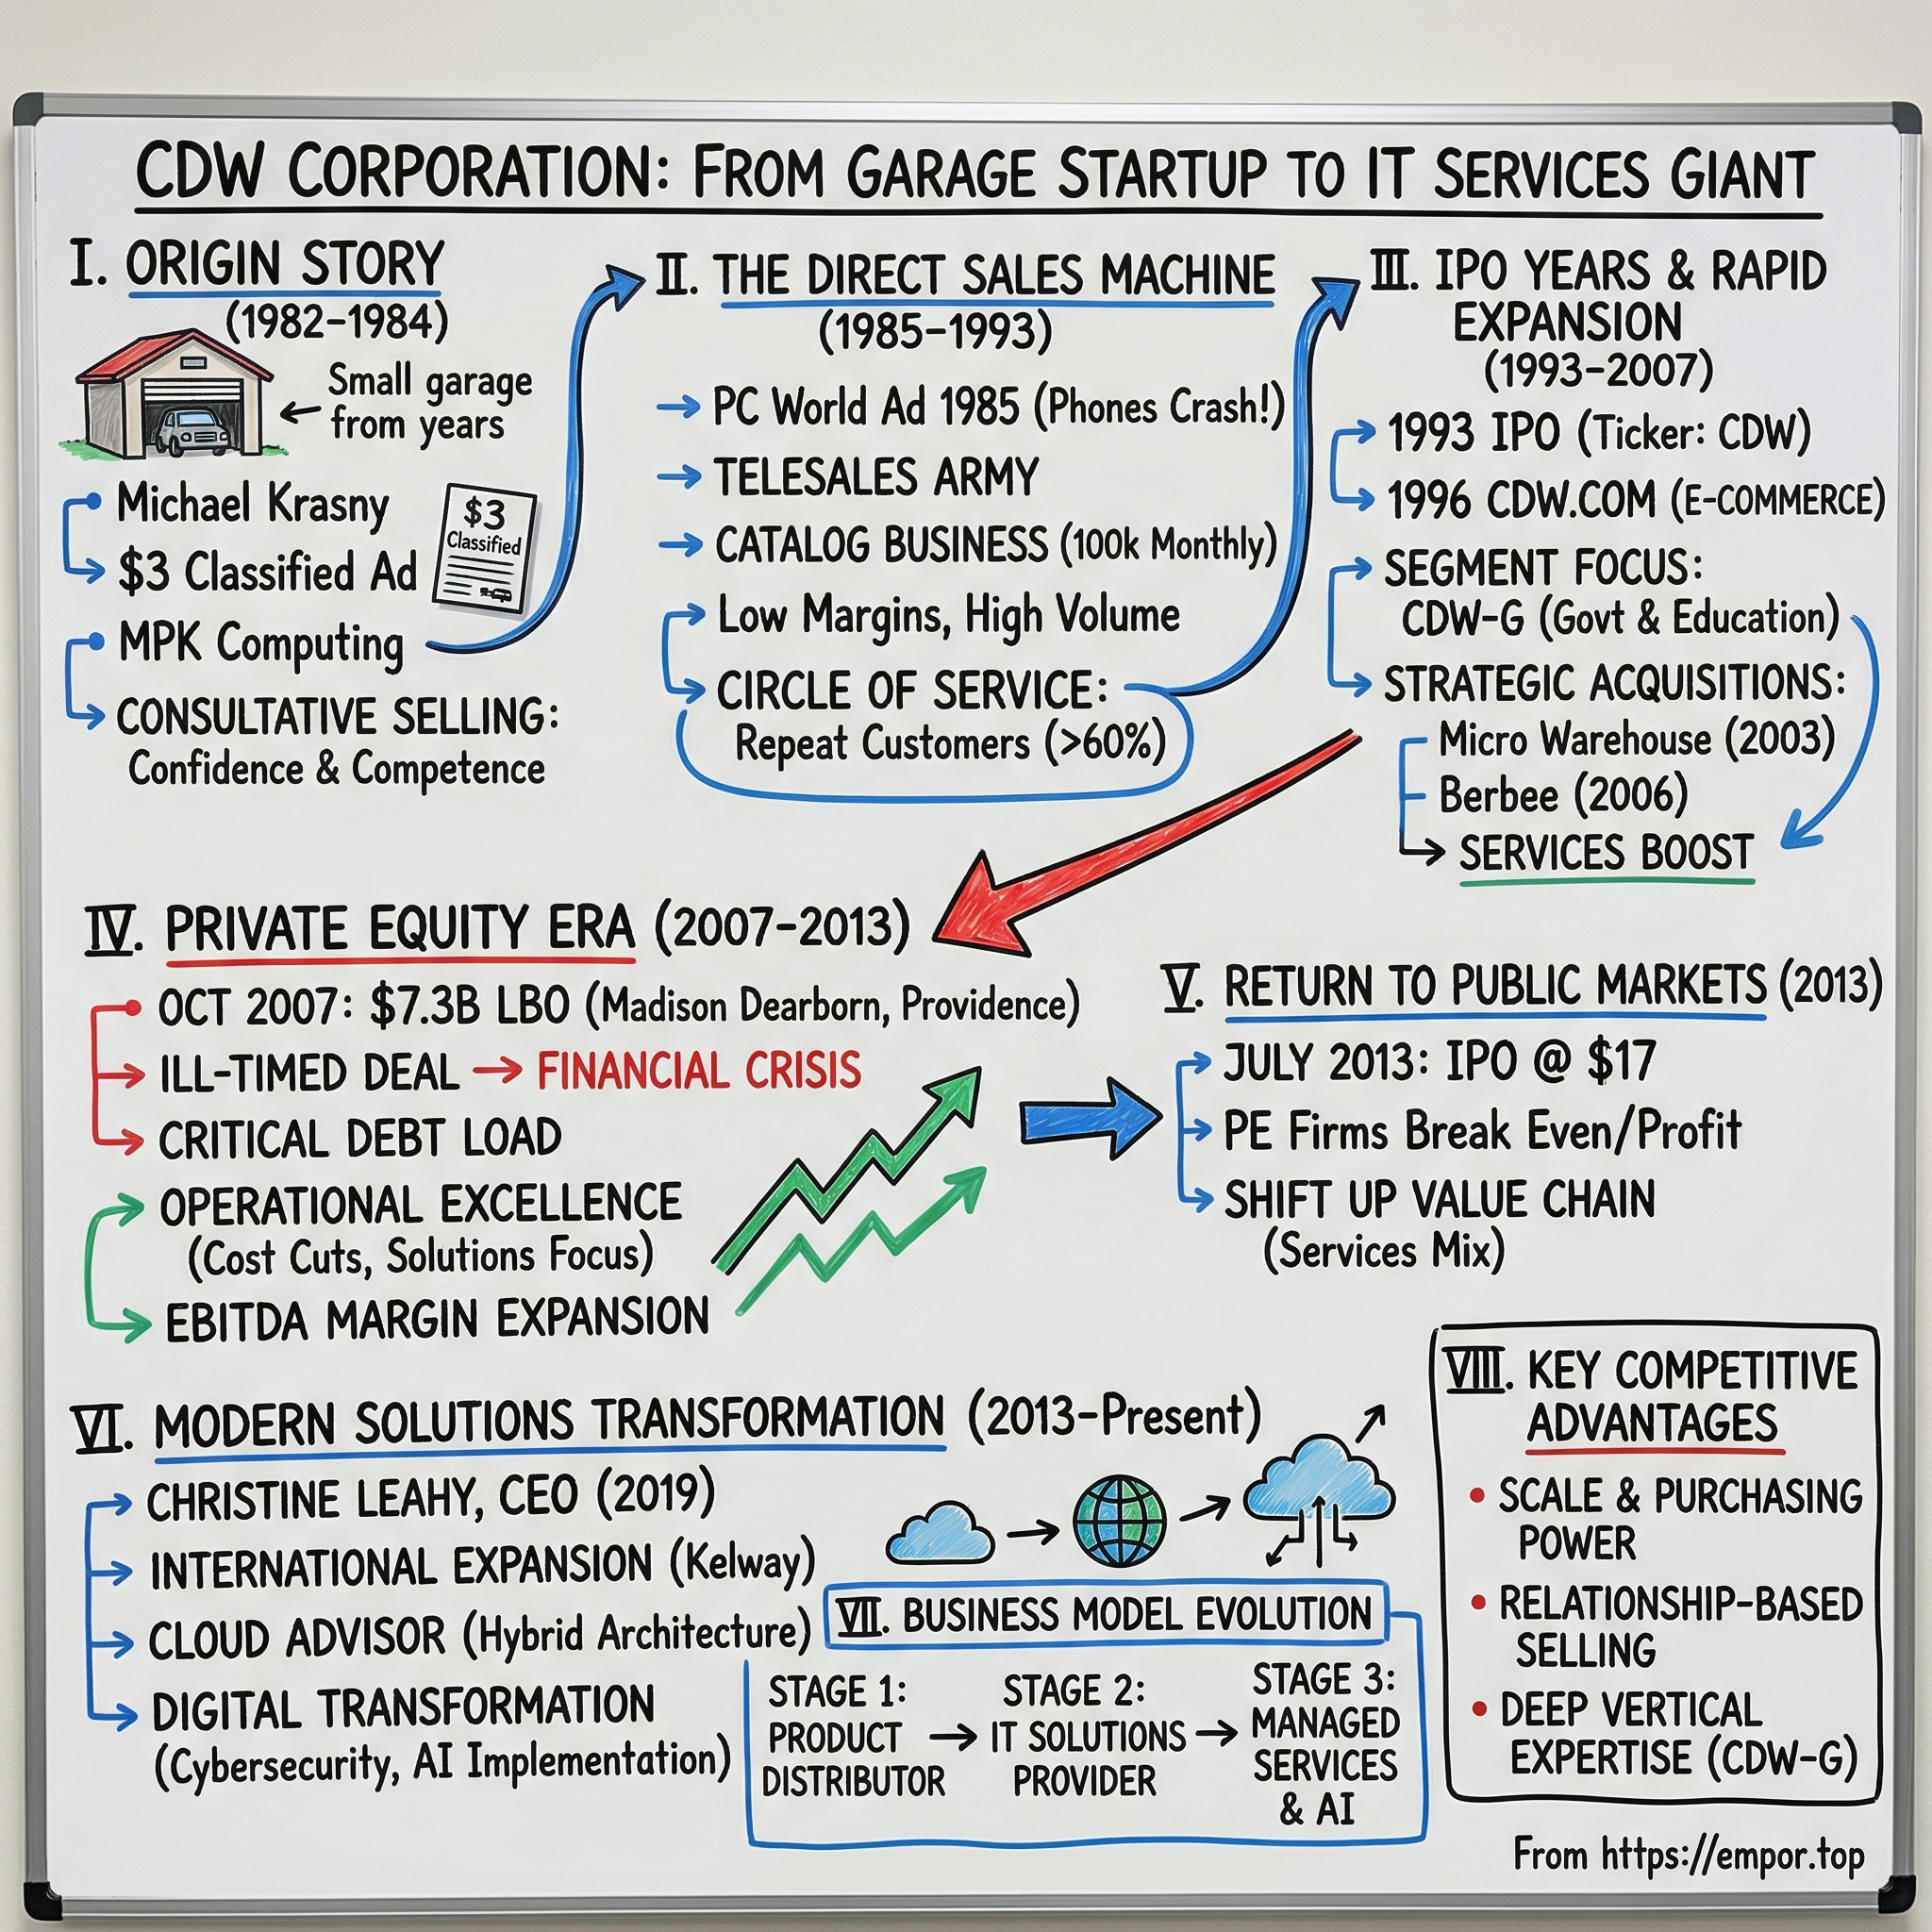
CDW Corporation: From a $3 Classified Ad to a $22 Billion IT Solutions Engine
I. Introduction & Episode Roadmap
There is a particular kind of company that almost never gets a podcast episode: the one that sits in the middle. Not the chip designer, not the hyperscaler, not the software company with 80% gross margins and a founder on stage in a black turtleneck. The one in the middle takes other people's products, adds a layer of judgment and logistics, and ships them to somebody who needs them working by Tuesday.
CDW Corporation is the largest such company in North American information technology. In fiscal 2025, it recorded net sales of $22.4 billion and gross profit of $4.87 billion, serving more than 250,000 business, government, education, and healthcare customers across the United States, the United Kingdom, and Canada with roughly 14,800 employees — whom the company designates as "coworkers."1 It carries more than 100,000 products and services from over 1,000 vendor partners, and in 2025 it generated more than $2.0 billion of net sales from each of its three largest vendors alone.1 Two North American distribution centers and one in the UK, together exceeding a million square feet, moved roughly 22 million units.1
And it started with a used computer and a three-dollar want ad.
In the early 1980s, Michael Krasny — a University of Illinois graduate who had been selling used cars at his father's Chicago Toyota dealership — placed a classified advertisement in the Chicago Tribune offering an IBM PC with 512K of memory, a color monitor, software, and two disk drives for $1,500 or best offer.2 He sold it to the first caller. The second caller asked whether Krasny would set up a system for him too, and offered to pay for the privilege. That second phone call established the core business model: the hardware was a commodity; the willingness to make it work was not.
This is the story of what happened next, and it is stranger than the origin myth suggests. CDW went public in 1993, crossed a billion dollars in sales by the mid-1990s, and built the most profitable direct-marketing operation in American technology.2 Then in October 2007 it was taken private in a $7.3 billion leveraged buyout by Madison Dearborn Partners and Providence Equity Partners — a deal that closed near the peak of the credit cycle and that, within fourteen months, forced the company to write off $1.7 billion of goodwill.3 It survived, returned to the Nasdaq in 2013 at $17.00 a share, and spent the following decade expanding from box-mover to solutions integrator, culminating in the $2.5 billion all-cash purchase of Sirius Computer Solutions in December 2021.45
The episode ahead runs through five acts: the catalog era and the "Circle of Service" philosophy that still shapes how CDW pays its salespeople; the 1993 listing and the creation of the government and education business; the buyout and near-death experience; the rebuild under Christine Leahy; and the current, unresolved question of what this company is worth when the products it resells increasingly arrive as cloud consumption rather than cardboard boxes.
That last question is the primary tension. CDW's central argument is that IT complexity works in its favor — that as technology stacks fragment across on-premises hardware, public cloud, edge inference, and security tooling, mid-market IT departments cannot manage dozens of vendor relationships alone, making the orchestrator in the middle more valuable over time. The counter-argument is that structural disintermediation threatens the middle: hyperscaler marketplaces allow customers to procure third-party software directly against their cloud commitments, original equipment manufacturers continue to enhance their direct sales portals, and revenue-recognition accounting rules mean that every dollar of business shifting from hardware to cloud shrinks reported sales even when it yields higher profit margins per unit of effort.
Both claims have evidence. The job of the next twelve sections is to weigh them.
 Subscribe on LinkedIn
II. The Michael Krasny Origin Story & Direct Sales Model (1982–1993)
Following his initial classified ad, Michael Krasny expanded his sourcing in a suburban Chicago basement in the mid-1980s. He discovered a local outfit called PC Network that assembled computers and offered to build machines for him at $20 apiece, which he could resell for $400.6 Looking at the arithmetic, Krasny realized he could assemble systems himself and began buying components wholesale.
The insight that established CDW was not merely selling hardware cheaply, but exploiting bloated retail markups. Where a local Chicago competitor charged roughly $300 in markup per machine, Krasny charged about $25.2 In traditional retail, a twelve-fold reduction in unit margin threatens solvency. In direct marketing—where aggressive pricing drives customer acquisition—that low margin served as a self-funding growth engine. By the early 1990s, roughly 80% of CDW's sales came from repeat customers, indicating that while low prices attracted initial buyers, service retained them.2
Krasny formalized that service layer as the "Circle of Service"—a doctrine holding that taking care of coworkers leads to satisfied customers, which generates sales volume and scale, ultimately rewarding owners. While the concept mirrors standard corporate messaging, Krasny executed it literally. "I cared more about my coworkers than I did about my customers," he noted years later. "And I cared more about my coworkers than I cared about our profitability."6 When establishing his charitable foundation in 1993, he named it the Circle of Service Foundation.7
Operationally, this philosophy manifested in a distinct compensation model: CDW paid account managers on gross profit rather than total revenue. Under this structure, selling a low-margin box generated zero commission, whereas solving a complex technical requirement at a fair margin rewarded the salesperson. To align incentives further, every coworker received annual stock options.7 That workplace culture led Fortune to name CDW one of the 100 Best Companies to Work for in America for six consecutive years in the early 2000s.7 Structurally, commission on gross profit created a dual operational benefit: it incentivized the sales force to protect margins against price erosion and automatically converted a major component of operating costs into a variable expense during market slowdowns—a structural feature that continues to cushion cash flow during downturns.
Growth accelerated rapidly. Krasny placed his first national advertisement in PC World in late 1985, driving an immediate surge in order volume.6 Net sales reached approximately $60 million by 1989, surpassed $100 million with $3.7 million in net income by 1991, and reached $176 million in 1992.2 In 1993, Krasny took the business public as CDW Computer Centers at $6.25 per share; within two years, the stock traded above $60.2 Revenues expanded to $413 million in 1994 and $629 million in 1995.2
Testing the moat: was low-cost direct selling actually defensible?
The company's early trajectory often invites narrative exaggeration, specifically the claim that a $25 markup created an unassailable pricing moat. Historical performance points to a different mechanism.
Direct-mail catalog distribution in the late 1980s and early 1990s lacked structural defensibility. Resellers possessed no exclusive territories, no long-term vendor exclusivity, and no proprietary products. When original equipment manufacturers expanded direct enterprise sales or compressed channel margins, resellers absorbed the margin hit directly. CDW's defense was not pricing power, but working-capital velocity. By 2003, the company was turning inventory more than 24 times annually, collecting receivables in roughly 35 days, and fulfilling approximately 36,000 orders daily from a single facility in Vernon Hills, Illinois—all while maintaining zero debt and holding over $560 million in cash and marketable securities.7 A business turning its working capital two dozen times a year operates comfortably on thin margins that would bankrupt slower rivals. That efficiency represented an operating advantage rather than pricing power.
Consequently, CDW's historical competitive advantage is best understood as a low cost-to-serve engine backed by working-capital discipline and gross-profit sales incentives, rather than true pricing power. That operating model successfully supported its catalog phase and remains relevant to evaluating its current business model.
By the mid-1990s, that working-capital machine provided the foundation for CDW to expand beyond direct catalog sales.
III. Public Expansion, E-Commerce, and Segment Specialization (1993–2007)
The 1990s presented CDW with an operational challenge: incoming order volume was growing faster than sales representatives could answer the phones.
The solution came in the mid-1990s with the launch of CDW.com, accompanied by a strategic decision not to replace sales representatives with digital automation. Rather than pursuing an all-digital dot-com transformation, CDW positioned its website as a configuration and order-entry tool designed to support human sales relationships. As late as 2000, internet transactions represented only about 12% of revenue.2 That hybrid strategy enabled steady scaling without sacrificing customer relationships: annual sales crossed $1.9 billion by 1999 and reached $3.96 billion by 2001, supported by a sales force that expanded past 1,200 people by 2002.2
The company's second major structural shift was customer segmentation. Rather than serving all clients through an undifferentiated sales organization, CDW established specialized divisions around specific end-markets. Most prominent was CDW Government (CDW-G), dedicated to federal, state, local, K-12, higher education, and public healthcare accounts. Public-sector procurement follows distinct mechanics—formal contract vehicles, competitive bidding, fiscal-year-end spending rushes, and specialized federal funding streams such as the E-Rate program for schools and libraries. Navigating those requirements demanded specialized sales coverage, which also provided a strategic side benefit: a diversified customer portfolio whose purchasing cycles did not all move in lockstep.
Buying capability, not just customers
During this period, CDW established an acquisition strategy that would guide its future expansion.
The initial phase focused on pure volume. In September 2003, CDW purchased select U.S. assets and the Canadian operations of Micro Warehouse, a reseller of computers and peripherals, adding 413 account managers to its sales force. Transaction and integration expenses totaled $22.3 million and reduced earnings by $0.16 per share that year.7 As a customer-list and sales-headcount expansion, the deal delivered immediate scale: net sales rose from $4.26 billion in 2002 to $4.66 billion in 2003, generating $175.2 million in net income and a 17.8% return on shareholders' equity on a debt-free balance sheet.7
The second deal represented a different model. In September 2006, CDW agreed to acquire Berbee Information Networks, a Madison, Wisconsin-based IT reseller founded in a basement thirteen years earlier, for $175 million in cash.8 Berbee generated approximately $390 million in annual revenue and employed more than 700 workers, including about 300 billable engineers—compared to CDW's existing bench of 250 technology specialists.8 In a single transaction, CDW more than doubled its technical engineering capacity.
That transaction established a precedent for CDW's long-term M&A strategy: acquiring technical expertise rather than chasing sales volume alone. By purchasing certified engineers and integrating them into existing customer relationships, CDW expanded beyond hardware sales into IT architecture design and higher-margin services. Berbee marked the pivot point in CDW's transition from catalog reseller to solutions integrator.
Testing the moat: is public-sector revenue actually defensive?
A common premise regarding CDW-G is that public-sector contracts provide a sticky, high-margin, and recession-proof revenue base. Historical results, however, challenge the stronger versions of that claim.
Public IT budgets remain subject to political shifts, spending freezes, and contract re-biddings. During the 2001–2002 technology downturn, federal and state spending contracted sharply while procurement timelines lengthened and competitors fought aggressively over contract allocations. Similar pressures reemerged in the fourth quarter of 2025, when a record forty-three-day federal government shutdown suppressed CDW's federal sales and created spillover effects for healthcare and education clients dependent on federal funding.9 Segment margins also exhibit volatility: in the second quarter of 2026, government net sales grew roughly 14% year over year while government gross profit fell 2.7%, as segment gross margin dropped from 22.5% to 19.3%.10 Top-line growth accompanied by declining gross profit does not reflect defensive stability.
A more defensible view is that public-sector exposure provides non-correlated timing rather than true counter-cyclical protection. Because public procurement is tied to legislative appropriations rather than corporate capital expenditure cycles, its timing often diverges from commercial IT spending. That divergence helps smooth overall revenue streams, even if it does not protect gross margins against political or competitive pressure.
By 2006, CDW generated $6.3 billion in annual sales with 4,500 employees and zero debt, while its founder had led the business for over two decades.8 That operational scale and clean balance sheet attracted private equity suitors.
IV. The $7.3B LBO Drama & Private Equity Survival (2007–2013)
On October 12, 2007, CDW Corporation ceased to be a public company. An entity controlled by investment funds affiliated with Madison Dearborn Partners and Providence Equity Partners acquired it in a merger transaction valued at approximately $7.3 billion.3 Michael Krasny, who had built the company from that classified ad, retired that year.11
The financing was the story. In connection with the acquisition, CDW entered into arrangements of which $4.64 billion was funded at closing.3 The purchase price allocation created $2.32 billion of identifiable intangible assets — customer relationships, trade names, internally developed software — to be amortized over five to twenty years, plus a large slug of goodwill.3 Transaction-related costs consumed $144.4 million before the closing and another $26.7 million after it.3
Consider what this did to a business that had spent twenty-three years carrying no debt at all. In 2006, CDW's balance sheet held zero borrowings and over half a billion dollars of cash.7 Ten months later it carried billions in leveraged loans and high-yield notes, against a business whose gross margin ran in the mid-teens and whose customers could stop buying computers whenever they felt uncertain.
They felt uncertain almost immediately.
The reckoning
Net sales in 2008 reached $8.07 billion — respectable on the surface. Underneath, the company recorded a goodwill impairment charge of $1.712 billion, producing a loss from operations of $1.39 billion for the year.3 In 2009 it took another $241.8 million of goodwill impairment, net sales fell 11.3% to $7.16 billion, and CDW posted a net loss of $373.4 million.34 Interest expense, net, ran $390.3 million in 2008, $431.7 million in 2009, and $391.9 million in 2010.3
Sit with those interest numbers for a moment. In 2009, CDW generated $1.13 billion of gross profit and paid out $431.7 million in interest — thirty-eight cents of every gross-profit dollar went to lenders before a single salesperson, warehouse worker, or engineer was paid.4 Operating cash flow that year was $107.6 million against total debt of $4.62 billion, and shareholders' equity was negative.4 Earnings available for fixed charges fell short of fixed charges by $461.2 million in 2009 and $37.0 million in 2010.4 This was not a company comfortably managing leverage. It was a company that had to be right about cash collection every single quarter.
To its considerable credit, it was. Management cut advertising expense from $141.3 million in 2008 to $101.9 million in 2009, held selling and administrative expenses down, and pushed the commission system's gross-profit orientation hard.3 Net sales rebounded to $8.80 billion in 2010 and $9.60 billion in 2011.4 Debt came down steadily — $4.62 billion at the end of 2009 to $4.29 billion, then $4.07 billion, then $3.77 billion, then $3.25 billion by the end of 2013 — though the deleveraging came at a price: net losses on debt extinguishment of $118.9 million in 2011, $17.2 million in 2012, and $64.0 million in 2013.4 Refinancing out of expensive paper is not free.
The way out
Shares priced at $17.00 on June 26, 2013, at the low end of a revised range, and began trading on the Nasdaq Global Select Market the following day; the offering of 23,250,000 shares completed on July 2, with underwriters exercising a 3,487,500-share overallotment in full later that month.4 Combined net proceeds to the company were $424.7 million after $29.8 million of underwriting discounts, expenses, and transaction costs, and CDW recorded $75.0 million of offering-related expenses in 2013.4
Where the money went is the tell. CDW paid a $24.4 million termination fee to affiliates of the two sponsors to end their management services agreement, then redeemed $175.0 million of senior secured notes due 2018 at 108.0% of principal and $146.0 million of senior subordinated notes due 2017 at 106.268%.4 In October it used the $56.0 million of overallotment proceeds plus cash to redeem a further $155.0 million of subordinated notes at 104.178%.4 Investors buying the IPO were, in the most literal sense, buying down the debt.
The sponsors did not exit quickly. Before the listing, Madison Dearborn owned 46.0% and Providence Equity 40.6% of the common stock; they still held 63.7% between them at the end of 2013.124 Only through a sequence of secondary offerings did they work down to 4.9% and 4.3% respectively by December 31, 2015 — a holding period of roughly eight years, well beyond the conventional private-equity window.12
Testing the claim: did leverage instill discipline, or destroy optionality?
The flattering interpretation is that private equity taught CDW rigor — that the covenant pressure of 2008 to 2011 forged the gross-profit-dollar focus and working-capital religion that define the company today. There is something to this. Gross profit margin rose from 15.8% in 2009 to 16.3% by 2013 while the company was simultaneously starving itself of capital.4
But the company's own numbers reject the strong version. Capital expenditures ran $15.6 million in 2009 and $41.5 million in 2010 — for a business with nearly $9 billion of sales.4 Free cash flow was consumed almost entirely by interest. Those were precisely the years in which public cloud infrastructure moved from curiosity to mainstream and in which cloud-native managed service providers established themselves. CDW was not in a position to make a large strategic bet on anything. It could not have bought a cloud practice in 2010 even if it had wanted to; it was busy redeeming subordinated notes at a six-point premium.
And the discipline was not permanent, which is the part that matters for a modern investor. The very same balance sheet was re-levered in 2021 to buy Sirius, taking net leverage back to roughly 3.3 times at close.5 The lesson CDW learned from the buyout was how to manage leverage skillfully, not how to avoid it.
The calibrated verdict: leverage did not create CDW's operating discipline — the gross-profit commission structure predates the buyout by two decades.7 What leverage did was remove strategic optionality during a technology inflection, and the accumulated goodwill impairments still sitting on the books, $1.57 billion against the Corporate segment and $354 million against Public, remain a permanent scar from a single mistimed transaction.1
CDW came back to the public market smaller in ambition than it had been in 2006 and far more disciplined. What it needed next was a strategy for the decade after hardware.
V. Modern Leadership, Capital Allocation & Current Executive Team
Christine Leahy did not arrive at CDW as a technologist. She arrived as a lawyer.
A graduate of Brown University with a J.D. from Boston College Law School, Leahy was a corporate partner at Sidley Austin in Chicago when CDW hired her in 2002 as its first general counsel. She later ran the international business, served as chief revenue officer from July 2017 through December 2018, became chief executive in January 2019, and added the chairmanship in January 2023.
The lawyer's background shows in how the company communicates. CDW's earnings calls are structurally repetitive to an almost liturgical degree: three drivers of performance, every quarter, in the same order — diversity of customer end markets, breadth of the full-stack portfolio, execution of the growth strategy.1314 Analysts sometimes find this frustrating. For an investor tracking narrative consistency, it is useful: when the framework is fixed, changes in the language stand out.
The other half of the executive story is ending. Albert Miralles, who joined as chief financial officer in September 2021 from CNA Financial, notified the company on August 3, 2026 of his intention to retire, and CDW announced it two days later alongside second-quarter results. He will remain in the role until a successor is appointed and then continue in an advisory capacity; on the August call, Leahy called him "a driving force behind the growth and evolution of our company."13 Miralles opened his own remarks by noting it had been "a privilege to serve as CFO of CDW for the last 5 years."13 A CFO transition at a company whose entire investment case rests on working-capital management and expense leverage is a genuine execution risk, and the search was still underway as of the August call.13
What the pay plan actually rewards
The 2026 proxy is more revealing than the earnings calls, and it contradicts a piece of received wisdom about CDW.
Short-term incentives run through the Senior Management Incentive Plan, weighted principally on non-GAAP operating income with a 25% strategic-objectives component introduced for 2025 and a performance modifier of plus or minus 15%.15 For 2025, the non-GAAP operating income target was $1,989.0 million; the company delivered $1,988.2 million for incentive purposes — 99.95% of target — and the committee approved 101.17% on the strategic component, producing a blended payout of 100.12%.15 Long-term incentives shifted in 2025 to 60% performance share units and 40% restricted stock units, with stock options eliminated entirely.15
The plan does bite. The 2023 performance share units vested at 70.8% of target — a direct financial consequence of the hardware slump that ran through 2023 and 2024.15 Leahy's target total direct compensation was $15.0 million for 2025, of which roughly 93% was variable.15
Now the correction. It is frequently asserted that CDW management holds substantial equity. The filings say otherwise. As of March 1, 2026, all directors and executive officers as a group beneficially owned 1,050,712 shares against 128,707,881 shares outstanding — under 1%, and that figure includes 694,654 shares subject to currently exercisable options and 122,402 vested or near-vested restricted stock units.15 Leahy's own 617,938 shares include 468,542 option shares.15 The Vanguard Group reported 13.08% and BlackRock 8.46%.15 This is a professionally managed, institutionally owned company, not a founder-aligned one. Insiders are aligned through annual compensation mechanics, which is a weaker and more short-cycle form of alignment than ownership.
Governance carries some friction too. Approximately 91% of votes cast approved executive compensation at the 2025 annual meeting — passing, but below the 95%-plus that typically signals full investor comfort.15 A shareholder proposal to give holders the right to act by written consent won 51% support at that same meeting, and a separate proposal for an independent board chairman appeared on the 2026 ballot, with the proponent explicitly citing the stock's decline from around $263 in 2024 to roughly $140 in late 2025.15 The board recommended against it. Leahy holds both the chair and chief executive roles.
Capital allocation, as practiced rather than as advertised
The stated priority stack is dividend first, capital structure second, mergers and acquisitions third, buybacks fourth. Through 2025 CDW increased its dividend for a twelfth consecutive year, raising it 1% to $2.52 annually, and targets a payout of roughly 25% of non-GAAP net income.9 Net leverage finished 2025 at 2.4 times against a stated range of two to three times.9
But the practice has drifted from the advertisement in an important way. CDW entered 2025 targeting a return of 50% to 75% of adjusted free cash flow to shareholders and finished at roughly 90%, returning close to $1 billion — repurchasing 4.0 million shares for $653 million and paying the balance in dividends.19 The pace accelerated further: $545 million of repurchases in the first half of 2026 alone, including $344 million in the second quarter, against $500 million in each full year of 2023 and 2024, with a fresh $1 billion authorization added in the second quarter and more than $1.1 billion of remaining capacity.13
Buying back stock at $140 that the market valued at $263 two years earlier may prove to be excellent capital allocation. But it is worth naming what is happening: an acceleration of repurchases beyond the stated framework, funded partly by working-capital swings, at a company that also says it remains "active in the M&A market."13 Management has been explicit that the buyback is opportunistic and valuation-driven, which is a defensible reason to exceed a target — but it is still an exceeded target.
Testing management credibility: the guidance record
The most instructive evidence is the 2023–2024 slump. Through that period CDW repeatedly signaled that corporate hardware demand was stabilizing, and it repeatedly was not. The cleanest admission came on the third-quarter 2024 call, when Leahy said flatly that "the firmer footing we anticipated for our corporate channel did not materialize," while Miralles noted results were below original expectations of low single-digit growth.16 Full-year 2023 net sales fell 10.0% to $21.38 billion.17
Two things are true about that record. The first is that management was wrong about the timing of a hardware recovery for the better part of two years, which is a genuine mark against forecasting ability. The second is that they said so, in plain language, rather than blaming the weather — and the compensation plan penalized them for it through the 2023 performance share units.15
The more recent behavior points the other way. Entering 2026, management guided to a U.S. IT market growing in the low single digits, gross profit growth in the low single digits, and mid-single-digit non-GAAP earnings per share growth.9 They held that view in May.14 By August they had raised it: mid-single-digit market growth, mid-single-digit gross profit growth, and earnings per share growth "at the high end of high single-digit range."13 Guiding conservatively and raising twice is the opposite failure mode from 2023–2024, and the reasonable conclusion is that management recalibrated after being burned rather than that they have acquired forecasting skill.
The claim that survives is modest and worth holding: CDW's management executes well operationally and communicates misses honestly, but has demonstrated no ability to forecast hardware demand more than a quarter or two out, and investors should discount forward guidance accordingly. The event that would falsify the improved read is another sequence of maintained-then-cut full-year outlooks.
VI. M&A Strategy & The $2.5B Sirius Computer Solutions Transformation (2015–Present)
If CDW's acquisition strategy has a signature, it is that the company almost always buys technical capability rather than pure revenue scale.
The international expansion began prudently. On November 10, 2014, CDW acquired a 35% non-controlling interest in Kelway TopCo Limited, a UK-based IT solutions provider with supply-chain relationships spanning more than 80 countries.12 On August 1, 2015, it purchased the remaining 65% stake to take full control. Total consideration reached $499.7 million—comprising $291.6 million in cash, $33.2 million in CDW common stock (1.6 million shares under a three-year lockup), and $174.9 million representing the fair value of the initial holding, which yielded a $98.1 million accounting gain upon remeasurement.12 CDW also assumed $111.5 million of Kelway debt and recorded $305.2 million in goodwill.12
This phased structure offered a clear risk-management advantage: testing international operations through a minority partnership for nine months before taking control reduced execution risk compared to a full upfront buyout. Financially, however, the remeasurement produced a non-operating paper gain that elevated reported 2015 earnings without adding cash flow.
Targeted acquisitions continued across key capabilities. CDW entered Canada by acquiring Scalar Decisions in February 2019, followed by security provider Focal Point Data Risk in 2021, both on undisclosed terms. Cloud-native expertise arrived with Mission Cloud Services on November 27, 2024, for a base purchase price of $330 million—allocating $220 million to goodwill and $137 million to intangible assets, primarily customer relationships.1 In the fourth quarter of 2025, CDW bought select assets of Lexicon Tech Solutions to expand device lifecycle capabilities for education clients.9
Across each transaction, the underlying strategy remained consistent: acquiring specialized technical skills to cross-sell into CDW's existing base of over 250,000 corporate and public-sector accounts.
Sirius: the biggest bet
Then came the exception in scale, if not in strategic logic.
On October 18, 2021, CDW announced an agreement to acquire Sirius Computer Solutions for $2.5 billion in cash—a transaction valued at 10.4 times estimated 2021 adjusted EBITDA, excluding cost synergies.5 The deal closed on December 1, 2021.18
Sirius differed fundamentally from CDW's traditional catalog reseller model. Founded in 1980 as a major IT solutions integrator, Sirius generated $2.04 billion in 2020 net sales at a 28.2% gross margin—more than ten percentage points above CDW's 17.4% baseline—and delivered $195 million in non-GAAP operating income, representing a 9.6% margin.5 The transaction added roughly 2,600 coworkers, 3,900 clients, 40 offices, and over 5,500 sales and technical certifications.5 Crucially, software and services generated approximately 64% of Sirius's gross profit, compared to 40% for CDW.5
In strategic terms, CDW was acquiring high-margin software and services revenue to reshape a portfolio historically dominated by lower-margin hardware.
The projected financial impact was immediate. Management targeted a combined gross margin expansion from 17.4% to 18.5%, a 20-basis-point increase in non-GAAP operating margin, and a $0.62 accretion to 2020 pro-forma non-GAAP diluted earnings per share.5 Services net sales were set to expand roughly 45%, from $0.9 billion to $1.3 billion, while technical staff grew from 3,200 to 4,700 coworkers.5 To finance the transaction, net leverage jumped to approximately 3.3 times EBITDA at closing, prompting management to pause share repurchases and additional M&A until leverage returned to its 2.5 to 3.0 times target range by late 2022.5
Testing the claim: did Sirius make CDW cycle-proof?
The core investment thesis behind Sirius held that shifting toward services would insulate CDW from cyclical downturns in hardware demand. Five years after the deal, empirical results present a mixed picture.
On execution mechanics, management delivered. Consolidated gross margin expanded to 21.7% in 2025, compared to the 17.4% pre-acquisition baseline.15 Non-GAAP diluted earnings per share exceeded $10 for the first time in 2025, reaching $10.02.9 Net leverage also declined as planned, ending 2025 at 2.4 times.9
However, GAAP financial metrics highlight the ongoing impact of hardware cycles. GAAP net income declined for three consecutive years, falling from $1,104.3 million in 2023 to $1,077.8 million in 2024, and $1,066.6 million in 2025.171 Operating income remained flat across 2024 and 2025 at $1,651.3 million and $1,655.6 million, respectively.1 Meanwhile, net interest expense rose to $227.4 million in 2025 from $214.5 million in 2024.1 The growth in reported non-GAAP earnings per share was heavily supported by share buybacks—which reduced weighted average diluted shares from 135.2 million in 2024 to 132.1 million in 2025—and by significant add-backs, primarily the amortization of intangible assets created by the Sirius and Kelway acquisitions.1
This divergence creates two distinct interpretations of performance. Viewed through non-GAAP earnings per share, CDW appears to be compounding earnings steadily through a hardware slowdown. Viewed through GAAP net income, net earnings have drifted lower for three straight years, while $4.66 billion in goodwill and $1.19 billion in intangible assets weigh on a balance sheet with negative tangible book value.1
Furthermore, part of the reported gross margin expansion reflects revenue accounting rules rather than pure pricing power. Under net revenue recognition, cloud and software agency fees record gross profit against a smaller top-line revenue denominator, mathematically raising gross margin percentage without altering underlying cash generation. CFO Albert Miralles noted that netted-down transactions represented 35.9% of gross profit in the second quarter of 2026, up 300 basis points year-over-year.13
Ultimately, Sirius broadened CDW's technical capabilities and structurally lifted gross margin, but it did not eliminate hardware cyclicality. In the second quarter of 2026, consolidated gross margin fell 70 basis points year-over-year to 20.1% as lower-margin enterprise hardware infrastructure orders—specifically AI-readiness deployments—outpaced higher-margin services.1013 Services net sales grew just 1% in the quarter, with Miralles citing a lower relative contribution from services as a primary margin drag.13 Five years after its largest acquisition, CDW's overall profitability remains tied to client hardware spending cycles.
VII. Segment Economics, Product Mix & Revenue Engine
To understand how CDW generates earnings, it helps to examine its business as distinct sales organizations sharing a unified warehouse network, balance sheet, and vendor distribution agreements.
Under the reporting structure in place for fiscal 2025, the Corporate segment—serving U.S. private-sector businesses with over 250 employees—generated $9.44 billion in net sales, accounting for 42.1% of total revenue at a 23.3% gross margin.1 Small Business, covering companies under 250 employees, produced $1.73 billion at a 22.8% gross margin and grew 13.3%, making it the fastest-growing U.S. channel.1 The Public segment brought in $8.54 billion at a 20.2% gross margin, divided among Government at $2.59 billion, Education at $3.11 billion, and Healthcare at $2.84 billion.1 International operations in the UK and Canada, reported together under "Other," contributed $2.72 billion.1
Effective January 1, 2026, CDW restructured these reportable segments into three primary units: Commercial, Government, and Education. Under this new structure, Commercial encompasses corporate, financial services, and healthcare clients, while small business customers are distributed across channels rather than tracked separately.1 Investors should evaluate this reorganization cautiously. Dissolving a fast-growing standalone segment like Small Business into broader buckets reduces external visibility into unit performance regardless of internal operational logic. In the first half of 2026, the newly configured segments generated $7.53 billion in Commercial, $1.48 billion in Government, $1.61 billion in Education, and $1.63 billion in Other.10
The two-column income statement hiding inside one
The distinction between principal and agent accounting is central to evaluating CDW's reported revenue trends.
When CDW sells physical hardware like a laptop, it purchases, takes title to, ships, and invoices the equipment. Under standard accounting rules, CDW acts as a principal, meaning total gross sales flow through revenue and equipment procurement costs flow through cost of sales. Selling a $1,000 laptop at a $150 markup generates $1,000 in reported net sales and $150 in gross profit—a 15% gross margin.
When CDW sells a cloud consumption commitment or a software-as-a-service subscription, it takes no physical possession. Instead, it brokers the transaction between the customer and the vendor. Under accounting rules, CDW acts as an agent, recognizing only its fee as top-line revenue. Brokering $1,000 of cloud consumption for a $150 fee yields $150 in reported net sales and $150 in gross profit—a 100% gross margin.
The economic profit is identical, but the reported top-line revenue is radically different.
CDW designates this agency model as netted-down revenue, and it represents an increasingly critical operational metric. Netted-down transactions accounted for 36.1% of gross profit in the fourth quarter of 2025 and 35.9% in the second quarter of 2026, expanding 16.1% year-over-year.913 Consequently, more than a third of CDW's gross profit stems from high-margin agency arrangements that contribute minimally to reported net sales. During periods when cloud and software demand expands while hardware spending contracts—as occurred throughout 2023 and 2024—net sales can decline even as gross profit increases, mathematically understating business growth for investors screening primarily on top-line revenue.
On a gross sales basis, CDW's 2025 product mix comprised 71.6% hardware ($16.07 billion), 18.7% software ($4.20 billion), and 9.1% services ($2.04 billion).1 Within hardware, notebooks and mobile devices represented $5.64 billion—a quarter of total net sales—followed by network communications at $2.69 billion, data storage and servers at $2.15 billion, collaboration hardware at $1.76 billion, and desktop systems at $1.33 billion.1 Because software and services are partially netted down, these reported top-line percentages understate their actual contribution to gross profit.
The vendor rebate engine
The final component of CDW's revenue model is back-end vendor allowances. Agreements with original equipment manufacturers include product return privileges, price protection, purchase discounts, and incentive structures like volume sales rebates and cooperative advertising reimbursements.1 A substantial share of CDW's marketing expense is offset by these cooperative programs, which remain at vendor discretion and are typically contingent on achieving specific volume targets over defined periods.1 Reported segment gross profit explicitly includes allocations for volume rebates and cooperative advertising from vendors.10
Mechanically, this structure allows a high-volume reseller to price hardware at narrow front-end markups while securing healthy net returns when back-end rebates vest. Because vendor rebate tiers scale with volume, size compounds profitability. This dynamic forms CDW's primary structural cost advantage over smaller regional competitors.
However, vendor incentive payments represent the largest undisclosed financial variable in CDW's business model. The company does not break out rebates or market development funds as discrete line items in public financial statements. SEC filings highlight the operational vulnerability: vendor contracts are largely short-term and terminable on short notice, and management explicitly notes that any reduction in vendor funding or failure to adapt to modified terms could adversely affect operating performance.1 Investors are left relying on an unquantified profit driver governed by agreements subject to modification by hardware OEMs that are actively expanding their own direct enterprise sales channels.
This structural arrangement does not negate CDW's operating scale, but it demonstrates that vendor relationship dynamics represent an ongoing strategic risk rather than an unassailable competitive moat.
VIII. Competitive Landscape, Porter's 5 Forces, & Helmer's 7 Powers
Line CDW up against its listed peers and something jumps out immediately — and it is not gross margin.
In fiscal 2025, Insight Enterprises generated $8.25 billion of net sales at a 21.4% gross margin, while CDW generated $22.4 billion at 21.7%.191 Connection posted $2.87 billion at an 18.8% gross margin.20 ePlus, in its fiscal year ended March 2026, delivered $2.44 billion at 24.1% — the highest of the peer group, reflecting a services-heavy product mix.[^21] On the top-line margin metric investors instinctively check, CDW appears unremarkable.
The operational distinction emerges one line down. Of every gross-profit dollar, CDW spent roughly 66 cents on selling and administrative expenses in 2025, yielding an operating margin of 7.4%.1 Insight spent about 79 cents per gross-profit dollar, producing a 4.6% operating margin.19 Connection spent about 78 cents, resulting in a 3.6% operating margin.20 ePlus spent about 72 cents, generating a 6.8% operating margin.[^21]
That gap — a twelve- to thirteen-percentage-point advantage in gross-profit conversion over its two largest listed comparables — represents the empirical proof of CDW's scale engine. The company does not necessarily procure hardware cheaper or price it higher; rather, it distributes the fixed overhead of distribution centers, IT infrastructure, marketing programs, credit management, and technical specialists across two and a half times as much gross profit as its nearest listed competitor. For private rivals like SHI International and World Wide Technology, comparable operating data is not publicly disclosed.
Porter's five forces, war-gamed
Threat of new entrants: low. Replicating CDW requires extensive distribution logistics, top-tier vendor authorizations, commercial credit facilities, and multi-decade client relationships. CDW holds top-level certifications from Broadcom, Cisco, Dell Technologies, Hewlett Packard Enterprise, IBM, Lenovo, Microsoft, NetApp, Nutanix, Palo Alto Networks, and Samsung.1 These authorizations reflect earned scale rather than capital purchase.
Bargaining power of suppliers: moderate to high, and rising. Three vendors each accounted for more than $2.0 billion of net sales in 2025.1 Channel distribution agreements remain short-term and terminable on short notice.1 The structural counterweight is that CDW provides vendors efficient access to over 250,000 fragmented corporate and public-sector accounts.1 Nevertheless, supplier concentration means CDW depends more on major original equipment manufacturers than any single vendor depends on CDW.
Bargaining power of buyers: low individually, moderate in aggregate. No single client represents material revenue concentration. However, enterprise and public procurement is routinely subject to competitive bidding, as demonstrated in the second quarter of 2026 when public-sector gross margin compressed under competitive volume pricing.10
Threat of substitutes: moderate to high, representing a primary structural risk. Hyperscaler marketplaces allow enterprise customers to apply third-party software purchases directly against public cloud spending commitments, bypassing traditional reseller channels. CDW explicitly lists hyperscaler marketplaces and OEM direct-sales initiatives as primary competitive threats in its financial filings.1
Rivalry: high. Industry competition intensifies during spending pullbacks. During the 2024 hardware slump, management highlighted maintaining margin discipline while competitors pursued sales at uneconomic terms — an indicator of price competition in core commodity categories.16
Helmer's seven powers, honestly scored
Scale economies: present, and the core structural advantage. The gross-profit conversion gap relative to peers provides direct, quantitative evidence of operating leverage in distribution overhead.
Switching costs: present but moderate. Switching friction stems from operational integration rather than binding contracts: customized device imaging, asset tagging, consolidated multi-vendor billing, software lifecycle management, and trade credit lines. Additionally, over 50% of CDW's U.S. net sales originate from account managers with more than seven years of tenure.1 Decades of institutional familiarity create customer retention, though that relational capital resides partly in individual personnel.
Cornered resource: absent. CDW owns no proprietary technical IP of scale, and its vendor certifications are non-exclusive.
Counter-positioning: absent. Cloud marketplaces counter-position against traditional IT distribution by eliminating physical intermediation.
Branding, network economies, process power: not materially present. While recognized among enterprise procurement teams, CDW's brand does not drive pricing premiums over equivalent distribution channels.
CDW's economic moat evaluates to one primary power in scale economies, a secondary power in operational switching costs, and an absence of the remaining five. It describes an efficiently executed distribution business rather than an unassailable tech monopoly.
Public markets have actively debated that distinction. As of late August 2026, CDW traded near $150 per share within a 52-week range of $97 to $172, evaluating the company at a market capitalization of approximately $19 billion.21 That valuation reflects ongoing market calibration between CDW's defensive scale efficiency and its exposure to hardware cycles and channel disintermediation.
IX. Investor Stress Test & Historical Falsification Pass
Put a skeptical long-short investor in the room, and three core arguments emerge first.
One: the accounting optical illusion cuts both ways. The netted-down revenue mechanism described earlier means that as workloads migrate from on-premises hardware to cloud consumption, reported net sales can stagnate while underlying economics improve—a standard bull case argument. The bear's rejoinder is more telling: that same mechanism renders CDW's reported revenue inconsistent across time, making a company whose top-line definition shifts with product mix harder to underwrite. It also means the impressive gross margin expansion narrative is driven partly by a shrinking revenue denominator rather than expanding pricing power. Both perspectives stem from the same accounting rule, though bulls rarely emphasize the trade-off.
Two: vendor rebate compression represents an unhedgeable risk. If Cisco, Dell, HP, or Microsoft choose to protect their own margins during a downturn by trimming channel incentives, CDW absorbs the margin reduction immediately without an easy mechanism to pass it along. Because the total size of this back-end profit pool is undisclosed, investors cannot accurately model its earnings sensitivity. It stands as the clearest example in the business of a material operational risk obscured from public filings.
Three: the device refresh cycle may be a narrative rather than a structural catalyst. Bullish projections have relied for two years on an aging pandemic-era PC fleet and the end of Windows 10 support to trigger a commercial hardware refresh. Second-quarter 2026 data offered surface support—notebooks and desktops grew a combined 10% year over year, with Leahy noting customers were "willing to make the mission-critical investments, notwithstanding the pricing."13 Yet the same quarter exposed the underlying dynamic: higher average selling prices more than offset lower unit volume.13 Revenue growth driven by memory price inflation rather than unit volume is an inflation pass-through that reverses when component prices drop, not a durable volume refresh cycle.
Falsifying the moat: what CDW's own record shows
Supply chain constraints limit revenue control. CDW cannot monetize equipment vendors fail to ship, which has repeatedly capped revenue conversion. The company entered the second half of 2026 with written orders outpacing invoicing and backlog "significantly elevated." While Miralles characterized the operating environment as "more normalized" than earlier in the year, he conceded that "the backlog does reflect that there are still delays in product delivery."13 A distributor whose top-line timing remains gated by OEM factory output does not fully control its revenue recognition.
Gross margin lacks a floor when product mix shifts. The second-quarter 2026 financial report provided a clear test of this vulnerability. Net sales rose 10.0% to $6.57 billion and gross profit rose 6.3% to $1.32 billion, but gross margin contracted by 70 basis points to 20.1%, while GAAP operating income grew just 2.0% to $428.6 million.2210 Asked directly by Morgan Stanley analyst Erik Woodring whether CDW faced like-for-like pricing pressure, Miralles replied that pricing remained steady and attributed the entire margin drop to mix—specifically higher growth in enterprise infrastructure products and large-volume corporate orders.13 That explanation is credible, but it highlights the structural risk: CDW does not control its product mix; its clients do.
Free cash flow conversion is not guaranteed. CDW targets converting 80% to 90% of non-GAAP net income into adjusted free cash flow, delivering an 82% conversion rate in fiscal 2025 with $1.09 billion in free cash.91 In the first half of 2026, however, conversion fell to 42% due to a $400 million inventory expansion since year-end.13 Management described this inventory build as a deliberate strategic decision to support clients in a supply-constrained market and indicated that cash conversion would normalize.13 While plausible, that capital tie-up also resembles standard working-capital strain, making second-half 2026 cash flows a critical test of management's claim.
Credit loss provisions are expanding. The allowance for credit losses expanded from $28.8 million at the start of 2024 to $47.4 million by year-end 2024, and reached $71.4 million at the end of 2025. Over the same period, non-recourse sales of customer receivables to third parties increased from $477 million to $569 million.1 While modest relative to CDW's $22 billion revenue base, both metrics warrant attention: offering trade credit is a key competitive tool for CDW, and rising credit provisions serve as an early indicator of mid-market corporate stress.
Downturn performance confirms hardware cyclicality. Across every major macroeconomic shock—in 2001, 2008–2009, 2020, and 2023—hardware spending contracted and CDW's financial results followed. The 10.0% decline in net sales in 2023 offers the most recent empirical proof.17 While gross-profit-based sales commissions reduce operating costs during downturns and preserve positive net income, they cushion operational hits rather than eliminate cyclical exposure.
Taken together, CDW's competitive moat survives in a qualified form. The company maintains a genuine cost-to-serve efficiency advantage, confirmed by superior operating margin conversion relative to direct peers, alongside moderate relationship-driven switching costs. However, it lacks pricing power, does not control its supply chain, cannot independently size its vendor rebate income, and remains subject to margin swings driven by client purchasing choices. CDW operates a highly efficient distribution business with structural advantages, but one exposed to numerous exogenous profit variables.
X. Playbook: Business & Investing Lessons
Forty-two years of history in a low-margin, high-velocity business yield several core lessons that extend well beyond technology distribution.
Lesson 1: In distribution, scale is the only durable advantage — and it shows up in operating expense, not gross margin. The instinct among investors is to search for scale in purchasing power. Yet CDW's gross margin sits within roughly three percentage points of every listed peer.11920[^21] The genuine advantage lives entirely in the operating expense line, where fixed distribution and operational infrastructure spread across a much larger gross-profit base converts twelve to thirteen more cents of every gross-profit dollar into operating income than its nearest listed comparables. Anyone evaluating a distribution business should look directly at operating expense as a percentage of gross profit rather than focusing on gross margin.
Lesson 2: Portfolio diversity smooths volume, not margin. CDW's five U.S. customer channels each generated $1.7 billion or more of net sales in 2025, supporting management's argument that end-market diversity helps cushion economic downturns.1 Empirical evidence supports that volume claim: in the second quarter of 2026, a 13.6% sales increase in government and a 22.9% rise in international operations offset a sluggish 0.7% growth rate in education.10 However, diversity does not protect margins: government gross profit actually fell during that same quarter.10 End-market diversification acts as a revenue stabilizer, not a profit stabilizer.
Lesson 3: Buy capability, not volume — and be honest about what it buys you. CDW's acquisition playbook repeatedly prioritizes specialized technical capabilities over raw revenue scale. Berbee doubled the technical bench.8 Kelway provided a European platform through a staged minority investment that reduced execution risk.12 Mission Cloud Services added cloud-native capabilities.1 Sirius brought a services organization with a gross-profit profile inverted from CDW's core hardware business.5 While this acquisition strategy successfully shifted the business higher up the technology value chain, five years and $2.5 billion later, it has not rendered earnings immune to macroeconomic cycles. Capability acquisitions buy technical relevance, not cyclical protection.
Lesson 4: Leverage does not teach discipline; it removes options. The 2007 buyout provides a clear historical case study. CDW's operational discipline predated the leveraged buyout by two decades, driven by a gross-profit sales commission structure established well before 2004.7 Rather than instilling rigor, financial leverage burdened the company with $431.7 million in annual interest expenses at the trough of the financial crisis, constraining capital expenditures to just $15.6 million in a year when sales approached $7.2 billion.4 CDW survived on its pre-existing cost discipline, while heavy debt service deprived it of strategic flexibility during a critical wave of cloud innovation.
Lesson 5: When accounting definitions shift, follow gross profit dollars and cash. The expansion of netted-down agency accounting makes top-line net sales an unreliable indicator of underlying business momentum. Viewing CDW through reported revenue makes the 2023 and 2024 downturn look like a structural collapse rather than a product mix shift alongside a hardware spending pullback. Evaluating performance requires tracking gross profit dollars, operating income, and free cash flow generation, treating reported top-line revenue primarily as a reflection of product mix.
A final lesson emerges from corporate governance: a structured executive incentive plan is no substitute for insider equity ownership. CDW's compensation framework enforces short-term operational accountability—93% of the chief executive's target pay is variable, the 2023 performance units vested at 70.8% following hardware headwinds, and the 2025 bonus paid essentially at target on a near-exact operating income result.15 Yet directors and officers together own under 1% of the company.15 Investors should view that setup as disciplined professional stewardship with annual accountability rather than deep founder alignment, and calibrate expectations for long-horizon risk-taking accordingly.
XI. Analysis & Bear vs. Bull Case
The bull case
The central argument for CDW rests not on proprietary technology, but on customer-side arithmetic.
A mid-market enterprise with 800 employees operating a hybrid IT environment may navigate fifty or more vendor relationships across endpoint hardware, servers, storage, networking, virtualization, identity, cybersecurity, cloud platforms, collaboration tools, and emerging AI applications. A mid-market organization cannot easily staff dedicated procurement, architecture, and lifecycle management across all of those domains. CDW positions itself as the vendor-agnostic orchestrator, describing its business as "vendor, technology, and consumption model unbiased," allowing it to advise customers independently rather than pushing a single manufacturer's product line.1
Financial results from mid-2026 provided the strongest operational validation for this model in three years. In the second quarter of 2026, net sales, gross profit, and non-GAAP earnings per share reached record levels, with non-GAAP diluted earnings per share rising 11.9% year-over-year to $2.91.13 Operating income outpaced gross profit growth for the first time in several quarters, a shift CFO Albert Miralles attributed to "good old-fashioned discipline around expenses" rather than early gains from the company's Geared for Growth cost-reduction initiative, whose benefits were projected to arrive in the second half of the year.13 Reflecting that cost control, non-GAAP selling and administrative expenses dropped to 57.9% of gross profit, down 410 basis points sequentially.13
That efficiency initiative target is sizable, calling for annual run-rate cost reductions of $100 million to $200 million across 2027 and 2028, alongside partial reinvestment.14 Against approximately $2.0 billion in baseline non-GAAP operating income, those savings represent a substantial operating lever. However, because it remains a forward-looking management projection, investors must account for the company's explicit guidance that roughly half of the savings may be reinvested into growth initiatives.14
CDW's approach to artificial intelligence relies on a mix-agnostic strategy. Chief Executive Christine Leahy has argued that enterprise AI adoption increases complexity across the entire technology stack—spanning infrastructure, cloud architecture, security, data management, and client endpoints—allowing CDW to capture spending regardless of where deployment occurs. When asked during an August 2026 earnings call whether clients repatriating AI workloads back to on-premises servers posed a risk or opportunity, Leahy noted that "it's not better or worse for us. We're going to help our customers optimize wherever their workload should be."13 That positioning has translated into active commercial projects, including a multi-year, multi-million-dollar AI governance deployment for a Western state government technology office—which CDW plans to productize for other public-sector clients—and a security vulnerability remediation contract for a major financial services firm.13
The financial services contract highlights a broader 2026 industry catalyst. On April 7, 2026, Anthropic released its frontier model, Claude Mythos, demonstrating the capability to autonomously identify zero-day vulnerabilities across major operating systems and web browsers—an event that prompted emergency discussions between federal regulators and banking executives while initiating an extensive multi-year software remediation cycle.23 During the August 2026 call, Leahy confirmed that client responses to Mythos served as "an important driver right now" for CDW's business, accelerating client spending on security services, technical consulting, and enterprise environment hardening.13 Demand of this nature reflects the higher-margin, services-led engagements CDW intended to capture through its acquisitions of Sirius Computer Solutions and Focal Point Data Risk.
Supporting the investment case is a consistent capital return track record. CDW generated $1.09 billion in adjusted free cash flow in fiscal 2025 while marking its twelfth consecutive year of annual dividend increases.19
The bear case
Disintermediation remains a structural threat. Hyperscaler cloud marketplaces allow corporate clients to apply third-party software purchases directly against committed cloud spending agreements, bypassing traditional channel partners. CDW explicitly acknowledges this competitive pressure in its risk disclosures, listing hyperscaler marketplaces alongside direct-sales initiatives from hardware manufacturers.1 While CDW offers multi-vendor orchestration for complex architecture, standardized software license renewals—which represent a significant portion of CDW's netted-down agency revenues—remain vulnerable to direct digital procurement.
Product mix shifts can compress margins. Management's outlook for the second half of 2026 underscores this limitation: despite raising full-year earnings per share guidance, executive leadership projected second-half gross margins to fall below second-half 2025 levels, bringing full-year 2026 gross margin modestly below the prior year due to product and customer mix.13 While Sirius helped elevate gross margins above pre-2021 levels, the margin trajectory is not guaranteed to expand indefinitely when hardware volume outpaces software and services.
Original equipment manufacturers continue expanding direct sales. Key hardware partners including Dell, HP, and Lenovo maintain investments in their direct-to-consumer and mid-market sales portals. Procurement handled directly by manufacturers bypasses third-party distribution entirely.
Cash conversion metrics have diverged from target benchmarks. CDW converted only 42% of non-GAAP net income into adjusted free cash flow during the first half of 2026, falling well below its historical target range of 80% to 90%.13 Management attributed this shortfall to a deliberate $400 million inventory build aimed at mitigating supply chain bottlenecks; however, if that working capital does not clear in the second half of the year, cash flow generation could face sustained pressure.13
Governance structures show emerging shareholder scrutiny. The combination of the board chair and chief executive roles, a 51% majority vote in favor of a shareholder proposal for written consent, a 91% approval rating on executive compensation, and combined insider equity ownership under 1% reflect a governance model reliant on institutional oversight rather than deep founder alignment.15
CFO transition creates execution uncertainty. The ongoing search for a successor to Chief Financial Officer Albert Miralles introduces leadership transition risk at a firm whose core investment thesis relies heavily on working-capital management and disciplined expense control.13
The KPIs that matter
Three key performance indicators provide the clearest view of CDW's operational performance:
Gross profit dollar growth. Net sales figures are distorted by agent-versus-principal accounting rules as product mix shifts between hardware, software, and services. Tracking gross profit dollars directly provides the truest measure of top-line expansion and evaluates management against its own stated performance targets.
Non-GAAP selling and administrative expense as a percentage of gross profit. This ratio measures operational scale efficiency, revealing whether CDW's cost-to-serve advantage over industry peers is expanding or contracting. It also serves as the primary metric for evaluating the success of the Geared for Growth initiative.
Adjusted free cash flow conversion relative to non-GAAP net income. This cash discipline metric tests whether earnings are backed by realized cash flow, using management's target benchmark of 80% to 90% conversion.
Evaluating these three metrics across consecutive quarters offers an empirical assessment of CDW's underlying business health.
XII. Epilogue & "If We Were CEOs"
If an executive team sat in Leahy's chair in Vernon Hills in the autumn of 2026, three strategic priorities would sit on the whiteboard, each involving clear operational trade-offs.
Productize AI for the middle market, and accept the margin math. CDW has demonstrated it can win large enterprise AI infrastructure projects — including a private AI factory build valued near eight figures for a major financial services client, designed and deployed in a colocation environment with accelerated compute nodes, high-speed fabric networking, and orchestration software.14 Management has acknowledged that these large infrastructure deals carry lower margins than its core portfolio.13 The broader long-term opportunity lies in the layer below: repeatable AI governance, deployment, and optimization offerings packaged for thousands of mid-market and public-sector customers who lack the scale to build custom factories. Chief Executive Christine Leahy indicated CDW is working to productize these services, beginning with its state government engagement.13 The operational friction is that productizing services is inherently difficult, with a historically low success rate across IT distribution, and CDW has not yet demonstrated conversion at scale. Single marquee engagements do not constitute a recurring services stream until they repeat consistently.
Push recurring managed services aggressively enough to change the quarterly rhythm. The strategic rationale is clear: managed services help smooth the lumpiness of hardware cycles that makes CDW's quarterly earnings volatile. The primary obstacle is cultural and structural. Because account managers are compensated on gross profit dollars, the incentive system maintains a natural bias toward immediate quarterly transactions over multi-year amortizing contracts.7 Shifting that momentum requires altering how CDW structures sales compensation — the single operational element the company has left unchanged for four decades. That represents both the highest-conviction strategic opportunity available and the most difficult to execute.
Be deliberate about international, not opportunistic. CDW's international operations in the UK and Canada generated 22.9% growth in the second quarter of 2026, driven by record performance in Canada and mid-teens local-currency growth across both markets.1310 While this performance demonstrates that CDW's business model can translate abroad, international markets still represent only about an eighth of total net sales despite eleven years of operating history in the UK and a longer presence in Canada.1 Pursuing broader expansion across Europe or the Asia-Pacific region would require either a major acquisition — re-leveraging a balance sheet that has only recently normalized following the Sirius transaction — or a decade of gradual organic expansion. Neither path is without cost, and the lessons of the 2007 buyout favor patience over debt-fueled acceleration.
Underneath all three options lies the central unresolved question facing the business since its 2013 return to public markets: is CDW a compounding services franchise that uses hardware sales for distribution, or an efficiently run distribution engine that has added services capability? Mid-2026 financial results offer evidence for the former, characterized by record gross profit, expanding operating leverage, and early AI-driven demand. Conversely, full-year 2026 management guidance supports the latter, projecting gross margins below 2025 levels as client purchasing favored hardware volumes over higher-margin services.
The core operational achievement, however, remains clear. A business launched when a classified advertisement for a used computer prompted a second phone call has expanded into a $22 billion enterprise that converts more of every gross-profit dollar into operating income than its listed direct peers, navigated a mistimed leveraged buyout, and increased its dividend for twelve consecutive years.19 Whether the next phase of enterprise technology architecture favors the central orchestrator depends on structural industry shifts, but CDW enters that transition with a proven operating model.
XIII. Recent News & Catalyst Radar
The second-half margin test. Management told investors to expect second-half 2026 gross margins below prior-year levels and full-year gross margin modestly below 2025, even while raising the full-year earnings outlook to the high end of high-single-digit growth.13 The tension between rising sales volumes and compressing margin percentages forms the defining near-term dynamic, with third-quarter results serving as the immediate test. For the third quarter, CFO Albert Miralles guided to mid-single-digit gross profit growth and non-GAAP diluted earnings per share at the high end of high single digits, supported by sequential and year-over-year reductions in operating expenses as a percentage of gross profit.13
Working capital normalization. CDW must unwind a roughly $400 million inventory build accumulated since early 2026 to achieve its full-year target of converting 80% to 90% of non-GAAP net income into free cash flow.13 Management stated that it maintains clear line of sight toward meeting that cash conversion goal.13 Whether inventory levels normalize as supply chain constraints ease represents the most measurable operational claim currently facing leadership.
Memory pricing and device economics. Memory price inflation has functioned as both a short-term demand catalyst—driving advance procurement while prompting select clients to consider cloud alternatives—and a volume constraint, as elevated average selling prices offset lower overall unit shipments.13 Tracking whether future commercial device growth is driven by unit volume rather than price increases will determine whether a true hardware refresh cycle is underway or merely an inflation pass-through.
Federal and education funding. A forty-three-day federal government shutdown in late 2025 disrupted CDW's procurement pipeline into early 2026, resulting in lower first-quarter federal sales as contract activity recovered.914 Federal demand rebounded by the second quarter, helping drive a 13.6% expansion in government sales.10 Education remains a softer channel, constrained by tighter budgets in higher education and fulfillment timing shifts in K-12 accounts.13 Legislative appropriations outcomes and E-Rate funding rounds represent the primary catalysts for public-sector stability.
The CFO succession. The search for Miralles's successor began in August 2026, ahead of his planned retirement in 2027 and subsequent transition to an advisory role.13 The selection of a new financial chief—and their initial forecasting framework—carries heightened significance for a business model reliant on working-capital management and disciplined expense leverage.
Geared for Growth delivery. CDW's Geared for Growth efficiency initiative targets $100 million to $200 million in annual run-rate savings across 2027 and 2028, with initial cost reductions expected in the second half of 2026.1413 In August 2026, Miralles indicated that early implementation was progressing "at or beyond our expectations."13 Quarterly changes in the selling and administrative expense ratio relative to gross profit will provide the empirical test of those savings.
Capital allocation pace. Following $545 million in first-half share repurchases that brought net leverage to 2.5 times, CDW retained over $1.1 billion in buyback authorization while maintaining an active acquisition pipeline.13 The central strategic decision facing leadership is whether to continue repurchasing stock above its baseline framework of returning 50% to 75% of free cash flow or reallocate capital toward strategic acquisitions.
References
-
CDW Corporation Annual Report on Form 10-K for the year ended December 31, 2025 — SEC EDGAR, 2026-02-20 ↩↩↩↩↩↩↩↩↩↩↩↩↩↩↩↩↩↩↩↩↩↩↩↩↩↩↩↩↩↩↩↩↩↩↩↩↩↩↩↩
-
CDW Computer Centers, Inc. — International Directory of Company Histories via Encyclopedia.com ↩↩↩↩↩↩↩↩↩
-
CDW Corporation Annual Report on Form 10-K for the year ended December 31, 2010 — SEC EDGAR, 2011-03-04 ↩↩↩↩↩↩↩↩↩
-
CDW Corporation Annual Report on Form 10-K for the year ended December 31, 2013 — SEC EDGAR, 2014-03-11 ↩↩↩↩↩↩↩↩↩↩↩↩↩↩↩
-
Acquisition of Sirius Computer Solutions — Investor Presentation, Form 8-K Exhibit 99.2, SEC EDGAR, 2021-10-18 ↩↩↩↩↩↩↩↩↩↩↩
-
CDW's Krasny shares entrepreneurial approach with Larry Gies — Gies College of Business, University of Illinois, 2022-12-05 ↩↩↩
-
CDW Computer Centers, Inc. Prospectus on Form 424B1 — SEC EDGAR, 2004-03-22 ↩↩↩↩↩↩↩↩↩↩
-
Berbee to be sold for $175 million — WisBusiness, 2006-09-18 ↩↩↩↩
-
CDW (CDW) Q4 2025 Earnings Call Transcript — The Motley Fool, 2026-02-04 ↩↩↩↩↩↩↩↩↩↩↩↩↩
-
CDW Corporation Quarterly Report on Form 10-Q for the quarter ended June 30, 2026 — SEC EDGAR, 2026-08-05 ↩↩↩↩↩↩↩↩↩↩
-
CDW Founder Michael Krasny Retires — The Wall Street Journal, 2007-05-30 ↩
-
CDW Corporation Annual Report on Form 10-K for the year ended December 31, 2015 — SEC EDGAR, 2016-02-25 ↩↩↩↩↩↩
-
CDW (CDW) Q2 2026 Earnings Call Transcript — The Motley Fool via The Globe and Mail, 2026-08-05 ↩↩↩↩↩↩↩↩↩↩↩↩↩↩↩↩↩↩↩↩↩↩↩↩↩↩↩↩↩↩↩↩↩↩↩↩↩↩↩↩
-
CDW (CDW) Q1 2026 Earnings Call Transcript — The Motley Fool, 2026-05-06 ↩↩↩↩↩↩↩
-
CDW Corporation 2026 Definitive Proxy Statement (DEF 14A) — SEC EDGAR, 2026-04-10 ↩↩↩↩↩↩↩↩↩↩↩↩↩↩
-
CDW Corporation (NASDAQ:CDW) Q3 2024 Earnings Call Transcript — Insider Monkey, 2024-10-30 ↩↩
-
CDW Corporation Annual Report on Form 10-K for the year ended December 31, 2024 — SEC EDGAR, 2025-02-21 ↩↩↩
-
CDW Completes Acquisition of Sirius Computer Solutions — CDW Corporation, 2021-12-01 ↩
-
Insight Enterprises Investor Relations — Insight Enterprises, Inc. ↩↩↩
-
CDW Reports Second Quarter 2026 Earnings — CDW Corporation Investor Relations, 2026-08-05 ↩
-
When AI becomes the cyber attacker: Mythos and what comes next — Norton Rose Fulbright Data Protection Report, 2026-05 ↩
 LinkedIn
 WhatsApp
 Reddit
 Hacker News
 Email
Email Kindle
 RSS Feed
 Spotify
 Apple Podcasts
 Amazon Music
 Audible
 YouTube