Carnival Corporation & plc: The Floating Empire's Reckoning & Renewal
I. Cold Open & Episode Thesis
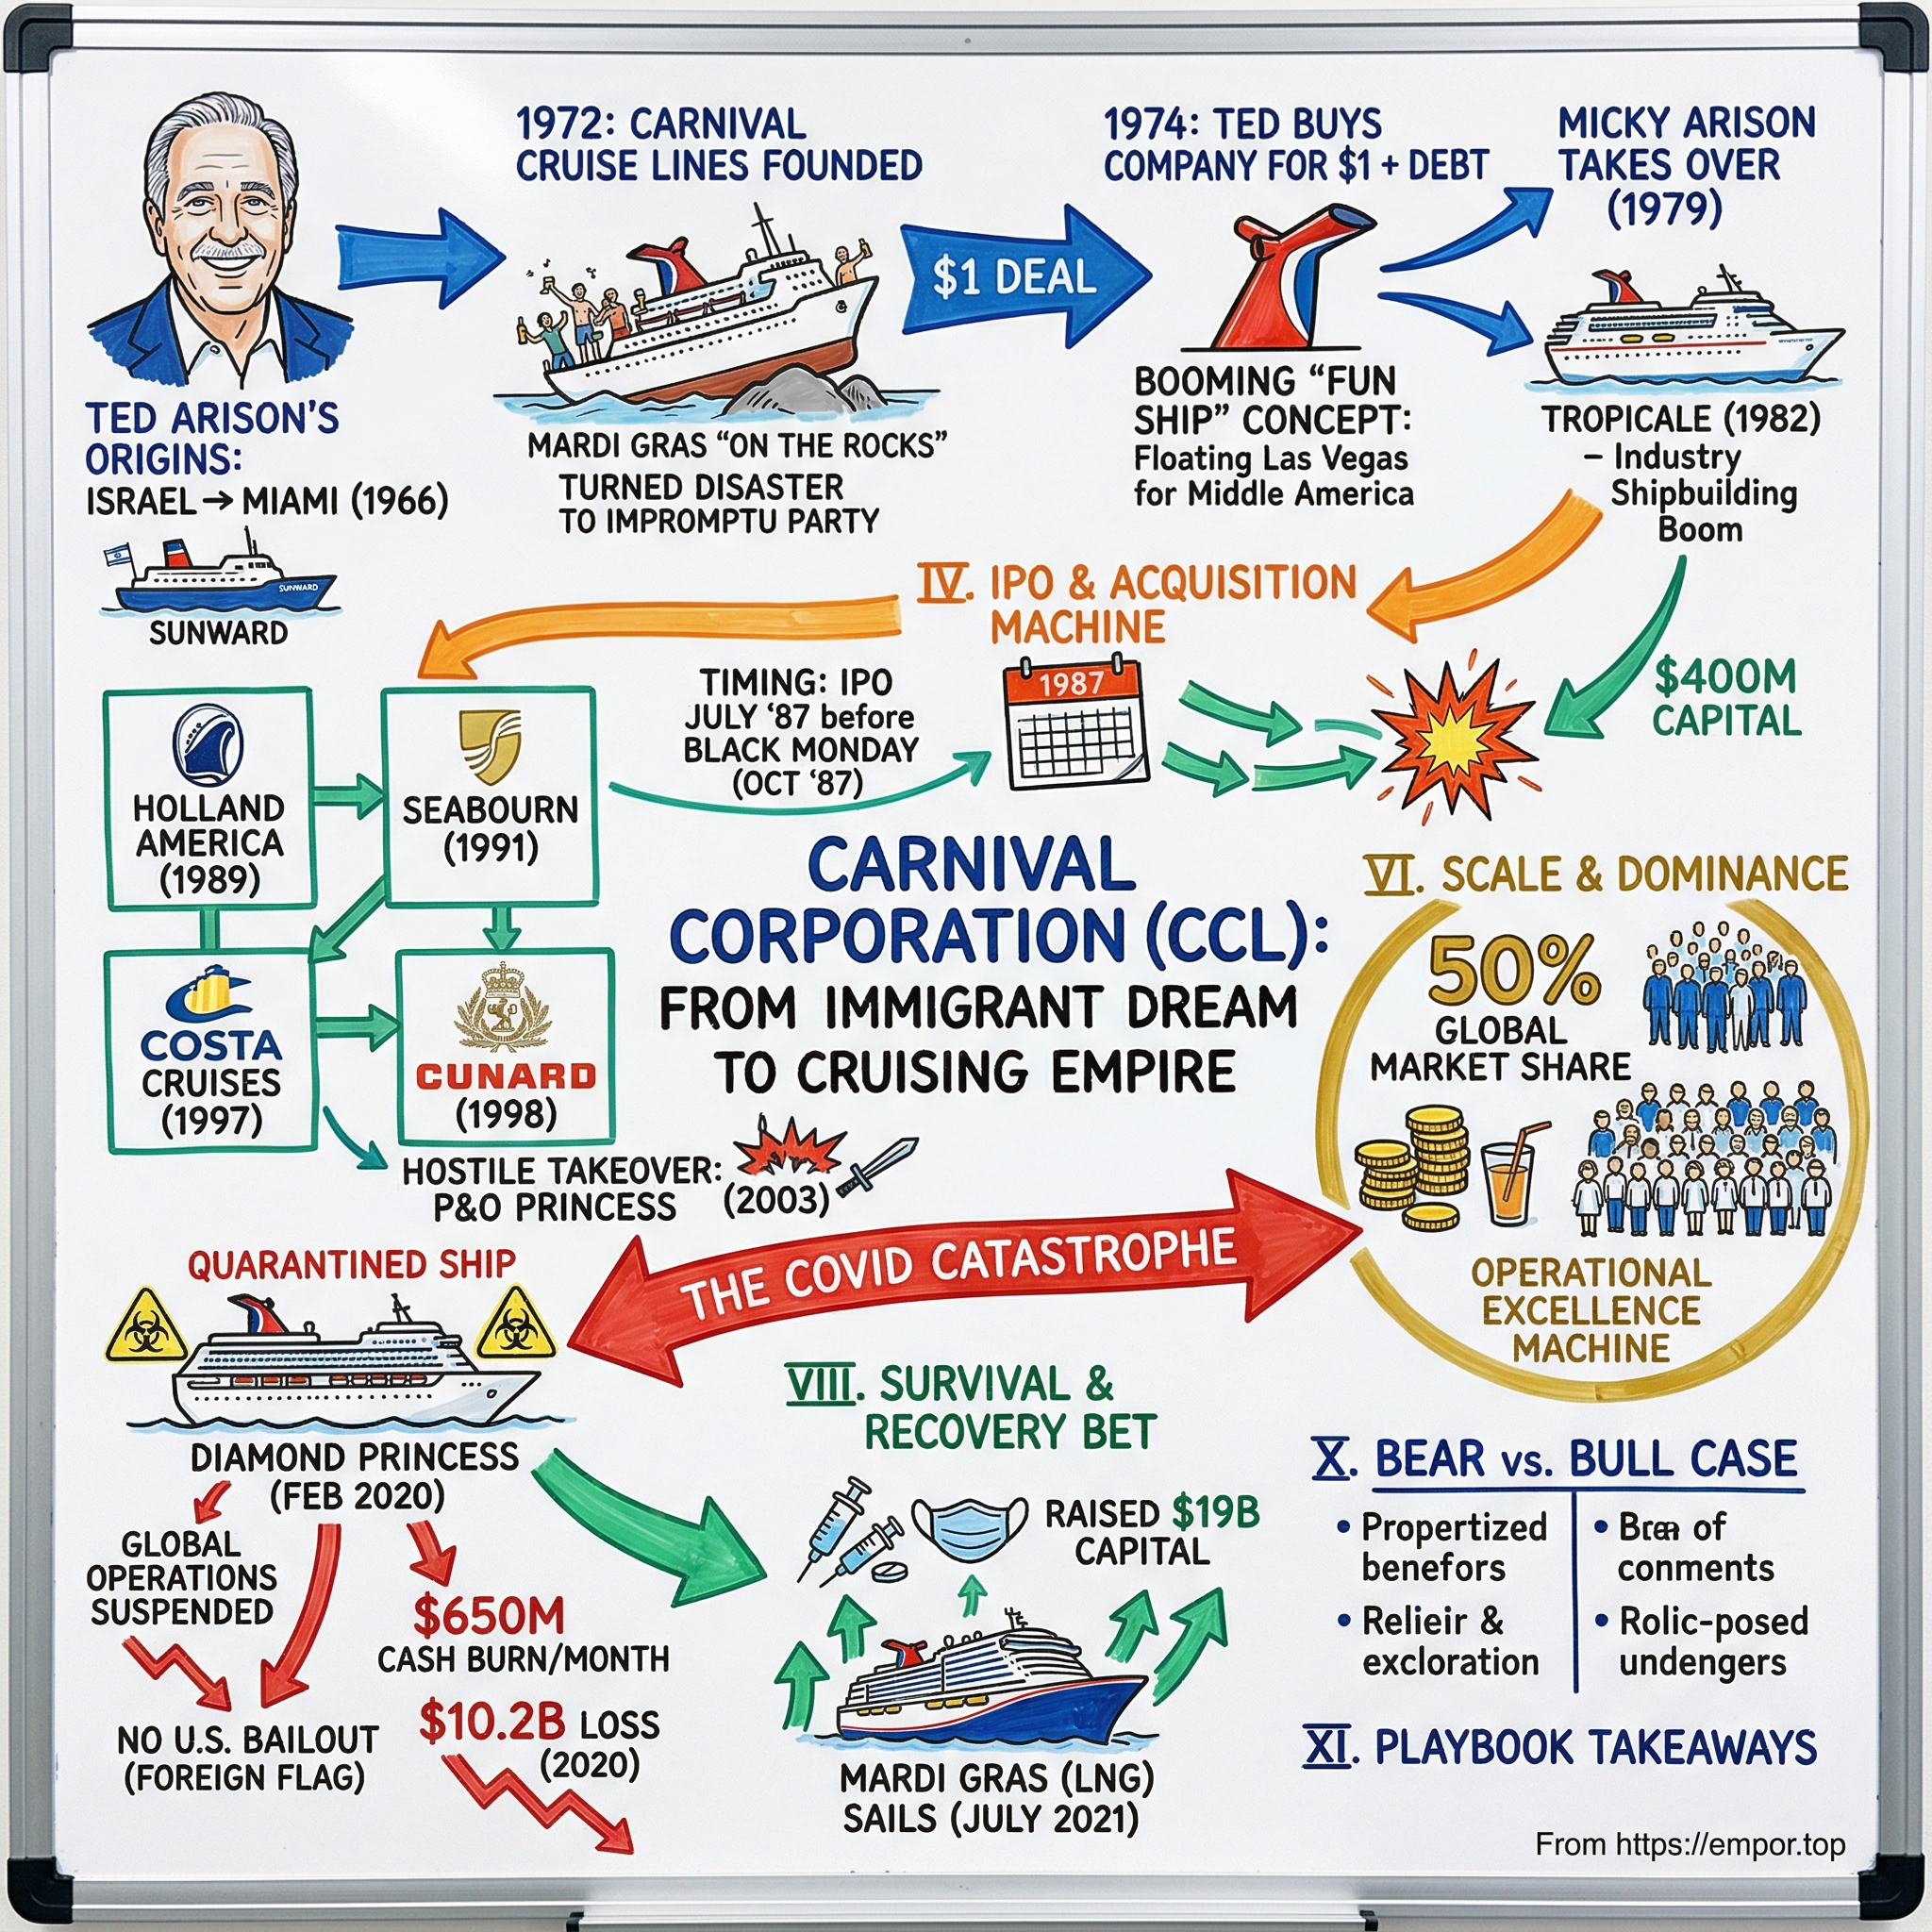
On February 3, 2020, a 116,000-ton cruise ship called the Diamond Princess dropped anchor off Yokohama, Japan, and did not move again for weeks. On board were 3,711 passengers and crew. By the time the quarantine ended on February 23, 712 of them — nearly one in five — had tested positive for SARS-CoV-2, and nine would die.1 For a few surreal weeks in early 2020, the largest cluster of a novel coronavirus anywhere outside mainland China was not a city, a hospital, or a factory. It was a single Princess Cruises ship floating in a Japanese harbor, its passengers waving from balconies to television cameras.
That image inflicted damage on the cruise industry that no marketing budget could undo. It fused the concept of a cruise ship with the threat of contagion in the public mind — and it happened to a vessel owned by the largest cruise company in the world.
What followed was not a typical downturn, but a total stoppage. Within weeks, Carnival Corporation & plc — a business that had operated more than a hundred ships across nine cruise brands and carried nearly 13 million guests in 2019 — was generating essentially zero revenue. The ships still required skeleton crews, fuel, insurance, port fees, and maintenance; the debt still required servicing; and crew members needed repatriation to dozens of countries with closed borders. A company that had earned nearly $3.0 billion of net income in fiscal 2019 lost $10.2 billion in fiscal 2020 and another $9.5 billion in fiscal 2021.2
The crisis revealed a structural vulnerability in Carnival's corporate design. When Washington assembled the CARES Act in March 2020 and the Federal Reserve created emergency lending facilities, Carnival was largely locked out of direct government support. The reason stemmed from its corporate structure: the parent company was incorporated in Panama, headquartered across Miami and London, and flew foreign flags on its ships. While this structure had saved the company substantial U.S. corporate tax for decades, it disqualified Carnival from the emergency bailout window that rescued the airlines.3 Carnival had optimized its legal architecture for one economic regime, only to see that environment vanish overnight.
Consequently, Carnival turned to private credit markets at an extremely hostile moment. In early April 2020, the company raised roughly $6 billion across equity, convertible notes, and secured debt. The centerpiece was $4 billion of first-priority senior secured notes carrying an 11.5% coupon — an interest rate typically associated with distressed borrowers rather than a company that had been investment-grade a few weeks earlier.45 The collateral was the fleet itself. For an enterprise whose founding act was buying a single secondhand ocean liner, mortgaging its ships to stay alive carried a grim historical symmetry.
That moment defines where this corporate turnaround story begins, though not where the company started. The enterprise that faced insolvency in 2020 was originally built on a transaction worth one dollar.
Six years later, the financial arithmetic of survival has become clear. In fiscal 2025 — Carnival's fiscal year ends November 30 — the company generated record revenue of $26.6 billion, operating income of $4.5 billion, and net income of $2.8 billion.26 It reinstated its dividend and earned recognition as investment grade from Fitch based on its leverage metrics. In May 2026, it simplified its corporate structure by collapsing the dual-listed framework it had maintained since 2003 into a single entity, Carnival Corporation Ltd., redomiciled from Panama to Bermuda.78 By the second quarter of fiscal 2026, ended May 31, the company reported its twelfth consecutive quarter of record net yields and reduced its net debt to adjusted EBITDA ratio to 3.1 times.9
Yet for long-term shareholders, corporate survival has not translated into proportional equity recovery. A shareholder who held Carnival stock in 2019 has seen the enterprise rebuild without capturing the full benefit. While fiscal 2025 revenue of $26.6 billion stood 28% above fiscal 2019's $20.8 billion, fiscal 2025 net income of $2.76 billion remained slightly lower than the $2.99 billion earned in fiscal 2019. More critically, diluted earnings per share fell from $4.32 in fiscal 2019 to $2.02 in fiscal 2025.2 The underlying business grew larger, but each share's claim on earnings was cut by more than half.
This divergence between enterprise recovery and equity dilution forms the core financial issue facing the company. It reflects the cost of managing extreme operating leverage during an un-underwritten crisis by issuing equity. Carnival's weighted diluted share count expanded from 692 million in fiscal 2019 to 1,402 million in fiscal 2025.2 In effect, roughly half the company's equity value was transferred to new capital providers in exchange for the right to continue operating.
The central question is not whether Carnival survived, but whether an enterprise that diluted its equity so heavily can restore per-share value. Management claims it can, setting targets under its PROPEL plan announced in March 2026 that aim for return on invested capital above 16% and more than 50% adjusted EPS growth by 2029.10 Evaluating those targets requires examining concrete factors: Carnival's historical execution record, its persistent yield gap relative to Royal Caribbean, the durability of its destination-led margin strategy, and broader industry capacity discipline.
Understanding these dynamics requires examining how the empire was assembled in the first place — starting with a founder who had already failed in the shipping industry twice.
 Subscribe on LinkedIn
II. The Arison Origin Story: From $1 Ship to Fleet Expansion
Ted Arison did not begin his career expecting to build a Miami cruise empire. Born in Tel Aviv in 1924 and educated at the American University of Beirut, he served in the Jewish Brigade during World War II and fought as an officer in the 1948 Arab-Israeli War. Coming from a shipping family, he attempted to establish maritime ventures in the newly formed state of Israel, failed, and emigrated to the United States in 1952 — arriving as a middle-aged man with a maritime education, a failed business, and no clear second act.
That second act emerged in the mid-1960s within an unglamorous corner of the travel industry. Jet airliners had effectively ended transatlantic passenger shipping. Arison recognized what incumbent shipping lines overlooked: passenger vessels no longer needed to serve strictly as point-to-point transportation. In 1966, he partnered with Norwegian shipping magnate Knut Kloster to found Norwegian Caribbean Lines, operating short warm-weather voyages out of Miami. The business proved successful, but in 1971 the partnership collapsed over financial and control disputes. Kloster retained the ships, leaving Arison with an unusual asset — a passenger booking operation and a network of travel-agent relationships — but no fleet to sail.
Seeking capital, Arison teamed up in 1972 with Meshulam Riklis, the conglomerate builder controlling American International Travel Service (AITS). Together, they purchased a retired Canadian Pacific liner, the Empress of Canada, for $6.5 million, renamed it the Mardi Gras, and launched Carnival Cruise Line.11
The maiden voyage proved disastrous. On its initial outing carrying several hundred travel agents — the key audience for generating word-of-mouth bookings — the Mardi Gras ran aground on a sandbar off the Florida coast. The company bled money for three years.11
That led to the transaction that laid the foundation for a $30 billion enterprise. In 1974, with the business struggling and AITS facing regulatory issues, Arison bought out AITS's interest in Carnival for one dollar in cash, plus the assumption of more than $5 million of company debt.11 The nominal price reflected the underlying financial reality. Riklis, a veteran financial operator, valued the equity at zero because the asset consisted of a single aging ship with a damaged reputation. Arison essentially purchased a distressed option, along with the independence to build a dedicated travel-agent distribution network rather than routing bookings through a partner.
Arison then executed the core insight that would define the company for the next fifty years. The prevailing model of passenger shipping treated voyages as costly transportation for affluent travelers moving between major ports. Arison inverted this model: the ship itself became the destination, with Caribbean ports serving primarily as scenery. By positioning the ship as the main attraction, Carnival expanded its target market beyond wealthy travelers to middle-class families seeking affordable vacation alternatives to beach resorts.
This structural shift altered both market size and enterprise economics. It expanded the addressable audience from thousands to millions while fundamentally altering the revenue model. By offering low-cost tickets to bring passengers aboard floating resorts for seven days, the initial fare acted as a customer-acquisition tool, while high-margin onboard services — casinos, bars, shore excursions, duty-free retail, and photography — generated the primary profits. Operating under the "Fun Ships" brand, Carnival established a framework for converting low ticket prices into high-margin discretionary spending. Subsequent strategic initiatives, including private-island developments in 2025 and 2026, stem directly from this model.
By 1978, Carnival operated three ships on seven-day Caribbean itineraries. Arison then departed from competitors running repurposed liners by ordering a custom-built vessel. The Tropicale, ordered at the end of the decade and delivered in the early 1980s, was engineered specifically for warm-weather mass-market cruising, designed around the economics of onboard revenue rather than around crossing an ocean in January.11 Despite widespread industry skepticism about commissioning new passenger vessels in the jet age, Carnival followed the Tropicale with its larger Holiday-class ships.
The claim, and the evidence against it. Popular accounts often frame the Fun Ship model as an immediate, unassailable competitive moat in Caribbean cruising. Historical evidence suggests a more vulnerable early reality. For much of its first decade, Carnival operated as a fragile, thinly capitalized operator running secondhand tonnage through two major energy shocks. The 1973 and 1979 oil crises hit a business where bunker fuel represented a primary variable cost, particularly since repurposed transatlantic hulls were engineered for speed rather than fuel efficiency. High maintenance requirements on aging vessels and poor operational reliability meant the flagship's initial grounding reflected broader operational fragility. A true competitive moat emerged roughly a decade later through purpose-built ships, distribution scale, and an operating cost structure aligned with its mass-market pricing.
The Fun Ship concept was a necessary foundation, but long-term competitive advantage required substantial capital to order efficient, high-density ships and fill them. Acquiring that capital led Carnival to its next major structural step: going public in 1987.
III. The Acquisition Machine & Building the Conglomerate
Carnival's October 1987 initial public offering raised roughly $400 million in fresh capital by selling an 18% equity stake—just weeks before Black Monday erased a fifth of the U.S. stock market in a single session.11 Through fortunate timing, Ted Arison converted a portion of his private cruise enterprise into cash at the peak of a bull market and preserved that liquidity through the crash.
That capital funded portfolio expansion rather than additional ships for the core brand.
By 1987, operational leadership had passed to Ted's son, Micky Arison, who was named president in 1979 at age 30 and ultimately served as chief executive officer for more than three decades.11 Micky recognized that cruising was not a single monolithic market. A retired Dutch couple booking a 14-day Alaska voyage and a Texas family taking a four-day Caribbean trip represented distinct customer segments requiring tailored brands and vessel types. However, those distinct brands could share a common balance sheet, shipbuilding relationships, fuel procurement networks, and yield-management software.
Carnival began acquiring established operators:
Holland America Line, 1989. For $625 million, Carnival acquired the 116-year-old Dutch premium line along with Windstar Sail Cruises and Holland America Westours, an Alaskan land-tour business with hotels, motorcoaches, and rail assets.11 This transaction secured a non-replicable physical infrastructure. While competitors could commission new ships for Alaskan routes, replicating Holland America's Denali lodges, glass-domed railcars, and historic port priority proved virtually impossible. More than three decades later, management continues to cite Alaska as a core competitive franchise, operating an integrated land-and-sea platform spanning five brands, 19 ships, four embarkation ports, and eight lodge properties, alongside an ongoing Denali expansion.12
Costa Cruises, 1997–2000. Carnival acquired an initial 50% stake in the Italian operator in 1997 alongside Airtours before acquiring full control.11 The transaction targeted European demand growth, securing the leading Southern European brand rather than building a regional operator from scratch.
Cunard, 1998. Carnival acquired a controlling interest in Cunard Line, operator of the historic ocean liner Queen Mary and later the Queen Mary 2.11 Although Cunard operated a smaller fleet, it anchored the high end of Carnival's portfolio ladder and provided premium brand prestige across the group.
Corporate structure. During the 1990s, Carnival separated its holding company from the underlying operating cruise line. Carnival Corporation became a capital-allocation entity managing distinct brand units rather than an operating line that owned subsidiary fleets.11
The claim, and the evidence against it. Industry accounts often assert that Carnival's acquisition strategy consistently compounded shareholder value through cross-brand synergies and purchasing power. While ordering multiple ships provided substantial leverage over shipyards, the roll-up's cumulative financial returns proved uneven across different regions and operating units.
Balance sheet goodwill disclosures highlight this disparity. At the end of fiscal 2019, prior to the pandemic, Carnival carried $2.91 billion in goodwill, representing the net acquisition premiums accumulated over decades of brand expansion. By the end of fiscal 2020, that figure dropped to $807 million.2 During the first half of fiscal 2020, the company wrote off $2.1 billion in goodwill—split $1.3 billion across North America and Australia and $777 million in Europe and Asia—alongside vessel impairments of $1.5 billion and $300 million in those respective segments.13 By fiscal 2025, goodwill stood at $579 million, meaning roughly 80% of the historical acquisition premiums had been formally written off as unrecoverable.2
While mid-2020 impairment tests occurred during unprecedented operating disruptions, non-cash write-downs occur when carrying values exceed projected discounted cash flows. The magnitude of the asset reductions indicated that acquired European operations carried carrying valuations that their underlying cash flows could not support under economic stress.
Additional operational outcomes illustrate the portfolio's mixed record. Windstar, acquired within the Holland America package, underperformed target metrics and was divested in 2007. Meanwhile, Costa Cruises delivered substantial long-term operational risk, culminating in severe financial and reputational liabilities 16 years after its initial acquisition.
The historical record indicates that while the acquisition roll-up secured durable competitive advantages in North America and Alaska, it added European scale without producing commensurate long-term returns. That divergence remains relevant, as European operations continue to weigh on consolidated yields. Before those structural challenges fully emerged, however, Carnival executed the largest corporate transaction in its history—establishing a dual-listed corporate governance framework that endured for 23 years.
IV. The P&O Princess Hostile Takeover & Dual-Listed Structure
In November 2001, two months after the September 11 terrorist attacks froze global travel, P&O Princess Cruises and Royal Caribbean agreed to combine in a proposed merger of equals. The roughly $3 billion transaction would have created the world's largest cruise operator and permanently relegated Carnival to second place.[^14]
Micky Arison did not negotiate; he attacked. In December 2001, Carnival launched a hostile counter-offer for P&O Princess, valuing the target well above Royal Caribbean's terms and setting off one of the era's most contentious takeover battles.14
The contest was notable not just for its financial stakes, but for its multi-jurisdictional complexity. Two Miami-based companies fought over a British target across three distinct regulatory and investor arenas: British institutional shareholders concerned about London listing status and FTSE index weighting; the U.S. Federal Trade Commission, tasked with deciding whether combining the first- and third-largest operators was anticompetitive; and the European Commission, applying its own legal standards. The battle spanned 16 months.
Carnival prevailed by outbidding its rival and engineering a novel corporate structure. P&O Princess's board ultimately recommended a Carnival offer valued at roughly $5.3 billion in January 2003.15 To overcome resistance from UK investors who opposed receiving shares in a Panamanian, New York-listed entity that would lose FTSE eligibility, Carnival established a dual-listed company structure. Carnival Corporation remained listed in New York, while P&O Princess was renamed Carnival plc and retained its London listing and UK shareholder register. Legally, the two entities remained distinct, but operationally and economically they functioned as one, featuring a unified board, shared executive management, and contractually equalized voting rights and dividends.16
Regulators cleared the transaction. The FTC closed its investigation in October 2002, concluding the combination would not substantially lessen competition—a decision that effectively sanctioned the consolidation of the global cruise industry into three major players.[^18]
The transaction gave Carnival the largest brand portfolio in the cruise industry. It added Princess Cruises, with its dominant North American and Alaskan footprint, alongside P&O Cruises in the United Kingdom, P&O Cruises Australia, and Germany's AIDA, which grew into a leading continental European brand. Combined with its existing assets, Carnival controlled nearly half of global passenger berth capacity.
The claim, and the evidence against it. Proponents argued that the P&O Princess acquisition established permanent global scale dominance and unmatched operating leverage. Two decades of performance data present a far more nuanced picture.
The dual-listed structure solved a short-term 2003 cross-border deal condition while introducing long-term operational friction: dual accounting frameworks, separate stock listings, distinct regulatory oversight, two annual shareholder meetings, divergent share prices, and currency mismatches between localized earnings and consolidated reporting. Carnival management eventually acknowledged those inefficiencies. In late 2025, the company proposed collapsing the dual-listed structure into a single entity. Shareholders approved the plan on April 17, 2026, the court sanctioned the scheme, and on May 7, 2026, unification completed under Carnival Corporation Ltd., with Carnival plc surviving as a UK subsidiary and the group redomiciling from Panama to Bermuda.78 Chief Financial Officer David Bernstein outlined the rationale during an investor call in June 2026, highlighting a simplified corporate design, improved trading liquidity, unified global share price discovery, and lower administrative overhead.9 Those benefits directly quantified the operational drag the company bore for 23 years.
The long-term return on individual assets acquired in the deal also proved mixed. Alongside core assets like Princess and AIDA, the transaction included sub-scale regional operations that struggled to earn their cost of capital. P&O Cruises Australia operated as a small, geographically isolated unit bearing localized corporate overhead in a thin market. In June 2024, Carnival announced it would fold the Australian operations into Carnival Cruise Line, fully sunsetting the P&O Cruises Australia brand and redeploying its vessels by fiscal 2025.1718 The restructuring reflected operational discipline, but also underscored that portions of the 2003 acquisition created limited long-term shareholder value.
A comparison with the losing bidder illustrates the strategic trade-off. Royal Caribbean remained a single-listed, unified corporate entity with a tighter portfolio focus. Over the next two decades, it achieved higher returns on invested capital and superior net yields per berth than Carnival. Subsequent sections examine that operating yield gap in detail, as it remains a core strategic metric for the enterprise. Winning the bidding war did not automatically guarantee superior financial returns.
For nearly a decade after the acquisition, Carnival's dominance appeared secure as the industry's largest and most profitable operator. That stability ended on a January night off the Tuscan coast, when a flagship vessel sailed dangerously close to shore.
V. The Crisis Decade: Concordia, Brand Trauma, & Operational Pivot
At 9:45 p.m. on January 13, 2012, the Costa Concordia—a 114,500-ton vessel carrying 3,206 passengers and 1,023 crew—struck a rock outcrop off Isola del Giglio along the Tuscan coast. The ship had deviated from its plotted course to perform a near-shore "salute," tearing a gash in the hull, losing power, and capsizing in shallow water. Thirty-two people died.19
The disaster produced global news coverage. Captain Francesco Schettino abandoned the vessel while passengers remained aboard; he was later convicted of manslaughter and abandoning ship and sentenced to 16 years in prison. The salvage effort became the largest in maritime history, taking more than two and a half years and costing roughly $2 billion before the wreck was righted, refloated, and towed to Genoa.19 Italy's official casualty investigation, published in 2013, laid out the chain of navigational and command failures in detail.[^22]
For Carnival, the incident created a triple crisis: a human tragedy, massive financial exposure across hull loss, salvage, litigation, and insurance liabilities, and acute brand damage concentrated in Costa Cruises' core Southern European market, which required years of effort to rebuild consumer trust.
Thirteen months later, in February 2013, an engine room fire aboard the Carnival Triumph disabled power in the Gulf of Mexico. Roughly 4,000 passengers and crew drifted for days under compromised sanitary conditions. Although there were no fatalities, intense media coverage tarnished the flagship Carnival brand. Occurring so soon after the Giglio disaster, the incident reinforced public perception of operational vulnerabilities across the fleet.
Together, these twin incidents exposed the limits of Carnival's decentralized governance. Historically, the enterprise had operated as a federation of semi-autonomous brands, with each unit maintaining distinct operational cultures, maritime standards, and procurement policies. While this model preserved brand identity, it fragmented safety oversight across a fleet of more than 100 ships without single-point executive accountability.
In 2013, Micky Arison stepped down as chief executive after more than three decades, remaining chairman of the board—a position he still holds today, and from which he still joins earnings calls.9 The board appointed Arnold Donald, an outside director with a background at Monsanto, as CEO.
Donald led a decade of operational centralization. He consolidated maritime safety, environmental compliance, and procurement under shared corporate functions, mandated uniform fleet-wide standards, and moderated capital expenditure on new vessel capacity. While centralization strengthened risk controls, it did not resolve underlying yield challenges, as Costa's structural profitability gap relative to North American operations persisted.
By the late pre-pandemic period, top-line performance appeared strong. In fiscal 2018, Carnival generated revenue of $18.9 billion and net income of $3.15 billion. In fiscal 2019, revenue grew to $20.8 billion, though net income fell to $2.99 billion alongside operating income of $3.28 billion.2 The balance sheet appeared solid, carrying $11.5 billion in total debt against $25.4 billion of shareholders' equity—a genuinely conservative capital structure by any conventional measure.2
However, the divergence between revenue expansion and falling net income signaled margin pressure, as incremental returns on added capacity began to diminish. Carnival entered 2020 with a balance sheet that appeared well capitalized, but an operating model whose earnings momentum had already plateaued.
Shortly thereafter, the pandemic struck, bringing global operations to a halt.
VI. The COVID Catastrophe & Capital Structure Survival
Businesses defined by high fixed operating costs face immediate structural jeopardy when revenue vanishes, and Carnival experienced an unprecedented collapse of this dynamic in 2020.
On March 14, 2020, the U.S. Centers for Disease Control and Prevention issued a No Sail Order, forcing Carnival's entire operating fleet of more than 100 ships to halt operations completely. The vessels remained largely idle for more than a year, yet substantial ongoing expenses persisted. Carnival continued paying for fuel to maintain vessels in warm lay-up, hull insurance, port and anchorage fees, dry-dock maintenance required for class certification, and complex logistics to repatriate tens of thousands of crew members to countries with closed borders.
The financial impact manifested clearly on the income statement. Fiscal 2020 revenue collapsed from $20.8 billion to $5.6 billion—with most recorded in the first quarter prior to the shutdown—resulting in an operating loss of $8.9 billion and a net loss of $10.2 billion. In fiscal 2021, during near-total suspension, revenue fell to $1.9 billion against a $9.5 billion net loss. Operations began resuming in fiscal 2022, but the company still reported a $6.1 billion net loss. Combined with a modest deficit in fiscal 2023, Carnival accumulated nearly $26 billion in total net losses over four fiscal years.2
That multi-year loss eroded fifty years of accumulated profitability. Carnival's retained earnings stood at $26.65 billion at the end of fiscal 2019; by the end of fiscal 2023, they had dropped to $185 million.2 Virtually the entire history of cumulative retained earnings had been depleted to fund operational survival.
To cover cash burn and remain solvent, Carnival tapped debt and equity markets across multiple capital structures. The initial April 2020 transaction combined roughly $1.25 billion of new equity, $1.75 billion of convertible notes, and $4 billion of first-priority senior secured notes carrying an 11.5% coupon collateralized by the fleet.45 Subsequent issuances in euro and dollar tranches also required double-digit interest rates. Over the next two and a half years, Carnival repeatedly issued secured notes, unsecured notes, convertibles, export-credit ship financing, and equity. Consequently, total debt including finance leases peaked at $35.9 billion at the end of fiscal 2022, against shareholders' equity of $7.06 billion.2 Having entered the crisis with approximately $0.45 of debt for every dollar of equity, Carnival ended fiscal 2022 with more than five dollars of debt per dollar of equity.
Substantial equity issuance created lasting dilution for existing shareholders. Weighted average diluted shares outstanding expanded from 692 million in fiscal 2019 to 775 million in fiscal 2020, 1,123 million in fiscal 2021, and 1,180 million in fiscal 2022.2 Additional share issuance occurred as convertible notes subsequently converted into equity. While existing equity holders avoided complete wipeout in bankruptcy, their fractional claim on future enterprise earnings was permanently reduced by more than half to preserve liquidity.
Simultaneously, management executed fleet rationalization by accelerating the retirement of older, less fuel-efficient, lower-yielding vessels that required high maintenance relative to their cash generation. While Carnival operated more than 100 ships in 2019, its fiscal 2025 filings describe nine cruise line brands and one cruise experience brand operating a combined fleet of 93 ships.18 Removing lower-margin tonnage elevated fleet-wide averages across fuel efficiency, customer satisfaction scores, and net yields, contributing directly to improved post-restart unit economics.
The claim, and the evidence against it. Prior to 2020, Carnival's investment-grade balance sheet was frequently cited as an unassailable financial buffer that insulated the business against capital intensity risks. Operating history during the pandemic challenged the stronger version of this claim.
The capital structure was not engineered for a complete 15-month revenue halt. Furthermore, structural features that provided efficiency during normal operations became distinct liabilities during extreme distress. Foreign incorporation, which had reduced corporate tax liabilities for decades, disqualified the company from direct U.S. government emergency lending facilities under the CARES Act.3 Meanwhile, possessing a large unencumbered vessel fleet enabled survival only by encumbering those core physical assets at distressed borrowing rates, including 11.5% secured debt, rather than obtaining investment-grade terms.
A more nuanced evaluation of the balance-sheet argument remains valid: conservative pre-crisis leverage left Carnival with unencumbered ships to pledge, enabling it to access roughly $35 billion in private capital markets rather than entering bankruptcy restructuring. The balance sheet cushion did not shield equity holders from severe dilution or debt accumulation, but it determined enterprise survival.
The key test for Carnival's revised financial architecture during future macro downturns is whether operating cash flows and liquidity reserves can absorb revenue shocks without triggering further dilutive equity issuance or high-cost debt financing. Operating performance since 2022 demonstrates substantial debt reduction and margin recovery, led by executive leadership appointed from within the corporate treasury department.
VII. Current Management & The Josh Weinstein Turnaround
When Carnival announced in May 2022 that Josh Weinstein would become president and chief executive effective August 1, the choice read as conservative to the point of dullness. Weinstein was 48, a twenty-year company veteran, and about as far from a celebrity hire as the shortlist allowed.20
The résumé is the interesting part, because it explains everything about how he has run the company. Weinstein spent ten years, from 2007 to 2017, as Carnival's treasurer — the person responsible for debt, tax, insurance, and financial planning across the group. Then he ran Carnival UK, the operating company behind P&O Cruises and Cunard, giving him three years of direct brand P&L responsibility. Then two years as chief operations officer, overseeing global maritime, ports and destinations, sourcing, IT, and audit.20 Treasury, then a brand, then operations. Carnival in 2022 needed someone who understood debt covenants, understood why a European brand underperforms, and understood how a ship actually runs. It is difficult to design a more precisely fitted background.
The governance around him has stayed stable, which is unusual for a post-crisis turnaround. David Bernstein remains chief financial officer, providing continuity through the entire arc from pre-pandemic investment grade to emergency financing to refinancing. Micky Arison remains chairman, and the Arison family remains the anchor shareholder — a Schedule 13D/A filing in 2025 disclosed Micky Arison beneficially owning approximately 94.1 million shares, roughly 8.1% of shares outstanding, held substantially through family entities and trusts.21 That is a meaningful stake, though far below the family's historical control position; the dilution of 2020–2022 diluted the founders alongside everyone else.
The target-setting record, which is the real evidence on management quality. In June 2023, with the company still loss-making and carrying more than $30 billion of debt, Weinstein did something risky: he published a three-year scorecard. The SEA Change program set 2026 targets across sustainability, EBITDA per available lower berth day, and adjusted return on invested capital — specifically a 20%-plus reduction in carbon intensity versus 2019, a 50%-plus increase in adjusted EBITDA per ALBD versus 2023, and adjusted ROIC of 12%.[^25]
Publishing quantified three-year targets while your interest expense exceeds your operating income is either confidence or recklessness. In this case it was confidence that proved warranted. In June 2025, Carnival announced it had exceeded both 2026 SEA Change financial targets eighteen months early, having increased adjusted EBITDA per ALBD by 52% and more than doubled adjusted ROIC to over 12.5% in under two years.22 By the end of fiscal 2025 adjusted ROIC exceeded 13%, with adjusted EBITDA per ALBD at its highest level in roughly two decades.6
This is the single strongest piece of evidence in the bull case, and it deserves to be weighed properly rather than simply cited. Management set public, quantified, multi-year targets and beat them early. That is the behavior pattern that distinguishes credible operators from narrative operators, and it is rare. It should also be discounted somewhat for context: the targets were set from a 2023 base year in which the company was still recovering from a shutdown, and a substantial portion of the beat came from the natural post-pandemic snap-back in pricing and occupancy that lifted the entire industry. Beating a recovery-year baseline is easier than beating a normalized one. The real test of the discipline is the next plan, from a normal base.
That plan arrived in March 2026. PROPEL — "Powering Growth and Returns, Responsibly" — set 2029 targets of return on invested capital above 16%, adjusted EPS growth of more than 50% from the 2025 base, distribution of over 40% of operating cash flow to shareholders (roughly $14 billion), net debt to adjusted EBITDA of 2.75 times, and a greenhouse gas intensity reduction of more than 25% versus 2019.10 Alongside it came a $2.5 billion share repurchase authorization, commencing after the April 2026 shareholder meetings.10
The capital allocation, which is where the discipline is visible. Three things stand out in the fiscal 2025 and 2026 record.
First, deleveraging has been the priority and it has worked. Total debt fell from the fiscal 2022 peak to $28.0 billion including finance leases at the end of fiscal 2025, with the company reporting a reduction of more than $10 billion from its peak in under three years and completing a $19 billion refinancing program in less than twelve months — which is less about the headline number than about pushing out maturities and retiring the punitive 2020-vintage coupons.26 Net debt to adjusted EBITDA improved from 3.4 times at fiscal year-end 2025 to 3.3 times after the first quarter and 3.1 times after the second quarter of fiscal 2026 — over half a turn of improvement in a year.9 Fitch recognized the leverage metrics as investment grade.6
Second, capacity growth has stayed deliberately suppressed. Fiscal 2026 capacity growth guidance was 0.9%.10 The order book stands at ten ships, and when Weinstein announced three new Princess vessels in the second quarter of 2026, the delivery dates were 2035, 2038, and 2039 — a decade or more out.9 On the June 2026 call he was explicit that even as more ships get ordered for the 2030s, "we have no plans to deviate from our one to two ships per year cadence."9 For an industry whose historical failure mode is ordering ships at the top of a cycle and taking delivery at the bottom, that restraint is the most valuable thing management is doing.
Third, capital is being redirected into modernizing the existing fleet rather than expanding it. The AIDA Evolution program is upgrading seven ships; a Holland America Evolution program covering six ships begins with Oosterdam in autumn 2027.9 Pressed by a Mizuho analyst on what justifies these economics, Weinstein gave an unusually specific answer: added cabins "pay for themselves in a couple of years," and guest-facing refurbishments are underwritten to "at least high teens" returns — a new-build-style hurdle at a fraction of new-build cost.9 That is a concrete, falsifiable disclosure of an investment hurdle, which is more than most companies offer.
Fourth, the balance sheet repair has finally reached shareholders. Carnival reinstated a quarterly dividend of $0.15 per share with a February 2026 record date, expects to pay over $800 million in dividends during 2026, and had repurchased more than 17 million shares for over $450 million by the second quarter — roughly $1.3 billion of total returns for the year on an annualized basis.6910 Asked whether that buyback pace continues, Weinstein declined to extrapolate: "$450 million a quarter would probably be too much to expect."9 Under-promising on a capital return program is, in context, a good sign.
Where the record is less flattering, and it needs saying next to the praise. In March 2026 Carnival guided full-year net yield growth of approximately 2.75%. In June 2026 it cut that to approximately 1.75%, a full percentage point, blaming the prolonged Middle East conflict and its effect on Mediterranean deployments, elevated airfares, and reduced transatlantic flight capacity.9 Stifel's Steven Wieczynski pushed directly on this, noting the company had been 85% booked for the year back in March and asking what had actually changed. Weinstein's answer was candid rather than defensive — the company had expected a pause but "certainly did not expect the conflict to last throughout the whole of our second quarter, including the Strait of Hormuz and all the knock-on impacts."9
Two things are true about that exchange. Management answered the hard question concretely, named the specific driver, and did not shift blame — behavior that supports rather than undermines credibility. And the guide was still cut by a third of the year's expected yield growth, on a variable management had claimed high visibility into, with 85% of the year already sold. Both belong in the assessment.
More consequential is the language used around the offset. Because Carnival found roughly a point of cost savings to offset the point of lost yield, full-year EPS guidance actually ticked up a penny to $2.22.9 Bernstein described the savings as structural, citing "hundreds of items across the business, which we view as permanent cost savings in the future," and gave an unusually granular example about reducing forklift counts on embarkation day from fourteen to thirteen across multiple ships and itineraries.9 The forklift anecdote is genuinely persuasive about the type of savings — mundane, repeatable, unlikely to reverse. The word "permanent" is not yet earned. Cost programs assembled under pressure in a single quarter have a well-documented tendency to partially unwind when the pressure lifts, and Bernstein himself acknowledged some of the second-quarter beat was timing between quarters. The verifiable version of the claim is that Carnival demonstrated it has real cost levers and used them competently. Whether the savings are permanent is a fiscal 2027 and 2028 question, and the answer will show up in cruise costs excluding fuel per ALBD.
The deeper issue, though, is not costs. It is that even with record yields, Carnival earns dramatically less per passenger than its principal competitor — and closing that gap is the entire equity thesis.
VIII. Cruise Economics, Segment Breakdown, & The Yield Gap
Every industry relies on specialized terminology to explain its operational performance. In cruising, a few core metrics govern how companies generate revenue and manage expenses per unit of capacity.
ALBD — available lower berth days. This metric represents total passenger capacity. Every cabin is assumed to accommodate two guests, and each day a cabin is available for sale counts as two ALBDs. It serves as the industry equivalent of an airline's available seat miles or a hotel's available room nights—the baseline denominator for unit performance.
Gross yield and net yield. Gross yield measures total revenue generated per ALBD. Net yield subtracts pass-through and direct acquisition costs, including travel agent commissions, guest airfare purchased through the cruise line, and third-party port fees. Net yield provides the clearest measure of what a cruise line retains per unit of capacity. In the second quarter of fiscal 2026, Carnival recorded a net yield of $208.69 per ALBD.23
Cruise costs excluding fuel per ALBD. This metric tracks core operating expenses—including crew wages, food, hotel operations, maintenance, marketing, and administration—per unit of capacity, excluding volatile fuel costs to isolate operational cost control. Carnival's cruise costs excluding fuel were $119.60 per ALBD in the second quarter of fiscal 2026.23 The spread between net yield and unit cruise costs, roughly $89 per berth-day, represents the primary operating margin before fuel, depreciation, and interest expenses.
Occupancy above 100%. Because standard capacity is calculated at two guests per cabin, placing third or fourth passengers in a cabin—typically children—raises reported occupancy above 100%. Carnival achieved 104% occupancy in the second quarter of fiscal 2026.23 Third and fourth berths carry high marginal profitability, as their incremental cost is largely limited to food and linens while generating full ticket fares and onboard spending.
The portfolio, in economic rather than organizational terms. Carnival reports across four segments: North America and Australia, Europe and Asia, Cruise Support, and Tour and Other. The North America and Australia segment—comprising Carnival Cruise Line, Princess Cruises, Holland America Line, and Seabourn—serves as the primary profit engine, generating most of the company's revenue at higher net yields and stronger operating margins. The Europe and Asia segment—including AIDA Cruises, Costa Cruises, and P&O Cruises UK—operates with lower net yields, a more price-sensitive customer base, and greater exposure to intra-European competition and currency fluctuations. Cruise Support manages the portfolio of exclusive destinations and port assets.18 Tour and Other encompasses the Alaska land operations, which are modest in revenue but provide key strategic integration. During fiscal 2025, the P&O Cruises Australia brand was sunset and its operations were folded into Carnival Cruise Line, simplifying the geographic structure.18
The central financial divergence.
Comparing Carnival's performance with its main competitor highlights the core financial dynamic facing the company.
In fiscal 2025, Carnival generated revenue of $26.6 billion and adjusted EBITDA of $7.2 billion.6 In calendar 2025, Royal Caribbean generated revenue of $17.9 billion and adjusted EBITDA of $7.0 billion.24
Carnival produced roughly 49% more revenue than Royal Caribbean while generating nearly the same adjusted EBITDA. Carnival's adjusted EBITDA margin stood near 27%, compared with Royal Caribbean's near 39%. Royal Caribbean also converted its operating cash flow into $4.3 billion of adjusted net income, compared with Carnival's $3.1 billion—delivering greater bottom-line earnings on two-thirds the revenue.624
This margin gap represents the defining operational distinction between the two companies across economic cycles.
Why the gap exists. Three underlying factors drive this performance divergence.
First is fleet design and pricing strategy. Royal Caribbean built its business around large, feature-rich vessels—such as the Oasis and Icon classes—that function as high-end resort destinations commanding premium fares and generating high onboard spending. Carnival operates a larger, older, and more heterogeneous fleet across multiple brands positioned around value pricing. A volume-focused value model inherently limits unit yields.
Second is geographic and brand composition. Carnival maintains substantial European operations where structural net yields are lower. Royal Caribbean's narrower portfolio skews more heavily toward premium North American markets. A portion of Carnival's yield gap reflects the operational reality of owning brands like AIDA and Costa, which serve lower-priced regional markets.
Third is destination monetization. Royal Caribbean established an early lead in developing high-margin private destinations, exemplified by Perfect Day at CocoCay, which transformed routine port visits into high-margin revenue events captured entirely by the cruise operator. Carnival began accelerating its private destination strategy roughly five years later.
How much of the gap is structurally closable. Certain elements of the yield gap are structural. Carnival cannot easily reposition Costa as a luxury brand or replace its 93-ship fleet with mega-vessels, given management's commitment to adding just one to two new ships per year. Furthermore, value pricing provides defensive stability during economic downturns, supported by Carnival's competitive unit cost structure.
The closable portion depends on commercial execution, targeted vessel refurbishments, and destination capture. During the June 2026 earnings call, Weinstein highlighted three priority areas: strengthening commercial capabilities in revenue management and personalization, maintaining disciplined capital allocation for fleet upgrades, and expanding the private destination portfolio.9
Recent results show progress, though the long-term trend remains to be proven. Carnival recorded twelve consecutive quarters of record net yields through the second quarter of fiscal 2026 and achieved 7.3% constant-currency net yield growth in fiscal 2025.69 However, full-year net yield growth guidance for fiscal 2026 was revised down to approximately 1.75% in constant currency.23
Determining whether Carnival can narrow the yield gap requires tracking the net yield spread relative to Royal Caribbean over several years. If that spread narrows through fiscal 2029, the commercial strategy is proving effective. If both operators expand yields at similar rates, the percentage gap will persist, leaving equity growth dependent primarily on balance sheet deleveraging rather than structural margin expansion.
That shifts the focus to the specific destination investments management is relying on to drive yield convergence.
IX. Strategic Optionality: Private Islands, Medallion Tech, & Asset Optimization
Consider the economics of a single shore day, which explains why cruise lines have increasingly turned toward developing private destinations.
When a ship calls at a foreign port, the cruise line pays a third-party authority a port fee per passenger. Guests disembark and spend money on excursions, meals, drinks, and souvenirs, with the vast majority of those dollars landing in the local economy rather than on the cruise line's income statement. In effect, the cruise line incurs costs to deliver thousands of vacationers directly to someone else's cash register.
Changing one variable — having the cruise line own the beach — alters those economics entirely. Third-party port fees disappear, while excursions, cabana rentals, food, and beverage spending are captured directly at retail. Furthermore, because the environment is engineered for throughput and spending, the overall yield per passenger day increases.
Celebration Key. Carnival broke ground on Grand Bahama in 2022 and opened the destination on July 19, 2025, at a stated investment of roughly $600 million, welcoming its first 5,000 guests and hiring more than 1,200 Bahamians to staff it.2526 The destination scaled rapidly, welcoming over one million guests by the end of fiscal 2025 and over two million by June 2026.623 In early May 2026, a pier extension was completed to enable up to four ships and over 13,000 guests per day, with management expecting Celebration Key to handle approximately 3.5 million visitors in 2027.9
RelaxAway at Half Moon Cay. Carnival's long-held private island in the Bahamas received a new pier in June 2026, allowing two of its largest ships to dock simultaneously alongside continued tender operations, lifting capacity above 12,000 guests per day.9 Management positions the two Bahamian assets as complementary: Weinstein described Celebration Key as a high-energy environment featuring lagoons, water slides, and expansive swim-up bars, while RelaxAway offers a quiet mile of white sand, allowing both to be featured on a single itinerary.9
The wider footprint. Carnival has also expanded its infrastructure elsewhere in the Caribbean, adding pool and cabana offerings at Isla Tropicale in Roatán while continuing to operate Puerto Maya in Cozumel. Under the "Paradise Collection" banner, management projects these destinations will handle over nine million guest visits in 2027, with roughly 85% of Caribbean itineraries calling at least one exclusive destination and nearly half visiting two or more.9
Analytical limits and financial disclosure. While the strategic rationale is clear and operational metrics like guest counts and pier capacity are verifiable, Carnival has not disclosed incremental yield figures, project-level returns, or standalone destination revenue for Celebration Key. Consequently, specific estimates of incremental spend per passenger day remain unconfirmed. The verifiable trend, however, is structural: the company is systematically replacing third-party port calls with owned-asset visits across Carnival Cruise Line's Caribbean network, its highest-volume and most cost-advantaged franchise.
Management has acknowledged physical constraints on this growth strategy. Asked about future expansion phases, Weinstein noted that the primary limiting factor at Celebration Key remains land-side infrastructure, declining to provide a firm timeline beyond expressing hope for progress "as we make our way through the latter half of this decade."9 With a daily capacity of 13,000 guests, the destination is already constrained relative to potential fleet demand; three of Carnival's largest ships alone carry roughly 18,000 passengers. Expanding that capacity will require additional capital and ongoing construction, framing the destination strategy as a multi-year build rather than an instantly realized driver.
OceanMedallion, and a note on proportionality. On Princess Cruises, Carnival deploys a wearable device roughly the size of a coin that integrates guest identification, room access, and payment functions while enabling location tracking throughout the vessel. By eliminating purchasing friction, the system allows passengers to order beverages, reserve specialty dining, and complete retail transactions seamlessly, supporting onboard spending.
Despite its operational integration, the technology's standalone financial contribution remains unquantified. Carnival has not published audited figures detailing Medallion's incremental revenue per passenger, and any circulating percentage uplift should be treated as an estimate rather than a disclosed result. Notably, when Weinstein outlined the three core pillars of Carnival's operational strategy during the June 2026 earnings call — commercial capabilities, fleet investment, and destinations — the Medallion ecosystem was not cited as a primary driver, nor did analysts raise it.9 The technology functions as a helpful brand feature that supports onboard spending at the margin, rather than a transformational catalyst.
Sizing these initiatives correctly matters. The destination portfolio is material — serving as a primary vector for the margin expansion embedded in PROPEL's 2029 return target and receiving substantial capital. Wearable technology, by contrast, plays a minor role.
With these operational assets established, the central analytical question turns structural: what competitive barriers protect this business model, and where do its vulnerabilities lie?
X. Strategic Position: 7 Powers & Porter's 5 Forces Analysis
Stripping away individual brand identities and private destination developments reveals a central structural question: why can competitors not easily replicate Carnival's business model? The answer involves broader structural factors than sheer capital, while highlighting distinct long-term operational vulnerabilities.
Hamilton Helmer's 7 Powers
Scale economies — strong, and the most real of the seven. Carnival spreads corporate overhead, information technology infrastructure, naval architecture, safety and environmental compliance, and marketing across 93 ships and more than 160,000 employees.918 It purchases fuel, provisions, and shipyard capacity in volumes unmatched by any competitor outside Royal Caribbean Group. This scale advantage is evident in unit economics: Carnival's cruise costs excluding fuel per available lower berth day remain structurally lower than those of premium competitors, allowing its value-priced fleet to maintain profitability. This cost efficiency makes the net yield gap relative to Royal Caribbean survivable, as lower unit operating costs offset weaker revenue per berth day.
Counter-positioning — moderate, and frequently overstated. Industry commentary often asserts that cruises offer a substantial discount compared with equivalent land-based resort vacations, providing structural resilience during economic downturns as travelers trade down toward cruising. While Carnival's value positioning benefits from this dynamic, true counter-positioning under Helmer's framework requires that incumbents cannot respond without damaging their core business. Land-based resorts and all-inclusive hotels compete on price regularly. Consequently, Carnival's pricing advantage reflects a favorable market position rather than an insurmountable structural barrier.
Cornered resource — low to moderate, but genuinely improving. Carnival's cornered resources are physical and location-specific, led by its Alaska land-and-sea infrastructure—spanning lodges, glass-domed railcars, motorcoaches, and historic port priority established over three decades—and expanded by its private Bahamian and Caribbean destinations. Chief Executive Officer Josh Weinstein noted during the June 2026 earnings call that Carnival's scale and long-standing presence in Alaska have secured preferential access to embarkation ports and ports of call that are "increasingly difficult to replicate."9 Because berth access in environmentally and geographically constrained ports is strictly finite, competitors cannot easily construct alternative infrastructure or secure equivalent docking slots.
Process power — moderate to strong, and underappreciated. Operating a fleet of nearly 100 floating hotels across dozens of international jurisdictions requires complex, accumulated organizational capability. Carnival manages crew members from roughly 100 nations, maintains supply chains that provision vessels on moving itineraries, and deploys revenue-management systems pricing hundreds of thousands of cabins across an extended booking curve. These operational practices represent deep institutional knowledge built over decades that competitors cannot quickly acquire or duplicate.
Switching costs — low. Passengers face minimal barriers when switching between cruise lines, forfeiting only accumulated loyalty benefits. While tier status retains high-frequency cruisers, the broader mass-market audience remains highly sensitive to price and itinerary options. Low switching costs represent a key vulnerability in the industry's economic moat, explaining why capacity additions by rival cruise lines impact pricing power so directly.
Network effects — negligible. The cruise business model generates virtually no network effects. A passenger vessel does not become more valuable to an individual guest as total industry passenger volume grows.
Brand — moderate, and tier-specific. Carnival's individual operating brands maintain strong positions within specific regional or thematic niches: AIDA Cruises in Germany, P&O Cruises in the United Kingdom, Cunard Line in transatlantic ocean travel, and Carnival Cruise Line in mass-market family vacations. Outside these respective segments, brand power does not transfer across the portfolio. Furthermore, the parent corporate brand holds no direct consumer pull, remaining largely invisible to passengers except during major corporate or operational events.
Porter's Five Forces
Supplier power — very high, and the most underrated risk in the industry. The construction of large modern cruise ships is concentrated among three European shipyards: Fincantieri in Italy, Meyer Werft in Germany, and Chantiers de l'Atlantique in France. Carnival's existing ship orders rely primarily on Fincantieri and Meyer Werft.18 Shipyard building slots are booked years in advance, as demonstrated by Carnival's order for three new Princess vessels scheduled for delivery in 2035, 2038, and 2039.9 This concentration creates a dual effect: while restricted shipyard capacity disciplines broader industry berth growth and supports ticket pricing, it grants shipbuilders substantial leverage over construction costs, delivery schedules, and vessel specifications. Financial instability or labor disputes at any major yard represent a direct threat to fleet planning.
Threat of substitutes — high. Cruise lines compete for discretionary vacation spending against a broad array of land-based alternatives, including all-inclusive resorts, theme parks, traditional hotel chains, and home-based leisure activities. Because consumers face no contractual obligation or friction to choose alternative vacation formats, the threat of substitutes remains consistently high.
Rivalry — high, within a concentrated field. Global passenger capacity is dominated by three major operators: Carnival Corporation, Royal Caribbean Group, and Norwegian Cruise Line Holdings. High market concentration has not eliminated price competition, because cruise capacity expands in large, discrete increments. Introducing a single mega-ship adds thousands of berths to a specific regional deployment that must be filled regardless of immediate demand. Highlighting this competitive pressure, Weinstein noted during the June 2026 earnings call that rival cruise capacity in the Caribbean outside Carnival was growing by approximately 27% over a two-year period.9 This regional capacity expansion underscores how intense market rivalry continues to test net yield stability.
Buyer power — low. Individual retail passengers exercise low bargaining power, lacking collective negotiation leverage over ticket prices. However, travel agencies continue to intermediate a substantial share of bookings and earn commissions, capturing a portion of gross revenue. This distribution dynamic explains why Carnival's ongoing investments in direct-to-consumer digital channels and personalized marketing are critical to preserving net yields and reducing distribution costs.
Threat of new entrants — very low. Capital and operational barriers make new entrants extremely rare. A modern cruise vessel requires roughly $1 billion in capital and several years of construction time. Furthermore, operating a fleet demands established homeport agreements, global distribution networks, maritime safety infrastructure, and regulatory compliance across multiple international jurisdictions, preventing new competitors from entering the industry at scale.
Evaluating these competitive forces presents a clear analytical picture: Carnival operates within a structurally defended oligopoly, holding the industry's lowest unit cost structure alongside its weakest net yield position. Consequently, the industry's economic moat effectively shields the overall sector profit pool, while protecting Carnival's specific share of that pool to a lesser degree—a key distinction as the company balances debt reduction against commercial execution.
XI. The Skeptical Investor Stress Test & Risk Radar
Examining the activist bear case directly proves more instructive than setting up a straw man.
The bear pitch: Carnival remains a capital-intensive, cyclical, low-margin operator of depreciating steel assets, carrying roughly $28 billion of debt against $12.3 billion of book equity. It operates in a sector where the product is entirely discretionary, customers face zero switching costs, the supply chain is dominated by a three-firm shipyard oligopoly holding pricing power over operators, and tightening environmental regulations demand capital that could otherwise reduce debt. The business recently endured a four-year crisis that wiped out every dollar of accumulated retained earnings while doubling its share count. Meanwhile, its principal competitor generates half again as much EBITDA margin on two-thirds the revenue. Although management's turnaround is genuine, it coincided with an industry-wide post-pandemic pricing recovery that has begun to moderate, with fiscal 2026 net yield growth guided below 2% in constant currency. To compound these headwinds, Carnival's chief executive officer noted that competitors are expanding regional Caribbean capacity by 27% over two years—directly targeting the market where Carnival maintains its strongest cost advantage.
That case deserves serious evaluation, tested piece by piece.
Refinancing and the cost of capital. Balance sheet risk has improved substantially. Carrying $28.0 billion in total debt including finance leases against $7.2 billion of adjusted EBITDA at fiscal year-end 2025 presents a fundamentally healthier posture than $35.9 billion in debt against negative EBITDA in fiscal 2022.26 Completing $19 billion in refinancing within twelve months retired punitive emergency coupons and rebuilt the maturity ladder. Furthermore, reducing net debt to adjusted EBITDA to 3.1 times by the second quarter of fiscal 2026 brings leverage close to the PROPEL target of 2.75 times.69 Fitch's investment-grade recognition on leverage metrics carries practical value by lowering marginal borrowing costs across future debt tranches.6 The principal risk is no longer immediate solvency, but rather that a debt balance of this magnitude continues to absorb a substantial share of operating cash flow in interest expense, forcing dividend payouts and share buybacks to compete directly with deleveraging.
Fuel and environmental compliance. Fuel represents Carnival's most volatile operational expense and remains entirely outside management's control. During the second quarter of fiscal 2026, fuel prices rose nearly 30% year over year. Despite that headwind, the company expanded adjusted net income by more than 20%—offering a meaningful stress test of operational resilience.923 Efficiency gains offset higher commodity costs, as fuel consumption per ALBD fell more than 5% during the quarter following a 6% reduction the prior year.9 These compounding efficiency gains stem from introducing liquefied natural gas tonnage, hull air-lubrication technology, route optimization, and shore power capabilities.
Regulatory pressure presents a persistent multi-year challenge. The International Maritime Organization's 2023 greenhouse gas strategy established a mandate toward decarbonizing international shipping, while the European Union Emissions Trading System brought maritime emissions within a regional carbon pricing framework for voyages calling at European ports.[^31] This regulatory framework converts a previously unpriced operational footprint into a direct financial cost that escalates over time. Consequently, Carnival's PROPEL target of reducing emissions intensity by more than 25% versus 2019 represents essential cost control under a strict regulatory timetable. The long-term risk is that achieving further deep decarbonization will require alternative fuels that are not yet available at commercial scale and viable pricing, or capital expenditures on vessel retrofits and new tonnage that compete directly with debt paydown and shareholder returns.
Geopolitical route disruption — no longer theoretical. Geopolitical risk demonstrated its operational impact during fiscal 2026. Conflict in the Middle East, particularly maritime disruption around the Strait of Hormuz, reduced full-year net yield growth by approximately one percentage point. The impact concentrated in Mediterranean deployments and was compounded by elevated airfares and reduced transatlantic flight capacity for North American guests flying to Europe.9 Fleet mobility provides partial mitigation: cruise ships can be redeployed, and Carnival had decided the previous summer to reassign vessels away from winter 2026 Arabian Gulf itineraries—a decision Chief Financial Officer David Bernstein noted proved advantageous in hindsight.9 However, redeployment incurs logistical costs, requires long lead times to re-establish booking volumes, and cannot offset secondary headwinds like international flight availability. Fleet mobility limits operational damage but does not eliminate it.
Consumer discretionary pullback. Chief Executive Officer Josh Weinstein noted that second-quarter performance was achieved despite consumer sentiment remaining at historically low levels.9 Structural defenses have supported demand, led by value pricing relative to land-based vacations and a booking curve that management describes as the longest on record. By the start of the third quarter, 93% of fiscal 2026 capacity was already booked, with customer deposits reaching a record $9.0 billion.9 An extended booking curve provides a buffer by converting sudden demand shocks into gradual adjustments rather than immediate revenue drops. However, it also creates a lagging effect: pricing decisions committed today lock in revenue for up to eighteen months, meaning any period of discounted pricing takes a similar duration to clear from the booking pipeline.
A note on how management handles bad news, because it is an analytical fact. During the June 2026 earnings call, executive messaging maintained a consistent pattern: attributing performance shortfalls to specific operational drivers, defining clear mechanisms, and identifying trade-offs without offering unsupported projections. Addressing the revised yield guidance, Weinstein explained that management intentionally lowered European occupancy targets by a couple of points to protect price integrity rather than discounting cabins—accepting lower onboard revenue from fewer passengers to avoid resetting price expectations.9 Whether that trade-off proves optimal cannot be verified immediately, but articulating the shortfall as a deliberate operational choice distinguishes management's approach from purely external framing.
The term "transitory" warrants analytical scrutiny, as both executives applied it repeatedly to characterize geopolitical disruptions.9 While operational disruptions sometimes resolve quickly, labeling headwinds as transitory can also defer necessary adjustments to baseline expectations. Carnival's recent execution offers a counterexample: Weinstein acknowledged that tariff-driven market volatility in 2025 produced a lingering impact that persisted longer than expected.9 The test of this operational thesis will become visible on schedule—specifically whether European net yields return to positive year-over-year growth in fiscal 2027 as projected by management.
XII. Bear vs. Bull Case: The Investment Spine
Strip everything down and two coherent, evidence-based interpretations of Carnival emerge. Both are internally consistent, but they diverge on three specific empirical questions—each with a clear timeline for resolution.
The bear case
The equity has not been restored, and arithmetic may prevent full recovery. Fiscal 2025 delivered higher revenue than fiscal 2019 but lower net income, spread across double the share count.2 To restore fiscal 2019 earnings per share from current levels, Carnival would need to roughly double net income—from $2.76 billion to over $5.5 billion—with virtually no capacity growth in an industry with capped per-berth profit margins. PROPEL's target of more than 50% adjusted EPS growth by 2029 reflects substantial ambition, yet it still falls short of 2019 levels.10 The deleveraging thesis is financially sound, but by construction, it reclaims value previously destroyed rather than creating new equity value.
Structural yield drag is being managed rather than fixed. Lower-yielding European brands remain in the portfolio. The ship hardware gap relative to competitor fleets like Royal Caribbean's Icon class is not being closed, as confirmed by Carnival's modest order book. Carnival's private destination investments offer a partial offset, but not an equivalent revenue engine.
Supply discipline is an industry narrative, not a Carnival advantage. This represents the central tension in the bull case. The standard bullish thesis assumes shipyard constraints cap industry capacity growth in the low single digits against mid-single-digit demand growth, granting operators pricing power. Carnival's own restraint is real—under 1% capacity growth in fiscal 2026 and a planned cadence of one to two ships per year.910 However, Chief Executive Officer Josh Weinstein disclosed during the June 2026 earnings call that non-Carnival Caribbean capacity is expanding by approximately 27% over two years, noting with resignation: "give me two options, one is no growth and the other's 27, I'll take the no growth."9 Carnival's restraint is not being matched by rivals. In an industry with zero switching costs for guests, competing berths price local cabins. Restraint un-matched by competitors represents a market share concession rather than a competitive moat.
Decarbonization claims a significant share of future free cash flow. Capital needed to satisfy tightening International Maritime Organization and European Union regulations is substantial, incomplete in total definition, and directly competes with the $14 billion in shareholder distributions pledged under the PROPEL framework through 2029.10[^31]
The bull case
Deleveraging is a mechanical value transfer that is actively working. This forms the strongest pillar of the thesis, requiring neither valuation multiple expansion nor optimistic operational assumptions. Every dollar of debt retired through operating cash flow transfers a dollar of enterprise value from lenders to shareholders. Carnival has reduced total debt by more than $10 billion from its peak, lowered net debt to adjusted EBITDA from 3.4 to 3.1 times within two quarters, and targets 2.75 times.6910 As total debt shrinks and investment-grade metrics lower marginal borrowing costs, reduced interest expense flows directly to net income—a dynamic requiring only steady baseline operations.
Management holds a verified record of meeting public targets. The SEA Change plan hit its core financial targets eighteen months ahead of schedule, raising adjusted EBITDA per berth day by 52% and more than doubling return on invested capital.22 The PROPEL plan applies the same structured execution to a normalized baseline. While the earlier targets benefited from a post-pandemic recovery bounce, management's commitment to public, falsifiable multi-year metrics stands out in the industry.
Destination capture provides an owned, high-margin revenue engine. Projects like Celebration Key and RelaxAway transition third-party port visits into owned-asset days across roughly 85% of Caribbean itineraries, supported by newly completed pier infrastructure and a trajectory toward 3.5 million visitors at Celebration Key in 2027.9 Because major capital outlays are largely complete while revenue realization lies ahead, this financial asymmetry marks a key catalyst for the investment case.
Operating leverage compounds modest yield growth into net income. Fiscal 2026 second-quarter results demonstrated this dynamic: net yields rose 2.2%, unit costs excluding fuel remained flat, fuel costs jumped nearly 30%, and adjusted net income still expanded by more than 20%.9 With fleet capacity constrained and unit costs controlled, incremental yield gains convert efficiently into bottom-line earnings.
What actually decides it
Three key questions will determine the outcome, none of which current data can fully resolve:
Will the net yield gap relative to Royal Caribbean narrow or merely track parallel? Resolution: The net yield spread across fiscal 2027 and 2028.
Will competitor capacity additions undermine Carnival's Caribbean pricing power? Resolution: Stability of Caribbean net yields as 27% in new regional berths enters service.
Will management's structural cost reductions endure after operating pressure recedes? Resolution: Unit cruise costs excluding fuel per berth day in fiscal 2027 and 2028.
The three metrics worth tracking:
Constant-currency net yield per ALBD — specifically the spread against Royal Caribbean's unit net yield. This single metric reveals whether Carnival is closing its structural yield gap or simply moving alongside an industry-wide tide. Overall yield growth alone is insufficient; the relative spread provides the true signal.
Net debt to adjusted EBITDA. This ratio measures the pace of equity value recovery toward the 2.75 times target. It also serves as an early indicator of capital allocation priorities: if deleveraging stalls while share buybacks continue, corporate priorities have shifted.
Customer deposits. Reaching a record $9.0 billion, customer deposits offer the clearest forward-looking indicator of travel demand—representing committed cash for future sailings that cannot be obscured by corporate narrative.9 This metric consistently turns before yields reflect a shift.
XIII. Playbook Takeaways
Optimizing a legal structure for normal economic conditions can prove fatal during an extreme crisis. Carnival's Panamanian incorporation and foreign flags generated decades of genuine tax efficiency, yet during the 2020 collapse, that legal design disqualified the company from emergency government support that stabilized comparable U.S. travel enterprises.3 The lesson is not that tax optimization is inherently flawed, but that structural architecture carries contingent liabilities invisible in cost-of-capital models until a tail event arrives—liabilities Carnival ultimately paid to unwind by collapsing its dual-listed structure and redomiciling to Bermuda in 2026.
In a zero-revenue crisis, speed of capital access dominates cost of capital. Securing debt at an 11.5% interest rate in April 2020 appeared ruinous, yet proved essential for survival.4 Attempting to negotiate lower rates while burning cash risked insolvency and bankruptcy restructuring. However, the second half of the lesson is often overlooked: the cost of emergency capital persists for years through elevated interest expense and a permanently doubled share count—a burden borne entirely by pre-crisis shareholders rather than the providers of rescue capital.
Publishing falsifiable, multi-year targets can rebuild corporate credibility—or destroy it if missed. The SEA Change program succeeded because its goals were specific, quantified, time-bound, and ultimately exceeded.[^25]22 Exceeding those targets established the operational credibility required for investors to accept the subsequent PROPEL framework as a concrete strategy rather than a vague aspiration. The underlying asymmetry is stark: an executive team that achieves published targets earns durable market confidence, whereas one that repeatedly misses forfeits its ability to guide expectations.
Acquisition roll-ups reliably purchase volume, but unreliably compound returns—a distinction financial accounting eventually exposes. Carnival assembled the largest brand portfolio in cruising, only to write off roughly 80% of the goodwill that expansion accumulated.213 The Holland America transaction acquired a non-replicable land-and-sea infrastructure in Alaska that compounded value for thirty-five years. By contrast, European acquisitions added scale and corporate overhead alongside severe operational liabilities and a persistent structural yield gap. The defining variable was neither transaction size nor price, but whether an acquired asset possessed structural advantages that competitors could not replicate.
Capital discipline is most valuable when market incentives least reward it. Limiting fleet expansion to one or two ships per year while competitors expand Caribbean capacity by 27% may appear to cede market share.9 Yet strict supply restraint represents the only policy aligned with balance-sheet deleveraging, avoiding the cruise industry's historic failure mode of ordering ships during cyclical peaks only to take delivery during downturns. The true test of this capital discipline is not whether it holds while debt levels remain elevated, but whether management maintains restraint once leverage reaches its 2.75 times target and borrowing capacity re-emerges.
XIV. Grading & Final Verdict
Evaluating a half-century corporate trajectory invites definitive grades. The empirical record, however, supports a more nuanced assessment: evaluating each major strategic decision and leadership tenure against disclosed results, with counter-evidence given equal weight.
The Holland America acquisition (1989) stands out as the single transaction in Carnival's history with an unambiguously favorable 35-year record. At a purchase price of $625 million, it secured a premier brand and built a dominant Alaska land-and-sea infrastructure — hotel lodges, glass-domed railcars, motorcoaches, and preferred port access — that executive leadership still highlights in 2026 as a key competitive moat.119 Its lasting value derived not from additional vessel tonnage, but from non-replicable physical land assets — precisely what later European acquisitions failed to deliver.
The P&O Princess takeover (2003) achieved its strategic goal while imposing persistent structural costs that required 23 years to resolve. The combination secured Princess Cruises and AIDA Cruises, establishing global capacity leadership. Yet it also brought sub-scale regional operations that remained in liquidation through 2025, alongside a dual-listed framework whose May 2026 collapse management justified on grounds of liquidity, valuation discovery, and administrative expense — an explicit acknowledgment of its long-term operational drag.7918 Comparative performance reinforces the trade-off: Royal Caribbean, the rival bidder that lost the takeover contest, has maintained materially higher operating margins ever since.24
The Costa acquisitions (1997–2000) present the most problematic return profile in the portfolio. The deal delivered rapid Southern European expansion that organic growth could not match. However, it also brought the 2012 Costa Concordia disaster — resulting in 32 fatalities, a $2 billion salvage operation, years of litigation, and enduring brand damage — while anchoring Carnival within a segment characterized by structurally depressed unit yields.19 While a maritime disaster is not a predictable acquisition outcome, corporate culture transfers with acquired assets, and the decentralized safety governance that allowed the accident reflected a history of managing acquired brands as a loose federation.
Ted Arison introduced the foundational insight of modern cruising: inverting passenger shipping economics by transforming the vessel from a means of transit into the primary destination. Positioning the voyage as a resort experience broadened the addressable market from affluent travelers to middle-class families, converting initial ticket sales into entry fees for high-margin onboard revenue. Five decades later, that economic framework continues to dictate strategy, including $600 million private island developments. That core concept, however, did not instantly create an unassailable business moat; it required a decade of fragile operations, fuel shocks, and high-maintenance secondhand ships before scale economics took hold.
Micky Arison built the scale and multi-brand portfolio that define the modern enterprise. His three-decade tenure produced both sides of Carnival's financial history: acquiring the high-return Alaska infrastructure alongside billions in eventual goodwill write-offs, and establishing global capacity leadership alongside a persistent net yield deficit relative to key peers. As chairman of the board, he retains an active role on earnings calls and holds roughly 8% beneficial ownership.219 That equity alignment provides long-term governance continuity, even as family ownership was diluted alongside public shareholders during the emergency capital raises of 2020.
Arnold Donald assumed leadership at a reputational low point, executing the vital work of centralizing maritime safety, environmental compliance, and procurement across previously autonomous brand units. However, his tenure also coincided with pre-pandemic margin erosion — when revenue expanded while net income declined — and left the company with a capital structure that possessed minimal operational buffer for a prolonged zero-revenue stoppage, though virtually no global travel provider was capitalized for a total operational freeze.
Josh Weinstein established the clearest operational record among Carnival's chief executives. He outlined explicit public targets and beat them early, lowered total debt by more than $10 billion, maintained strict shipbuilding discipline while competitors expanded, sunset underperforming regional brands, collapsed the cumbersome dual-listed corporate structure, and restored dividend payments and share buybacks on a planned schedule.691018 Against those achievements, fiscal 2026 required cutting full-year yield growth guidance by a percentage point despite an 85% booked position, structural cost savings remain unverified past a single quarter, and the underlying financial challenge — earning lower returns per berth than Royal Caribbean — remains unresolved.
The verdict, such as it is. Carnival in 2026 is a successfully repaired enterprise that has yet to prove it is a fundamentally superior business. Balance sheet repair is tangible and largely mechanical: debt paydown lowers interest expense, directly restoring equity value previously ceded to debt holders. The unproven second act centers on whether private destinations, commercial yield management, and fleet modernization can bridge a persistent competitive margin gap in a market where rivals are adding regional capacity four to five times faster than Carnival.
An enterprise that originated with a single dollar and a grounded ship has repeatedly survived severe existential tests. That operational endurance is proven. However, forward-looking equity returns will not depend on historical resilience, but on three measurable quarterly metrics: the competitive yield spread, the net leverage ratio, and total customer deposits.
References
-
Epidemiology of COVID-19 Outbreak on Cruise Ship Quarantined at Yokohama, Japan, February 2020 — Emerging Infectious Diseases, CDC, 2020-11 ↩
-
Carnival Corporation & plc — Annual financial statements, Forms 10-K (fiscal 2016–2025) — U.S. Securities and Exchange Commission ↩↩↩↩↩↩↩↩↩↩↩↩↩↩↩↩
-
Carnival Cruises CEO on Panama incorporation, U.S. bailouts and taxes — Fortune, 2020-04-17 ↩↩↩
-
Carnival raises $4 billion in bond sale paying 11.5% interest — Reuters, 2020-04-01 ↩↩↩
-
Cruise ship company Carnival to raise $6 billion in stock and debt — CNBC, 2020-03-31 ↩↩
-
Carnival Corporation & plc Achieves Record Full Year Adjusted Net Income and Investment Grade Leverage Metrics, Reinstates Dividend — PR Newswire, 2025-12 ↩↩↩↩↩↩↩↩↩↩↩↩↩↩
-
Carnival Corporation & plc — Results of Special and Annual Meetings, Form 8-K — U.S. Securities and Exchange Commission, 2026-04-17 ↩↩↩
-
Court Sanction of Scheme of Arrangement — PR Newswire, 2026 ↩↩
-
Carnival Corporation Ltd. (CCL) Q2 2026 Earnings Call Transcript — Seeking Alpha, 2026-06-23 ↩↩↩↩↩↩↩↩↩↩↩↩↩↩↩↩↩↩↩↩↩↩↩↩↩↩↩↩↩↩↩↩↩↩↩↩↩↩↩↩↩↩↩↩↩↩↩
-
Carnival Corporation & plc Achieves Record First Quarter Operating Results and Record Bookings — PR Newswire, 2026-03 ↩↩↩↩↩↩↩↩↩↩
-
History of Carnival Corporation — FundingUniverse / International Directory of Company Histories ↩↩↩↩↩↩↩↩↩↩↩
-
Carnival Corporation & plc Investor Relations — Carnival Corporation Ltd. ↩
-
Carnival Corporation & plc — Fiscal 2020 Annual Report financial statements (goodwill and ship impairments), Exhibit 13 to Form 10-K — U.S. Securities and Exchange Commission, 2021 ↩↩
-
Carnival Launches Hostile Offer for P&O Princess — The Wall Street Journal, 2001-12-17 ↩
-
P&O Princess Cruises agrees to Carnival's $5.3B takeover offer — Maryland Daily Record, 2003-01-08 ↩
-
P&O Princess Cruises plc — Form 6-K on the Carnival dual-listed company transaction — U.S. Securities and Exchange Commission, 2003 ↩
-
Carnival to consolidate P&O Cruises Australia into Carnival Cruise Line — Seatrade Cruise News, 2024-06-04 ↩
-
Carnival Corporation & plc — Annual Report on Form 10-K for the fiscal year ended November 30, 2025 — U.S. Securities and Exchange Commission, 2026-01-27 ↩↩↩↩↩↩↩↩
-
Carnival Corporation & plc names Josh Weinstein President and Chief Executive Officer — Form 8-K Exhibit 99.1, U.S. Securities and Exchange Commission, 2022-05 ↩↩
-
Carnival plc — Schedule 13D/A beneficial ownership filing (Arison family entities) — U.S. Securities and Exchange Commission, 2025 ↩↩
-
Carnival Corporation & plc Tops Guidance Achieving Highest-Ever Second Quarter Operating Results and Exceeding 2026 SEA Change Financial Targets 18 Months Early — PR Newswire, 2025-06-24 ↩↩↩
-
Carnival Corporation Delivers Record Second Quarter Revenues, Net Yields and Adjusted Net Income — PR Newswire, 2026-06-23 ↩↩↩↩↩↩
-
Royal Caribbean Group Reports 2025 Results, Issues 2026 Guidance — PR Newswire, 2026-01 ↩↩↩
-
Carnival Cruise Line breaks ground on new Grand Bahama destination — Carnival Corporation, 2022-05-12 ↩
-
Carnival Cruise Line Opens $600M Celebration Key, Its Spectacular New Exclusive Destination — Carnival Cruise Line, 2025-07-19 ↩
 LinkedIn
 WhatsApp
 Reddit
 Hacker News
 Email
Email Kindle
 RSS Feed
 Spotify
 Apple Podcasts
 Amazon Music
 Audible
 YouTube