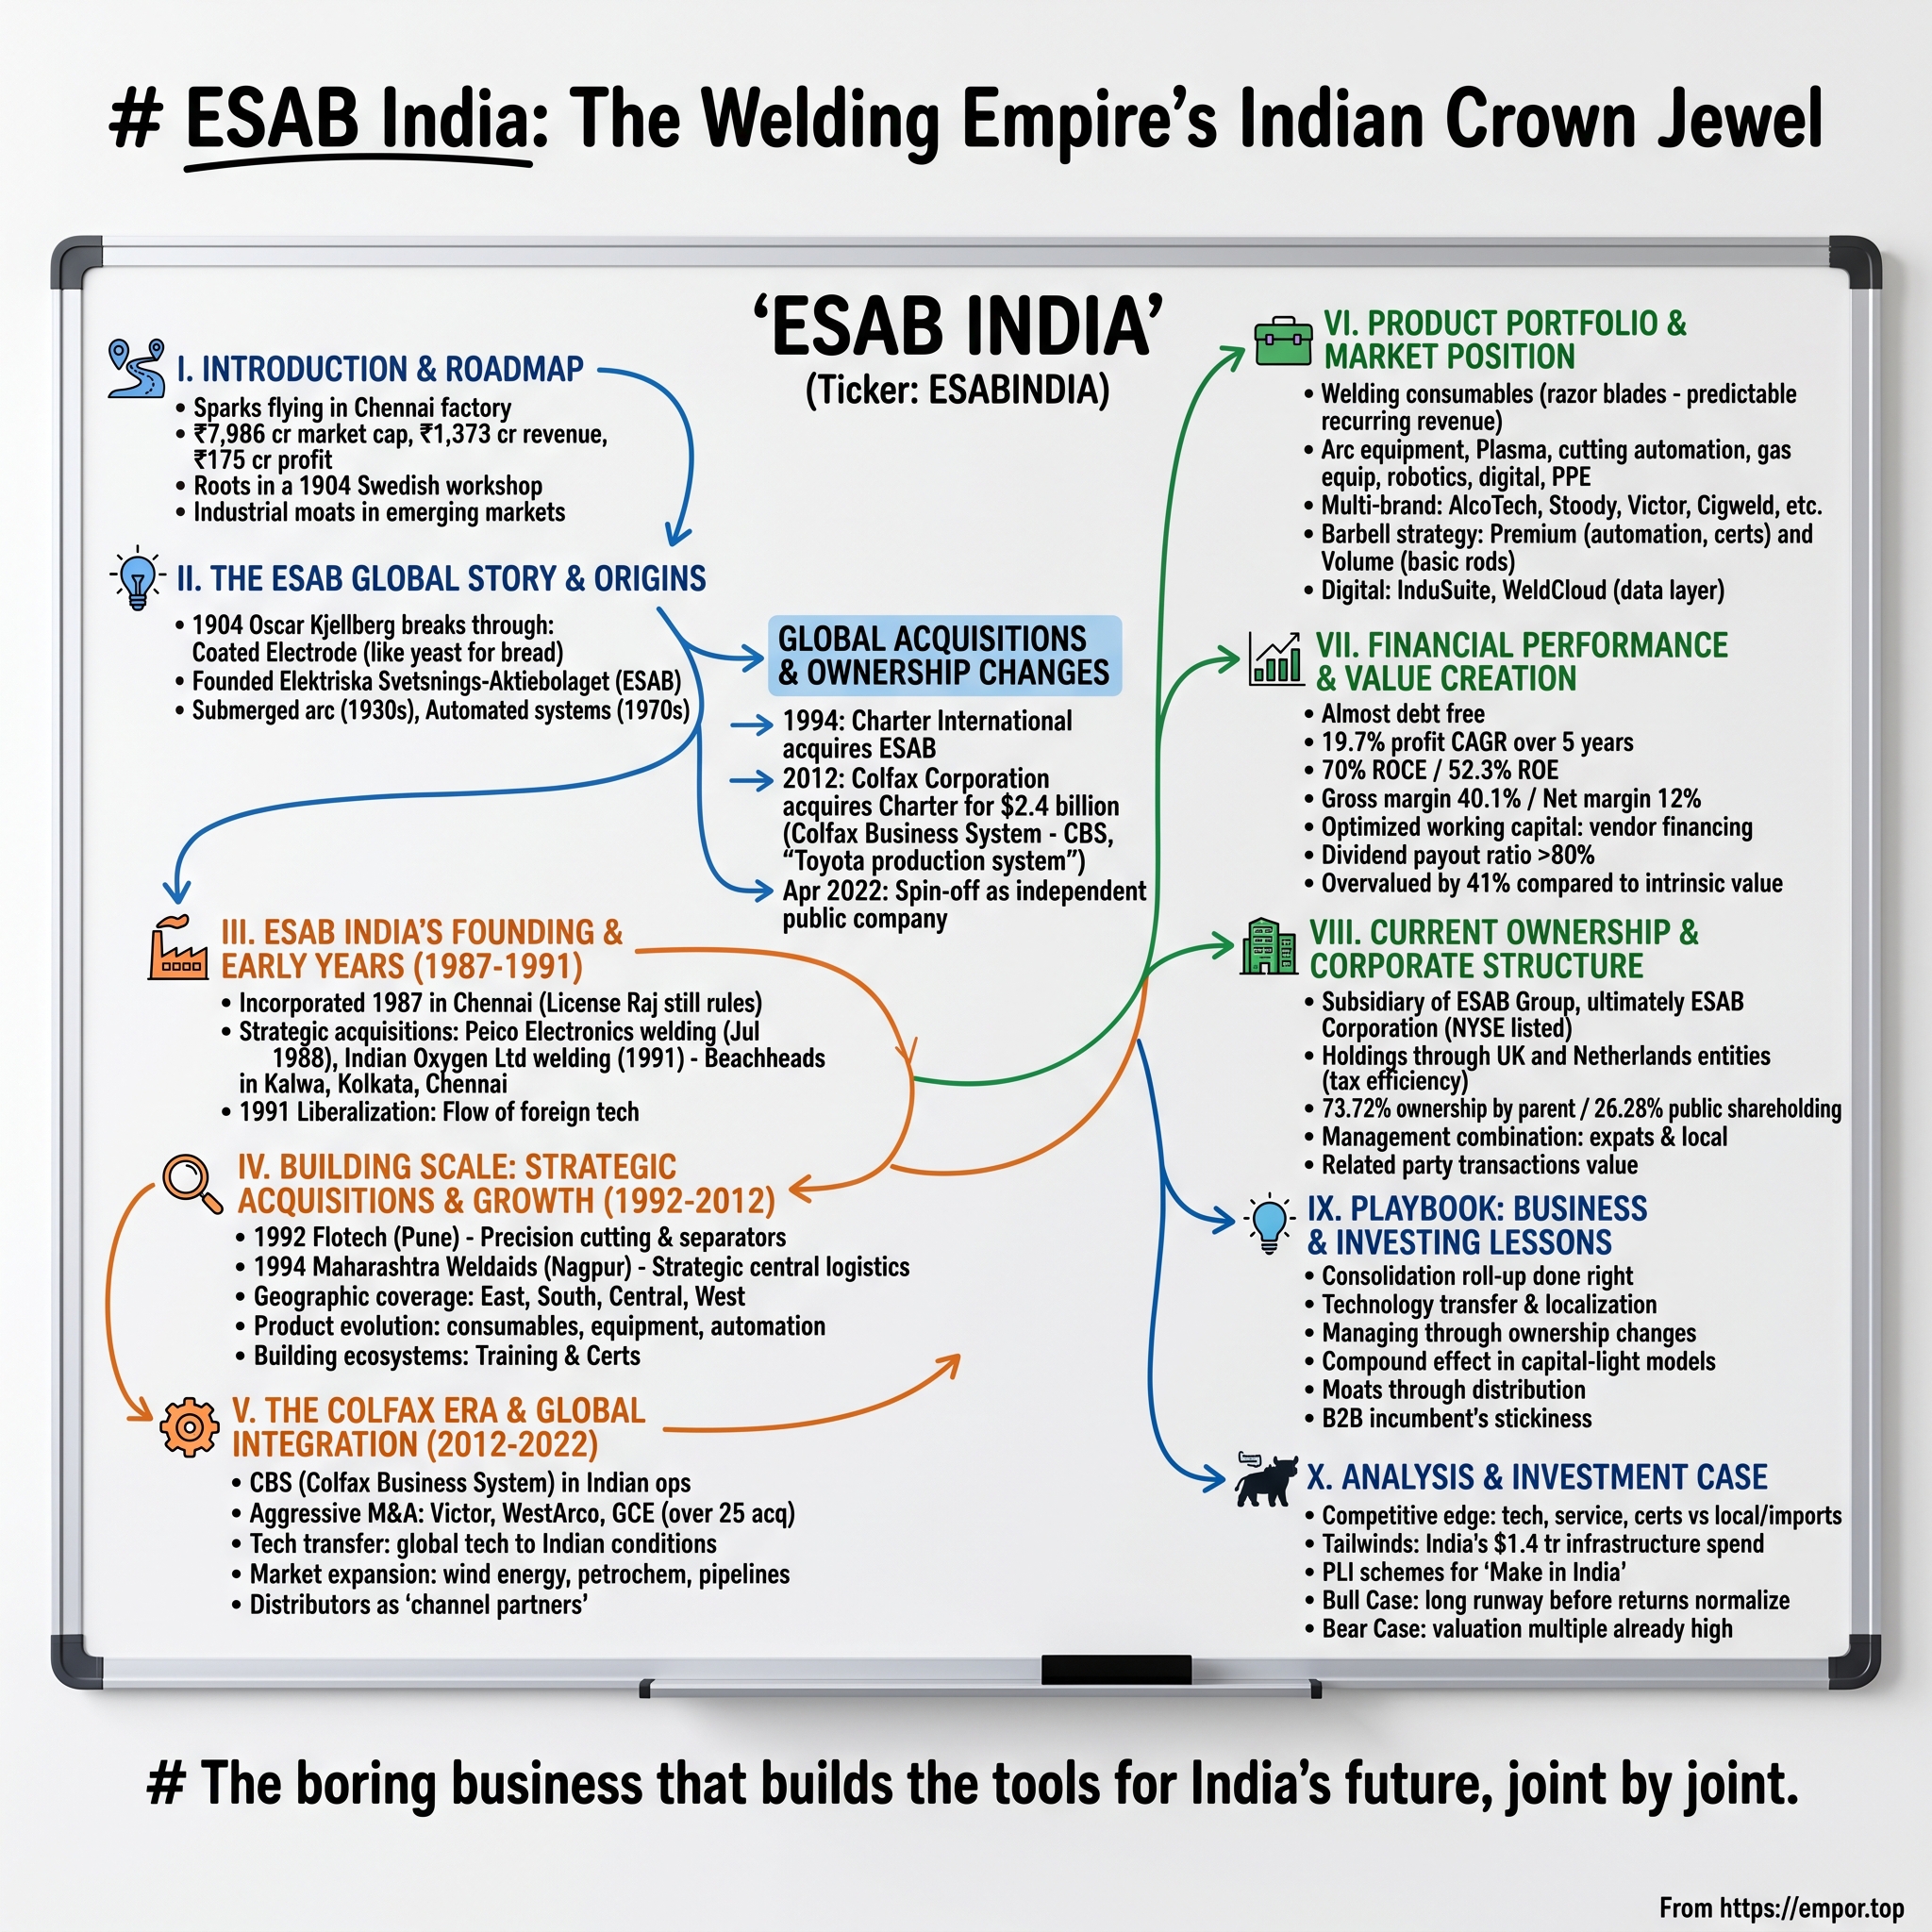
ESAB India: The Swedish Arc Welding Powerhouse Dominating India's Industrial Backbone
I. Introduction & Episode Roadmap
On large Indian industrial construction sites, a vital step occurs away from the cameras. A steel beam is hoisted into place, a crane holds its weight, and a welder in a protective apron crouches at the joint with a coated metal electrode. An arc is struck. For ninety seconds, intense heat binds the two pieces of steel. Once the arc extinguishes, the crane releases its load, and the structure stands independently.
That ninety-second process represents the core product ESAB India sells. The business delivers the consumable value of that transient arc hundreds of millions of times across India's industrial landscape.
It is a distinctive manufacturing model. India's infrastructure development—spanning LNG terminals, nuclear containment vessels, naval destroyers built at Mazagon Dock, wind turbine towers assembled in Gujarat, and 100-metre rail sections flash-butt welded into continuous track—relies on consumables that are vaporized during application. Every metre of weld requires electrodes, wire, or flux that must be replenished continuously. Customers do not buy a permanent asset; they pay recurring costs per weld.
This dynamic produces financial metrics rarely seen in heavy industrial manufacturing. As of September 2026, ESAB India Limited held a market capitalization of approximately ₹8,660 crore, with its stock trading near ₹5,618 per share at a trailing price-to-earnings multiple of roughly 42 times.1 The equity trades on both the National Stock Exchange under the ticker ESABINDIA and the BSE.1211 For the fiscal year ended March 2026, the company generated total revenue of ₹1,514 crore, representing a 9.6% year-over-year increase, while profit after tax rose 17.8% to ₹206.7 crore, producing earnings per share of ₹134.30.2 Operating margins remained stable at approximately 18%.1
The capital efficiency metrics further set the company apart. Return on capital employed reached approximately 64.7%, trailing return on equity approached 49%, and the dividend payout ratio stood near 72%. The business funded its ongoing operational and capital requirements entirely through internal cash flow, maintaining a debt-free balance sheet.14
A 64.7% return on capital employed is atypical for traditional equipment manufacturing. It reflects a model requiring minimal incremental capital to expand revenue, as historic capital expenditure absorbed core capacity needs, leaving expansion primarily dependent on working capital rather than new manufacturing facilities. Capital expenditure in FY2025 totaled ₹31.10 crore, compared to ₹28.18 crore in FY2024—representing about 2% of annual sales. These outlays funded facilities for a global R&D center, line refurbishments, "marginal capacity enhancements," and IT upgrades.4 The allocation toward "marginal capacity enhancements" underscores a strategy focused on incremental optimization rather than major greenfield builds.
Why, then, is ESAB India not viewed as an unquestioned compounder without qualification? Because its operational advantages are tied to structural questions regarding value capture and corporate governance.
The company is 73.72% owned by US-based ESAB Corporation (Delaware), held via ESAB Holdings Limited in the UK and Exelvia Group India B.V. in the Netherlands.4 ESAB India engages in regular commercial transactions and R&D services with parent affiliates, operating within a global product and geographic framework dictated by the parent entity. Furthermore, the company reports financial results as a single operating segment, providing no audited revenue breakdown between consumables and equipment because the chief operating decision maker evaluates operations as a single unit.4 Consequently, market assumptions regarding the product mix rely on estimates rather than audited segment disclosures—a distinction that requires careful separation throughout this analysis.
The roadmap for this study follows a clear progression: * First, the Swedish origin: Oscar Kjellberg's invention of the coated electrode, and how a 1904 chemical innovation established the industry's structural dynamics. * Second, the Indian market entry: a patient, license-era consolidation executed between 1987 and 1994 rather than a greenfield expansion. * Third, the corporate ownership history: from Charter International through Colfax and the Danaher-derived management systems of the Rales brothers, leading to the 2022 spin-off that established a standalone NYSE-listed parent. * Fourth, the modern product structure: analyzing the economic differences between welding consumables and equipment. * Fifth, the competitive landscape: evaluating market positioning against Ador Welding, Lincoln Electric, and specialized alloy producers through the analytical frameworks of Michael Porter and Hamilton Helmer. * Sixth, stress-testing performance: examining moat strength during cyclical downturns and assessing governance through related-party transaction disclosures. * Seventh, automation and digital initiatives: distinguishing between product introduction and actual earnings generation. * Eighth, the investment synthesis: detailing the bull and bear arguments, risk factors, operational playbook, and key monitoring metrics.
The history begins outside India, in a Gothenburg workshop where an engineer sought to solve the problem of brittle welds.
 Subscribe on LinkedIn
II. The Global Swedish Innovation Legacy & Corporate Evolution (1904–2012)
Gothenburg in the early years of the twentieth century was a shipbuilding hub on Sweden's west coast—a landscape of cold water, riveted hulls, and metalworking where permanently joining two pieces of steel meant hammering a red-hot rivet through both. Electric arc welding existed, but it was too unreliable for structural applications.
The underlying problem was metallurgical chemistry. Melting steel with an electric arc creates a small pool of liquid metal at roughly 1,500°C exposed to ambient air. Because air consists of roughly 78% nitrogen and 21% oxygen, both gases readily dissolve into molten iron. As the weld pool cools, those dissolved gases form internal bubbles and brittle compounds, yielding a joint prone to cracking under structural strain.
Oscar Kjellberg's 1904 patented solution replaced mechanical shielding with integrated chemical protection. By coating a bare steel electrode in mineral flux, the burning arc decomposes the coating into a protective shielding gas while forming a floating slag blanket over the cooling weld pool. This slag shields the molten metal from atmospheric contamination and introduces necessary alloying elements. Kjellberg founded Elektriska Svetsnings-Aktiebolaget—the Electric Welding Company, ESAB—in Gothenburg that same year to commercialize the innovation.10
That chemical insight shaped the long-term competitive dynamics of the welding industry. The electrode evolved from a simple wire into a precise chemical formulation wrapped around a metal core. That formulation determines whether a finished joint survives North Sea wave impacts, cryogenic storage at minus 165°C, decades of neutron exposure in a nuclear reactor, or the pressure cycles of a submarine hull. Because buyers cannot evaluate a weld visually, products require rigorous, destructive testing against technical codes. Once a formulation passes certification, industrial customers face high switching costs and little incentive to change suppliers. Kjellberg's technical solution effectively established a certification-gated, recurring-revenue business model.
Throughout the twentieth century, ESAB expanded into submerged arc welding, specialized flux formulations, and automated cutting systems, establishing itself as a technical benchmark across European maritime and heavy industrial fabrication. Its market position relied less on direct brand advertising than on having its product specifications embedded directly into shipyard and boiler construction standards.
Then came the ownership era, shifting the company's strategic center away from Sweden.
In 1994, ESAB was acquired by Charter International plc, a UK-headquartered industrial holding company.10 Charter operated ESAB as a global platform and expanded its reach into emerging markets. In January 2012, Colfax Corporation acquired Charter International in a transaction valued at approximately $2.4 billion, bringing both the ESAB welding business and Howden's air-and-gas handling operations under Colfax ownership.[^8]
Colfax's involvement brought significant operational changes due to its primary sponsors, Mitchell and Steven Rales, who had previously founded Danaher Corporation. Danaher pioneered the adaptation of Japanese kaizen continuous improvement techniques into the Danaher Business System—a management framework centered on standardized problem-solving, waste elimination, daily visual management, and margin expansion across acquired industrial assets.
Colfax deployed its customized framework, the Colfax Business System, across ESAB's global network, including its Indian operations. The methodology focused on incremental operational efficiencies: reducing line changeover times for electrode extrusion, minimizing scrap in flux batching, shortening inventory cycles, and standardizing operational countermeasures across manufacturing plants. Operational disclosures reflect this continuous improvement focus; for example, ESAB India's FY2025 technology absorption disclosures highlighted productivity gains from an advanced extruder line featuring a continuous tunnel-and-chain oven and automated packing.4 Management also repeatedly emphasized leveraging "global business tools and best practices."4
However, separating management system-driven productivity from broader macroeconomic tailwinds requires analytical nuance. During periods of favorable raw material pricing and strong industrial demand, margin expansion may reflect external market conditions rather than internal operational discipline. Indeed, ESAB India's FY2025 annual report noted that "relatively softer commodity and input costs helped manage pricing pressures and margins."4 This distinction highlights how cyclical factors intersect with operational improvements—a dynamic this study examines further when evaluating performance during less favorable market conditions.
Before evaluating those operational metrics, a broader strategic question arises: how did a Swedish welding pioneer establish a dominant market presence in Indian industrial fabrication? Rather than relying on greenfield expansion, the company executed a targeted acquisition strategy.
III. The Indian Roll-Up Era: Incorporating and Buying Scale (1987–2008)
Before India's 1991 economic reforms, entering the country's industrial market presented formidable regulatory barriers for foreign manufacturers. Industrial licensing strictly governed production allocations and plant capacities, while tight controls applied to imports and foreign equity. For a welding manufacturer, building a greenfield facility from scratch entailed years of administrative approvals before extruding its first electrode. Because welding consumables are heavy, low-value-density products that cannot be shipped economically from overseas, establishing a local manufacturing footprint near industrial steel hubs was mandatory.
Rather than navigating complex greenfield licensing delays, ESAB secured immediate capacity by acquiring established domestic operations.
ESAB India Limited was incorporated in November 1987 and commenced operations in July 1988 by acquiring the welding division of Peico Electronics & Electricals Ltd—the Indian Philips entity—including its plant at Kalwa in Maharashtra.10 By purchasing an operational business complete with existing staff, customers, and regulatory approvals, ESAB bypassed licensing delays to secure immediate domestic manufacturing capacity.
The expansion accelerated in 1991, during India's balance-of-payments crisis and initial economic liberalization. That year, ESAB India acquired the welding division of Indian Oxygen Ltd—later BOC India and now Linde India—gaining three plants across Kolkata in West Bengal and Chennai in Tamil Nadu.10 As the incumbent industrial gas and welding provider, Indian Oxygen offered established distribution channels into major heavy-engineering clusters, instantly transferring vendor approvals and customer relationships that typically require years to build.
ESAB India maintained its targeted acquisition strategy over the following three years. In 1992, the company acquired a controlling stake in Flotech Welding & Cutting Systems Ltd in Pune, introducing mechanized cutting machines to its portfolio and moving up the value chain from consumables into equipment.10 In 1994, it merged with Maharashtra Weldaids Ltd, adding a manufacturing facility in Nagpur.10 By the mid-1990s, ESAB India operated manufacturing hubs across western, eastern, southern, and central India, offering a product line ranging from stick electrodes to advanced cutting systems.
This sequence of acquisitions reflected a deliberate strategy where each transaction resolved a specific operational bottleneck. The Peico purchase provided immediate licensed capacity; the Indian Oxygen deal delivered distribution reach and institutional credibility; the Flotech acquisition added hardware capability to drive consumable attach rates; and the Weldaids merger reduced regional shipping costs. In consumable manufacturing, proximity to demand directly shapes cost structure, as long-distance freight quickly consumes margins on bulk products.
The company's first major greenfield investment came twenty years after its market entry. In 2008, ESAB India commissioned a facility at Irungattukottai near Sriperumbudur in Tamil Nadu—the center of the Chennai automotive and engineering belt—consolidating higher-volume equipment and specialized filler metal production.10 Initiating greenfield construction only after the licensing regime was dismantled and specific product demand was established demonstrated a disciplined approach to capital allocation.
Layered over this physical plant network is a broad distribution system. Welding consumables are purchased by a highly fragmented customer base, comprising several hundred large engineering contractors alongside tens of thousands of small fabrication shops in industrial hubs like Rajkot, Coimbatore, Ludhiana, Faridabad, and Rourkela. Serving these widespread buyers directly is economically impractical, making a multi-tier distributor network essential. Although ESAB India does not disclose headline distributor figures in statutory reports, management explicitly identified the expansion of its distributor network—alongside productivity gains—as a core driver of sales and earnings stability during a flat FY2025 market.4
Plant distribution also carries important technical implications for product quality. Welding consumable flux coatings are hygroscopic, absorbing atmospheric moisture if exposed during transit or storage. When heated during welding, absorbed moisture releases hydrogen into the weld pool, creating a risk of delayed structural cracking. Consequently, packaging, storage, and transit times serve as vital quality controls. A localized supply chain enhances product integrity, making the pan-India manufacturing footprint established between 1988 and 1994 a key technical asset alongside its commercial advantages.
Management's reliance on distributor expansion and productivity improvements during softer market conditions demonstrates how distribution reach can sustain financial performance when broader industry volume growth slows.
While the domestic roll-up built ESAB India's manufacturing and distribution footprint, the company's subsequent strategic direction was shaped by corporate decisions within its international parent organization.
IV. The Colfax Restructuring & Corporate Split (2012–2022)
For an ESAB India shareholder, the decade following Colfax's 2012 acquisition presented a striking contrast: operational routines on the factory floor remained largely unchanged, even as corporate ownership underwent major structural shifts above them.
Colfax integrated the acquired business into its Fabrication Technology division and executed a continuous acquisition strategy characteristic of a Danaher-lineage parent. Over the following decade, the fabrication platform absorbed a series of bolt-on acquisitions spanning welding, cutting, and gas control equipment, including Victor Technologies, Thermal Dynamics, Soldexa in Latin America, EWAC Alloys in India, TBi Industries in torches, and GCE in gas control.13 Individually, these additions were incremental, but collectively they transformed ESAB from a consumable-focused supplier with attached hardware into a comprehensive fabrication vendor capable of equipping an entire shipyard—from electrodes, wire, and flux to power sources, plasma cutters, torches, regulators, and protective gear.
The operational impact on the Indian subsidiary was subtle yet significant. Rather than merely introducing new finished products, global acquisitions granted ESAB India the right to localize manufacturing, branding, and distribution for product lines whose initial R&D costs were funded globally. EWAC Alloys provides a clear illustration; it remained a distinct related entity rather than merging directly into ESAB India. In FY2025, ESAB India's transactions with EWAC Alloys Limited reached ₹86.50 crore, or 6.96% of turnover, prompting the company to seek shareholder approval for up to ₹200 crore in related-party dealings.4 Similarly, transactions with Switzerland-based ESAB Europe GmbH—covering purchases of raw materials, components, finished goods, and intellectual property rights—totaled ₹118.81 crore, representing 9.56% of turnover.4
Combined, related-party flows through just these two parent affiliates approached 17% of ESAB India's annual revenue. This structure highlights a key operational reality: a domestic manufacturing and distribution network operating inside a global supply and IP framework. While this integration grants the Indian entity access to a product catalog far broader than its ₹1,514 crore annual revenue base could independently support, it also creates an ongoing pathway for financial value to flow across corporate boundaries.
By the early 2020s, Colfax shifted its corporate focus, opting to unwind its conglomerate structure after building a medical technology business alongside its industrial fabrication operations. To separate the unrelated units, Colfax executed a corporate split. On April 4, 2022, Enovis—the renamed Colfax entity—distributed one share of ESAB Corporation common stock for every three Enovis shares held as of the March 22, 2022 record date, with both stocks commencing regular-way trading on the New York Stock Exchange under ticker symbols ENOV and ESAB on April 5, 2022.56
The 2022 split re-established ESAB as an independent, publicly traded parent entity focused exclusively on welding and cutting technologies. In full-year 2025, standalone parent ESAB Corporation reported sales of $2,843 million, representing a 4% reported gain but roughly flat core organic growth, along with core adjusted EBITDA of $540 million at a 20.0% margin and diluted earnings per share from continuing operations of $4.10.7
For ESAB India, this standalone parent structure carries dual implications.
On one hand, pure-play focus aligns global R&D investments directly with the subsidiary's target market, including advances in flux chemistry, pulse waveform control, and digital automation interfaces. The FY2025 annual report noted that ESAB India expanded its service revenue by providing R&D services to related entities, leveraging domestic cost competitiveness and engineering talent.4 Consequently, the Indian entity functions not only as a domestic sales market but also as a regional engineering center within the group.
On the other hand, a standalone parent company faces heightened pressure to optimize overall corporate returns across its global holdings, creating structural tension for ESAB India, where public minority shareholders hold the remaining 26.28% equity interest.4 Given that the parent entity experienced flat core organic growth globally in 2025, high-single-digit to low-double-digit growth in India represents a vital strategic asset. This performance provides a compelling rationale for the parent to invest locally, while simultaneously creating incentives to route group activities and set transaction terms at the global corporate level.
This governance dynamic introduces strategic trade-offs that require detailed examination when evaluating related-party transaction disclosures and minority shareholder alignment. Transitioning from corporate structure to product economics, the analysis next turns to how the business operates on the ground—examining the structural differences between welding consumables and equipment platforms.
V. The Modern Core: Consumables, Equipment, and Industry Structure
Inside a mid-sized Indian fabrication shop making pressure vessels, wind tower sections, or railway wagon underframes, ESAB's business model is visible across the factory floor.
Against one wall stand humming yellow power sources, some of them a decade old. Bolted to the floor, a CNC gantry drags a plasma torch across a steel plate, cutting profiles with a steady hiss. Distributed across the facility are the consumables: cardboard drums of flux-cored wire, sealed tins of low-hydrogen electrodes stored in heated ovens to prevent moisture contamination and subsequent weld cracking, sacks of submerged arc flux, gas regulators, and auto-darkening helmets.
The power source represents a one-time capital purchase. Everything else is reordered continuously.
The consumables half. This category encompasses coated stick electrodes for manual welding, solid wires for MIG and TIG applications, flux-cored wires, submerged arc wire-and-flux combinations, and specialty alloys for hardfacing and joining dissimilar metals. The underlying economics mirror a classic razor-and-blades model: the welding machine functions as the long-life razor, while consumables are purchased by the kilogram. Demand depends not on the total installed machine base, but on the volume of steel fabricated—tonnage rather than units—supplemented by a baseline of maintenance and repair work that continues even during construction lulls. That maintenance floor prevents consumables revenue from evaporating during downturns, though it remains insufficient to maintain profit margins on its own during severe contractions.
The equipment half. This segment includes manual power sources, mechanised and CNC plasma cutting systems, gas control equipment, regulators, torches, automation cells, and personal protective gear. Gross margins on hardware are structurally lower than on formulated consumables, as standard hardware competes against catalog specifications rather than certified chemical formulations. However, equipment creates an operational lock-in. A facility operating ESAB pulse MIG power sources and wire feeders naturally leans toward ESAB wire, because the equipment's synergic programs are calibrated to specific wire diameters and metallurgical compositions. Switching wire suppliers requires recalibrating the entire fabrication workflow.
An essential caveat for financial analysis: ESAB India does not disclose a consumables-versus-equipment revenue split. Its audited financial statements state that operations constitute a single segment—fabrication technology—and that the chief operating decision maker evaluates performance as a unified unit, resulting in no reportable segment under Ind AS 108.4 The widely cited 70/30 consumables-to-equipment revenue breakdown remains an external estimate based on industry structure and qualitative management commentary rather than an audited disclosure. Consequently, any financial thesis premised on product mix shifts must be treated with appropriate caution.
The tectonic shift underneath. The primary structural trend in the Indian welding sector involves process migration rather than short-term market share shifts.
For decades, Indian metal fabrication relied primarily on manual stick welding (SMAW). In manual welding, an operator uses a 350-millimetre electrode, burns it down, stops to chip away slag, loads a new electrode, and strikes a new arc. Operating duty cycles remain low—with the arc active roughly one-third of working hours—and weld quality depends heavily on individual operator skill. Modern continuous-wire processes, such as flux-cored arc welding and gas metal arc welding, feed wire continuously from a spool using internal flux or external shielding gas. Continuous feeding keeps the arc lit, multiplies metal deposition rates, and yields consistent, repeatable welds.
For consumable manufacturers, this transition represents a fundamental structural shift. Flux-cored and solid wires carry higher technical manufacturing requirements, achieve higher realizations per kilogram, and offer stronger defensibility against unorganized regional producers than basic stick electrodes. As fabrication shops convert from manual stick to continuous wire, demand shifts toward higher-margin, certified product lines. This transition is further accelerated by structural labor constraints: India faces a persistent shortage of skilled manual welders relative to its infrastructure construction demands. Automation adoption is driven as much by labor availability constraints as by operational efficiency gains.
A smaller, secondary portion of the product catalog includes gas control and personal protective equipment—such as regulators, flowmeters, cutting torches, auto-darkening helmets, gloves, and fume extraction systems. While these individual items carry modest margins, catalog breadth allows ESAB to serve as a single-source vendor for industrial fabricators. In distributor-led channels, comprehensive product coverage enables distributors to fulfill entire purchase orders through a single manufacturer, capturing incremental volume across complementary product lines.
Which end markets matter. High-specification applications drive defensible profitability. Key end markets include naval shipbuilding at facilities like Mazagon Dock and Cochin Shipyard, where hull steel must withstand intense structural shock; cryogenic services, including LNG storage where welds must maintain impact toughness at sub-zero temperatures; nuclear and thermal power infrastructure; cross-country energy pipelines; wind turbine tower fabrication; rail transport; and petrochemical refineries.
In these demanding environments, specialized flux formulations certified through rigorous destructive testing command pricing power. However, these technical requirements coincide with customer concentration among public sector undertakings and state-backed shipyards that exercise significant procurement leverage. As a result, technically defensible product lines often face commercially demanding buyers.
Management's commentary for FY2025 reflected a cautious view of macro conditions, noting that key industrial indicators pointed to "flat or marginally lower levels of activity," key customer segments "continued to display weakness," and it was emerging areas — renewable energy, digital transformation and infrastructure — that showed heightened interest.4 Delivering double-digit revenue growth against a subdued core industrial backdrop indicates that recent performance relied on market share gains, product mix refinement, and distribution expansion rather than broad macroeconomic tailwinds.
Evaluating that claim requires examining the competitive landscape and testing ESAB India's position against rival suppliers seeking to capture market share.
VI. Competitive Landscape, Helmer's 7 Powers & Porter's 5 Forces
For four decades, India's organized welding market has operated primarily as a two-player industry, flanked by specialized niche producers and surrounded by low-cost regional manufacturers.
Ador Welding Limited serves as the primary domestic incumbent and benchmark. A long-established Indian welding manufacturer with strong positions in standard electrodes and project engineering, Ador presents a solid financial profile. As of late 2026, the company held a market capitalization of approximately ₹2,700 crore, generated revenue near ₹1,198 crore, earned net profit of about ₹114 crore, maintained an almost debt-free balance sheet, and paid out roughly 48% of earnings as dividends.[^11]
Comparing those figures to ESAB India highlights a stark divergence in profitability: on a 26% higher revenue base of ₹1,514 crore, ESAB India generated ₹206.7 crore in net profit—nearly 80% more earnings than its domestic rival.2[^11] Equity markets price this profitability gap far beyond the difference in top-line scale.
Scale alone does not account for this disparity, given that revenue totals remain within comparable ranges. Instead, the gap points to product mix and formulation strength. If a substantial share of ESAB India's output consists of high-specification wires, flux formulations, and specialty alloys protected by stringent customer qualifications, while competitors rely more heavily on price-sensitive standard electrodes, higher earnings per unit of revenue naturally follow. Although this dynamic remains an inference drawn from relative profitability rather than an audited segment disclosure, it represents the central premise of the optimistic investment thesis.
Lincoln Electric India, the subsidiary of the major US multinational, represents ESAB India's primary global rival in the domestic market. Lincoln competes directly in high-margin segments: premium automated power sources, specialized welding automation, and project specifications written into international oil-and-gas engineering, procurement, and construction contracts. Backed by a global parent that funds parent-level R&D, Lincoln matches ESAB's technological depth, creating a competitive balance rather than an asymmetric advantage in high-end automation.
Voestalpine Böhler Welding India and D&H Sécheron focus on specialized high-alloy and structural segments. While these niche producers do not challenge ESAB India's overall volume, they demonstrate that specialized competitors can secure qualified applications. Certification requirements deter uncertified suppliers, but they do not block established technical specialists.
At the bottom of the market sits the unorganized sector: small regional manufacturers selling standard mild-steel stick electrodes into localized industrial hubs based primarily on low pricing and flexible credit terms. While these regional suppliers cannot participate in certified infrastructure projects, they capture market share in general fabrication and light structural work.
A key structural shift supporting the organized sector over the past decade has been the formalization of Indian small-scale manufacturing through the Goods and Services Tax (GST) and stricter regulatory compliance. Historically, unorganized producers competed on price by operating outside full tax and compliance structures. As regulatory enforcement narrowed that cost advantage, the pricing flexibility of small regional makers shrank. This shift provided a structural tailwind for both ESAB India and Ador Welding, expanding the overall market share of organized manufacturers rather than widening the performance gap between the two market leaders.
Applying Helmer's 7 Powers Framework.
Switching costs — high, but narrower than usually claimed. In critical applications, customer switching costs represent ESAB India's strongest strategic advantage. In high-specification manufacturing, consumables are not merely purchased; they are formally qualified. Welding procedure specifications for nuclear containment vessels, naval hulls, or cryogenic tanks explicitly list approved consumables validated through destructive testing under guidelines from the Bureau of Indian Standards, the Research Designs and Standards Organisation for railway infrastructure, and international classification societies such as Lloyd's Register and the American Bureau of Shipping. Re-qualifying an alternative electrode or flux requires producing test coupons, performing mechanical and impact evaluations, securing third-party verification, and completing internal customer sign-offs—a process spanning multiple quarters that imposes costs on the buyer without adding functional value. Industrial customers rarely undertake re-qualification simply to achieve minor price reductions. However, this advantage is bounded: it applies strictly to certified, high-specification products. Standard stick electrodes sold to general fabrication shops possess virtually no switching-cost protection.
Scale economies — moderate. Operating multiple plants near key industrial hubs, consolidating raw material procurement for steel wire rod and minerals, and leveraging an established distribution network across a broad product catalog provide cost advantages over small regional producers. These benefits stem primarily from freight optimization and purchasing scale rather than fixed-cost leverage at individual plants. Against major competitors like Ador or Lincoln, scale economies do not yield a decisive advantage.
Process power — moderate and genuine. Proprietary flux formulations and coating techniques for low-hydrogen welding and sub-zero temperature resilience represent specialized operational know-how rather than public patents. However, these technical assets belong to the global corporate parent and are accessed under license, as evidenced by ongoing related-party payments for the usage of intellectual property rights.4 While licensing advanced technology provides operational capability, it represents a rented asset rather than an independently owned corporate resource.
Branding — modest. The ESAB brand maintains strong technical credibility among industrial welding engineers, though it does not command consumer-style pricing premiums in standard product categories.
Cornered resource, counter-positioning, network economies — essentially absent. Distribution structures follow standard industry practices, physical production assets are readily obtainable by established peers, and individual customer product choices do not generate network effects for other users.
Applying Porter's Five Forces Framework.
Suppliers — moderate. Key raw materials consist primarily of steel wire rod and flux minerals. The company explicitly acknowledges exposure to commodity price volatility, stating that it manages this risk by periodically reviewing commercial terms with both suppliers and customers.4 In practice, periodic contract adjustments create a timing lag between immediate raw material price shifts and subsequent customer price adjustments.
Buyers — bifurcated. Customer bargaining power is sharply split across market segments. Fragmented fabrication shops generally accept distributor list prices, whereas major engineering contractors, public sector refineries, defense shipyards, and Indian Railways conduct competitive bidding processes that exert strong pricing pressure. This creates a strategic paradox: the high-specification product lines with the strongest technical qualifications are sold to institutional buyers possessing the greatest procurement leverage. Furthermore, Indian public sector procurement guidelines encourage vendor diversification and domestic sourcing rather than sole-source arrangements. While product qualifications prevent arbitrary switching, they do not insulate suppliers from competitive tendering.
Rivalry — high in the commodity tier, disciplined at the top. Industry rivalry remains intense in standard product categories while remaining more disciplined in certified, high-specification segments. Management explicitly cited ongoing pricing pressures as an operational risk and described a highly competitive operating environment, even as operating margins remained stable.4
New entrants at the premium end — very low. Capital requirements for basic manufacturing facilities are modest, allowing easy entry into standard stick electrode production. However, entering high-specification segments presents substantial barriers, as new entrants cannot quickly replicate decades of certified flux formulations embedded within approved welding procedure specifications across major shipyards and industrial plants.
Substitutes — low. Alternative joining methods, such as bolting, riveting, or structural adhesives, cannot replace full-penetration welds in heavy industrial applications like pressure vessels, pipelines, or naval structures due to metallurgical requirements, design codes, and physical stress demands.
New entrants in the commodity tier — high. Establishing a basic electrode manufacturing line requires limited capital. However, securing placement for flux formulations within certified naval or nuclear welding procedure specifications presents a formidable technical barrier.
In summary, ESAB India's competitive position rests on a distinct but narrow advantage: qualification-driven switching costs within its high-specification portfolio, built upon a larger commoditized product base defended primarily by distribution reach and procurement scale. While this combination provides a clear operational edge, it does not fully insulate the business from broader market cycles.
That this competitive position is not completely insulating is evident from a period in the company's own operating history when performance faced severe pressure.
VII. Management Credibility, Capital Allocation & Disconfirming Evidence Audit
On July 29, 2026, ESAB India held its 39th Annual General Meeting via video conference. Shareholders approved a final dividend of ₹25 per share, re-appointed B. Mohan as a director retiring by rotation with 99.91% support, and confirmed Curtis Evan Jewell as Non-Executive Nominee Director and Chairman—effective May 1, 2026, replacing Kevin Johnson—with 99.90% approval on an 88.18% voting turnout.3
These voting patterns reflect routine ratification rather than an active endorsement of minority alignment. With the parent entity holding 73.72% of the equity, nominee appointments pass predictably, rendering voting dissent an informative signal only when public shareholders possess sufficient float to influence outcomes.
The absence of procedural friction further underscores this dynamic: no resolutions failed, no material dissent was recorded, and the chairmanship transferred seamlessly between parent nominees.3 For a business where free-float shareholders hold under 27% of shares, routine voting outcomes represent structural reality rather than active governance validation.
The people. Rohit Gambhir serves as Managing Director under a term extending through September 30, 2028.2 Executive compensation metrics provide a telling indicator of corporate culture: the ratio of Managing Director remuneration to median employee pay stood at 26:1 across both FY2024 and FY2025, while median employee pay rose 9.99% in FY2025.4 A stable 26:1 pay ratio for an enterprise generating a near-50% return on equity reflects notable restraint compared to Indian corporate peers and multinational benchmarks, indicating a professional managerial framework rather than a promoter-led structure. Operationally, Whole-Time Director and Chief Financial Officer B. Mohan oversees treasury, working capital, and compliance, while the chairmanship remains explicitly reserved for parent nominees, as demonstrated by the transition from Johnson to Jewell.34
The capital allocation record. The company's historical capital allocation displays consistent discipline. Annual capital expenditure has averaged ₹28 crore to ₹31 crore against a revenue base approaching ₹1,400 crore to ₹1,500 crore.4 During FY2025, cash and cash equivalents expanded from ₹38.36 crore to ₹65.11 crore, even as the company distributed two interim dividends totaling ₹48 per share alongside a ₹42 final dividend proposal, while shareholders' funds expanded from ₹306.06 crore to ₹361.25 crore.4 By FY2026, shareholders' funds reached ₹429.38 crore.2 Notably, ESAB India maintains no subsidiaries, joint ventures, or associate entities.4
This organizational structure represents a critical analytical data point. An enterprise generating nearly 65% returns on capital while producing cash in excess of internal reinvestment requirements—and holding zero subsidiary or joint-venture structures—has refrained from capital-destroying diversification. The company operates without speculative acquisition vehicles or impaired strategic investments. Consequently, the dividend payout ratio of approximately 72% functions as a direct mechanism for returning capital that cannot be reinvested at elevated return rates.1
Whether this capital policy reflects internal managerial discipline or parent-imposed operational limits remains a nuanced question. As a majority-controlled subsidiary within a global corporate network, capital allocation into adjacent business lines is dictated at the parent level rather than by domestic management. Nevertheless, within its domain, the subsidiary has avoided value-destructive capital deployment and speculative diversification.
Evaluating the investment thesis requires auditing three central claims against disconfirming historical evidence from the company's operating record.
Claim 1: Certification-driven switching costs make earnings durable.
Historical operating results present clear disconfirming evidence against earnings durability during cyclical contractions.
During the calendar year ended December 31, 2013, net profit dropped 12.3% to ₹33.12 crore as net sales contracted 13.3% to ₹429.75 crore.8 The downturn worsened in 2014: net profit fell an additional 24.5% to ₹25.02 crore, despite a modest 2.5% top-line recovery to ₹440.30 crore in net sales.9
During that two-year trough, net profit margins compressed below 6% on ₹440 crore in revenue, contrasting sharply with FY2026 net margins of roughly 13.7% on ₹1,514 crore in sales.2 Throughout that severe margin contraction, the core operational assets—brand equity, technical certifications, qualified flux chemistries, defense approvals, and distribution channels—remained intact. The margin collapse occurred despite these structural qualifications, as profits fell even during a year of modest top-line revenue recovery—a pattern characteristic of severe pricing pressure and adverse product mix rather than customer loss.
This historical episode refutes the assertion that technical qualifications protect operating margins during broader industrial downturns. Rather than guaranteeing defensive earnings, certification-driven switching costs preserve market position and competitive placement, allowing the business to capture operating leverage during subsequent economic recoveries. Switching costs defend market share and long-term participation rights; they do not insulate profit margins from cyclical downturns or raw material headwinds.
The critical metric for evaluating this durability involves monitoring operating margin stability within the high-teens range during periods of synchronized demand weakness and rising input costs. Operational resilience in FY2025 offered an incomplete test, as management noted that relatively soft input costs helped mitigate pricing pressures.4 Consequently, the operating model has been evaluated under subdued demand alongside favorable input prices, but not under cyclical contraction combined with rising commodity costs—the conditions that drove the 2013–2014 downturn. Results for the quarter ended March 31, 2026, provided an early indicator, showing top-line revenue growth of roughly 8% to near ₹400 crore alongside margin compression.1516
Claim 2: Governance is clean and value leakage to the parent is immaterial.
Analytic scrutiny of related-party disclosures reveals structural complexities beyond simplistic royalty assumptions. The FY2025 annual report contains no stated baseline royalty rate of 1.5% to 2%, but instead discloses substantial intercompany commercial flows.
Intercompany transactions represent a material proportion of annual operational volume. Disclosed transactions with Switzerland-based affiliate ESAB Europe GmbH reached ₹118.81 crore in FY2025, representing 9.56% of turnover, prompting management to seek shareholder authorization for up to ₹200 crore in FY2026 as volume approached the 10% materiality threshold under SEBI listing regulations.4 Concurrently, related-party dealings with domestic affiliate EWAC Alloys Limited totaled ₹86.50 crore, or 6.96% of turnover, with approval similarly requested for up to ₹200 crore.4 Disclosed transaction terms cover a broad scope, including the sale, purchase, and supply of goods or services, alongside the utilization of intellectual property rights.4 On May 27, 2025, the independent directors on the Audit Committee reviewed and approved these transactions as arm's-length dealings conducted in the ordinary course of business.4
When approximately one-sixth of total revenue flows to entities related to a 73.72% controlling shareholder under broad annual authorization ceilings totaling up to ₹400 crore, minority shareholder alignment depends heavily on transfer-pricing rigor. While regulatory disclosures reflect formal compliance, transfer-pricing risks remain active. Contingent liability disclosures cite contested income tax demands arising from expense disallowances, along with pending claims covering excise, service tax, sales tax, and FEMA matters—all of which management is contesting without financial provisions on the assessment that adverse outcomes remain possible but not probable.4
Consequently, governance analysis indicates an absence of disclosed value extraction rather than structural contractual insulation. Future alignment relies on observable metrics: tracking whether related-party transaction volumes outpace overall revenue growth, monitoring shifts toward higher service or IP fees relative to physical goods, and evaluating final transfer-pricing tax determinations. Transparency would be enhanced if the company provided explicit breakdowns detailing royalty rates and separating physical product transfers from service and intellectual property fees.
Claim 3: Exports are a meaningful growth vector.
Company disclosures indicate that export sales account for approximately 10% of overall turnover across international markets including Australia, Bangladesh, Brazil, China, Sri Lanka, Nepal, Singapore, the Middle East, Indonesia, Malaysia, Uzbekistan, Nigeria, the Philippines, Poland, Russia, Saudi Arabia, Tanzania, Thailand, Egypt, Vietnam, Italy, Kenya, Germany, Sweden, Switzerland, and the United States.4 Export revenues expanded 31% to ₹252.49 crore in FY2026 from ₹192.55 crore in FY2025, providing a valuable offset to softer domestic market conditions.2
While export growth contributed materially to FY2026 results, international expansion remains subject to global corporate strategy. ESAB India operates within a broader corporate architecture containing regional manufacturing and sales operations across multiple target markets, including dedicated automation facilities in China.4 Geographic allocation and product distribution rules are determined at the parent level rather than by the subsidiary board. Consequently, expanding export volumes reflect corporate decisions to source group demand from cost-competitive manufacturing facilities rather than autonomous market expansion—a tailwind dependent on global footprint optimization remaining aligned with Indian production.
A similar strategic dynamic applies to intercompany R&D service revenue.4 While providing R&D support yields attractive margin profiles, business expansion remains tied to parent-level allocation decisions.
This framework sets the stage for evaluating ESAB India's latest product and automation initiatives—where analyzing commercial execution requires distinguishing between new product offerings and material bottom-line contribution.
VIII. Optionality & The Hidden Automation Vector: Digital & Robotics
Beyond metallurgical chemistry and consumable distribution, a structural labor bottleneck defines Indian industrial fabrication: a shortage of certified welders. Training a competent coded welder—capable of laying a qualified root pass in overhead piping, passing radiographic inspection, and doing so consistently—requires years of experience. Furthermore, many skilled welders migrate to higher-paying markets in the Middle East. As India's infrastructure buildout accelerates, project sites face arc-hour constraints that domestic training programs have not filled. Site managers increasingly ration skilled labor across projects, making labor availability—rather than steel supply, financing, or regulatory permits—the primary operational constraint in heavy construction.
Automation offers a potential solution to this labor bottleneck, altering the commercial relationship between welding suppliers and industrial fabricators. A robotic arc welding cell represents a complex integration rather than a standalone equipment purchase. While original equipment manufacturers such as KUKA, ABB, and Yaskawa supply the robotic arms, welding providers supply the essential operating components: pulse MIG power sources with precise waveform control for unattended operation, wire feeders designed to prevent tangling over extended shifts, torch and consumable geometries tailored for robotic clearance, and process parameters that ensure structural compliance.
Layered above the physical hardware is a digital software layer. ESAB's global platform in this domain, marketed under the InduSuite brand, connects welding equipment to software that monitors weld quality, arc-on time, gas consumption, voltage and current deviations, and operator productivity in near real time.13 For fabrication managers, the financial return is quantifiable: tracking gas usage reduces waste, real-time monitoring flags out-of-parameter welds prior to delayed radiographic testing, and automated data logging provides audit compliance for code-governed projects.
The strategic logic of digital integration is compelling. A supplier whose software manages a customer's weld procedure specifications, parameter histories, and quality compliance records achieves deep operational integration. Switching costs would expand from technical consumable certifications to workflow data layers—protecting high-volume standard consumables alongside specialized alloys. If executed at scale, this transition would represent a significant shift in the industry's competitive dynamic.
However, analytical rigor requires separating strategic potential from current financial performance. ESAB India does not disclose revenue from automation or digital solutions, reporting all operations within a single segment.4 While product disclosures outline capabilities across welding automation and digital systems, and management highlights new products and capital goods cycles as growth vectors, statutory reporting offers no evidence that these offerings contribute materially to current earnings.14 Consequently, any estimates assigning a specific revenue share to automation or digital platforms remain unverified, making not disclosed the accurate financial assessment.
Adoption timelines in India suggest a gradual transition rather than an immediate shift. Robotic welding requires high upstream fit-up precision that many domestic fabrication shops lack. While human welders manually adjust for minor gap variances, robotic systems execute fixed paths, requiring customers to invest in precise jigging, tighter cutting tolerances, and disciplined material handling prior to automation deployment. Because these preparatory investments represent customer capital expenditure and operational changes, adoption relies on plant-by-plant conversion led by large engineering fabricators and automotive suppliers rather than rapid industry-wide adoption.
Under this framework, automation and digital initiatives represent strategic optionality that reinforces ESAB India's market positioning as industrial processes formalize, supported by parent-funded R&D. However, they do not yet constitute a demonstrated earnings driver, and statutory filings provide no conversion metrics to justify assigning independent valuation premiums to these lines.
This optionality differs structurally from typical enterprise software adoption. Rather than displacing existing software systems, digital welding tools introduce monitoring to historically unmeasured manual processes. Because manual welding traditionally relies on physical visual checks without digital logging, initial instrumentation provides immediate operational insights. Consequently, early adoption concentrates among fabricators operating under strict quality-audit mandates rather than broader industrial users.
Transforming this optionality into a core investment thesis requires observable evidence: either explicit segment disclosure of automation and digital revenue by ESAB India or a sustained expansion in gross margins attributed directly to automated process adoption rather than favorable raw material costs. Until such metrics emerge, digital and robotic initiatives remain secondary options within the broader investment evaluation.
Evaluating management's perspective on these initiatives requires analyzing statutory disclosures rather than relying on headline announcements.
IX. Earnings Call & Transcript Analysis: Primary Evidence for Investors
A structural quirk shapes what investors can know about ESAB India: the company does not host the quarterly earnings calls typical of Indian mid-caps of its profile. There is no regular analyst call with an official transcript, no investor day, and no quarterly presentation deck offering segmental details. The primary evidence base remains constrained to exchange filings, the Directors' Report and Management Discussion and Analysis in the annual report, Annual General Meeting notices and voting outcomes, and related-party transaction resolutions.1117
This structural limitation cuts both ways. On one hand, management does not spend resources managing quarterly market expectations—a practice aligned with the low-key, professional managerial approach seen across its operations. On the other hand, investors lack a public forum to ask unscripted questions or test management's strategic reasoning in live Q&A, leaving them reliant entirely on static written disclosures.
Analyzing these statutory documents reveals a Management Discussion and Analysis in FY2025 that was candid in select areas yet conspicuously non-committal in others.
Where the disclosure is concrete. On top-line trajectory, the FY2025 report noted that revenue from contracts with customers grew 10.5%, with all key categories expanding during a difficult period marked by geopolitical and economic headwinds, while broader market softness and lower underlying commodity prices created pricing pressure.4 On cost structure, material costs as a share of sales remained comparable year-over-year after adjusting for product mix, whereas overheads—including employee expenses—rose from 21.8% to 22.9% of sales due to inflation and recharged service activity costs.4 Profit before tax grew 7.3%, lagging the 10.5% top-line expansion and reflecting slightly negative operating leverage prior to tax effects.4
This divergence between top-line expansion and pre-tax profit growth highlights key operational dynamics. Overheads expanded as a share of revenue, while other income increased by roughly 12%, driven primarily by indirect tax refunds.4 Consequently, a portion of FY2025 earnings growth stemmed from overhead absorption and a one-off tax refund rather than core operational gains. Results for FY2026 appeared cleaner, with net profit rising 17.8% on a 9.6% revenue increase as management cited improved volumes and pricing across all product categories, though performance was further aided by strong export growth that offset domestic softness.2
Where the language gets careful. Three recurring topics highlight areas of minimal disclosure.
First, related-party economics. Material related-party resolutions for FY2025 defined transaction boundaries in broad regulatory terms and cited arm's-length pricing alongside Audit Committee approval, without disclosing specific baseline rates, markups, or breakdowns between physical goods, services, and intellectual property fees.4 This broad framing reappears consistently across reporting periods, establishing minimum-sufficient disclosure on the single line item most likely to affect minority shareholder economics.
Second, raw material pass-through timing. The company acknowledges commodity price risks across steel and mineral inputs and states that it periodically reviews commercial arrangements with suppliers and customers to adjust pricing.4 However, disclosures do not quantify the pass-through lag. Investors modeling gross margin trajectory during commodity price spikes lack a defined timing parameter—a notable omission given that the 2013–2014 downturn demonstrated that pass-through lags can significantly compress margins.
Third, risk disclosures without detailed mitigation strategies. Management enumerates key operational risks—including pricing pressures, liquidity, supply chain effects on working capital, global factors, cybersecurity, and technology-driven risks—without outlining specific countermeasure frameworks.4 In FY2026 reporting, management similarly highlighted pricing pressures, supply chain friction, geopolitical volatility, and unresolved tax disputes, again omitting detailed operational response plans.2
From a fundamental analysis standpoint, addressing four specific disclosures would improve transparency: a formal segment breakdown separating consumables, equipment, and digital automation to verify the product-mix thesis; explicit royalty or fee structures for intercompany intellectual property transfers; an estimated pass-through lag for key raw materials; and periodic investor Q&A forums. While many Indian mid-cap peers provide these details, their absence at ESAB India does not imply improper practices, but it means the stock's valuation multiple rests on a thinner base of public evidence. For example, the market received the Q2 FY2026 financial results positively despite them being delivered solely through a statutory filing rather than an interactive management call.14
Ultimately, management's communication record is measured and consistent across reporting periods. Executives refrain from issuing financial forecasts, avoid promotional narrative claims, and provide sufficient cost detail to track primary line items. However, management has not had to navigate a major earnings shortfall under the current parent structure, nor has it established a direct channel for live investor questioning. As the historical 2013–2014 operating trough demonstrated, stable execution during favorable market conditions does not guarantee margin resilience during cyclical downturns.
This track record, along with the operational and structural evidence analyzed thus far, defines the core parameters of the investment thesis.
X. Investment Story Spine: The "Why Win / Why Not" Thesis & Risk Radar
Stripping away the initial corporate origins and historical acquisitions, the central question for an investor in September 2026 is straightforward: at a valuation of roughly 42 times trailing earnings, what underlying cash flows and structural capabilities is the market pricing in?1
Why this company wins from here.
-
The first argument is positional rather than purely financial. ESAB India operates at the physical intersection of India's capital formation. Whether a project involves transmission towers, renewable wind capacity, refinery modernizations, naval hulls, railway rolling stock, or cross-country pipelines, structural assembly requires an arc. Unlike an engineering, procurement, and construction contractor, ESAB India avoids project-execution risks, fixed-price contract exposure, and extended receivables tied to single-client schedules. Instead, the business captures revenue based on total steel tonnage fabricated—a structurally superior position within the industrial value chain.
-
The second argument relies on relative earnings evidence against its closest domestic peer. Generating approximately 80% more net profit than Ador Welding on a 26% larger top line reveals a substantial performance gap.2[^11] This divergence serves as primary empirical evidence supporting the optimistic investment thesis, indicating a higher-margin, specialized product mix defended by certified flux chemistries and customer qualification barriers at the high end.
-
The third argument involves the parent relationship. Access to a global $2.8 billion fabrication technology platform's product pipeline and research initiatives without incurring baseline development costs provides a clear advantage over domestic rivals—though not against Lincoln Electric, which maintains a similar parent structure.7 In fiscal 2026, this international alignment yielded tangible results: export revenue expanded roughly 31%, helping buffer domestic market softness.2
-
The fourth argument centers on capital efficiency. A business generating a return on capital employed of nearly 65%, allocating just 2% of annual sales to capital expenditure, operating with zero subsidiary entities, and returning approximately 72% of earnings as dividends can fund growth internally without diluting returns or accumulating unproductive cash.14 Operational expansion and shareholder payouts remain fully aligned.
Why the case breaks.
-
The primary counter-argument stems from historical precedent rather than valuation alone. The company's operating record demonstrates that net margins compressed below 6% on flat sales during an industrial downcycle marked by adverse pricing, even while technical certifications and customer switching costs remained fully intact.89 The market currently assigns a premium compounder multiple to an enterprise with documented cyclical sensitivity. Should a future downturn combine weak industrial demand with elevated steel prices—unlike the demand-soft, input-friendly environment of fiscal 2025—the earnings foundation supporting a 42-times multiple would face severe pressure.
-
Second, the current valuation leaves little margin for error. Trading at roughly 42 times trailing earnings against high-single-digit top-line growth and a subdued domestic market, the equity requires continuous margin expansion, mix migration, or export growth.124 Replicating the 2014 pattern—where revenue rose while net profit fell—would trigger a sharp valuation repricing.
-
Third, commoditization persists at the lower end of the catalog. Standard stick electrodes face intense price competition from unorganized regional producers lacking qualification requirements, particularly during demand lulls when manufacturers compete aggressively for volume.
-
Fourth, minority shareholders face governance trade-offs. Intercompany transactions approach one-sixth of total revenue under expanding annual authorization ceilings, within a corporate structure where parent nominees chair the board and resolutions pass with over 99.9% voting support.34 Consequently, minority investors depend on internal arm's-length controls rather than explicit contractual protections, alongside unresolved contingent tax liabilities involving expense disallowances.4
-
Fifth, top-line growth remains bounded by overall Indian fabrication tonnage and market share limits. The business lacks a mechanism to expand significantly faster than broader domestic industrial activity, incremental product mix upgrades, and parent-directed export allocations.
The current risk radar, mechanism first.
-
Input cost and pass-through timing. The company purchases steel wire rod and mineral inputs while selling a portion of its catalog under non-formula pricing. Rapid steel price increases compress gross margins until commercial contracts are renegotiated, and the exact pass-through lag remains undisclosed.4 This represents the highest-probability near-term risk with direct historical precedent.
-
Capital expenditure cycle deferral. Equipment purchases represent discretionary capital outlays for customers. When a fabricator's order book slows, new plasma cutter orders are postponed while consumable purchases merely decelerate. Equipment sales remain the more volatile revenue line, rendering a capital goods cycle revival an unrealized opportunity rather than a current growth driver.4
-
Automation adoption pace. If customer conversion from manual stick welding to continuous wire and robotic systems proceeds slowly, the product-mix upgrade thesis weakens, leaving ESAB India reliant on standard consumable volumes for longer.
-
Transfer pricing and tax liabilities. Adverse rulings on contested income tax demands or regulatory challenges to intercompany transaction pricing would reduce net earnings and prompt a reassessment of governance risks.4
-
Cybersecurity and technology risk. Management explicitly identifies technology risks, where deploying networked welding equipment into customer facilities expands both the company's and the customer's operational attack surface.4
-
Geopolitics and supply chain friction. Foreign exchange outflows for imported raw materials, components, and capital goods reached ₹195.19 crore in fiscal 2025, while export sales span two dozen international markets including Russia.4 Tariff shifts and trade disruptions remain active operational variables rather than theoretical risks.
In summary, the bullish investment thesis rests on a verifiable mechanism: a specialized consumables portfolio backed by qualification barriers, distributed through an extensive nationwide network, and supported by a global parent that supplies technology and export demand. Conversely, the bearish thesis relies on the company's demonstrated margin vulnerability during synchronized cyclical downturns and input-cost spikes, combined with a valuation multiple that assumes uninterrupted execution.
These perspectives define a high-quality business priced at a premium that requires its operational tailwinds to persist without interruption.
XI. Playbook: Key Business & Investing Lessons
1. The MNC subsidiary premium is real, and it is a trade, not a gift. Listed Indian subsidiaries of global industrial leaders repeatedly command premium multiples for tangible reasons: technology access without baseline development costs, imported governance and internal control frameworks—ESAB India noted it is subject to additional oversight as a subsidiary of a US-listed entity—asset-light expansion because the parent funds core R&D, and high payout ratios driven by parent cash preferences.4 The trade-off is corporate control. Investors buy into a node within a broader global network whose operational terms are established above the local board level. Paying a valuation premium is rational, but so is discounting that premium for the governance limits it imposes.
2. The consumable razor works, but the razor and the blade must be specified together. The durable element of ESAB India's business model is not merely that consumable demand recurs—commodity consumables recur as well, while generating commodity returns. Rather, a qualified consumable recurs inside a customer's certified welding procedure specification that the customer paid to validate. The broader lesson applies across industrial sectors: recurring revenue becomes defensible only when a customer-owned specification makes vendor switching costly. Rigorous analysis requires identifying that specific switching barrier and determining the exact share of revenue it protects.
3. Buy the permission, not the plant. ESAB India's entry strategy between 1987 and 1994 illustrates how to navigate regulatory entry barriers. In a licensed economy, the binding constraint was neither capital nor technical capability; it was regulatory permission and incumbent approvals. ESAB acquired the welding divisions of Peico and Indian Oxygen alongside stakes in Flotech and Weldaids, opting to build its first greenfield facility at Irungattukottai twenty years later—only after licensing restrictions eased and product volumes justified dedicated scale.10 The underlying strategic principle remains relevant: in heavily regulated markets, acquiring an incumbent's operational approvals is often far more cost-effective than spending time to secure new permits independently.
4. A management system is a real asset and a hard one to isolate. The Colfax Business System derived from Danaher's framework, which adapted kaizen principles into a standardized discipline for eliminating waste across acquired industrial operations. ESAB India's line-level productivity initiatives reflect this operational methodology.4 However, margin expansion during favorable commodity cycles cannot be attributed solely to managerial discipline, a point confirmed by the company's disclosure that softer input costs helped manage FY2025 margins.4 The analytical standard requires crediting a management framework only for operational gains that persist during severe market downturns rather than benign cycles.
5. Read the related-party resolutions before the ratio sheet. The most critical disclosures in ESAB India's financial filings appear in statutory notices rather than headline financial summaries. In its annual general meeting filings, transactions totaling ₹118.81 crore with a Swiss affiliate and ₹86.50 crore with a domestic associate were detailed as material percentages of turnover, with shareholder approval requested for higher transaction ceilings covering goods, services, and intellectual property fees.4 Evaluating any multinational subsidiary requires tracking whether related-party transaction volumes outpace overall revenue growth, identifying the split between physical goods and service fees, assessing specific royalty rates, and evaluating transfer-pricing governance. High payout ratios and strong return metrics alone do not resolve these governance questions.
6. Distribution is the quiet moat, and companies tell you when they are leaning on it. When executive disclosures attribute revenue stability during a flat market to internal productivity and distributor network expansion rather than market demand or pricing leverage, management signals the true locus of operational advantage.4 Deep distribution reach into fragmented industrial markets is expensive to establish and difficult for new competitors to replicate. While distributor networks rarely feature prominently in investment theses, they represent a fundamental driver of competitive defensibility.
XII. Epilogue & Valuation Stress Test
Consider again the welder crouching at the joint during ninety seconds of intense heat while a crane holds the steel beam. Multiplied across every fabrication shop, shipyard, pipeline spread, and wind-tower yard in India, that transient arc defines ESAB India's addressable market—a total market evaluated not in software users or active subscriptions, but in kilograms of deposited metal and the extreme technical conditions those finished joints must endure.
As of September 2026, the financial baseline reflects this market position: a market capitalization near ₹8,660 crore, trading at roughly 42 times trailing earnings on fiscal 2026 revenue of ₹1,514 crore and profit after tax of ₹206.7 crore, with mid-sixty percent returns on capital, zero debt, and roughly 72% of earnings distributed as dividends.12 It operates as a highly capital-efficient franchise assembled over four decades, held three-quarters by a parent entity whose global sales total roughly $2.8 billion and whose core organic growth was flat in 2025.7
The fundamental stress test centers on a single question with an established historical precedent: what does the business earn when Indian industrial demand weakens while steel prices remain elevated? The historical record offers a clear proxy: in 2014, the company earned approximately ₹25 crore on ₹440 crore of net sales—yielding a net margin below 6%—despite having its technical certifications, proprietary formulations, plant network, and distributor relationships fully operational.9 Nothing in the underlying corporate structure eliminates that cyclical vulnerability. While expanded scale, a higher-value product mix, export contributions, and parent technology access may raise the earnings floor, that higher floor has not yet been tested during a synchronized downturn.
This historical context narrows the key monitoring list to three specific operational indicators that investors can track directly through statutory filings without complex modeling.
First, operating margin behavior during adverse input cycles. The key metric is not merely the headline margin level, but its resilience when steel wire rod prices increase while domestic demand remains soft. Experiencing that combination serves as a direct test of the optimistic thesis. Fiscal 2025 did not provide such a test, as management noted that softer input costs helped sustain margins.4 Conversely, the quarter ended March 31, 2026—which generated top-line revenue growth alongside margin compression—represents the type of operational data point that requires ongoing monitoring.1516
Second, the trajectory of related-party transactions relative to revenue. Investors must track both overall intercompany transaction values and their structural composition. Related-party flows expanding significantly faster than net turnover, or shifting toward intellectual property and service fees rather than physical goods, would indicate financial value migrating upward to the parent entity.4 These shifts appear within Annual General Meeting notices well before they impact traditional financial ratios.
Third, the revenue breakdown between standard consumables and high-value automation or specialized wire products. ESAB India does not provide segment disclosures for these categories, making any future introduction of segmental detail an important signal in itself. Until statutory segment reporting emerges, export revenue serves as the primary observable proxy for product mix refinement. Export sales expanded from ₹192.55 crore in fiscal 2025 to ₹252.49 crore in fiscal 2026.2 Sustained export growth indicates that Indian manufacturing facilities are securing global group mandates based on technical capability and cost competitiveness rather than merely filling localized demand.
Ultimately, ESAB India operates much like an industrial toll booth positioned directly across Indian metal fabrication. The business collects revenue proportional to fabricated steel tonnage, requires minimal capital expenditure to maintain its infrastructure, and distributes the majority of its cash flow to shareholders. Fees collected on high-specification fabrication are defended by stringent technical certifications that require quarters for competitors to replicate. Meanwhile, returns on standard products are defended primarily by localized freight economics and long-established distributor networks.
The business remains well positioned and efficiently managed. However, industrial volume is inherently cyclical, operational strategy is set within a global corporate structure, and the equity valuation in September 2026 assumes uninterrupted volume growth. Oscar Kjellberg solved the metallurgical chemistry in 1904, but macroeconomic cycles remain beyond any manufacturer's control.
References
-
Esab India Ltd share price | About Esab India | Key Insights — Screener.in ↩↩↩↩↩↩↩↩↩
-
Esab India FY26 Revenue up 9.6% to ₹1,514 Cr, Profit up 17.8% — Whalesbook Corporate News, 2026 ↩↩↩↩↩↩↩↩↩↩↩↩↩
-
ESAB India shareholders approve ₹25 dividend and board changes at AGM — ScanX, 2026-07-29 ↩↩↩↩
-
ESAB India Limited Annual Report 2024-25 — ESAB India ↩↩↩↩↩↩↩↩↩↩↩↩↩↩↩↩↩↩↩↩↩↩↩↩↩↩↩↩↩↩↩↩↩↩↩↩↩↩↩↩↩↩↩↩↩↩↩↩↩↩↩↩↩↩↩↩
-
ESAB Corporation Completes Separation From Enovis and Launches as an Independent, Publicly Traded Company — ESAB Corporation Investor Relations, 2022-04-05 ↩
-
Enovis (formerly Colfax) Completes Spin-off of ESAB Corporation — GlobeNewswire, 2022-04-05 ↩
-
ESAB Corporation Fourth Quarter and Full Year 2025 Financial Results — Form 8-K, U.S. Securities and Exchange Commission, 2026 ↩↩↩
-
Esab India declines after poor Q4 earnings — Business Standard, 2015-01-30 ↩↩
-
Esab India tumbles after weak Q4 outcome — Business Standard, 2014-02-20 ↩↩↩
-
ESAB India Limited — Official website and company information ↩↩↩↩↩↩↩↩
-
ESAB India Ltd — Corporate Announcements Archive, BSE India ↩↩
-
ESAB India Limited — Filings and Financial Information, NSE India ↩
-
ESAB Corporation — Investor Relations and SEC Filings (NYSE: ESAB) ↩↩
-
Esab India spurts after strong Q2 results — Business Standard, 2025-11-11 ↩
-
Esab India Q4 FY26 Results: Revenue Rs 400 Cr and Key Highlights — Univest, 2026 ↩↩
-
ESAB India Q4 Revenue Rises 8% to ₹400 Cr Despite Margin Compression — Sahi, 2026 ↩↩
 LinkedIn
 WhatsApp
 Reddit
 Hacker News
 Email
Email Kindle
 RSS Feed
 Spotify
 Apple Podcasts
 Amazon Music
 Audible
 YouTube