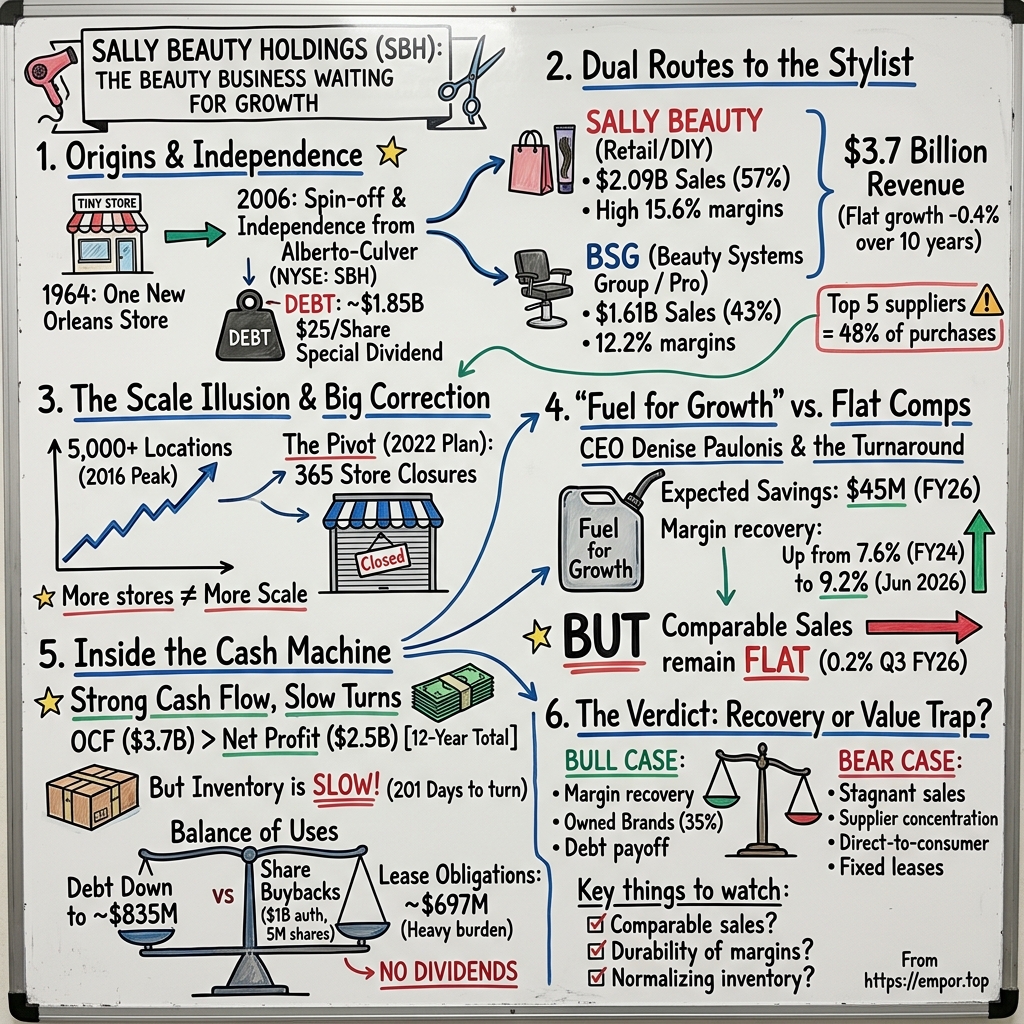
Sally Beauty: The Beauty Business Waiting for Growth
I. A $3.7 Billion Beauty Business With Flat Sales
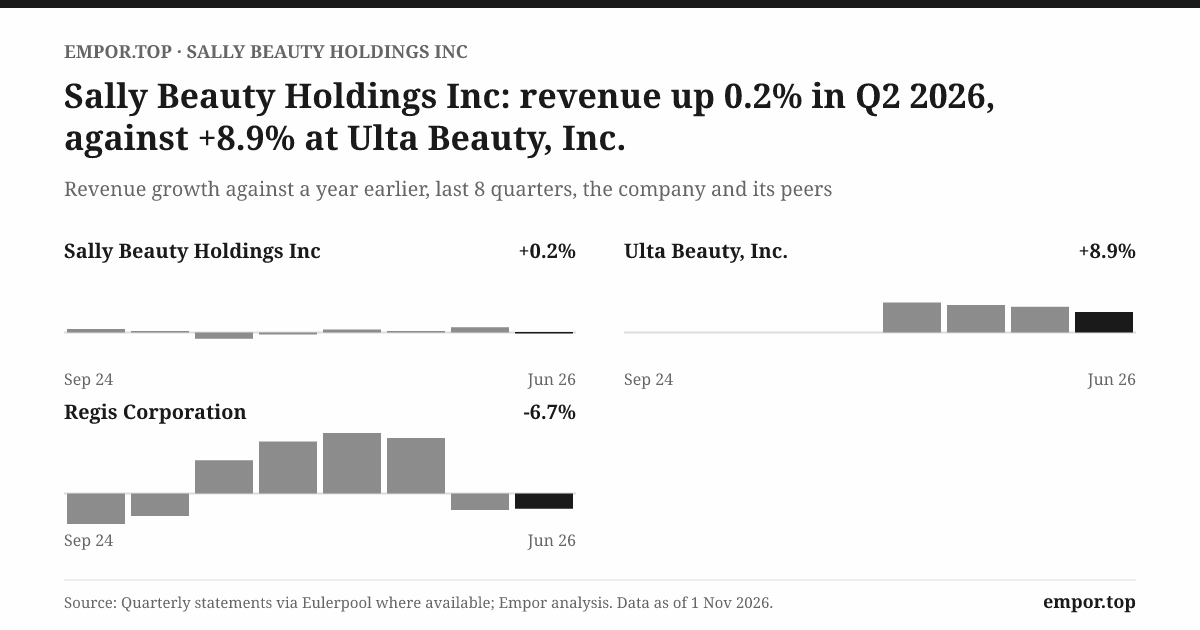
On the first Monday of August 2026, Sally Beauty Holdings reported a quarter that looked, at first glance, like nothing had happened. Sales for the three months to June came in at about $935 million, up two-tenths of one percent from a year earlier.1 Comparable sales, the measure of stores and channels open long enough to be compared like for like, were flat to the decimal.2 For a retailer, that is the commercial equivalent of a heartbeat monitor holding a steady line.
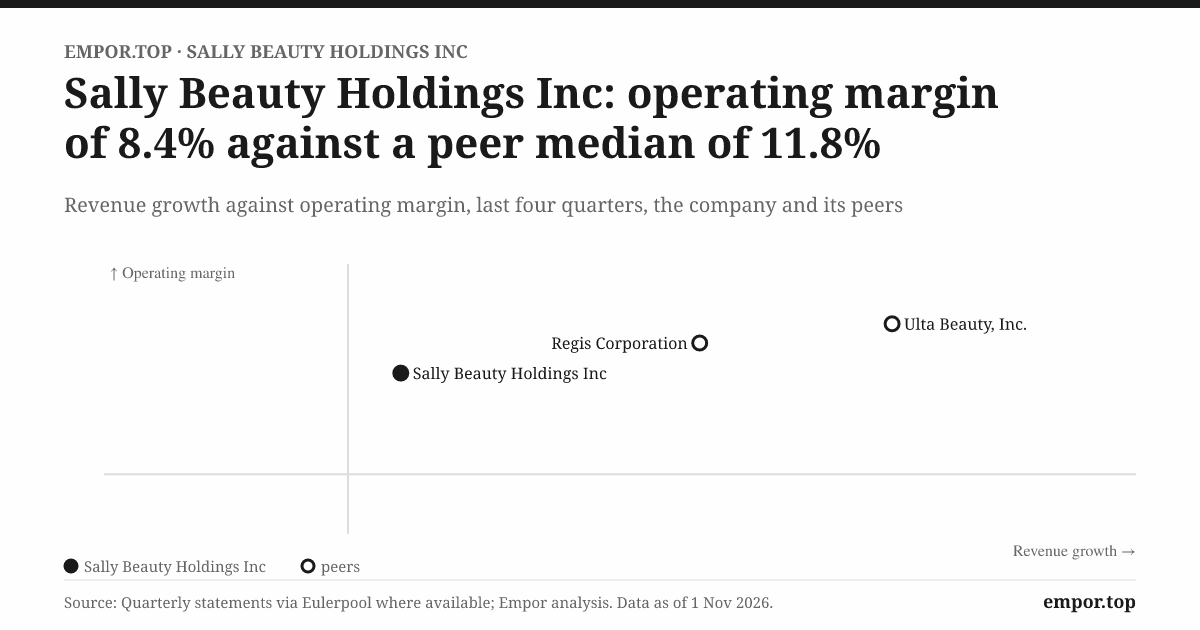
Then came the second half of the income statement. Operating profit rose by roughly a tenth, operating margin climbed to about 9.2%, and net earnings rose about 18%, to roughly $54 million.1 The company had squeezed meaningfully more profit out of almost exactly the same sales. Gross margin was up, freight and distribution were cheaper, and the company said its three-year cost program with the hopeful name "Fuel for Growth" was delivering the savings it had promised.2 In the space of one release, Sally Beauty showed both halves of its story: a business that has become better at keeping what it sells, and a business that has not yet found a way to sell much more.
Look one layer down and the flat line hides two diverging pulses. The Sally Beauty Supply stores grew comparable sales by about 1.6%, and in the United States and Canada by about 3.5%, carried by hair color. The professional business, BSG, went the other way: comparable sales fell about 2.1% as the number of transactions dropped by more than 3%.2 One half of the company was finding customers; the other half was losing orders. Averaged together, they produced the zero on the front page.
That gap is the subject of this story. Sally Beauty is not a hot beauty brand with a celebrity founder and a viral lip oil. It is a roughly $3.7 billion retailer and distributor that sold about $3.70 billion of hair color, hair care, nail polish, tools and salon supplies in the fiscal year to September 2025.3 It reaches two very different people. One is the do-it-yourself customer walking into a Sally Beauty Supply store in a strip mall to buy bleach, developer and a box of vivid purple. The other is the professional stylist, who buys through Beauty Systems Group, known as BSG, by walking into a members-only store, placing an order with a sales consultant or tapping through an app.3 The company sits between the giant manufacturers that make the products and the millions of heads of hair that use them.
The long record is sobering. Over the ten fiscal years from 2015 to 2025, revenue shrank by about 0.4% a year.3 Revenue in fiscal 2025 was below where it stood in fiscal 2014, and below its peak of about $4.0 billion in fiscal 2016. Operating margin tells an even starker story: about 13.5% in fiscal 2014, a low of about 7.6% in fiscal 2024, and a partial recovery to about 8.9% in fiscal 2025.3 So the margin recovery that excited investors in 2026 is, in historical perspective, a climb back toward the middle of a hill the company once stood at the top of.
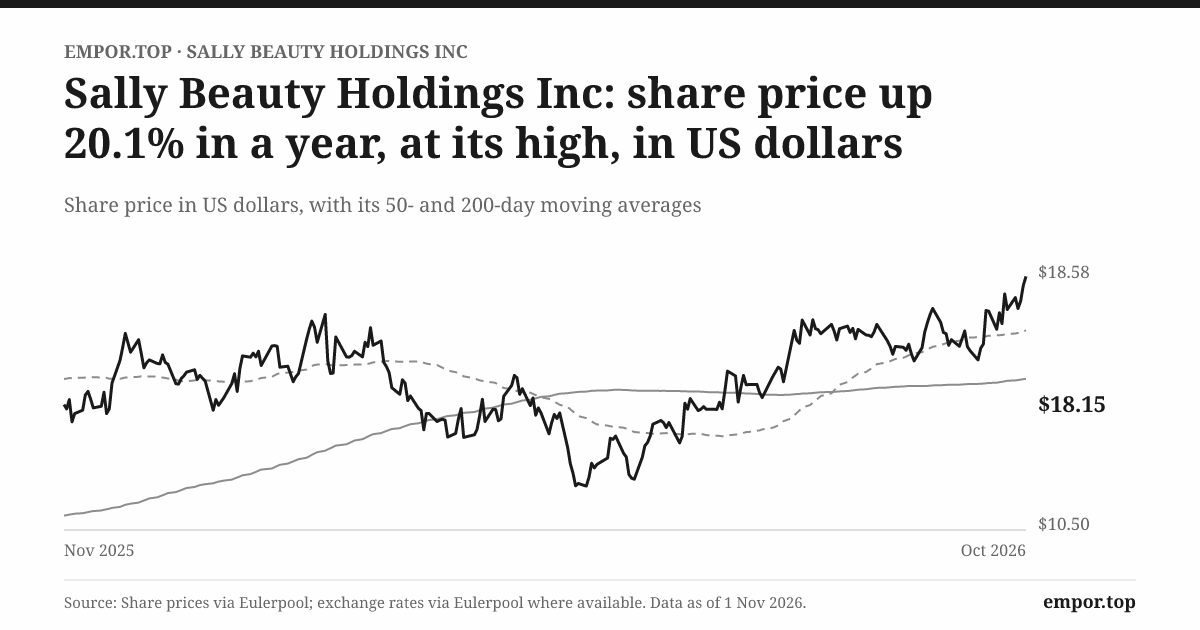
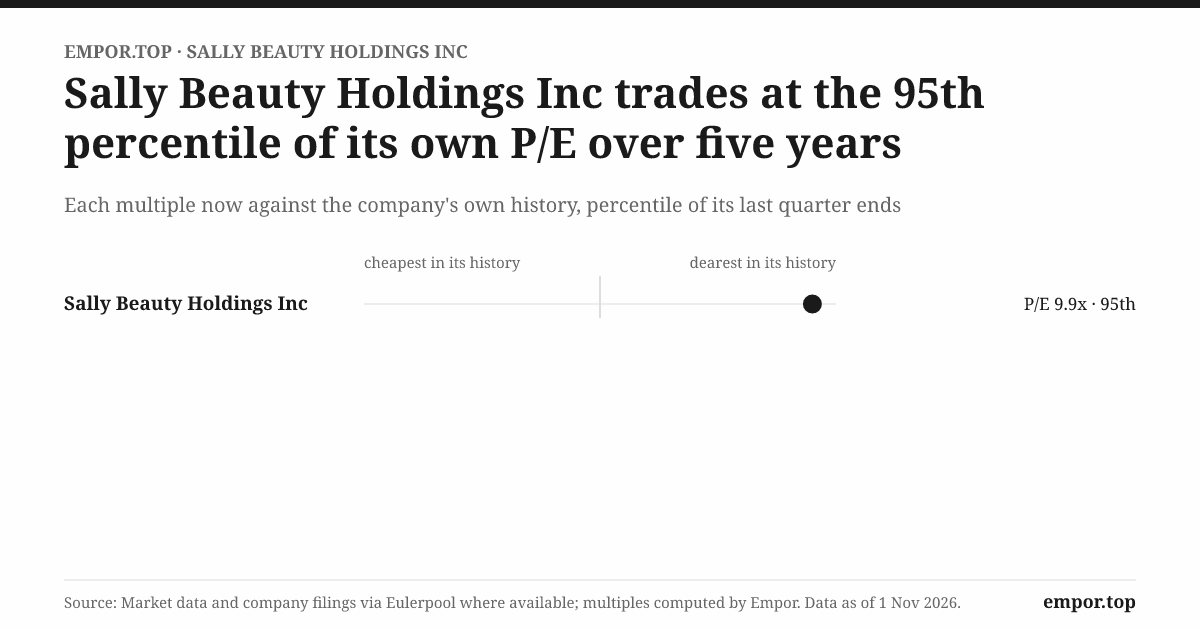
And yet the stock has noticed. On November 1, 2026, Sally Beauty shares traded at about $18.15, their highest level of the past year and more than half again above the 52-week low near $11.82. The company was worth about $1.9 billion in equity and roughly $3.2 billion once debt and leases are counted. Investors paid about 9.9 times trailing earnings, above the company's own five-year median of about 7.8 times. That is still a modest multiple in absolute terms, the kind of price the market reserves for businesses it suspects are shrinking. But it is no longer the bargain-bin multiple of the past five years. The market has begun to pay for the margin recovery.
There is a value argument hiding in the same numbers. On the trailing cash flows, the shares offer a free-cash-flow yield of about 12.8%, meaning that for every $100 of market value, the business has recently generated almost $13 of cash after its capital spending.3 Very few consumer businesses with national footprints are priced that way. The question is whether that cash is a durable stream or a flattering snapshot, and whether it belongs to shareholders or to the lenders and landlords who stand ahead of them.
Three questions run through what follows. The first is whether margins can keep improving without stronger sales, or whether the cost savings are a one-time gift that will fade as the program ends. The second is whether Sally's web of suppliers, stylists and stores amounts to a defensible position, or merely a useful distribution network that powerful manufacturers and fast-moving rivals can work around. The third is what management should do with the cash: repay debt, refresh stores, or keep buying back shares. Each has a different answer depending on whether the business can grow again.
The verdict on the opening scene is simple to state and hard to settle. The margin recovery is visible in the filings. A renewed growth engine is not. To understand why a company with this much reach has struggled to grow, the story has to go back to a single store in New Orleans, and to the moment Sally Beauty was handed a balance sheet of its own.
 Subscribe on LinkedIn
II. From One New Orleans Store to an Independent Company
Sally Beauty Supply began with a single store in New Orleans in 1964.4 The idea was simple and, for the time, quietly radical: sell professional-quality beauty products to anyone who walked in, not only to licensed cosmetologists. Hair color that had once required a salon appointment could be bought off a shelf, along with the developer, the gloves and the advice of someone behind the counter who knew the difference between a level-six and a level-eight blonde. It was beauty supply for people who wanted to do it themselves, at a fraction of the price of a salon visit.
Five years later, in 1969, the chain was acquired by Alberto-Culver, the Chicago-area consumer products company best known for Alberto VO5 shampoo.4 For almost four decades, Sally Beauty lived inside a larger corporation. That gave it capital to expand and a parent with deep knowledge of hair care, but also made it one division among many. Under Alberto-Culver, Sally grew into a national chain, and in 1995 Beauty Systems Group became a subsidiary of the parent, building the professional distribution business that would later become Sally's second leg.4 By the mid-2000s, the beauty supply division had become large enough that Alberto-Culver's leadership began to ask whether two such different businesses, a branded consumer products maker and a specialty retailer and distributor, belonged under one roof.
The first answer was a merger. In early 2006, a deal was struck to combine Sally's business with Regis, the salon operator. A company that ran thousands of hair salons would have joined the company that supplied hair professionals and do-it-yourself customers, with obvious logic and obvious conflict, since Sally sold to the stylists that Regis employed and competed with. The merger agreement was terminated, and Sally's fiscal 2006 results carried one-time charges associated with that termination.4 The failed deal mattered because of what came next. Instead of joining another operator, Sally would stand alone.
The new plan was a separation engineered with private-equity money. On November 16, 2006, Sally Beauty Holdings began regular-way trading on the New York Stock Exchange under the ticker SBH.4 Funds affiliated with Clayton, Dubilier & Rice, the buyout firm known by its initials CD&R, invested $575 million in cash equity for roughly 48% of the company on an undiluted basis.4 Sally's subsidiaries took on about $1.85 billion of debt.4 Alberto-Culver shareholders received a special cash dividend of $25 per share, funded by the transaction, while Alberto-Culver's consumer products business went its own way as a separate company.4
It is worth slowing down on the mechanics, because they explain the shape of Sally's balance sheet for the next decade and a half. The special dividend was not a sign that Sally Beauty would become a dividend payer. It was a one-time distribution that let Alberto-Culver's owners take cash out of the beauty supply business at the moment of separation, paid for by borrowing against Sally's future cash flows. In effect, the newly independent company was born owing a large sum on behalf of the shareholders who had owned it before. The new owners, CD&R among them, bet that Sally's steady, cash-generative stores could carry that debt and pay it down.
That bet left a long shadow. For more than a decade after independence, Sally's shareholders' equity on the balance sheet was negative: the company's recorded liabilities exceeded its recorded assets, largely because of the debt-funded dividend and later share repurchases.3 Equity only turned positive around fiscal 2020 and grew to about $794 million by September 2025.3 Negative equity in a profitable company is not a sign of insolvency, but it does mean that balance-sheet management was never a side issue. Paying interest, refinancing debt and deciding how much to return to shareholders became part of running the business from the first day.
Independence also crystallized the two businesses that define Sally today. By the end of fiscal 2009, Sally Beauty Supply had grown to roughly 2,900 company-operated stores, about 500 of them outside the United States.4 BSG, whose professional brand sales often came with exclusive distribution rights in particular territories, operated close to 1,000 stores and employed sales consultants who visited salons directly.4 One business was retail; the other was wholesale distribution with a retail storefront.
The international business that came with independence was already substantial, and it would shape the company's later choices. By September 2009, the Sally banner had about 500 company-operated stores outside the United States, the largest cluster by far in the United Kingdom with about 250, followed by Mexico with about 85 and Canada with about 45, and smaller outposts in Germany, Belgium, France, Japan and Chile.4 Every one of those markets had its own suppliers, its own professional licensing rules and its own competitors. Spreading a specialist model across so many countries brought reach, but it also brought complexity, and a business that later had to unwind part of that reach in Europe would learn the cost of that complexity firsthand.
The newly independent company also moved quickly to buy footprint. In its first years it bought a Scottish company with almost 100 stores across the United Kingdom, Ireland, Germany and Spain, a Belgian cash-and-carry retailer with 40 stores, a Chilean distributor with 16 and a U.S. beauty supplier, Schoeneman, with 43 stores.4 Total store count rose from about 3,339 in fiscal 2006 to about 3,914 three years later.4 That is the pattern the rest of this story will test. Sally became independent with a business model that generated cash and a balance sheet that demanded it, and its early growth came partly from adding locations, some of them bought rather than built. The question independence posed in 2006 is the one still open in 2026: can Sally grow through its own operations, or does footprint expansion mostly come from buying other people's stores?
Before answering that, it is worth understanding exactly how the two halves of the business make money, because they do it in surprisingly different ways.
III. Two Routes to the Stylist, and Two Different Profit Pools
Picture two transactions happening on the same Tuesday afternoon. In a Sally Beauty Supply store in suburban Texas, a customer in her twenties picks up a tub of lightener, a bottle of 30-volume developer, a semi-permanent color and a pair of gloves. She pays about what a coffee-and-sandwich lunch might cost, and the total is a fraction of what a salon would charge for the same transformation. A few miles away, a salon owner uses the BSG app to reorder the professional color line her stylists use every day, a few cases of developer and a new care line a sales consultant recommended on her last visit. Both purchases end up in Sally Beauty Holdings' revenue. They are not the same business.
What Sally sells, in both cases, is physical product, bought unit by unit. The company sells through its own stores, through e-commerce, through BSG's sales consultants who call on salons, and to franchisees who operate stores under its banners.3 There are no long-term subscriptions here, no software licenses, no service contracts. The company does not disclose contract length, minimum purchase commitments or what share of its revenue recurs.3 What drives the top line is traffic into stores and onto websites, the number of transactions, the average ticket, the mix of products and, on the professional side, how much stylists buy to keep their chairs busy.3 The company says the business is generally not seasonal, though consumer spending, stylist behavior, weather and macroeconomic uncertainty all move it.3 A stylist who colors hair every day is, in practice, a repeat customer, but that repeat behavior is a habit rather than a contract.
Digital has become a steadily larger share of how those transactions happen. E-commerce rose from about 9.3% of consolidated sales in fiscal 2023 to 9.8% in fiscal 2024 and 10.7% in fiscal 2025.3 By the June 2026 quarter it had reached 12%, with BSG's digital share higher than Sally's, about 15% of segment sales against roughly 10%.2 That difference is telling. Professionals who reorder the same products repeatedly find an app convenient. Do-it-yourself customers, often experimenting and seeking advice, still lean on the store. Yet the faster growth in the June quarter came from the retail side, where Sally's online sales rose about 20% against about 4% at BSG.2 The company is still early in teaching its retail shopper to buy online, which is an opportunity if those sales are incremental and a cost if they simply move a purchase from a store, where the rent is already paid, to a parcel that has to be picked, packed and shipped.
The professional side has a texture of its own. BSG operates under banners such as CosmoProf, and much of what it sells it sells under exclusive distribution rights for particular brands in particular territories.3 Its sales consultants are the human face of that arrangement: they visit salons, introduce new lines, teach technique and take orders. For a small salon owner without a purchasing department, the consultant is part supplier, part educator and part business adviser. That relationship is the closest thing BSG has to a lock-in, but it rests on the brands the consultant carries. If a manufacturer moves its line to another distributor or sells it directly, the consultant's visit loses much of its point.
Now look at the size of the two profit pools. In fiscal 2025 the Sally Beauty Supply segment sold about $2.09 billion and earned segment operating earnings of about $327 million. BSG sold about $1.61 billion and earned about $196 million.3 Sally is therefore about 57% of revenue but roughly 63% of the two segments' combined operating earnings, before the corporate costs the company does not allocate to either. Sally's segment earnings came to about 15.6% of its sales; BSG's to about 12.2%.3 Those are segment figures, not consolidated operating margins, which are lower because headquarters, shared systems and other unallocated costs sit on top.
Why does the retail side earn more on each dollar? The answer lies in gross margin and in who sets the price. In the June 2026 quarter, the Sally segment kept about 61.5 cents of every sales dollar after the cost of goods; BSG kept about 40.1 cents.2 Sally sells to individual shoppers at retail prices, including a large slice of its own brands, so it captures a fat gross margin but pays heavily for stores, staff and marketing to earn it. BSG sells to professionals at trade prices, mostly third-party brands where the manufacturer controls the pricing architecture, so its gross margin is thinner but its selling costs per dollar are lower. Both routes end up profitable; they just get there through different cost structures. One is a retailer with a professional edge; the other is a distributor with storefronts.
Who else wants the stylist's wallet
Sally's competitors come from several directions at once, which is part of what makes its position hard to describe in a single sentence. The obvious comparison is Ulta Beauty, the American beauty retailer whose fiscal 2025 sales were about $12.4 billion, more than three times Sally Beauty Holdings' total.5 But Ulta's mix of prestige and mass cosmetics, fragrance, skin care and in-store salons is not a direct substitute for Sally's niche. A customer who wants a professional-strength bleach kit and a vivid pigment is not usually shopping Ulta's prestige makeup aisle. The overlap exists, especially in hair care, but the two businesses serve different moments.
The sharper rival in professional distribution is SalonCentric, the distributor owned by L'Oréal, which describes a network of 585 stores and more than 550 business partners serving salon professionals.6 Sally does not disclose its market share in professional distribution, so the relative size of BSG and SalonCentric cannot be compared directly. What matters is the structure. L'Oréal Professional Products is one of Sally's five largest suppliers, and L'Oréal also owns a competing distributor.3 That is the clearest single illustration of the strategic tension in Sally's model: some of its most important partners are also its competitors.
Run the competitive pressure through a single lens and the picture becomes clear. Customers have choices: the do-it-yourself shopper can buy hair color at a drugstore, a mass merchant, Amazon or Ulta, and the stylist can buy from other distributors or directly from some manufacturers. Manufacturers have power: the five largest suppliers, Henkel, L'Oréal Professional Products, Wella, John Paul Mitchell Systems and Kao, accounted for about 48% of Sally's merchandise purchases in fiscal 2025, and supply contracts can generally be terminated without cause on 90 days' notice or less, or simply expire without a right to renew.3 Manufacturers can and do sell direct. Sally's defenses are exclusive distribution rights in particular territories, long relationships with brands, and its own labels.3
Those owned brands deserve a closer look because they are the most plausible source of an edge. Owned brands were about 35% of the Sally segment's sales in fiscal 2025, and the company says they carry higher margins than third-party products.3 That is real economics: when Sally sells its own color line rather than a manufacturer's, it keeps the margin the manufacturer would otherwise have taken. Over the past two years, management has also leaned into color as the anchor of the Sally proposition, with color sales in the Sally segment rising about 8% in the June 2026 quarter even as care fell about 6%.2 Color is the category where advice, professional-grade formulation and a do-it-yourself culture meet, and where a specialist store has the clearest reason to exist.
But the evidence stops short of proving customer lock-in. The company does not disclose how the owned-brand share has changed over time, how often customers come back, or whether it can raise prices without losing volume. Higher margins on owned brands show that the products are profitable to sell. They do not show that a customer who buys an owned-brand color would refuse to buy a cheaper or more convenient alternative elsewhere. A margin advantage is evidence of economics, not proof of loyalty.
The plain conclusion is that Sally has a meaningful footprint, a long list of professional relationships and a set of brands that earn good margins. Those are the ingredients of a distribution advantage: it is easier and cheaper for a stylist in a mid-sized town to buy from the BSG store down the road than to wait for a manufacturer's direct shipment, and easier for a do-it-yourself colorist to get advice and a full kit at Sally than to assemble it online. What the record does not support is a hard-to-replicate moat. Suppliers can leave on short notice, a major supplier owns a rival distributor, and customers have alternatives at every turn. The advantage is real but rentable, and that distinction matters most when one looks at what happened when Sally tried to expand the footprint itself.
IV. The Store Count Kept Rising, Then 365 Stores Closed
By 2016, Sally Beauty Holdings had passed 5,000 locations, a milestone that capped a decade of steady expansion since independence.7 It had grown from fewer than 3,400 stores at the moment of separation to a network that stretched across the United States, Canada, Mexico, the United Kingdom, continental Europe and South America.4 For a specialty retailer, the store count was the most visible proof of success. More doors meant more customers within a short drive, more stylists who could pick up products between appointments, and more leverage over suppliers who wanted shelf space.
Fiscal 2016 was also the year revenue peaked at about $4.0 billion and operating margin stood around 12.6%.3 Within six years, the strategy turned. In fiscal 2022, the company announced a plan to close approximately 330 Sally Beauty stores and 35 BSG stores, along with two distribution centers, a contraction of 365 stores, or several percent of the fleet.8 The plan carried a $24.8 million impairment charge, recognizing that some of the assets in those locations were worth less than their carrying value.8
The closures are meaningful contrary evidence to the simplest version of the scale story. If more locations had automatically meant more profitable scale, closing hundreds of them would make no sense. Instead, management concluded that a portion of the network was not earning its keep: stores too close to one another, in trade areas whose demand had moved online or to other channels, or whose leases cost more than the sales they produced. The company was paying rent, staff and inventory to stand in places its customers no longer needed it to be.
This does not prove that the whole footprint was misallocated. A network of thousands of stores will always have a tail of weak performers, and closing them can improve the economics of the rest by moving sales to nearby stores and cutting fixed costs. The right test is what happened next: whether comparable sales and profitability in the surviving stores improved after the closures. And here the record is mixed. Revenue over the decade from fiscal 2015 to fiscal 2025 compounded at about negative 0.4% a year.3 Operating margin fell from roughly 12.9% in fiscal 2015 to about 7.6% in fiscal 2024 before recovering.3 The store closures happened in the middle of that period of drift, and by mid-2026 the company was still running with 47 fewer stores than a year earlier.9
It would be tempting to conclude that Sally's early acquisitions caused the later stagnation. The evidence does not support that simple story. Look at the early international deals. The company bought the Scottish group behind its UK expansion, a business with almost 100 stores, for about $57.8 million in February 2007.4 It bought Pro-Duo, a Belgian cash-and-carry retailer with 40 stores, for about €19.3 million in May 2008.4 Those per-store figures are tempting to compare, roughly half a million dollars per location in each case, but they are not like-for-like valuations. The businesses had different sizes of stores, different mixes of wholesale and retail, different profitability and different real estate. The filings do not provide enough peer transaction data to conclude that Sally overpaid. What the deals do show is the strategy of that era: Sally treated geography and door count as growth, and bought its way into markets where building from scratch would have been slow.
The contrast with the present is instructive. In 2025 the company bought the assets of Flair Hair & Beauty Supply for about $2.5 million.3 That is a small strategic addition, roughly the cost of a few new stores, not a material bet on footprint. Today's management treats acquisitions as fill-ins rather than engines, which is a reasonable posture for a business whose existing network is already larger than its demand once justified.
There were smaller signals of the same theme along the way. In fiscal 2025, the company recorded trade-name impairments of about $4.5 million, tied to lower projected revenue for a specific product line.3 In the context of a $3.7 billion business, that is not a crisis. It is a reminder that some owned brands fade, and that the brand portfolio, like the store portfolio, needs periodic pruning.
Strategy has moved from expansion to optimization. The company has cut underperforming stores, exited most full-service distribution in parts of Europe, and is now reworking the stores it keeps.2 The flagship of that effort is a remodel format called "Ignited," which management said stood at about 40 stores by the March 2026 quarter, with a target of about 80 by the end of fiscal 2026, and which it described as performing above the rest of the fleet.9 On the first-quarter call, Denise Paulonis said that units per transaction and average ticket in the Ignited stores continued "to trend above the rest of the fleet."10 The company has not disclosed the comparable-sales lift, the return on remodel spending, or how long the uplift lasts. When an analyst asked how quickly the remodel program would ramp, management said it would talk about the 2027 pace toward the end of calendar 2026.9 That timing matters. Eighty remodeled stores in a fleet of thousands cannot move consolidated comparable sales much on their own, so the remodel is still a pilot, and a pilot whose economics shareholders have not been shown.
Alongside the remodels, management guided to a roughly flat store count for fiscal 2026, a sign that the era of large closure programs has given way to steady pruning.10 In Europe, the company has gone further and exited most of its full-service distribution, the business of delivering professional products to salons, and Paulonis cited that transition as one reason international Sally results lagged the stronger North American stores.2 Each of these choices narrows the business toward the places and formats where it believes it can earn its keep. Each also gives up some revenue in the process, which is part of why sales have struggled to grow even as margins improved.
The lesson of the closures is that store count is the wrong measure of scale for Sally. The useful question is whether each store and each sales channel can earn more: more sales per square foot, more profit per transaction, more repeat visits from stylists. That shift, from adding doors to making the doors work harder, is exactly the challenge the current management team inherited, and the one it has tried to answer with a cost program.
V. Fuel for Growth Meets Flat Comparable Sales
Denise Paulonis took the top job at Sally Beauty in 2021, after serving as chief financial officer of Sprouts Farmers Market, the natural-foods grocer.11 She arrived as a finance-trained operator in a business that, by then, needed two things at once: discipline over costs that had drifted upward as sales stalled, and a reason for customers to visit more often. Her signature answer to the first need was Fuel for Growth, a multi-year program to strip costs out of sourcing, freight, distribution, store operations and overhead, and to recycle part of the savings into the business.
The name carried a promise. The savings were meant to fund growth initiatives, not merely to flatter margins. In the company's investor presentation in December 2024, management said the initiative had delivered about $28 million of benefit in fiscal 2024, expected more than $40 million in fiscal 2025, and would reach cumulative run-rate benefits approaching $120 million by fiscal 2026.12 It is unusual for a management team to publish specific, dated savings targets, and it creates a useful test of credibility.
What the savings bought
The test result so far was favorable on delivery. Fiscal 2025 operating margin rose to about 8.9% from about 7.6% the year before, a gain of more than a full percentage point on almost unchanged sales.3 The company's own explanation is specific. Gross margin rose about 70 basis points, helped by better product margins, lower freight and distribution costs, lower shrink, which is the retail term for inventory lost to theft, damage and error, and Fuel for Growth savings.3 Those are real improvements in the cost of getting a product from a manufacturer's dock into a customer's bag.
The unfavorable side sits in the same filing. Fiscal 2025 sales fell about 0.4%, and selling, general and administrative expenses in the Sally segment rose to about 45.2% of segment sales from about 43.8%, driven by labor costs, the deleverage that comes when fixed costs are spread over flat sales, and impairments.3 In other words, the supply chain got cheaper while the stores got more expensive relative to what they sold. The savings were real, but part of them was absorbed by the cost of running a store network whose sales were not growing.
The quarterly cadence of fiscal 2026 shows how the savings flowed through. The program contributed about $14 million of pre-tax benefit in the December quarter, about $9 million in the March quarter and about $9 million in the June quarter, mostly in gross margin and a smaller share in selling and administrative costs.1092 Adjusted gross margin rose by between about 0.4 and 0.8 percentage points in each of those quarters, while adjusted selling costs kept climbing: in the March quarter alone, they rose by about $20 million year over year.9 The savings, in other words, were being spent as fast as they were being found, on store labor, marketing, remodels and the new categories management hopes will reignite traffic. That is exactly what a program called Fuel for Growth is supposed to do. The open question is whether the spending is buying growth or simply holding the line.
By fiscal 2026, the program was in its third and final year. On the first-quarter call in February 2026, Paulonis called it "year three of the program" and said the company expected about $45 million of savings in the year and about $120 million of cumulative run-rate savings by fiscal year-end.10 The $45 million is the benefit within fiscal 2026, while the $120 million is a cumulative run-rate measure over three years. Those are not the same yardstick, and comparing them directly would overstate the program. Taken at face value, about $28 million, more than $40 million and about $45 million in the three program years are broadly consistent with the target that management set out in December 2024. On this measure, management did what it said it would do.
The difficulty is that the stated purpose was growth, and growth has been harder. In the first quarter of fiscal 2026, consolidated comparable sales were flat; Sally segment comps rose a tenth of a percent; and care sales in the Sally segment fell about 6%.10 In the second quarter, comps rose about 1.3%, helped by a strong color business and an easy comparison with a soft prior year; Sally's U.S. and Canada stores posted comparable sales growth of about 4.4%.9 By the third quarter, the split between the segments had returned.2 Management narrowed its full-year guidance to comparable sales growth of about 0.5%, from a prior range of flat to 1%.2
The guidance path through the year was itself a credibility test, and it was a useful one. In February, the company guided fiscal 2026 net sales between about $3.71 billion and $3.77 billion, comparable sales flat to up 1%, and adjusted operating earnings of $328 million to $342 million.10 In May, it tightened the sales range to $3.725 billion to $3.75 billion and kept the rest.9 In August, it narrowed sales to $3.725 billion to $3.733 billion, comparable sales to about 0.5%, and operating earnings to $329 million to $335 million, while trimming the top of its earnings-per-share range.2 The midpoint of the sales range drifted down; the midpoint of the profit range barely moved. That is the signature of a management team that can control costs with some precision but cannot command demand. The team also avoided a large guidance cut during the year, which is worth something in a consumer business where many peers did.
That pattern says something important. Color is working: the Sally segment's color sales grew about 8% in the third quarter and about 11% in the second.29 Care, the shampoos, conditioners and treatments that customers can buy almost anywhere, has been shrinking, which is exactly the category where a specialist has the least advantage over mass merchants and online sellers. BSG's comparable decline in the third quarter shows that even the professional channel, which ought to be stickier, is not immune.
What the analysts asked
The earnings calls of fiscal 2026 show how analysts tested the story, and how management answered. On the first-quarter call, Paulonis described Sally customers as "a bit more choiceful" in discretionary categories and "really being disciplined in where they shop in places like the care category," while insisting "the customer in general is healthy."10 That is a candid description of a value-conscious shopper, paired with an optimistic overall read.
In the second quarter, Susan Anderson of Canaccord Genuity, Oliver Chen of TD Cowen and Olivia Tong of Raymond James pressed on care, the consumer and store performance.9 Management said BSG care had been "flat for three consecutive quarters" and described the fix for Sally care as a planogram reset in August with about 110 new items and a men's section doubled from four feet of shelf to eight.9 Paulonis said the consumer was "remaining resilient" but flagged "choiceful behavior" in stores serving lower-income customers, and said the company was watching the conflict in the Middle East and fuel prices.9 Asked about promotions, management acknowledged "a bit of a heightened promotional environment" while saying margins had performed well.9
By the third-quarter call, the answers had become more specific about what was not yet known. Asked by a TD Cowen analyst about early signals from the care reset, Paulonis said it was "very early on."2 Asked about fragrance, a new category pitched partly around affordable alternatives to designer scents, she said buyers were generally "not necessarily a new customer" but existing shoppers adding to their basket.2 Susan Anderson asked why international Sally results trailed the U.S. and Canada; Paulonis pointed to the European transition out of most full-service distribution and to Mexico, where "macroeconomic conditions there have definitely softened a bit."2 On promotions, she said "we are seeing promotional activity on the rise," while gross margin "remains strong."2 She also acknowledged that a "lower income consumer might be more willing to trade down to mass" in core care.2
Put the prepared remarks next to the answers, and a consistent picture emerges. Management is precise about savings, margins and capital returns, and precise about what is working in color. It is honest about soft spots: care, lower-income shoppers, Mexico and BSG transactions. Where it is least specific is the question that matters most: how much of the margin gain would survive after Fuel for Growth ended in September 2026. Chief financial officer Adrianne Lee said gross margin was in a good range and that efficiencies in selling and administrative costs would continue, without quantifying how durable the savings will prove.2 That is not evasive, but it is not proof either. The proof will be several periods in which sales growth and margin gains arrive together.
At the centre of all this is the chief executive, and her incentives deserve an honest look. Paulonis's reported total compensation was about $9.1 million in fiscal 2025, including about $6.0 million in stock awards and about $1.9 million in non-equity incentive pay.11 The 2025 proxy reported that she beneficially owned 732,446 shares, a figure that includes vested options.11 Ownership aligns her interests with shareholders, but it is not evidence of performance.
The credibility check is in the path. Her pay rose from about $7.2 million in fiscal 2023 to about $7.5 million in fiscal 2024 and about $9.1 million in fiscal 2025, while net earnings went from about $185 million to about $153 million and then about $196 million.11 Pay rose through a year in which earnings fell, then rose further as they recovered. Shareholders largely accepted it: at the January 2026 annual meeting, about 75.4 million votes supported the say-on-pay resolution and about 9.3 million opposed, roughly 89% support.13 That is a passing grade with a notable minority dissent. Board chair Diana Ferguson received about 1.0 million votes against, while director Debra Perelman received about 5.7 million against, a more pointed signal.13
Then there was the change in the finance seat. Marlo Cormier, chief financial officer since November 2020, left effective April 11, 2026, and Adrianne Lee became chief financial officer on April 28, 2026.14 A CFO transition in the final year of a cost program, with the program's legacy still being judged, is a reason to scrutinize the next set of numbers and guidance carefully. It is not, on its own, a verdict on management. The sharper verdict is this: Fuel for Growth did what it promised for margins and has not yet done what its name promised for growth. Savings alone cannot settle the growth question, and the next place to look for an answer is the cash.
VI. The Cash Arrives, But Inventory Sets the Pace
Look at Sally Beauty's cash-flow statement over twelve years and a reassuring pattern appears. From fiscal 2014 to fiscal 2025, the company reported about $2.5 billion of cumulative net profit and about $3.7 billion of cash from operations.3 Operating cash flow exceeded reported profit by about $1.2 billion, or about one and a half times. For a business that critics sometimes accuse of standing still, that is a striking record: the profits on the income statement have, over a long period, turned into even more cash in the bank.
Why the gap? The biggest contributors are charges that reduce profit without consuming cash in the same period. Depreciation and amortization, the accounting cost of wearing out store fixtures, computer systems and distribution centers over time, was about $100 million in fiscal 2025 alone.3 Share-based compensation was about $19 million, and the amortization of debt financing costs added a little more.3 Those items are real costs in the long run, because stores and systems must eventually be replaced, but they explain why cash can comfortably exceed net profit in any given year. There is no sign in the fiscal 2025 cash-flow statement that capitalized operating costs are inflating the gap.3
Fiscal 2025 shows the other ingredient, working capital, at work. Inventory released about $50 million of cash as the company sold down stock faster than it replaced it.3 Meanwhile other receivables used about $26 million, payables and accrued liabilities used about $32 million, and income taxes payable used about $16 million.3 The year also included a gain of about $27 million on the sale of property, which flattered profit but was stripped out of operating cash flow because the proceeds show up in investing activities.3 The net effect was operating cash flow of about $275 million and free cash flow, after about $102 million of capital spending, of about $173 million.3 A material slice of that cash came from carrying less inventory than the year before.
The receivables line is where an inattentive reader can draw the wrong conclusion. At September 2025, trade receivables, money owed by customers buying on credit, were only about $32 million, with an allowance for doubtful accounts of under $1 million.3 Other receivables were much larger, about $85 million, but they are mostly vendor rebates, promotional allowances from suppliers and incentives landlords owe for store improvements.3 That second pool is not trade credit risk; it is money suppliers and landlords owe Sally. The company does not disclose an aging of receivables or overdue balances by customer, but for a business whose customers mostly pay at the till or on short terms, credit risk is not where the cash story lives.
The cash story lives in inventory. A beauty supply store has to carry a vast assortment, every shade of color, every developer strength, every tool, so that the stylist or do-it-yourselfer who walks in finds exactly what she needs. That assortment is the service, and it is expensive. In fiscal 2014, Sally carried about 160 days of inventory, measured against the cost of what it sold. By fiscal 2025, that had stretched to about 201 days, after peaking above 200 the year before.3 Put more simply, a product sitting on Sally's shelves or in its warehouses now waits roughly six and a half months, on average, before it is sold. The cash conversion cycle, the number of days between paying for inventory and collecting cash from customers, lengthened from about 119 days to about 167 over the same period.3
That trend is the strongest counterevidence to the cash-generation story. A longer cycle means more of the company's money is tied up in product for longer, and the long-run pattern has been in the wrong direction. Fiscal 2022 shows what happens when it moves the wrong way quickly: free cash flow collapsed to about $57 million as inventory built up, from more than $300 million in each of the prior two years.3 The inventory release of fiscal 2025 partly reversed that build, and by June 2026 inventory stood at about $996 million, about 1% lower than a year earlier.2 Management has guided to about $200 million of free cash flow for fiscal 2026.2 The quarterly figures showed how that was building. The March quarter produced about $73 million of operating cash flow and about $44 million of free cash flow, and the June quarter about $81 million and $62 million.92 Hitting the full-year guide would put free cash flow above the $173 million of fiscal 2025, but it would also lean on another year in which inventory does not grow. A company that is simultaneously adding fragrance, refreshing care with more than a hundred new items and remodeling stores is a company that will be tempted to stock more, not less.
The conclusion is that Sally's cash conversion has been strong over the long run, but the latest year's cash was helped by an inventory release that cannot be repeated indefinitely. Inventory cannot fall forever without shelves going empty and customers going elsewhere. The measure to watch is operating cash flow relative to net profit after inventory stabilizes, and after the timing effects in payables and receivables reverse. If cash continues to exceed profit by a wide margin in years without inventory releases, the cash story is durable. If the gap narrows to depreciation alone, the business will still generate cash, but less spectacularly than the free-cash-flow yield suggests. And whatever the cash turns out to be, the company still has to decide who gets it.
VII. Debt Down, Buybacks Continue
Every quarter, Sally Beauty's finance team faces the same allocation decision. One pile of cash goes to the term-loan lenders. Another goes to buying back stock. A third goes into stores, systems and distribution centers. Beneath all three sits a commitment that never makes the headlines: hundreds of millions of dollars of rent owed to the landlords of thousands of locations.
Start with the debt itself. At the end of fiscal 2025, Sally had about $875 million of principal borrowings: $600 million of 6.75% senior notes due 2032, issued in 2024 to refinance older debt, and a $275 million floating-rate term loan due 2030.3 It had no borrowings on its asset-based revolving credit line, which had about $482 million of availability subject to borrowing-base limits.3 Principal debt had fallen from about $994 million a year earlier, and continued to decline to about $835 million at the end of March 2026, when the company reported compliance with its covenants and no borrowings under the revolver.315 Another $20 million of term loan was repaid in the June quarter, and management put net debt at about 1.4 times its earnings before interest, taxes, depreciation and amortization.2
That is a big change from the company's leveraged start at independence. As debt came down, the ratio of total borrowings, leases included, to equity fell from more than six times in fiscal 2021 to about two times by September 2025.3 Return on equity of about 22% in the year to June 2026 now describes a real equity base rather than an accounting artifact. Credit markets noticed. In March 2025, S&P Global upgraded Sally to BB from BB-, with a stable outlook, citing debt reduction and operating momentum after a $41 million term-loan repayment.16 The agency expected leverage in the mid-two-times range on its own adjusted measure, which includes leases, and free operating cash flow of about $150 million to $200 million a year, and named sustained leverage above three times, competitive pressure or operating missteps as reasons it might reverse.16 That rating view predates the June 2026 quarter, but the leverage trend since then has moved in the direction the agency wanted.
Now add the leases. At the end of fiscal 2025, Sally's operating lease liabilities were about $697 million on a present-value basis, with about $884 million of undiscounted future payments.3 Lease liabilities are not debt principal, and they should not be added to the bond figure without explanation. But economically, a ten-year store lease is a fixed obligation that has to be paid whether customers show up or not. Combined, the company's debt and lease obligations were close to $1.6 billion at fiscal 2025 year-end, roughly twice its book equity.3 That is the true weight on the balance sheet, and it explains why the store closures of 2022 mattered as much for fixed costs as for revenue.
Then the buybacks. In fiscal 2025, Sally repaid $115 million of term-loan principal voluntarily and repurchased about 5.0 million shares.3 Its board has authorized up to $1 billion of repurchases, extended through September 30, 2029, though the authorization is a ceiling, not a commitment.3 Weighted-average basic shares fell from about 107.3 million in fiscal 2023 to about 100.7 million in fiscal 2025.3 In the June 2026 quarter alone, the company spent about $25 million on about 1.9 million shares, roughly $13 a share, and it has said it intends to devote about half of fiscal 2026 free cash flow to buybacks.2 The shares now trade around $18.
The record therefore shows both debt reduction and repurchases, rather than a strict priority for one. Compare that to reinvestment. Fiscal 2025 capital spending was about $102 million, about 2.8% of revenue, roughly matching depreciation.3 The company does not disclose research and development as a separate line. Sally has paid no cash dividends in the past twelve years; shareholder returns have come entirely through buybacks.3 Among the holders receiving those returns are index and quantitative managers: the 2025 proxy listed BlackRock at about 15.2% and The Vanguard Group at about 11.8%, and Dimensional Fund Advisors reported about 6.5% as of September 30, 2026.1117 There is no controlling shareholder pushing for a particular use of cash.
A skeptical investor would put the question bluntly. If sales weaken, should management pause the buybacks and keep cash to protect liquidity, or are repurchases attractive at a single-digit earnings multiple? The answer depends on what one counts. At roughly ten times earnings, buying back stock looks cheap if the earnings hold. But the right comparison is not just the price-to-earnings ratio. It is the return from retiring stock against the return from retiring floating-rate term debt, and against the safety of having cash when the next promotional cycle or consumer slowdown arrives, with leases still due every month. A company with fixed lease costs and flat sales has less room for error than its low multiple suggests. So far, management has balanced both priorities while leverage fell, which is the best evidence that it is not over-reaching. Whether the balance tips toward buybacks or debt when sales disappoint is the next test, and it leads directly to what the market is paying for.
VIII. The Investment Case: A Recovery or a Value Trap?
Despite a decade of barely growing sales, Sally Beauty's shares stood at their 52-week high on November 1, 2026. The market was clearly paying for something. The question is whether it was paying for a durable recovery or for the most optimistic version of a cost-cutting story.
The valuation sits in a narrow band. The shares trade at a modest premium to their five-year norm.3 Sally's enterprise value, about $3.2 billion including debt, is about 8.3 times trailing operating profit before depreciation and amortization, and about 0.8 times sales.3 Its free-cash-flow yield remains high.3 In plain terms, the market prices Sally like a business that will not grow much and might shrink, but that will generate a steady stream of cash in the meantime. The rerating from below eight times earnings to almost ten suggests investors have started to believe that the margin recovery is more durable than they once thought.
Give the bull case its strongest form. Professional beauty demand is stubborn: hair grows, color fades, and stylists need supplies every week whatever the economy does. Sally has recognizable owned brands that earn higher margins, a broad distribution network that reaches both do-it-yourselfers and professionals, a color business that is growing, and a cost structure that has been reset. Those margins and cash flows have already reduced debt and shrunk the share count. If comparable sales can grow even 1% to 2% a year, operating leverage on a leaner cost base could lift earnings faster than sales, and a company buying back several percent of its shares each year at a low multiple could compound earnings per share at a respectable clip without heroic assumptions.
Give the bear case equal force. Manufacturers can distribute direct, and one of the largest, L'Oréal, owns a competing distributor. Customers have alternatives at drugstores, mass merchants, Ulta and Amazon, and the company's own commentary in 2026 acknowledges lower-income shoppers trading down to mass in care and rising promotional activity.2 The largest suppliers account for almost half of purchases on short-notice contracts. The cash conversion cycle has lengthened by more than six weeks over a decade, so more cash is tied up in product. Fixed lease obligations do not shrink when sales soften. And the ten-year sales record is weak.
Testing the moat
Run the frameworks once, against the evidence. In the language of Michael Porter's five forces, supplier power is high: the five largest manufacturers dominate purchases and can terminate on short notice. Buyer power is moderate: individual shoppers and stylists are fragmented and none is a big customer, but they can switch easily because the products are widely available. The threat of substitutes is real: the salon visit itself, mass-market hair color, and online marketplaces. The threat of new entrants is moderate, since building a national store network takes capital and years, but online sellers do not need one. Rivalry is intense, with Ulta, SalonCentric, Amazon and mass merchants all competing for parts of Sally's wallet.
Hamilton Helmer's seven powers ask a narrower question: what lets a company earn persistently higher returns than rivals? Sally has some scale economies in buying and distribution, but not overwhelming ones, since its suppliers are bigger than it is. It has a modest cornered resource in exclusive distribution rights, but those rights can be withdrawn. Switching costs are low for most shoppers, though a stylist used to a BSG consultant and a particular color system has some habit to break. Brand power exists in owned labels and the Sally banner, but there is no disclosed evidence of pricing power. There is no network effect, and process power, the kind of operational excellence that is hard to copy, has not been proven. The verdict is that Sally's advantage is a distribution position, earned through footprint and relationships and protected modestly by owned brands, rather than a structural moat. The segment numbers from the June 2026 quarter add a final clue. The Sally segment's operating margin rose about 80 basis points to about 16.6%, while BSG's slipped about 20 basis points to about 12.3%, even though BSG's gross margin improved.2 The professional business, the one with the strongest claim to relationships and exclusive brands, is the one losing transactions and margin. If BSG had a true moat, this is where it should have shown resilience. That narrows the bull case without rejecting it: the business can earn decent returns, as its roughly 11% return on invested capital in fiscal 2025 suggests, but those returns have fallen from more than 20% a decade ago.3
The balance-sheet risk ties straight back to the operating model. Leases and store labor remain when consumer demand softens, which is why a few points of comparable-sales decline can erase a large share of operating profit. Part of the debt, the term loan, carries a floating rate, so financing costs move with interest rates.3 Foreign exchange matters but should be kept in proportion: less than 20% of sales were in non-U.S. currencies in each of fiscal 2023 to 2025, with about $672 million of sales outside the United States in fiscal 2025.3 Currency moves can lift or depress reported sales, as when roughly 1.5 percentage points of the second quarter's 2.3% sales growth came from currency.9 That is why consolidated sales growth is a weaker signal than comparable sales.
There are no significant loss contingencies in the latest annual report, and the auditor gave clean opinions on the financial statements and internal controls.3 A small disputed tax position, with about $4.3 million paid to the IRS in fiscal 2023 while the company maintains its interpretation, is identifiable but not material.3 The risks that matter are commercial, not legal.
Three operating measures will decide the thesis. The first is comparable sales by segment: the Sally segment grew about 1.6% in the June 2026 quarter while BSG fell about 2.1%, leaving consolidated comps flat.2 The second is consolidated operating margin once Fuel for Growth savings stop adding to the line, about 9.2% in the June 2026 quarter, up from about 8.4% a year earlier.1 The third is operating cash flow against net profit once inventory stops falling, about 1.4 times in fiscal 2025 with help from the inventory release.3 If comps turn sustainably positive while margin holds near 9%, the recovery thesis gains real support. If comps stay flat and margin slips as savings fade, the story reverts to a cash-generating business in slow decline.
The valuation check, then, is not whether ten times earnings is cheap in the abstract. It is whether future earnings and cash generation exceed the company's own history. A high free-cash-flow yield is only a margin of safety after debt service, lease payments and inventory needs are counted. The market's move toward a higher multiple has already priced in some durability. Proving it is the company's job, and the clearest way to see whether it can is to draw the lessons from its history.
IX. Playbook: Business & Investing Lessons
A chain that celebrated its 5,000th location in 2016 decided six years later to close 365 stores.78 That reversal, more than any single quarter, distills what Sally Beauty can teach founders, operators and investors.
The first lesson is that a store count is a footprint, not a moat. For a decade after independence, Sally added doors at home and abroad, by building and by buying, and the rising number felt like progress. But the number did not stop sales from compounding backward at about 0.4% a year over the decade to 2025.3 Doors are a bet on future demand in a particular place. When that demand moves online, to mass retailers or to a competitor's distributor, the door becomes rent. The only way to know whether a footprint is an advantage is to watch comparable sales in the stores that remain, and Sally's evidence there is still arriving.
The second lesson is that cash can be real and still be lumpy. Over twelve years, Sally turned about $2.5 billion of profit into about $3.7 billion of operating cash, a record many faster-growing retailers would envy.3 Yet a single year's figure can swing by hundreds of millions depending on whether inventory is building or shrinking, as the collapse of fiscal 2022 and the release of fiscal 2025 show. For an investor looking at a 12.8% free-cash-flow yield, the right question is what the cash looks like in a year when the shelves are neither filling up nor emptying out.
The third lesson is that a savings program buys time; it cannot supply demand. Fuel for Growth delivered roughly what management promised, and the margin recovery is visible. But in the program's final year, consolidated comparable sales were still flat.2 Cost discipline is a necessary condition for a recovery in a mature retailer. It is not sufficient. A specialist earns the right to exist by giving customers a reason to come back, and no amount of freight savings substitutes for that.
The fourth lesson is that a buyback is a capital-allocation decision, not a strategy. Sally has bought back shares while repaying debt and carrying hundreds of millions of dollars of lease obligations. At a low multiple, that can create real value for remaining shareholders. But repurchases do not grow the business; they divide its existing earnings among fewer shares. A company that leans on buybacks to grow earnings per share is telling investors that it has found nothing better to do with its cash, and whether that is wise depends on what the business does with the cash it keeps.
The deepest lesson is that a wide footprint and strong cash conversion can coexist with weak growth for a very long time. Sally's history is not a story of failure. It is a story of a profitable, cash-generating specialist that has struggled to turn its reach into expansion. Its next chapter depends on proving that cost discipline improves what customers experience, not just what the income statement shows.
X. Epilogue
As of early November 2026, Sally Beauty stands at a hinge. Its fiscal year closed on September 30, the last year of Fuel for Growth, and the company is preparing to report its annual results.2 A new chief financial officer has had six months to review the books and set the tone for next year's guidance.14 Management's narrowed guidance called for comparable sales growth of about 0.5%, adjusted operating earnings of about $329 million to $335 million, and free cash flow of about $200 million.2 Those numbers, when they arrive, will close the book on the cost program. The questions they cannot answer are what happens after it.
The first moment to watch is the shape of comparable sales by segment. If the Sally segment can sustain its gains in color and the August care reset stabilizes the category that has been falling, and if BSG's transaction decline in the June quarter proves temporary, the business will have shown that its two routes to the customer can grow together. If consolidated sales rise mainly on currency or on a weak prior-year comparison, the recovery will look more like arithmetic than demand.2
The second moment is the margin after the savings roll off. Management has said that gross margin is in a good range and that efficiencies will continue, but it has not quantified how much of the improvement is permanent.2 An operating margin that holds around 9% in fiscal 2027 without a new program would be the strongest evidence yet that the recovery is structural rather than temporary. A margin that slips back toward 8% would suggest that the savings were filling a hole rather than building a floor.
The third moment is the cash. With inventory already reduced, fiscal 2026 and 2027 will show whether operating cash flow continues to exceed net profit without further releases. Watch, too, the split between debt repayment and buybacks, with lease obligations kept in the picture. If buybacks rise while sales stall, the activist's question about protecting liquidity will become harder to dismiss.
There is also a quieter question about who will be in the room when those answers arrive. The register of owners is dominated by index and systematic investors rather than a concentrated holder with a view on strategy, and the company had only 377 holders of record in November 2025, with most shares held in street name.3 With no activist on the register, the discipline on capital allocation comes mainly from the board, from the bond and loan markets, and from the share price itself. A stock trading at its 52-week high gives management room. It also raises the cost of each share repurchased, which makes the debt-versus-buyback decision a live one again the moment the annual guidance is set.
And then there are the experiments: the remodeled stores, the fragrance line, the growing digital business, the new items on the care shelves. Each is promising. None yet has a disclosed return. They become evidence only when management links them to sales growth, margin or repeat purchasing in a way investors can measure.
The tension that remains is the one the August quarter laid bare: Sally Beauty has yet to prove the recovery can lift sales as well as margins while preserving cash conversion without another turn of the inventory dial.
XI. Outro
Go back to the New Orleans store. The modern company still lives on that idea, serving both amateurs and professionals. Few companies serve both the amateur and the professional in the same category with the same supply chain. That dual audience is what makes Sally Beauty unlike anyone else in this story, and it is also why its growth has been so hard to find: it is caught between the mass merchant that the amateur can choose instead, and the manufacturer that the professional can buy from directly.
The cash and the margin recovery are real. Whether they can bring growth back is still the defining question. Sally Beauty knows how to get beauty products into people's hands; the next chapter is whether it can make that reach grow again.
References
-
Sally Beauty Holdings Reports Third Quarter Fiscal 2026 Results — Sally Beauty Holdings, 2026-08-03 ↩↩↩
-
Sally Beauty (SBH) Q3 2026 Earnings Call Transcript — The Motley Fool, 2026-08-03 ↩↩↩↩↩↩↩↩↩↩↩↩↩↩↩↩↩↩↩↩↩↩↩↩↩↩↩↩↩↩↩↩↩
-
Sally Beauty Holdings Form 10-K for fiscal year ended September 30, 2025 — SEC, 2025-11-13 ↩↩↩↩↩↩↩↩↩↩↩↩↩↩↩↩↩↩↩↩↩↩↩↩↩↩↩↩↩↩↩↩↩↩↩↩↩↩↩↩↩↩↩↩↩↩↩↩↩↩↩↩↩↩↩↩↩↩↩↩↩↩↩
-
Sally Beauty Holdings Form 10-K for fiscal year ended September 30, 2009 — SEC, 2009 ↩↩↩↩↩↩↩↩↩↩↩↩↩↩↩↩
-
Sally Beauty Q2 2026 Earnings Call Transcript — Stock Analysis, 2026-05-11 ↩↩↩↩↩↩↩↩↩↩↩↩↩↩
-
Sally Beauty (SBH) Q1 2026 Earnings Call Transcript — The Motley Fool, 2026-02-09 ↩↩↩↩↩↩↩
-
Sally Beauty Holdings 2025 Proxy Statement — SEC, 2025-12-10 ↩↩↩↩↩
-
Investor Relations Presentation, as of December 31, 2024 — Sally Beauty Holdings, 2025 ↩
-
Sally Beauty Holdings Form 10-Q for quarter ended March 31, 2026 — SEC, 2026 ↩
-
Sally Beauty upgraded to BB after debt reduction, positive sales momentum: S&P Global — Investing.com, 2025-03-21 ↩↩
-
Dimensional Fund Advisors Schedule 13G/A for Sally Beauty Holdings — SEC, 2026-10-08 ↩
 LinkedIn
 WhatsApp
 Reddit
 Hacker News
 Email
 Kindle
 RSS Feed
 Spotify
 Apple Podcasts
 Amazon Music
 Audible
 YouTube