Chart Industries: Engineering the Molecule Economy
The cryogenic tank sat half-buried in Ball Ground, Georgia, frost crawling across its surface like delicate spider webs. Inside, liquid nitrogen bubbled at minus 320 degrees Fahrenheit, cold enough to freeze the moisture in the air into instant snow. For most observers, it was just another industrial storage vessel. But for the engineers at Chart Industries, it represented something far more profound: the molecular infrastructure of the future energy economy.
This was October 2018, and Chart Industries—a company most investors had never heard of—was quietly becoming the picks-and-shovels play for the clean energy revolution. While Tesla grabbed headlines and hydrogen startups captured venture capital imagination, Chart was building the unglamorous but utterly essential equipment needed to store, transport, and process the gases that would power the next century. Five years later, that Georgia facility would become part of a company worth over $13 billion, acquired by energy giant Baker Hughes in one of the defining industrial deals of the decade.
The story of Chart Industries is not one of Silicon Valley disruption or consumer brand building. It's a tale of industrial transformation through strategic patience, a company that spent three decades mastering the physics of extreme temperatures before the world realized it needed exactly that expertise. From its founding in 1992 as a specialty manufacturer to its emergence as the "Nexus of Clean" infrastructure giant, Chart's journey offers profound lessons about timing, technical moats, and the power of being perfectly positioned when secular trends finally arrive.
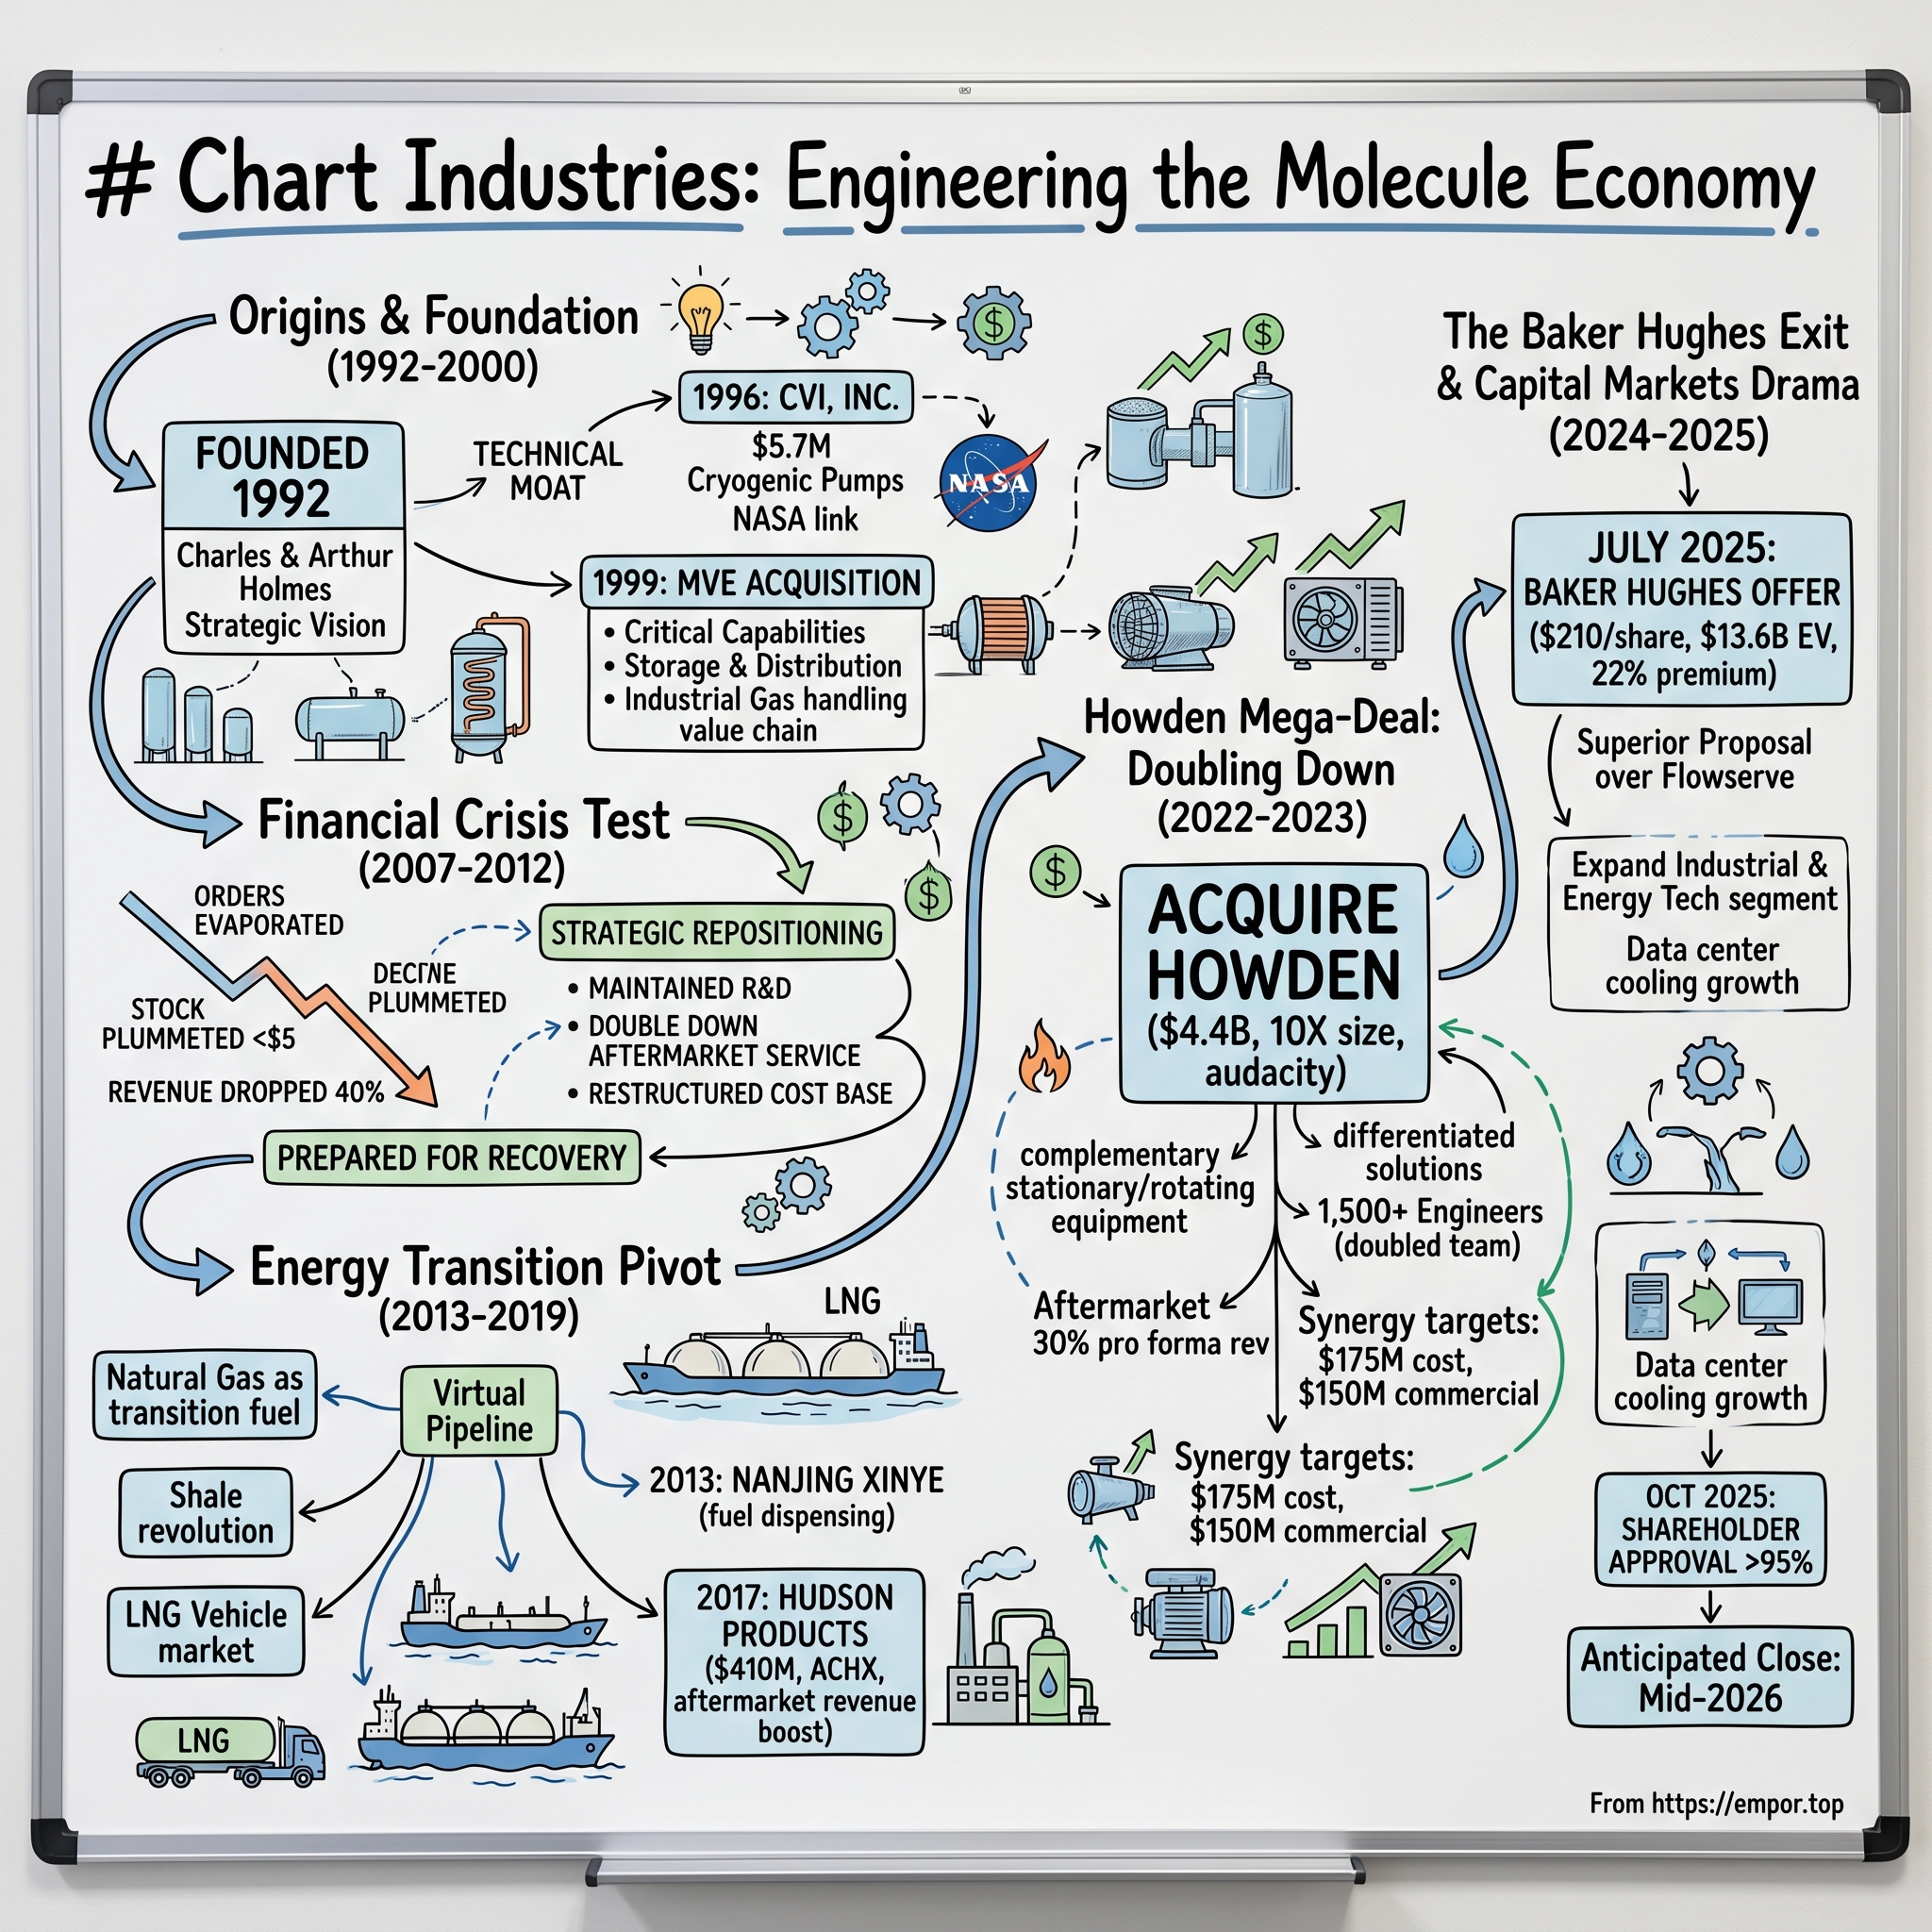
Origins & Foundation (1992-2000)
Chart Industries was established in 1992, born not from a garage startup story but from the entrepreneurial vision of brothers Charles and Arthur Holmes. Chart takes its name from the Holmes brothers, Charles and Arthur, whose combination of technological and financial know-how transformed a scattering of unrelated, largely private firms into a coordinated network of highly specialized companies. The brothers had previously acquired ALTEC International in 1985, a brazed aluminum heat exchanger manufacturer that had been spun off from the Trane Company. In keeping with their educational backgrounds and experience, Art took an active role in ALTEC's day-to-day management, while Charlie sought out acquisitions and obtained financing for the revitalized business.
The Holmes brothers understood something fundamental about industrial markets: the companies that master the unglamorous but technically demanding niches often build the most durable competitive advantages. ALTEC became the core of the Holmes brothers' holdings, a business that Arthur Holmes would later characterize as their "crown jewel." Under its new management, the company's line of brazed aluminum heat exchangers (BAHX, first launched in 1949) would become the industry standard. These large-scale devices are used to liquefy and isolate the component parts of atmospheric air--oxygen, nitrogen and argon--by cooling it to temperatures lower than −259°F. These low temperatures also facilitate safer, more efficient (and thus more cost-effective) transportation of gases, because the liquefied forms take up much less volume than the gaseous forms.
The early strategic moves that would define Chart's trajectory began immediately. In 1996, the company made its first major acquisition with CVI, Inc., which expanded Chart's cryogenic equipment offerings and market presence. CVI Incorporated, a Columbus, Ohio-based manufacturer of cryogenic vacuum pumps, was acquired for $5.7 million. Founded in 1959 to create systems for NASA, CVI gained decades of experience in creating devices that process and store liquid rocket fuel.
But the acquisition that truly set Chart's foundation came in 1999. On April 1, 1999, Chart Industries acquired manufacturer MVE from ACI Capital and American Securities. MVE, Inc. is a manufacturer and distributor of systems used to transport and store cryogenic elements (CO2, nitrogen, oxygen, and argon) in their liquid states. MVE's equipment is used in a wide variety of industries, including the steel, food, chemical, semiconductor, home health care, restaurant, and animal breeding and biological research. This acquisition brought Chart critical capabilities in cryogenic storage and distribution, expanding beyond just the liquefaction process into the full value chain of industrial gas handling.
The late 1990s were heady times for industrial companies. Renewed investor confidence had helped push Chart's stock to nearly $18 by mid-1997, and under the guidance of the Holmes brothers, ALTEC's business would quadruple from 1986 to 1996. The company continued its acquisition spree, purchasing Denver-based Cryenco Sciences Inc. for $21 million in 1997. By the end of the decade, Chart had assembled a portfolio of specialized cryogenic businesses that gave it unique capabilities across the industrial gas value chain.
What distinguished Chart from other roll-up stories of the era was the technical coherence of its acquisitions. While other industrial conglomerates chased diversification, Chart remained laser-focused on extreme temperature engineering. Every acquisition deepened its expertise in a field where the physics were unforgiving and the barriers to entry substantial. You couldn't simply hire a few engineers and compete in cryogenics—the knowledge was embedded in decades of experience, proprietary designs, and accumulated manufacturing know-how that couldn't be easily replicated.
The Financial Crisis Test (2007-2012)
The autumn of 2008 brought a reckoning for industrial America. Lack of investor confidence in bank solvency and declines in credit availability led to plummeting stock and commodity prices in late 2008 and early 2009. The crisis rapidly spread into a global economic shock, resulting in several bank failures. Economies worldwide slowed during this period since credit tightened and international trade declined. Housing markets suffered and unemployment soared, resulting in evictions and foreclosures. Several businesses failed.
For Chart Industries, the crisis struck at a particularly vulnerable moment. The company had been riding the industrial boom of the mid-2000s, with significant exposure to cyclical end markets. In February 2009, The Economist claimed that the 2008 financial crisis had produced a "manufacturing crisis", with the strongest declines in industrial production occurring in export-based economies. In March 2009, Britain's Daily Telegraph reported the following declines in industrial output, from January 2008 to January 2009: Japan −31%, Korea −26%, Russia −16%, Brazil −15%, Italy −14%, Germany −12%.
The impact on Chart was severe but not catastrophic. Industrial equipment orders evaporated virtually overnight as customers canceled projects, delayed maintenance, and preserved cash. The company's stock price, which had been trading in the mid-$30s before the crisis, plummeted below $5 by March 2009. Revenue dropped by nearly 40% from peak to trough. For a capital-intensive manufacturer with high fixed costs, this was an existential threat.
But crisis revealed character, and Chart's management team, led by then-CEO Sam Thomas, made decisions that would define the company's next decade. Rather than slash R&D spending—the typical playbook for industrial companies in distress—Chart maintained its engineering investments. The company recognized that the fundamental drivers of demand for cryogenic equipment—industrial gas consumption, LNG infrastructure, specialty applications—were not disappearing but merely pausing.
The strategic repositioning during the downturn proved prescient. Chart doubled down on its aftermarket service business, recognizing that even if customers weren't buying new equipment, they still needed to maintain their existing installed base. The company restructured its cost base, closing underperforming facilities and consolidating operations, but critically preserved its core engineering and manufacturing capabilities. By focusing on recurring revenue streams from service and parts, Chart built a more resilient business model that could weather future cycles.
The company also made a crucial observation: the financial crisis was accelerating certain structural trends. Environmental regulations were tightening globally, natural gas was emerging as a transition fuel, and developing economies were investing heavily in industrial gas infrastructure despite the temporary slowdown. Chart positioned itself not for the recovery of the old economy, but for the emergence of a new one.
By 2010, as industrial production began to recover, Chart was lean, focused, and strategically positioned. The company had used the crisis to eliminate weaker competitors, strengthen customer relationships through reliable service during tough times, and prepare for what management saw as an inevitable boom in natural gas infrastructure. The lessons learned during this period—the importance of aftermarket revenue, the value of maintaining technical capabilities through cycles, and the power of countercyclical positioning—would become core tenets of Chart's strategy.
The Energy Transition Pivot (2013-2019)
The transformation began with a simple observation: natural gas was becoming the world's transition fuel. By 2013, the shale revolution had fundamentally altered global energy markets, and Chart's leadership recognized that the infrastructure needed to transport and store liquefied natural gas represented a generational opportunity. But unlike the large-scale LNG export terminals that captured headlines, Chart focused on something more nuanced: the small-scale LNG revolution that would bring natural gas to off-grid locations, fuel trucks and ships, and provide energy resilience to businesses and communities.
In 2013 Chart acquired Nanjing Xinye Electric Engineering Co., Ltd., a specialist in electrical control systems and fuel dispensing. The combination of Chart and Nanjing Xinye technologies enables Chart's Changzhou facility to provide complete LNG fueling solutions incorporating the fueling station, dispensers and electronic control and metering systems. This acquisition marked a critical shift from being purely an equipment manufacturer to becoming a solutions provider for the emerging LNG vehicle market.
The concept of the "virtual pipeline"—using trucks to deliver LNG to locations without pipeline access—was gaining traction globally. Industrial facilities in remote locations, island nations dependent on diesel generation, and mining operations in frontier markets all needed cleaner, cheaper energy solutions. Chart's small-scale liquefaction plants, ISO containers for LNG transport, and regasification equipment formed the backbone of this virtual pipeline infrastructure. The company wasn't just selling equipment; it was enabling an entirely new energy distribution paradigm.
But the true strategic masterstroke came in 2017 with the acquisition of Hudson Products Corporation for $410 million in cash from Riverstone Holdings LLC. Hudson complements Chart's Energy & Chemicals ("E&C") segment with the addition of its Fin-Fan® brand and other ACHXs which broaden E&C's end market diversity from primarily LNG, industrial and natural gas to include HVAC, petrochemical and power generation. The addition of Hudson's fans business, known by the Tuf-Lite® brand, is a new product category for Chart, and allows E&C to offer a broader technology solution for our customers.
The Hudson acquisition was about more than product expansion. Its installed base of over 20,000 ACHXs and 250,000 fans globally provides stable aftermarket revenue streams, which account for approximately 37% of Hudson's total net sales. This dramatically expanded Chart's recurring revenue base and reduced its dependence on new equipment sales cycles. The acquisition expanded Chart's E&C LifeCycle aftermarket presence from $50 million to $125 million in annual revenue.
Throughout this period, Chart was developing what it would later brand as the "Nexus of Clean" strategy—positioning itself at the intersection of clean power, clean water, clean food, and clean industrials. The company recognized that the same cryogenic and heat transfer technologies used in LNG could be applied across multiple growing markets. Water treatment facilities needed aeration equipment. Food processing required precise temperature control. Data centers would eventually need advanced cooling solutions. Chart was building a platform that could serve all these markets with common technology and manufacturing capabilities.
The hydrogen economy was still nascent, but Chart made early strategic bets. The company developed hydrogen fueling stations, storage systems, and liquefaction equipment, positioning itself for what many believed would be the next wave after natural gas. While hydrogen applications remained small, the technical capabilities Chart developed—handling a molecule that liquefies at minus 423 degrees Fahrenheit—pushed the boundaries of its engineering expertise and created options for future growth.
By 2019, Chart had transformed from a cyclical industrial equipment manufacturer into a diversified clean energy infrastructure company. Revenue had grown from approximately $800 million in 2013 to over $1.2 billion, but more importantly, the company's strategic position had fundamentally changed. It was no longer dependent on any single end market or geography, had built substantial recurring revenue streams, and possessed technical capabilities that were becoming increasingly critical to the global energy transition.
The Howden Mega-Deal: Doubling Down (2022-2023)
The board meeting on November 8, 2022, would go down as one of the most consequential in Chart's history. CEO Jill Evanko presented a proposal that made even seasoned directors pause: acquire Howden, a leading global provider of mission critical air and gas handling products, for approximately $4.4 billion in cash. For context, this was nearly ten times larger than any acquisition Chart had previously attempted. The company's entire market capitalization was only slightly larger than the proposed purchase price.
Howden wasn't just another bolt-on acquisition. The complementary nature of the equipment and solution portfolios results in a differentiated offering across stationary and rotating equipment and is further differentiated by the additional 750 Howden engineers coming with the acquisition, doubling our global engineering team to over 1,500. Founded in Scotland in 1854, Howden had spent over a century perfecting rotating equipment—compressors, fans, and turbines—that complemented Chart's expertise in stationary cryogenic equipment. Where Chart excelled in storing and processing molecules at rest, Howden specialized in moving them.
The strategic rationale was compelling but complex. Gross order intake for Howden in Q4 2022 was US$534 million, a new record high, and for the full year the gross order intake was US$2 billion. Howden's renewable hydrogen orders were up 47% in 2022. Aftermarket, service, and repair comprise approximately 48% of Howden's and approximately 14% of Chart's revenue. Combined, this will be more than 30% of pro forma revenue with approximately 42% gross margin as a percent of sales.
The deal's financial engineering was as audacious as its strategic ambition. Chart utilized a complex funding structure including cash on hand, new debt facilities, and creatively structured preferred stock to finance the acquisition. The company committed to $175 million of annualized cost synergies and $150 million of commercial synergies in the first 12 months of ownership—aggressive targets that would require flawless execution.
What made the Howden acquisition particularly bold was its timing. The deal was announced just as interest rates were rising sharply, making debt financing expensive. Many industrial companies were retrenching, yet Chart was making its biggest bet ever. Evanko and her team believed they saw something the market didn't: the clean energy infrastructure build-out was not a bubble but a multi-decade supercycle, and the combination of Chart and Howden would create unique competitive advantages.
The integration began even before the deal closed on March 17, 2023. Through the acquisition of Howden, Chart has gained immediate access to new customers and commercial opportunities, increasing its geographic footprint to over 35 countries. This geographic footprint allows for increased commercial and manufacturing capabilities as well as the ability to bid on projects regionally that were not previously accessible. Joint customer meetings revealed immediate opportunities—Howden's compressors were the critical long-lead item in Chart's hydrogen and helium liquefaction systems. By controlling the supply chain for these critical components, Chart could accelerate project delivery times and capture more value.
The cultural integration proved smoother than many expected. Both companies shared engineering-driven cultures, with deep respect for technical expertise and customer problem-solving. The new Chart executive management team will include a balance of Chart and legacy Howden executives. Chart will continue to operate under the One Chart commercial and engineering structures, further allowing us to leverage our full solution set across our diverse end markets.
Early results validated the bold strategy. Both companies continue to see strong demand in the first quarter 2023. Chart's orders quarter-to-date through March 15, 2023, are above $520 MM. Gross order intake for Howden in the fourth quarter 2022 was $534 MM, a new record high, and for the full year the gross order intake was $2,064 MM. Notable is the continued strength in renewable H2 with orders up 47% for the full year.
The Howden acquisition represented more than just scale—it was a fundamental reimagining of Chart's business model. The company was no longer just an equipment manufacturer but an integrated solutions provider across the entire molecule value chain. From compression to liquefaction, storage to regasification, Chart could now offer complete engineered systems for virtually any gas handling application. The acquisition carried enormous execution risk, but if successful, it would create a company with few true competitors in its comprehensive capabilities.
The Baker Hughes Exit & Capital Markets Drama (2024-2025)
The phone call came on a Sunday evening in July 2025. Jill Evanko was reviewing integration reports from the Howden acquisition when Baker Hughes CEO Lorenzo Simonelli reached out with an unsolicited proposal. The deal announced early Tuesday calls for Chart investors to receive $210 per share, a 22% premium over Monday's closing price. The purchase price represents an enterprise value of $13.6 billion, and a multiple of ~9x Chart Consensus 2025 EBITDA on a fully synergized basis.
The timing was exquisite in its complexity. Chart had recently announced a merger agreement with Flowserve Corporation, positioning the combined entity as a comprehensive flow control and gas handling giant. But Baker Hughes's offer was too compelling to ignore. The agreement puts an end to Chart's previous plan to merge with Flowserve Corp. The transaction with Baker Hughes followed a determination by the Chart Board of Directors, with the assistance of its financial and legal advisors, that the acquisition proposal it received from Baker Hughes subsequent to the announcement of the Chart/Flowserve transaction constituted a Superior Chart Proposal under the terms of its merger agreement with Flowserve.
The strategic logic from Baker Hughes's perspective was clear. The acquisition represents a strategic move for Baker Hughes as it seeks to expand its Industrial & Energy Technology segment and capitalise on growing demand for lower-carbon energy solutions. Chart's specialised capabilities span critical growth markets including liquefied natural gas (LNG), data centres, and renewable energy applications. Data centers alone were consuming enormous amounts of power and required sophisticated cooling solutions—a market where Chart's cryogenic expertise and Howden's air handling systems created unique advantages.
For Chart's shareholders, the Baker Hughes acquisition represented both vindication and conclusion. The company's stock price had been volatile, weighed down by integration concerns from the Howden deal and broader market uncertainty about industrial companies. The $210 per share offer represented a substantial premium and validated the strategic transformation Chart had undergone. This offer implied an equity value of $10.1 billion and a total enterprise value of $13.6 billion, representing a 30% premium over Chart's unaffected share price before the Flowserve agreement announcement.
Behind the scenes, the negotiation had been intense. On July 23, 2024, Baker Hughes made an initial non-binding verbal proposal for an all-stock acquisition. This proposal contemplated a fixed exchange ratio of 5.241 shares of Baker Hughes common stock for each Chart share, representing a 15% premium based on relative three-month VWAPs and giving Chart stockholders approximately 20% of the combined company. Chart's board, advised by top-tier investment banks, had orchestrated a competitive process that ultimately extracted maximum value.
The deal's announcement triggered a flurry of shareholder lawsuits—a routine occurrence in large public company acquisitions but nonetheless a distraction. These disclosures aim to address claims from multiple stockholder demand letters and two lawsuits alleging that the original proxy statement was misleading. Chart's board and management deny any wrongdoing or the necessity of these additional disclosures, stating the allegations are without merit. However, the company is voluntarily providing the information to mitigate the risk of delaying the special meeting or the merger's closing, and to minimize litigation expenses.
On October 6, 2025, shareholders of Chart Industries approved the pending acquisition by Baker Hughes. The completion of this transaction, anticipated for mid-year 2026 pending regulatory approvals, represents a significant step forward in Baker Hughes' strategy to position itself as a premier energy and industrial technology company. The overwhelming shareholder approval—over 95% of votes cast—reflected both confidence in the deal's terms and recognition that Chart had achieved something remarkable: transforming from a small specialty manufacturer into a critical infrastructure provider worthy of a $13.6 billion valuation.
Product Portfolio & Technology Deep Dive
To understand Chart's value, one must understand the physics of cryogenics. At extreme cold temperatures, gases behave in counterintuitive ways. Metals become brittle. Seals fail. Traditional engineering assumptions break down. Chart's three decades of experience navigating these challenges created a knowledge moat that new entrants simply couldn't cross quickly.
The company's product portfolio reads like a catalog of industrial civilization's essential but invisible infrastructure. Chart provides microbulk and mobile equipment; bulk and packaged gas cryogenic solutions for the storage, distribution, vaporization, and application of industrial gases; cryogenic trailers, ISO containers, bulk storage tanks, loading facilities, and regasification equipment for delivering liquefied natural gas (LNG) into virtual pipeline applications; and large vacuum insulated storage tanks as equipment for purchasers of standard liquefaction plants.
The technology platform spans four critical areas. First, cryogenic storage systems—the massive tanks that hold liquefied gases at temperatures hundreds of degrees below zero. These aren't simple containers but sophisticated engineered systems with vacuum insulation, specialized materials, and precise pressure management. A single tank failure could be catastrophic, which is why customers pay premium prices for Chart's proven designs.
Second, heat exchangers form the heart of any gas processing facility. Chart offers natural gas processing solutions; process technology, liquefaction capabilities, and critical equipment for the LNG, include small to mid-scale facilities, floating LNG applications, and large base-load export facilities; brazed aluminum heat exchangers, Core-in-Kettle heat exchangers, cold boxes, pressure vessels, fans, and pipe works; and air cooled heat exchangers and axial cooling fans for the heating, ventilation and air conditioning (HVAC), power, and refining applications. Chart's brazed aluminum heat exchangers, in particular, represent decades of metallurgical expertise—knowing exactly how to join aluminum plates to maximize heat transfer while maintaining structural integrity at extreme temperature differentials.
Third, the hydrogen portfolio positioned Chart for the next energy transition. Chart provides hydrogen solutions; compressors, including shell and tubes to mobile equipment and fueling stations; solutions, equipment, aftermarket services, and software for applications; water treatment solutions serve both clean and wastewater applications; various organic and inorganic contaminants. Hydrogen liquefies at minus 423 degrees Fahrenheit, making it even more challenging to handle than LNG. Chart's ability to engineer solutions for hydrogen gave it early-mover advantages in what many believe will be a trillion-dollar market.
Fourth, the integration of Howden's rotating equipment created new system-level capabilities. Where Chart previously had to source compressors from third parties for its liquefaction systems, it could now control the entire equipment package. This wasn't just about supply chain control—it was about system optimization. By designing the compression and cooling systems together, Chart could achieve efficiency gains that weren't possible when integrating disparate components.
The customer base reflected this technical depth. Chart's equipment operated in the world's harshest environments—Arctic LNG facilities, desert hydrogen plants, offshore platforms, high-altitude mining operations. When Shell needed equipment for a floating LNG vessel that could withstand Category 5 hurricanes, they turned to Chart. When Air Products required specialized hydrogen liquefaction systems for their global network, Chart was often the only viable supplier.
But perhaps the most underappreciated aspect of Chart's technology portfolio was its software and digital capabilities. Through the Howden acquisition, Chart gained advanced predictive maintenance platforms that could monitor equipment performance in real-time, predicting failures before they occurred. In industries where unplanned downtime could cost millions per day, this capability commanded premium pricing and created sticky customer relationships.
Financial Architecture & Unit Economics
The financial transformation of Chart Industries tells a story of disciplined capital allocation meeting explosive market growth. The company reported $4.16 billion in sales for 2024, up 17.5% from the previous year, and achieved a free cash flow of $387.9 million. These headline numbers, while impressive, only hint at the underlying financial architecture that made Chart such an attractive acquisition target.
The unit economics of Chart's business model were compelling once properly understood. A typical LNG storage tank might sell for $2-5 million, with gross margins approaching 30%. But the real value came from the installed base. Over a 20-30 year lifespan, that same tank would generate service revenue equal to or exceeding its original purchase price. With thousands of units installed globally, Chart had built an annuity-like stream of high-margin aftermarket revenue.
The Howden acquisition fundamentally altered Chart's financial profile. The combined company's aftermarket revenue exceeded 30% of total sales with gross margins above 40%—remarkable for an industrial manufacturer. This recurring revenue provided stability through cycles and funded continued R&D investment. During the 2020 pandemic, while new equipment orders plummeted, aftermarket revenue remained resilient as customers still needed to maintain critical infrastructure.
Working capital dynamics in the project business created both challenges and opportunities. Large LNG facility projects required significant upfront investment in materials and engineering, with payment often coming months or years later upon delivery. Chart learned to manage this carefully, negotiating milestone payments and using supply chain financing to minimize cash conversion cycles. The company's improving working capital metrics—days sales outstanding dropping from 75 to 62 days post-Howden acquisition—reflected operational improvements that directly enhanced cash generation.
The acquisition strategy itself revealed sophisticated financial engineering. Rather than pursuing transformational deals that bet the company, Chart executed a series of strategic bolt-ons, each adding specific capabilities or market access. The company completed over 15 acquisitions between 2017 and 2023, spending approximately $5 billion in total. Yet through disciplined integration and synergy capture, these acquisitions were accretive to earnings within 12-18 months, a remarkable track record in industrial M&A.
Capital allocation priorities evolved with the business. Early in the journey, Chart prioritized debt reduction and internal investment. As the balance sheet strengthened and cash generation improved, the company became more aggressive with acquisitions while maintaining investment in organic growth. R&D spending consistently exceeded 2% of revenue—high for an industrial company but essential for maintaining technological leadership. The company also instituted a modest dividend, signaling confidence in sustainable cash generation while retaining flexibility for growth investment.
The free cash flow conversion story was particularly impressive. Through operational improvements and working capital management, Chart increased free cash flow conversion from below 60% in 2019 to targeting over 90% post-Howden integration. This improvement came from multiple sources: better project execution reducing cost overruns, improved collection processes, strategic inventory management, and the growing mix of high-margin aftermarket revenue.
Porter's 5 Forces & Hamilton's 7 Powers Analysis
Porter's Five Forces
The competitive dynamics of Chart's industry reveal why the company commanded such a premium valuation. Starting with supplier power, Chart faced moderate pressure. While specialized materials like high-grade stainless steel and aluminum were essential, multiple suppliers existed globally. Chart's scale post-Howden acquisition actually reversed some supplier dynamics, making Chart a must-have customer for specialty metal suppliers.
Buyer power presented a more complex picture. Chart's customers included some of the world's largest energy companies—Shell, ExxonMobil, Air Products—with significant negotiating leverage. However, the technical complexity of Chart's products and the catastrophic consequences of equipment failure created switching costs that moderated buyer power. When a customer had millions invested in Chart equipment, they typically preferred to stay within the Chart ecosystem for expansions and replacements.
The threat of substitutes remained surprisingly low. While alternative technologies existed for some applications, the physics of gas liquefaction and storage hadn't changed fundamentally in decades. You still needed cryogenic equipment to handle LNG, and there were no viable alternatives for many industrial gas applications. Even as hydrogen and ammonia emerged as alternative energy carriers, they required similar—often more complex—cryogenic handling equipment.
New entrants faced formidable barriers. Beyond the obvious capital requirements for manufacturing facilities, the real barriers were technical expertise and customer trust. It took Chart decades to accumulate the engineering knowledge, manufacturing expertise, and field experience necessary to compete effectively. New entrants, particularly from low-cost countries, occasionally won projects on price but often struggled with execution and long-term customer relationships.
Competitive rivalry among existing players was moderate but nuanced. In large-scale LNG, Chart competed with European giants like Linde and Air Liquide. In specialized applications, numerous smaller players existed. But Chart's comprehensive portfolio post-Howden created a unique position—few competitors could match its breadth across stationary and rotating equipment, or its geographic reach and service network.
Hamilton's Seven Powers Framework
Analyzing Chart through Hamilton Helmer's Seven Powers framework reveals the sources of its persistent differential returns. Scale economies were evident post-Howden, with the combined company's global manufacturing footprint enabling cost advantages in procurement, manufacturing, and service delivery that smaller competitors couldn't match. The company operated 65 manufacturing locations with over 50 service centers globally—a network that would cost billions and take decades to replicate.
Network effects were limited in the traditional sense, but Chart benefited from ecosystem effects. As more customers standardized on Chart equipment, it became easier to find trained technicians, spare parts, and compatible systems. This created regional clusters where Chart's dominance became self-reinforcing.
Counter-positioning emerged as Chart embraced the energy transition while traditional industrial gas companies remained focused on legacy markets. By investing heavily in hydrogen, carbon capture, and renewable applications while competitors remained cautious, Chart captured early leadership positions in emerging markets.
Switching costs proved substantial. Once a facility was built around Chart equipment, changing vendors required not just new equipment but reengineering of entire processes, retraining of personnel, and acceptance of compatibility risks. The Howden acquisition amplified this, as Chart could now provide integrated systems where components were optimized to work together.
Branding power was limited in B2B industrial markets, though Chart's reputation for reliability and technical excellence carried weight. More important was the company's cornered resource in the form of its installed base, patent portfolio (over 1,300 patents post-Howden), and accumulated engineering expertise. The decades of operational data from thousands of installations created a learning advantage that new entrants couldn't quickly replicate.
Process power emerged as perhaps Chart's most underappreciated advantage. The company's ability to execute complex projects—from design through manufacturing to installation and service—had been refined over thousands of iterations. This organizational capability, embedded in systems, procedures, and culture, enabled Chart to deliver projects that competitors struggled to execute profitably.
Bear vs. Bull Case
The Bull Case
The bull thesis for Chart Industries rested on several powerful pillars. First, the clean energy infrastructure supercycle was not a policy-driven bubble but a fundamental restructuring of global energy systems. The International Energy Agency projected $4 trillion in annual clean energy investment by 2030. Chart's positioning at the nexus of this transformation—LNG as transition fuel, hydrogen as future fuel, carbon capture for hard-to-abate industries—meant decades of growth ahead.
The hydrogen economy catalyst remained largely ahead. While hydrogen had disappointed previous expectations, the 2020s were different. Government commitments exceeded $500 billion globally, major industrial players were making real investments, and the technology had matured. Chart's comprehensive hydrogen portfolio—from production through liquefaction, storage, transport, and dispensing—positioned it to capture value across the entire value chain. Even modest hydrogen adoption would drive massive equipment demand.
The data center explosion represented an unexpected growth vector. AI's computational demands were driving unprecedented data center construction, each requiring sophisticated cooling systems. Chart's cryogenic expertise and Howden's air handling systems positioned it uniquely to serve this market. With data center power consumption projected to triple by 2030, this alone could drive significant growth.
Geographic and market diversification through the Howden acquisition had fundamentally reduced cyclicality. With exposure across industrial gas, LNG, chemicals, water treatment, food and beverage, and now data centers, Chart was no longer dependent on any single market. The 30%+ aftermarket revenue provided stability through downturns.
The validation from Baker Hughes at a $13.6 billion enterprise value confirmed the strategic value of Chart's transformation. Baker Hughes, with deep industry knowledge and alternative options, chose to pay a substantial premium for Chart's capabilities. This wasn't financial engineering but strategic acquisition of irreplaceable assets.
The Bear Case
The bear perspective highlighted substantial risks. The Howden integration remained the elephant in the room—at $4.4 billion, it was almost 10 times larger than Chart's previous largest acquisition. Integration risks were massive: cultural differences, system incompatibilities, customer disruption, and key talent retention. The aggressive synergy targets—$175 million in cost and $150 million in revenue synergies—required flawless execution in a challenging environment.
Energy transition timing uncertainty posed fundamental questions. While the direction toward cleaner energy was clear, the pace remained highly uncertain. Hydrogen, in particular, had disappointed expectations before. If adoption proved slower than expected, Chart's significant investments might not generate adequate returns for years.
The capital intensity of growth was a persistent challenge. Unlike software or service businesses, Chart required substantial capital investment to grow. New manufacturing facilities, specialized equipment, and working capital for large projects consumed cash. This limited the company's ability to return capital to shareholders and made it vulnerable to capital market disruptions.
Customer concentration in volatile energy markets created revenue risk. Chart's top 10 customers represented over 30% of revenue, and many were exposed to commodity price volatility. An oil price collapse or natural gas glut could quickly cascade through to equipment orders. The boom-bust history of energy markets suggested another downturn was always possible.
Competition from larger, better-capitalized industrial conglomerates was intensifying. As the energy transition opportunity became clearer, giants like Siemens, GE, and Mitsubishi were increasing investment. These competitors had deeper pockets, broader portfolios to bundle, and global relationships that could challenge Chart's position. The Baker Hughes acquisition itself validated the space's attractiveness, likely drawing more competitive attention.
Key Takeaways & Lessons
The Chart Industries story offers profound lessons for investors navigating industrial transformations. First, the power of riding secular trends cannot be overstated. Chart didn't create the energy transition, but by recognizing it early and positioning accordingly, the company captured enormous value. The progression from industrial gas specialist to LNG infrastructure player to clean energy enabler shows how companies can evolve with changing markets while leveraging core capabilities.
Strategic M&A as a transformation catalyst emerges as a critical theme. Chart executed over 20 acquisitions during its journey, but these weren't random diversifications. Each acquisition added specific capabilities, market access, or strategic options that enhanced the overall platform. The Howden acquisition, despite its risks, transformed Chart from an equipment supplier to a comprehensive solutions provider—a difference that justified billions in additional value.
Building resilience through diversification—geographic, end-market, and business model—proved essential. The company that nearly foundered during the 2008 financial crisis had become an all-weather performer by 2024. The mix of equipment and aftermarket, developed and emerging markets, traditional and energy transition applications created multiple paths to growth and buffers against disruption.
The importance of timing in capital-intensive industries cannot be ignored. Chart's investments in LNG infrastructure preceded the market boom by several years. Its hydrogen capabilities were built before government incentives materialized. This patient capital allocation, maintaining capabilities through down cycles for eventual payoffs, required conviction and long-term thinking rare in public markets.
Finally, knowing when to sell proved as important as building value. Chart's board didn't resist the Baker Hughes acquisition out of pride or independence desires. They recognized that at $210 per share, the company was receiving full value for its transformation, and that within Baker Hughes, Chart's capabilities could reach even greater scale and impact. For shareholders who bought during the financial crisis depths, the return exceeded 40x—a testament to the value of strategic transformation.
Recent Developments & Future Outlook
As Chart Industries prepares for integration into Baker Hughes, expected to close in mid-2026, the industrial landscape continues evolving rapidly. The completion of this transaction, anticipated for mid-year 2026 pending regulatory approvals, represents a significant step forward in Baker Hughes' strategy to position itself as a premier energy and industrial technology company.
The LNG market has entered a new phase with the Russia-Ukraine conflict accelerating Europe's pivot away from pipeline gas. Small-scale LNG infrastructure, Chart's specialty, is experiencing unprecedented demand as countries seek energy security through diversification. The company's recent wins include major projects in Southeast Asia and Africa, regions building their first LNG import infrastructure.
Hydrogen developments have accelerated beyond even bullish expectations. The U.S. Inflation Reduction Act's hydrogen production tax credits, European Green Deal funding, and Asian hydrogen strategies have moved projects from concept to construction. Chart's early investments are paying off, with hydrogen-related orders exceeding $500 million in 2024, up from virtually zero five years earlier.
The data center opportunity has exploded faster than anticipated. Chart's technologies align with the explosion in data center power and cooling needs, a market that delivered Baker Hughes $550M in orders in Q2 2025 alone. AI's computational demands are driving a construction boom that requires sophisticated cooling solutions. The combination of Chart's cryogenic expertise and Howden's air handling systems creates unique advantages in this rapidly growing market.
Carbon capture and storage, long discussed but rarely implemented at scale, is reaching commercial viability. Chart's equipment is essential for CO2 liquefaction, transport, and injection. With carbon prices rising globally and regulations tightening, the company is positioned to benefit from what could be a $100 billion market by 2030.
Looking forward, several key metrics will determine success within Baker Hughes: integration execution and synergy realization, hydrogen and CCUS project conversion rates, data center cooling market share gains, and aftermarket growth from the expanding installed base. The industrial world's transformation toward cleaner, more efficient energy systems remains in early innings, and Chart's technologies—now part of Baker Hughes's broader platform—will be essential infrastructure for this transition.
The Chart Industries journey from specialty cryogenic equipment maker to critical clean energy infrastructure provider offers a masterclass in industrial transformation. Through strategic patience, technical excellence, and transformational acquisitions, the company positioned itself at the nexus of multiple secular growth trends. While the company's independent journey ends with the Baker Hughes acquisition, the capabilities Chart built over three decades will continue enabling the global energy transition. For investors, employees, and industry observers, Chart's story demonstrates that even in mature industrial markets, strategic vision combined with operational excellence can create extraordinary value.
 RSS Feed
 Spotify
 Apple Podcasts
 Amazon Music
 Audible
 YouTube