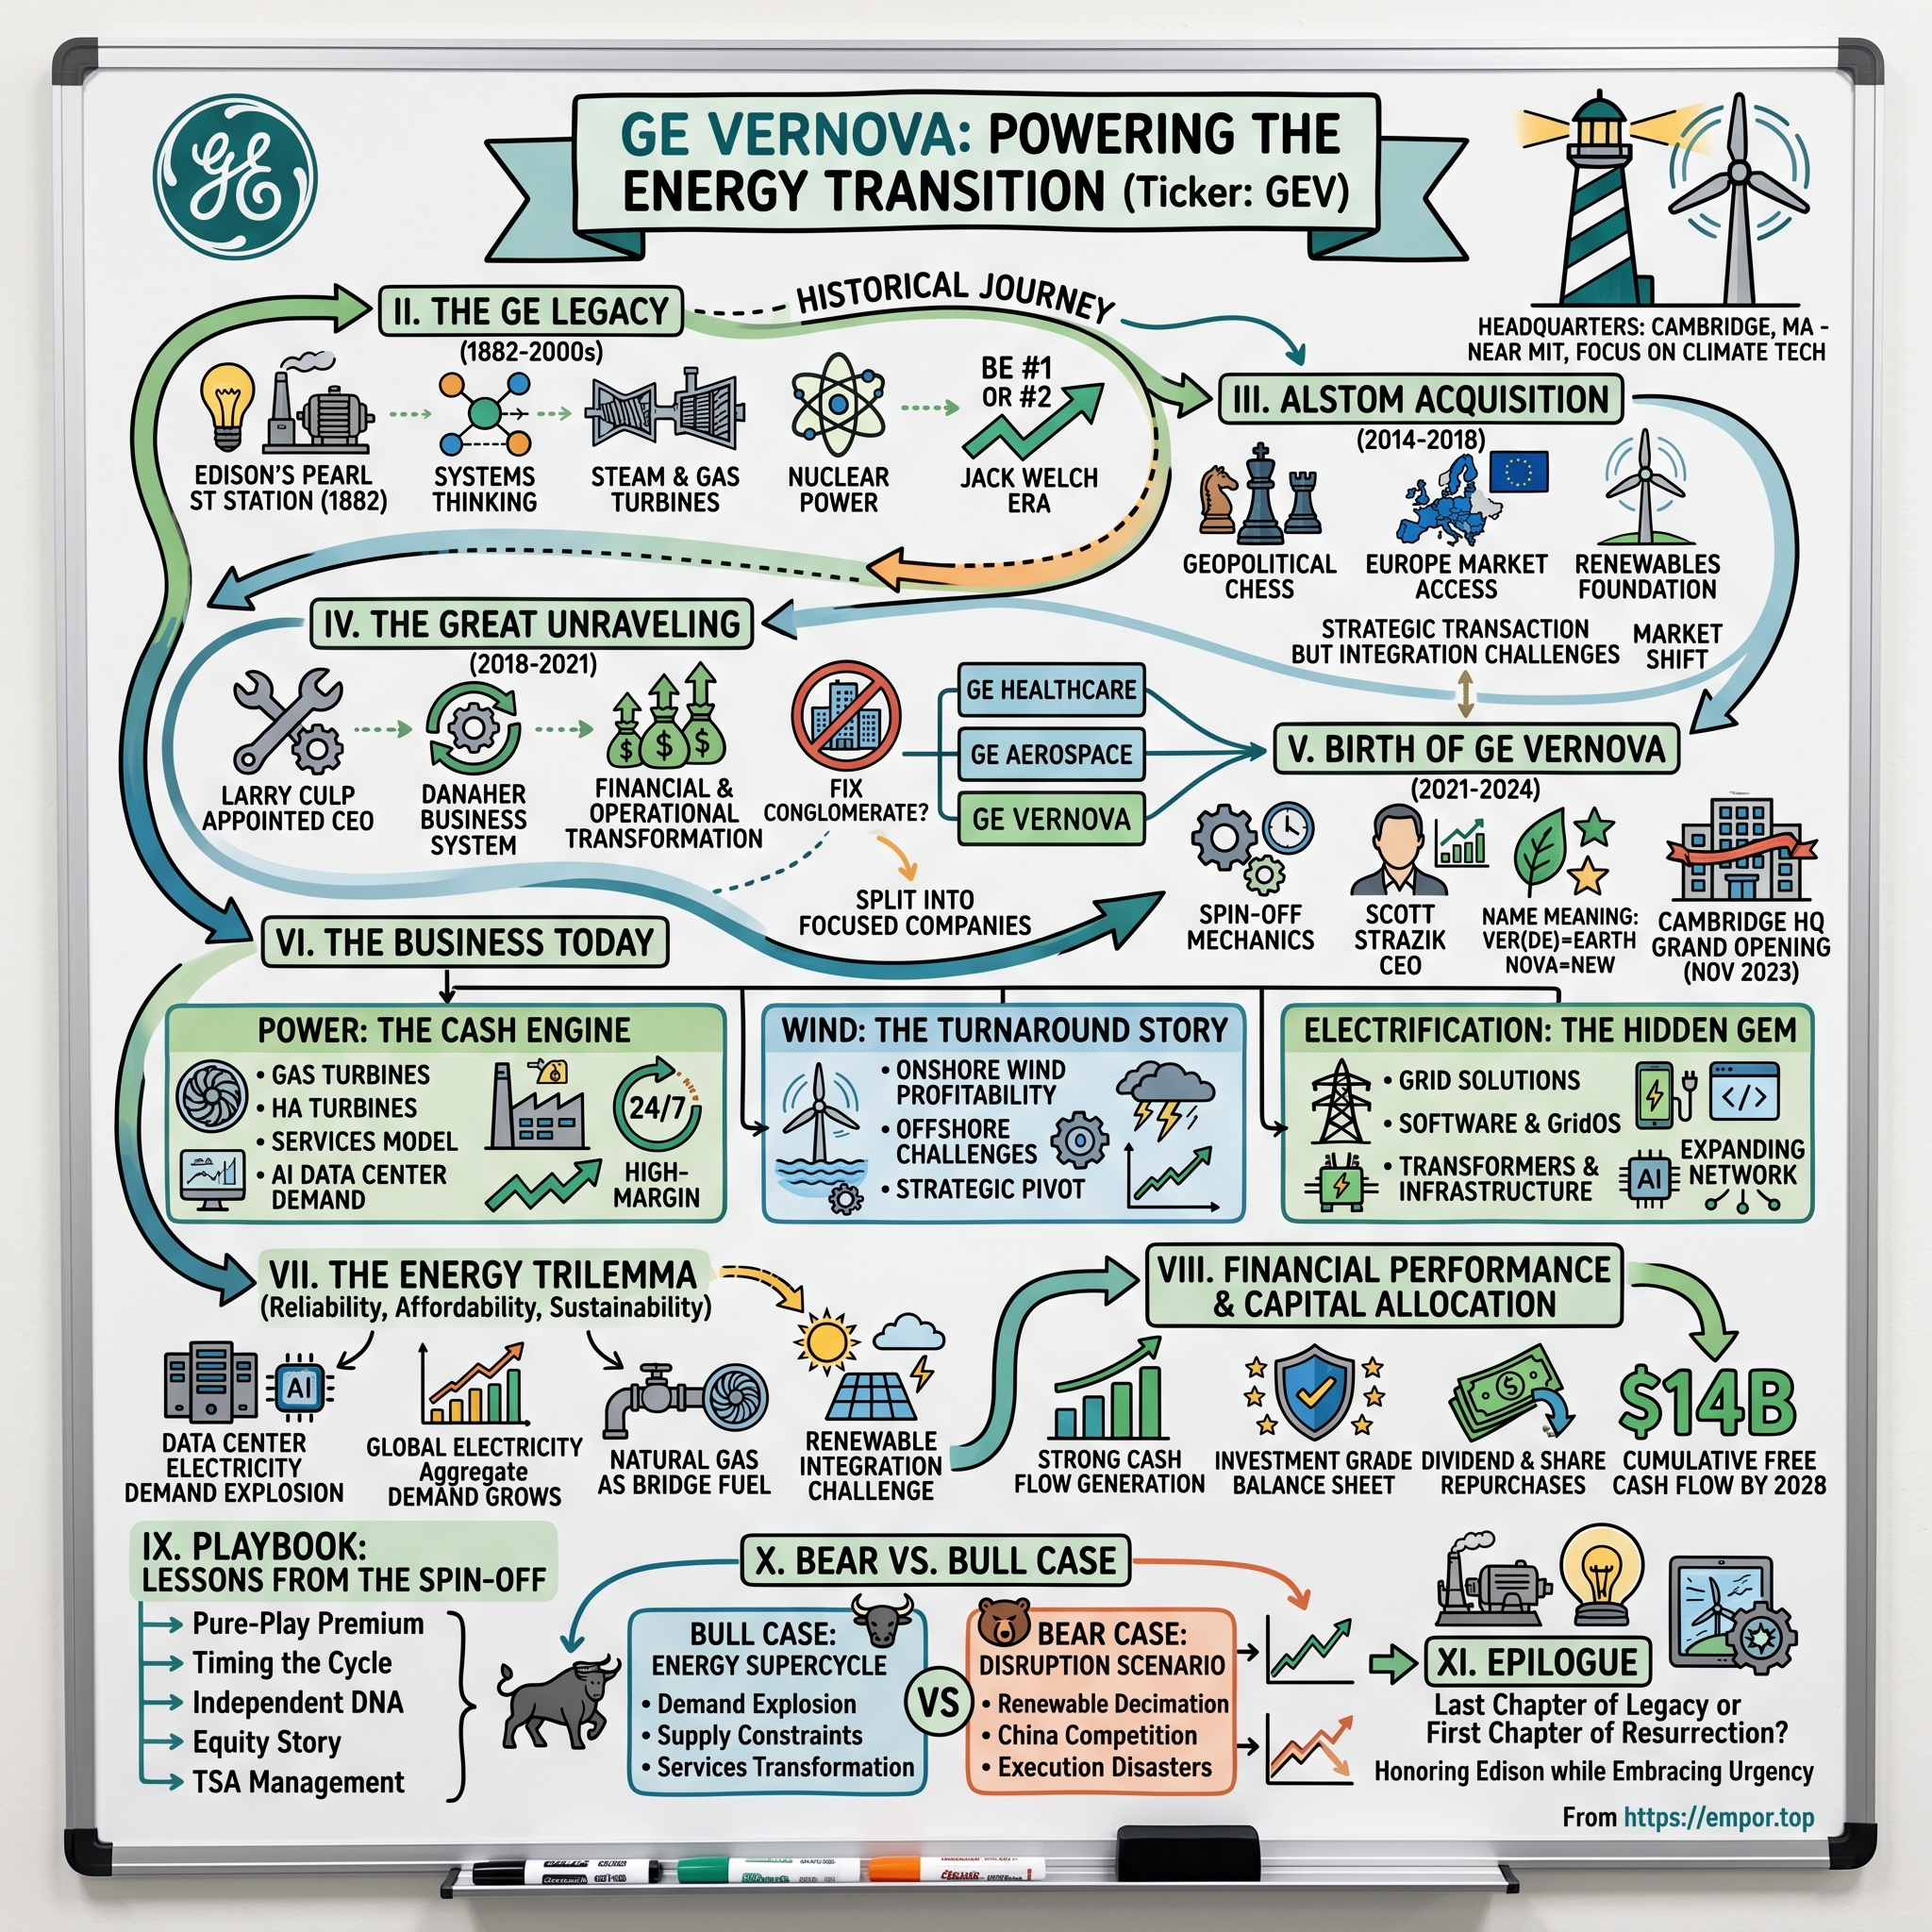
GE Vernova: Powering the Energy Transition
I. Introduction & Episode Roadmap (10–15 min)
A Bell, Two Companies, and the End of an Era
At 9:30 a.m. on April 2, 2024, two companies that had shared a name, a balance sheet, and a boardroom for more than a century rang the New York Stock Exchange opening bell together. It was the first time the exchange had held a joint bell-ringing for two newly independent companies at once.1 On one side of the podium stood GE Aerospace, the jet-engine maker that retained the original ticker. On the other stood GE Vernova, trading as GEV, which inherited the power turbines, the wind farms, the transmission transformers and switchgear, along with more than 130 years of corporate scar tissue.
The company stated at the time of the separation that its installed base helped generate roughly 30% of the world's electricity. That footprint included more than 7,000 gas turbines and about 55,000 wind turbines, serving customers across more than 100 countries with a workforce of roughly 80,000 to 85,000 employees.1 That figure represents the company's internal estimate of electricity generated using its equipment, rather than power it sells directly. Even so, it reflects immense global reach: whenever electricity flows through a grid somewhere in the world, there is a strong likelihood that equipment engineered in Schenectady, Greenville, or Belfort helped generate it.
On its first when-issued trading session in late March 2024, public markets valued the enterprise at about $36 billion. By September 23, 2026, its market capitalization stood at roughly $252 billion—a sevenfold increase in two and a half years.2 Few large-cap industrial spin-offs have compounded value at that pace.
The Central Paradox
That steep ascent highlights the paradox at the heart of the business. In 2018, these same operations brought General Electric to the brink of collapse. The Power division absorbed a $22 billion goodwill impairment, the parent company slashed its quarterly dividend to a penny, and federal securities regulators opened an investigation into its accounting practices.3 Within eight years, those distressed assets became one of the most valuable industrial franchises in the world.
Conventional explanations tend to lean on two competing, incomplete narratives. The management-focused account credits an operational turnaround that systematically repaired a broken business. The market-driven account attributes the surge entirely to an artificial-intelligence boom lifting demand for power equipment across the board. The reality lies between the two: determining how much of the rebound stems from operational discipline and how much reflects cyclical tailwinds is the central analytical task for anyone evaluating the company today.
Two Megatrends Collide
Two structural forces converged to reshape GE Vernova's operating environment.
The first is decarbonization. Over two decades, governments and electric utilities deployed substantial wind and solar capacity. Integrating intermittent renewable energy requires two complementary assets: expanded grid infrastructure to transport electricity, and firm, dispatchable capacity to stabilize the network when wind and solar output drops.
The second is an abrupt demand inflection. According to the US Energy Information Administration, American electricity consumption remained "essentially flat for nearly two decades," as energy efficiency measures and the growth of the service sector balanced population and economic expansion. The EIA now projects consumption to expand at an average annual rate of roughly 1.7% from 2020 through 2026, led by commercial demand—which includes data centers—projected to grow at 2.6% annually.4 While low in absolute terms, those growth rates represent a fundamental shock for an equipment industry structured around zero volume growth, triggering an aggressive procurement cycle among utilities and hyperscalers.
GE Vernova's recent financial results reflect that demand surge. In the second quarter of 2026, the company booked $24.2 billion in orders, representing an 88% organic increase year over year. Its total backlog expanded to $176 billion, while year-to-date free cash flow reached roughly $10 billion—more than two and a half times its cash generation for the entirety of 2025.5
The Road Ahead
This analysis examines the company across eight sections. It begins with Thomas Edison and the heavy-industrial moat GE established over a century, proceeds through the 2015 Alstom acquisition and the severe operational distress of 2014–2018, and reviews the lean manufacturing turnaround led by Larry Culp and Scott Strazik. The narrative then dissects the mechanics of the 2024 spin-off, evaluates unit economics across each reporting segment, models competitive dynamics against global peers, audits management's operational execution, and concludes with the fundamental bull and bear cases. The journey begins in lower Manhattan in 1882, beside six massive steam-driven dynamos.
 Subscribe on LinkedIn
II. The 132-Year Legacy: From Pearl Street to Conglomerate Heavyweight (1882–2013) (30–35 min)
Six Jumbos on Pearl Street
On September 4, 1882, Thomas Edison's Pearl Street Station in lower Manhattan began sending direct current through underground copper lines. On its opening day, the station served roughly 85 customers powering around 400 lamps. Within a year, customer count expanded to 513, lighting about 10,000 lamps.6 The station relied on six "Jumbo" dynamos. Each weighed 27 tons, generated approximately 100 kilowatts, and could illuminate roughly 1,200 lamps. The Jumbo was itself "adapted from an earlier design by Werner Siemens in Germany."6 The rivalry between Siemens and the Edison lineage, which still shapes the global gas turbine market 144 years later, traces directly back to that first central power station.
A decade later, in 1892, Edison General Electric merged with the Thomson-Houston Electric Company to form General Electric.7 Edison subsequently sold his equity to fund unrelated ventures, later joking, "Well, it's all gone, but we had a hell of good time spending it."7 Power generation was the foundational reason GE existed; consumer appliances, lighting, aircraft engines, and the financial services arm all followed in its wake.
The Turbine That Changed the Size of Power Stations
The breakthrough that established the scale of GE's power equipment franchise arrived in 1903. Inventor and patent attorney Charles G. Curtis designed a steam turbine, and GE engineer William Le Roy Emmet spent two years refining it into a workable commercial machine. The result was a 5,000-kilowatt vertical turbine generator standing just 25 feet tall. A reciprocating steam engine of similar capacity stood 60 feet tall and took up far more floor space.8 Installed at Chicago's Fisk Street Station, the Curtis machine transformed utility economics; according to the American Society of Mechanical Engineers, it pushed utilities across the country toward large central stations built around turbines.8
This milestone introduced the structural competitive dynamic that still governs GE Vernova's economics. An industrial turbine is not a commodity. It is a high-precision machine operating at extreme rotational velocities near the physical limits of materials science. The manufacturer that learns to engineer and manufacture such equipment reliably at scale builds a technical moat that compounds over decades.
From Jet Engines to Power Plants
A second structural transition emerged from aviation. In 1949, GE delivered a 3,500-kilowatt gas turbine to Oklahoma Gas and Electric's Belle Isle Station, the first gas turbine used for utility power generation in the United States.9 An ASME plaque at the site notes that the central engineering challenge was converting "the early aircraft gas turbine, in which the engines seldom ran more than ten hours at a stretch, into a long-life prime mover."9 That formulation captures the core technical problem of the gas turbine business across its history: engineering a system that shares the thermodynamics of a jet engine to operate continuously for decades.
GE subsequently engineered a family of heavy-duty "frames" that came to form the backbone of the global utility fleet. The Frame 7 (MS7000) debuted in 1970 rated at 47.2 megawatts. The first Frame 9B was installed near Paris by Électricité de France (EDF) in 1975. In parallel, the aeroderivative LM2500 was adapted from the CF6-6 flight engine.10 The high-efficiency F-class era began on June 6, 1990, when a 147-megawatt 7F turbine began commercial operation at Virginia Power's Chesterfield station, inaugurating a product family that eventually deployed more than 1,500 F-class machines worldwide.10 GE's initial H-class machine, a 480-megawatt 9H, entered service in Wales in 2003, though complex maintenance requirements restricted commercial adoption to just six H-System installations.10 GE followed with the air-cooled HA platform in 2014, and the first 9HA.01 reached a record 62.22% net efficiency at EDF's Bouchain combined-cycle plant in 2016.10
The operational focus on thermal efficiency reflects basic plant economics. An industrial gas turbine operates effectively as an immense, ultra-high-temperature compressor and combustor coupled to an electrical generator. The hotter the gas moving through the hot-gas path, the more electrical energy extracted per unit of fuel consumed. Yet combustion temperatures regularly exceed the melting points of standard metals. Every successive turbine generation represents an engineering duel between firing temperatures and metallurgy: single-crystal superalloy blades, advanced ceramic thermal-barrier coatings, and internal cooling channels narrower than a pencil lead. That accumulated proprietary metallurgy took generations to master, creating a formidable barrier to entry that GE Vernova inherited at spin-off.
The Cash Cow, and the Seed of the Crash
Under the conglomerate, Power served as GE's primary cash engine. The business model was straightforward: sell the heavy equipment at modest upfront margins, then secure a multi-decade contractual service agreement covering replacement parts, maintenance, and plant outages. While that model created an extraordinarily profitable aftermarket annuity, it also planted the seeds of the division's eventual crisis.
When a corporate division generates the vast majority of its operating profit from servicing an installed fleet, management faces strong incentives to push new turbines into the market regardless of initial equipment pricing discipline. Furthermore, long-term service agreement accounting hinges on internal management estimates of future operating hours, maintenance cycles, and billing realizations. In a sprawling conglomerate under quarterly earnings pressure, that accounting framework afforded substantial latitude for optimistic assumptions.
This dynamic created the boom-and-bust cycle that frames the modern investment thesis. GE Power's history is characterized by aggressive capacity expansions followed by painful cyclical contractions. The fleet of more than 7,000 gas turbines that GE Vernova oversees today represents both the ultimate commercial prize of those expansion cycles and a lasting reminder of the structural risks that accompanied them.
III. The Alstom Catastrophe & The Near-Death Spiral (2014–2018) (40–45 min)
A French National Champion Comes Up for Sale
In the spring of 2014, General Electric pursued Alstom, the French engineering conglomerate whose power generation and transmission operations had helped construct Europe's electrical grid. For GE's corporate leadership, the target appeared irresistible: an expansive global installed base of steam turbines, an established European grid franchise, and commercial operations across more than a hundred countries. The French government resisted foreign control of what it viewed as a strategic national asset, ultimately forcing an intricate transaction structured around carve-outs and joint ventures to satisfy regulators in Paris.
GE had initially agreed to pay €12.35 billion. After restructuring the transaction around joint ventures in renewables, grid infrastructure, and nuclear power—alongside antitrust remedies, net cash adjustments, and foreign exchange fluctuations—the final net purchase price settled at €9.7 billion, or approximately $10.6 billion.11 When the transaction closed on November 2, 2015, it stood as the largest industrial acquisition in GE's history, following regulatory clearance in more than 20 jurisdictions.11
Management's financial commitments were explicit. GE targeted $3.0 billion of cost synergies by year five and projected that the transaction would add $0.15 to $0.20 per share to earnings by 2018.11 At the closing, Immelt declared, "We are open for business and ready to deliver one of the most comprehensive technology offerings in the energy sector."11
Buying the Top
The acquisition's strategic rationale was undermined by cyclical timing and an uncritical appraisal of secular energy shifts. While GE negotiated the transaction, the levelized cost of wind and solar power was falling steeply, prompting European utilities to scale back the operating hours of their conventional thermal plants. Alstom's core competitive advantage lay in steam turbines for coal-fired power stations—precisely the market segment where new equipment orders were poised to collapse globally. GE expanded its heavy industrial manufacturing and service footprint at the cyclical peak, just as demand entered a structural decline.
The transaction remains an instructive case study in capital allocation. An acquisition can appear attractively valued against a target's peak trailing cash flows, yet prove costly relative to normalized future earnings. Management's synergy targets measured potential overhead cuts rather than top-line vulnerability. By 2018, when the targeted earnings contribution was supposed to materialize, the revenue base required to support it had contracted.
The Implosion
The ensuing downturn unfolded rapidly. Trade publication POWER magazine documented that GE Power's 2018 revenue fell 22% to $27.3 billion, while orders for gas power systems plunged 40% year over year, culminating in a fourth-quarter operating loss of $872 million driven by "continued execution and operational issues."12 Power's share of General Electric's total revenue fell from 31% in 2017 to 24% in 2018.12
Compounding the cyclical slowdown, GE's premier gas turbine platform developed a critical technical fault. In September 2018, an oxidation-related failure damaged a turbine blade at Exelon's Colorado Bend Generating Station in Texas, which operated two 7HA units. Similar component degradation surfaced soon after at Chubu Electric in Japan and at EDF's Bouchain plant in France. The issue stemmed from an oxidation vulnerability that shortened the operational lifespan of a single blade component in first-generation HA machines. By early 2019, GE was replacing blades across roughly 50 9FB units and 52 HA units, and blade-related warranty and repair charges for 2018 exceeded $600 million.12 A flagship platform engineered to establish GE's technical leadership had instead created substantial near-term liability.
The Reckoning
On October 1, 2018, GE's board of directors ousted John Flannery after fourteen months as chief executive and named H. Lawrence Culp Jr. chairman and CEO, effective immediately. The leadership announcement disclosed that Power held approximately $23 billion in goodwill and cautioned that a forthcoming impairment would "likely... constitute substantially all of this balance."13 On October 30, GE reported a quarterly net loss of $22.9 billion, driven primarily by a $22 billion non-cash goodwill impairment charge in the Power segment. The board reduced the quarterly dividend by 92%, from 12 cents to a single penny per share, and disclosed that both the SEC and the Department of Justice were investigating the charges.3
Myth vs. reality. Retrospective accounts frequently attribute the entirety of the writedown to the Alstom deal. The broader reality reflects systemic internal vulnerabilities. Because goodwill represents the premium paid above the fair market value of acquired net assets, writing off virtually all of Power's goodwill extinguished the premium allocated to Alstom alongside capital accumulated from earlier corporate transactions. It was a formal accounting admission that GE had broadly overpaid for power assets over several decades. Yet Alstom alone did not trigger the crisis: the manufacturing overcapacity, the HA blade metallurgy defects, and the aggressive margin assumptions embedded in long-term service agreements originated within GE's legacy operations. The French acquisition magnified those vulnerabilities; it did not create them.
That historical inflection remains essential context for evaluating the business today. The core franchises that now make up GE Vernova previously traversed a punishing boom-and-bust cycle in which peak demand, aggressive capacity additions, and optimistic contractual accounting reinforced one another until the structure collapsed. Any investment thesis premised on current industry tailwinds must assess why operational discipline will hold as the cycle matures. The subsequent section examines the leadership team tasked with rebuilding that operating foundation.
IV. The Larry Culp Reset & The Scott Strazik Playbook (2018–2021) (35–40 min)
The Outsider From Danaher
Larry Culp arrived at GE with a rare executive track record. He led Danaher from 2001 to 2014, a period during which its revenue and market capitalization each expanded roughly fivefold.13 His operational method centered on the Danaher Business System, a disciplined adaptation of Toyota's lean manufacturing principles: walk the shop floor, measure process variation, resolve root-cause defects daily, and verify operational data firsthand rather than relying on boardroom presentations.
As the first outsider appointed to lead GE in its century-long history, Culp offered a notably blunt assessment of Power's distress. Looking back on 2018, he noted that GE had been "late to embrace the realities of the secular and cyclical pressures," and observed that the heavy-duty gas turbine market was "settling in to the 25 to 30 GW range for the foreseeable future."12
That baseline offers crucial perspective on the hazards of capital goods forecasting. Seven years later, Strazik was describing a global market that could reach 80 gigawatts a year.14 The same enterprise, guided by many of the same leaders, had underestimated long-term demand for its primary product by nearly a factor of three. The error was hardly unique to Culp; the artificial-intelligence load inflection was not visible in 2018. Rather, the miss illustrates that long-term demand forecasting in the power equipment sector remains notoriously uncertain. The depressed projection of 2018 and the aggressive multi-gigawatt forecasts of 2026 warrant comparable analytical skepticism.
Splitting Power, and Handing Gas to Strazik
A month after Culp took over, GE split Power into two units. GE Gas Power, led by Scott Strazik, retained the flagship turbine and services franchise, while GE Power Portfolio, under Russell Stokes, absorbed the remaining power businesses.12 The logic was structural triage: isolate the core, high-margin gas turbine annuity from the more distressed, lower-margin project operations so that each could be managed according to its own operational realities.
Strazik was an unconventional choice to lead a heavy manufacturing business. He joined GE in 2000 and built his career in finance rather than engineering, earning a bachelor's degree in industrial and labor relations from Cornell and a master's in public administration and public policy from Columbia's School of International and Public Affairs.15 He served as chief financial officer of GE Aviation's Commercial Engine Operations, then held commercial and financial leadership roles in gas power, including during the HA turbine rollout, before becoming chief executive of Gas Power in 2018.15 His remit expanded to lead all GE Power businesses in 2021.15
That financial background shaped his operational priorities. Rather than treating turbine manufacturing as an engineering showcase, Strazik targeted the primary drains on cash: fixed-price turnkey construction liabilities, excess inventory, and long-term service agreements underwritten with overly aggressive margin assumptions.
The Lean Playbook
The operational turnaround rested on four structural shifts, each of which helped establish the margin profile GE Vernova carries today.
Shrinking the footprint. In 2018, GE eliminated roughly 10,000 Power jobs—about 15% of the division's workforce—consolidated its operating footprint by approximately 30%, and targeted $900 million in structural base cost reductions.12 Crucially, management removed capacity permanently rather than idling facilities in anticipation of a cyclical recovery, resetting the division's fixed-cost breakeven point.
Selling non-core assets. Across 2017 and 2018, GE divested peripheral units: selling Industrial Solutions to ABB for $2.6 billion, Water & Process Technologies to SUEZ for $3.4 billion, and Distributed Power to Advent International for $3.25 billion.12 These divestitures reduced indebtedness and narrowed managerial focus to the utility-scale power generation portfolio.
Getting out of civil construction risk. The most decisive commercial change was abandoning turnkey engineering, procurement, and construction (EPC) contracts for full power plant builds. When GE contracted to build an entire facility at a fixed price, project delays in civil engineering, piping, concrete, or local labor directly eroded equipment margins. Under the revised framework, GE sold only turbomachinery and service agreements, leaving site construction risks to developers and engineering firms. Reporting by POWER magazine on 2018 noted that Power executives cited "project execution issues resulting in liquidated damages as well as partner execution issues" as a recurring cause of losses.12 Exiting full-scope construction halted those open-ended project liabilities.
Fixing the HA. Rather than minimizing the blade oxidation defect, management replaced components across the affected fleet, absorbed the warranty expenses, and stabilized customer relationships. That remediation preserved the platform's commercial standing. By October 2024, Strazik told analysts that GE had almost 60 gigawatts of HA turbines commissioned, more than 100 units running, and nearly 3 million operating hours on the fleet.16 In utility and hyperscaler procurement, verified operating hours represent the definitive proof required before committing capital to a multi-hundred-million-dollar generation project.
What the Turnaround Proved, and What It Didn't
By 2021, the turnaround had demonstrated the viability of the underlying franchise: an indispensable installed base paired with a cash-generative services annuity, supported by utility customers with few viable substitutes. What it had not yet established was whether the business could expand profitably. De-risking contracts and rationalizing capacity during a period of flat demand require rigorous discipline; scaling manufacturing during an unexpected demand boom without repeating the capacity misallocations of 2001 or 2014 requires a completely different capability. That capacity-expansion test represents the core operational challenge confronting GE Vernova today.
The next step was structural. Just as the conglomerate structure had concealed Power's operational distress during the downturn, it also obscured the division's subsequent financial recovery. Culp's solution was to break up the company.
V. The Spin-Off Mechanics & Launch: Engineering Independence (2021–2024) (30–35 min)
November 9, 2021: The Breakup
On November 9, 2021, General Electric announced a plan to split the conglomerate into three independent, investment-grade public companies. GE HealthCare would be spun off in early 2023, followed in early 2024 by the combined Renewable Energy, Power, and Digital businesses, while the remaining aviation franchise would retain the core corporate lineage.17 Culp framed the strategic rationale around operational autonomy, stating, "By creating three industry-leading, global public companies, each can benefit from greater focus, tailored capital allocation, and strategic flexibility."17 The announcement designated Scott Strazik as chief executive of the future energy company, noted that GE expected to reduce debt by more than $75 billion by the end of 2021, and projected roughly $2 billion in one-time separation costs.17
The operative phrase was "tailored capital allocation." Within the legacy conglomerate, Power had competed directly with Aviation and Healthcare for balance-sheet resources. During the Alstom expansion, it lost that capital competition in the most destructive way possible: receiving excessive capital at the cyclical peak. As an independent enterprise, the energy business would have to justify every dollar of capital allocation directly to its own shareholders.
A Name, a Headquarters, a Signal
On July 18, 2022, GE unveiled the energy company's new corporate identity: GE Vernova. The company described the name as a portmanteau blending "ver"—derived from verde and verdant, evoking the earth's greens and blues—with "nova," from the Latin novus, signaling "a new and innovative era of lower carbon energy."18 On December 15, 2022, the company selected 58 Charles Street in Cambridge, Massachusetts, as its global headquarters, providing capacity for up to 200 corporate employees while maintaining primary operational centers in Schenectady, Atlanta, and Greenville.19 Strazik noted that Cambridge offered "a dynamic environment, steeped in the education, talent, and innovation that will be core components of our work."19
The branding reflected the capital market priorities of 2022. Positioned as a dedicated energy-transition enterprise with green brand livery and a corporate address beside MIT, the initial narrative emphasized decarbonization. By 2026, however, the primary driver of the company's commercial valuation was its heavy-duty gas turbine fleet. That evolution was not a strategic contradiction; natural gas had long served as an explicit bridge fuel in GE Vernova's commercial framework. Even so, the shift illustrates how rapidly industry narratives evolved from pure-play clean technology toward dispatchable thermal power, and how corporate messaging reflects shifting investor appetite.
Distribution Day
The final structural milestones followed in rapid succession. The Cambridge headquarters opened on November 2, 2023; an eight-member board was appointed on November 14, 2023; and GE's board of directors formally approved the April 2 separation on February 29, 2024.20 At its inaugural Investor Day on March 6, 2024, management introduced its core operational principles, structured around the lean manufacturing rubric of "Safety, Quality, Delivery and Cost (SQDC)."20 The spin-off was completed through a distribution of one share of GE Vernova common stock for every four shares of General Electric common stock held on the March 19, 2024 record date.1
Capital structure and balance-sheet reality. Retrospective market commentary frequently asserts that GE Vernova launched with an unassailable "fortress balance sheet." The documented financial structure was more nuanced. The company commenced independent operations with $4.2 billion in cash, a total that expanded to $8.2 billion by the end of 2024 on the strength of operational cash flow and sizable customer advance payments.21 However, the business subsequently assumed funded debt. When it acquired the remaining interest in Prolec GE in February 2026, half of the $5.275 billion purchase price was debt-financed.22 In an August 2026 credit assessment, Fitch Ratings counted that $2.6 billion in acquisition debt alongside more than $900 million of supply-chain financing obligations as total debt.23 While the balance sheet remains solidly investment-grade, it is not unencumbered, and the presence of supply-chain financing represents an essential consideration when evaluating how working-capital dynamics influence reported cash flow.
The Starting Promises
Management's initial guidance at the spin-off established the fundamental baseline for evaluating the business. In April 2024, the company projected that by 2028 it would achieve mid-single-digit organic revenue growth, a 10% adjusted EBITDA margin, and free cash flow conversion of 90% to 110%.1 Strazik also stated that the company was investing about $1 billion a year in research and development.1 Those targets serve as the benchmark against which subsequent operational execution must be audited. Later sections examine how management performed against those commitments—a comparison in which the eventual results diverged significantly from initial guidance, largely in the company's favor. Evaluating the operational mechanics behind that divergence requires examining the contrasting unit economics across its three reporting segments.
VI. Inside the Machine: Segment Economics, Materiality & Disconfirming Realities (50–55 min)
Three Businesses, Three Different Stories
In its first full year as an independent company in 2024, GE Vernova reported $34.9 billion of revenue, $44.1 billion of orders, $2.0 billion of adjusted EBITDA (a 5.8% margin), and $1.7 billion of free cash flow.21 Across its three operating units, however, the financial profiles resembled three distinct enterprises:
- Power generated $18.1 billion of revenue with a 12.5% segment EBITDA margin.
- Wind generated $9.7 billion of revenue with a negative 6.1% margin.
- Electrification generated $7.5 billion of revenue with a 9.0% margin.21
By 2025, that divergence had widened. Power expanded to $19.8 billion of revenue at a 14.7% margin, Electrification reached $9.6 billion at 14.9%, and Wind contracted to $9.1 billion at negative 6.6%.24 Management's guidance for 2026 projected segment EBITDA margins of 17% to 19% for Power and 18% to 20% for Electrification, alongside an expected operating loss of roughly $400 million in Wind.25 One segment funds the enterprise, one is growing fastest, and one remains an operational drag. The analysis examines each in turn.
1. Power: The Cash Generation Engine
A factory in South Carolina. On the heavy-duty gas turbine assembly line in Greenville, South Carolina, machines the size of a two-story house are assembled around rotors balanced to millimeter tolerances. In the second quarter of 2026 alone, the Power segment booked 52 heavy-duty units—including 15 advanced HA turbines—and 61 aeroderivative turbines.25 In October 2024, Strazik stated that GE had "secured capacity to deliver between 70 to 80 heavy-duty gas turbines per year starting in 2026, up from 55 in recent years."16 By mid-2026, management outlined an annualized run rate of 20 gigawatts starting in the third quarter of 2026, expanding to 24 gigawatts in 2028, with an ultimate target of 30 gigawatts by 2030.5
The annuity. Equipment manufacturing is the visible face of the franchise, but aftermarket servicing generates the core profit. In October 2024, Strazik noted that the Power segment "generates approximately 70% of its revenue from services."16 The underlying business model is durable: an industrial gas turbine is engineered to operate for thirty years or more, yet its hottest components—combustion liners and first-stage rotating blades—wear out systematically based on operating hours and starts. Asset owners sign long-term service agreements with the original manufacturer covering planned maintenance outages, replacement hardware, and remote monitoring. It functions much like a classic razor-and-blades model, except the initial equipment costs tens of millions of dollars and the blades are proprietary nickel superalloy castings that only a handful of global facilities can produce.
Pricing. The most consequential commercial shift has been realized pricing. At the December 2025 investor update, Strazik detailed the timeline: "Our first real pricing increase of substance was in May of 2024, and it took us until November of 2024 to realize that price." Further price adjustments followed that December and "incrementally throughout this year," resulting in fourth-quarter 2025 realized pricing that was "substantially more than the price realized in the first three quarters."14 On the July 2026 earnings call, he stated that first-half 2026 orders were "priced more than 20% above 4Q 2025."26 Contracted gas capacity—encompassing firm backlog and slot reservation agreements—expanded from 62 gigawatts to 83 gigawatts during 202524 and reached 116 gigawatts by mid-2026, with management expecting at least 125 gigawatts by the end of the year.5
This commercial momentum reveals a clear reality: for the first time in over a decade, utility and hyperscaler customers are paying substantial premiums for GE's turbines and reserving production slots years ahead. While that provides unmistakable evidence of pricing power, it is also characteristic of the peak of a capital-goods cycle. Equipment prices command premiums when buyers face supply deficits, but acute shortages rarely last indefinitely.
Testing the moat. The core bull thesis contends that an installed base of more than 7,000 turbines produces an insulated recurring annuity. The company's own operating history provides the strongest counterevidence. Between 2016 and 2018, as renewable generation grew across Europe and the US, utilities curtailed the operating hours of their thermal power plants, causing the assumed annuity to weaken. Power's revenue dropped 22% in 2018, service contract accounting charges eroded margins, and the $22 billion goodwill writedown followed.12 3 Services revenue depends directly on turbine operating hours and dispatch starts; when fleet utilization falls, plant owners defer major maintenance overhauls, compressing cash flow.
That historical record narrows the moat thesis rather than invalidating it. An installed base constitutes a formidable defense against rivals, because few plant operators will risk installing third-party parts in critical turbomachinery. It does not, however, insulate the business from declining fleet utilization. While the 2026 operating environment is the most favorable for gas utilization in a generation, Strazik's own projections reflect that cyclicality: he expects outage volume to "grow substantially in the middle of the next decade" as recently installed units age into their service cycles.14 The definitive metric for validating the structural strength of the moat is organic growth in Power services across a complete cycle, rather than during an acute boom. In the second quarter of 2026, services grew 12% organically.25
Capacity discipline. The second operational test evaluates whether management can avoid repeating the overexpansion errors of 1998–2001 and 2014. Leadership maintains it will reach 30 gigawatts of annual production capacity by 2030 through "lean and incremental machinery in our existing factory footprint," adding roughly 400 new machines across its gas turbine plants by the end of 2026.26 In October 2024, Parks emphasized that this factory expansion was being funded by customer down payments on orders.16 Strazik highlighted that historical shift: "For a big part of that period of time, we had overcapacity in an industrial footprint that was a financial drag. That same industrial footprint... is now a catalyst."16
Execution to date supports the case for discipline: capacity is expanding incrementally inside existing facilities, underwritten by customer prepayments. Nonetheless, Strazik noted that if an 80-gigawatt annual market persists into the mid-2030s, "we would need to invest further in our supply chain" to handle new unit deliveries alongside the growing service workload.14 The commitment to discipline holds today, but faces its real test in the next leg of the capital cycle. The key metric to monitor is whether future capacity increases remain tied to binding volume commitments, which management has been negotiating with hyperscalers for deliveries spanning 2031 through 2035.14
2. Electrification: The AI & Grid Modernization Boom
The bottleneck. Every newly constructed data center campus, offshore wind farm, and gas-fired power station must connect to the high-voltage transmission grid, yet regional networks face an acute equipment shortage. Electrification manufactures that critical infrastructure: high-voltage switchgear, circuit breakers, transformers, HVDC converter stations designed to transport bulk power across long distances, power conversion systems, and grid orchestration software.
The division's backlog expansion has accelerated sharply. In October 2024, Strazik projected that the Electrification equipment backlog would more than triple from just over $6 billion at the end of 2022 by the close of 2024.16 By the end of 2025, that backlog had reached $30.5 billion—up $10.5 billion in a single year24—toward a stated management target of $60 billion by 2028.27 In the second quarter of 2026, Electrification orders rose 66% organically to $6.3 billion, revenue climbed 29% organically, the segment EBITDA margin reached 18.4%, and the book-to-bill ratio stood at roughly 1.7 times.25 Orders from data center customers crossed $5 billion during the first half of 2026, more than double the segment's total for all of 2025.5
The mechanics of HVDC explain that commercial demand. Ordinary alternating-current lines lose substantial energy over long distances, much like water leaking from a long garden hose, whereas direct current at ultra-high voltages transmits electricity with minimal line loss. Converting alternating current to direct current and back again requires specialized converter stations packed with power electronics that cost hundreds of millions of dollars and are engineered to order. Only a small group of global manufacturers can build them, prompting transmission developers to reserve delivery slots years in advance.
Prolec: buying transformer capacity. On February 2, 2026, GE Vernova completed the acquisition of the remaining 50% stake in Prolec GE, its long-standing transformer joint venture with Mexico's Xignux, for $5.275 billion, funded half in cash and half in debt. The transaction brought roughly 10,000 employees and seven manufacturing facilities in the Americas, five of them in the US.22 Prolec is expected to contribute approximately $3.1 billion to Electrification revenue in 2026.25 At the December 2025 investor update, Parks stated that full ownership removed geographical constraints, noting that the company had previously been "constrained in some ways as to markets that we could sell into based upon where the products were built."14
The transaction was GE Vernova's first large acquisition following the spin-off, raising the question of whether it risks repeating the capital misallocations of the Alstom deal. Real differences exist: the company bought out a partner it had worked with for three decades, in a product category facing structural deficits, with the majority of the manufacturing footprint situated in the fastest-growing market. Yet the structural similarity is also evident: management paid peak-cycle valuations for supply-constrained manufacturing capacity, just as GE paid peak prices for Alstom when thermal power demand was cresting. The investment outcome depends entirely on how long the global transformer deficit persists.
The weaker moat. Management's internal assessments acknowledge the competitive limits of the division. At the December 2025 investor update, when an analyst noted that Chinese, Korean, and Brazilian competitors were adding transformer manufacturing capacity in North America, Strazik conceded that the grid sector represents "a much more open playing field to project supply with grid equipment than, as an example, gas turbines. So I think we need to be especially thoughtful whenever we're evaluating incremental capacity."14 That admission is critical: leadership recognizes that Electrification's operating margins stem from near-term supply shortages rather than permanent technical barriers to entry. An 18% margin in a segment facing open competitive additions should be evaluated as peak-cycle pricing until tested by an industry downcycle.
3. Wind: Onshore Recovery vs. The Offshore Quagmire
Nantucket, July 2024. On Friday, July 19, 2024, a 107-meter Haliade-X blade on a Vineyard Wind turbine south of Nantucket broke apart, washing fiberglass debris onto the island's beaches.28 Federal regulators suspended offshore installation after 24 of the planned 62 turbines had been erected.28 GE Vernova traced the failure to "insufficient bonding" at its blade plant in Gaspé, Quebec, with a company spokesperson acknowledging that the defect was an issue the "quality assurance program should have identified."28 On the subsequent earnings call, Strazik detailed a protocol to inspect every blade produced by that facility: "think ultrasound, think a radiologist, but for a blade."28
By October, engineering investigations confirmed the root cause, and Strazik told analysts that "a very small proportion, low single digit proportion of our manufactured blades in totality" exhibited that manufacturing flaw.16 In the third quarter of 2024, the company recorded roughly $700 million of additional offshore contract losses, partially offset by a $300 million EBITDA benefit from an approximate $500 million settlement on an earlier cancelled offshore project.29 Strazik also signaled a retreat from undisciplined bidding, stating, "We do not foresee adding to this backlog without substantially different industry economics than what we see in the marketplace today."16 That approximately $3 billion offshore backlog, which management had previously expected to be largely complete by the end of 2025, was officially "moving to the right."16
Operational setbacks continued after the call. Subsequent litigation filings revealed that root-cause inspections identified defects in 68 of the 72 GE blades installed at Vineyard Wind, forcing the company to replace every Gaspé-manufactured blade with units shipped from its plant in Cherbourg, France.30 In December 2025, a federal stop-work order halted the project when it was roughly 95% complete, with blades on ten turbines still awaiting replacement.31 Construction finally concluded on March 16, 2026.31 Three weeks later, on April 8, 2026, Vineyard Wind filed suit against GE's renewables business in Massachusetts Superior Court, alleging "catastrophic injury" from defective blades and seeking $853 million in damages against the roughly $1.3 billion contract, following GE's earlier threat to terminate the turbine supply agreement over unpaid bills.30 The litigation remains an active and unresolved legal liability.
What the offshore episode shows about management. Leadership's initial crisis management was direct and specific: identifying the root cause within days, applying non-destructive ultrasound testing across the fleet, and refusing new loss-making offshore contracts. Yet schedule commitments slipped significantly. Project completion was delayed by more than a year, the initial characterization that only a "low single digit proportion" of blades were defective conflicted with the 68-of-72 failure rate uncovered at Vineyard Wind, and commercial disputes culminated in litigation. The evidence indicates management responded with operational transparency, but could not avoid the protracted delays and cost liabilities typical of first-of-a-kind fixed-price offshore engineering.
Onshore: the quieter repair. The Onshore Wind turnaround demonstrates lean operational principles under adverse market conditions. Vic Abate—who led GE Renewable Energy from 2005 to 2013, guided Gas Power through the HA platform introduction, and served as GE's chief technology officer—took over Onshore Wind in 2022 and the consolidated Wind segment in 2023.32 His strategy focused on standardizing production around a small fleet of "workhorse" turbines. In October 2024, Strazik stated that more than 2,000 commissioned 2.8-megawatt workhorse units were operating at roughly 98% availability.16 Parks noted that the onshore manufacturing footprint had been "resized... to be profitable at about 1,000 turbines a year."16 In the US, the 2.4-gigawatt SunZia project in New Mexico, which deploys GE Vernova turbines as the largest planned wind installation in the Western Hemisphere,33 became operational in the second quarter of 2026.25
Where Wind stands now. Financial momentum in the segment has continued to weaken. In December 2024, management guided toward a 10% EBITDA margin for Wind by 2028.34 By December 2025, leadership lowered that projection to 6%, while forecasting low-double-digit revenue declines.27 In the second quarter of 2026, Wind orders fell 40% organically, revenue fell 11%, and the segment posted an operating loss of $275 million—a negative 13.6% margin—driven by subdued onshore orders and offshore contract pressures.25 Strazik cited "permitting delays and tariff uncertainty" as the primary drivers of depressed onshore equipment demand.26
This downward trajectory marks the company's most visible guidance reduction, qualifying the notion that management systematically under-promises. Onshore wind operates with lean discipline, but it remains dependent on regulatory policy. Factory cost containment can generate modest profitability at reduced volumes, but it cannot stimulate utility demand. Wind now accounts for less than one-fifth of consolidated revenue and continues to shrink, reducing its weight in the overall investment thesis. While that contraction shields consolidated earnings from further drag, it also demonstrates that GE Vernova's initial identity as an energy-transition pure play has diminished relative to its thermal power core.
4. Sizing the Speculative: Small Modular Reactors
GE Vernova's nuclear arm, GE Hitachi Nuclear Energy, is developing the BWRX-300, a 300-megawatt small modular reactor based on the company's commercial boiling-water reactor technology. On April 4, 2025, the Canadian Nuclear Safety Commission issued Ontario Power Generation a construction licence for a BWRX-300 unit at the Darlington site in Clarington, Ontario. OPG targets commercial operation for the initial unit by late 2029, with three subsequent units planned for the mid-2030s to deliver roughly 1.2 gigawatts of total capacity.35 In the US, the Tennessee Valley Authority entered an alliance in January 2025 with Bechtel, Sargent & Lundy, and GE Hitachi to design a potential BWRX-300 installation at its Clinch River site.35
Evaluating the economic scale of small modular reactors requires distinguishing commercial enthusiasm from income-statement materiality. In October 2024, Strazik explicitly stated that SMRs would not "financially become a meaningful part of our income statement with revenue and growth until early into the next decade."16 He emphasized that the nearer-term nuclear opportunity lies in the installed fleet: GE equipment is deployed across 65 US commercial nuclear plants, representing at least 3 gigawatts of potential power uprates alongside prospective plant life extensions and restarts.16 Nuclear services orders grew in the second quarter of 2026.25
The history of nuclear engineering warrants valuation caution. Securing a construction licence is not equivalent to recognizing commercial revenue, and first-of-a-kind reactor projects in Western nations carry a long record of schedule slippage and budget inflation. The BWRX-300 functions as a long-dated call option: commercially transformative if Darlington commissions on time and on budget while demonstrating cost compression for subsequent builds, but immaterial to near-term fundamental cash flows. The scheduled 2029 start date at Darlington will provide that test. From there, the analysis turns to the global peers GE Vernova competes against.
VII. Competitive Landscape & Hamilton Helmer’s 7 Powers (40–45 min)
A Three-Player Market
Only three manufacturers in the world possess the engineering scale to supply advanced, heavy-duty gas turbines: GE Vernova, Siemens Energy, and 三菱重工業 Mitsubishi Heavy Industries through its Mitsubishi Power subsidiary. Global Energy Monitor reported in August 2024 that these three original equipment manufacturers supplied roughly two-thirds of the turbine capacity for gas plants under construction worldwide, with GE Vernova accounting for approximately 55 gigawatts. In the Asia-Pacific region, GE Vernova's share of that construction pipeline stood at 38%, compared to 17% for Mitsubishi and 16% for Siemens Energy.36 In China, GE Vernova—operating directly and via its joint venture with 哈尔滨电气 Harbin Electric—held approximately 39% of the pipeline, while Mitsubishi, partnered with 东方电气 Dongfang Electric, held roughly 25%.36
Siemens Energy. Siemens Energy represents GE Vernova's most direct competitor across both gas generation and transmission infrastructure, and it weathered its own severe operational crisis. In November 2023, the German government helped coordinate €15 billion in credit guarantees for the company—including €7.5 billion directly backstopped by the federal state—after widespread mechanical defects across Siemens Gamesa wind turbines drove an annual net loss of approximately €4.5 billion, accompanied by state-mandated restrictions on executive bonuses and dividend distributions.37 The structural parallel to GE Vernova's offshore turbine liabilities is direct: both industrial leaders discovered that accelerating unproven wind architectures into commercial deployment can rapidly consume years of cash flow generated by core turbomachinery.
Mitsubishi Heavy Industries. Mitsubishi's advanced J-series machines represent the primary technical alternative to GE's HA platform. When blade oxidation defects emerged across the HA fleet in 2018, impacting utilities across Texas, Japan, and France,12 rival manufacturers gained a commercial opening to contest upcoming generation awards. Leadership has acknowledged the geographic boundaries of GE's market position: at the December 2025 investor update, Strazik conceded that for heavy-duty turbines, the company's global share in 2025 "is not going to be a lot higher than it has historically been," noting that while its domestic US share ran above historical norms, "there's a lot of business in other parts of the world with 50Hz applications that other OEMs are winning."14
Grid peers. In Electrification, GE Vernova contends with 日立製作所 Hitachi—operating through Hitachi Energy, the former ABB Power Grids business—alongside Siemens Energy's grid division and an expanding cohort of Asian and Latin American transformer manufacturers constructing capacity across North America.14 In the current supply-constrained environment, utility customers prioritize guaranteed delivery slots over price concessions. Yet as Strazik observed regarding grid equipment operating on "a much more open playing field," pricing leverage can normalize rapidly once competitor manufacturing facilities achieve commercial scale.
Hamilton Helmer's 7 Powers
Switching costs (the strongest power). Once an electric utility engineers a combined-cycle generating station around a 7HA turbine—tailoring reinforced civil foundations, high-pressure steam piping, digital balance-of-plant controls, and operating procedures to that specific machine—replacing the prime mover with a competing unit requires fundamentally re-engineering the plant. That architectural lock-in binds the asset owner to the original manufacturer's parts and maintenance ecosystem for decades. While independent service providers contest routine balance-of-plant overhauls, the original equipment manufacturer retains proprietary control over hot-gas-path metallurgy, casting tolerances, and core digital governor code. That structural insulation explains why contractual services account for roughly 70% of Power segment revenue, sustaining steady order expansion even as cyclical equipment orders fluctuate.16 The limitation of this economic moat is equally distinct: switching costs protect an established installed base rather than future procurement decisions. As Strazik's acknowledgment regarding 50-hertz international awards underscores, buyers evaluating greenfield projects regularly award contracts to competing manufacturers.
Process power. The accumulated proprietary knowledge embedded in single-crystal superalloy metallurgy, ceramic thermal barrier coatings, and complex aerodynamic combustion design represents an institutional capability refined across generations that cannot be replicated quickly. Yet industrial history also illustrates that process power is perishable rather than absolute. The first-generation HA blade oxidation defect in 2018 and the adhesive bonding failures at the Gaspé wind blade facility were structural process breakdowns. Process discipline requires continuous shop-floor verification and strict quality control; when execution slips, technical leadership can rapidly transform into extensive warranty liability.
Scale economies. Developing a utility-scale gas turbine platform or high-voltage direct-current converter architecture requires multi-year capital commitments, extensive prototype testing, and substantial engineering overhead. GE Vernova amortizes those fixed developmental burdens across the largest installed generation fleet in the world, underpinned by annual research and development investments of approximately $1 billion.1 That scale creates an enduring structural advantage in heavy gas turbines, though it provides a comparatively narrower defense in grid equipment, where modular engineering and regional manufacturing requirements permit smaller competitors to contest market share.
Counter-positioning. GE Vernova commands no counter-positioning advantages, and in the wind turbine sector it operates on the defensive side of this dynamic. Vertically integrated Chinese wind turbine manufacturers, including 金风科技 Goldwind and 远景能源 Envision, leverage lower domestic component costs, highly scaled localized supply chains, and aggressive pricing to dominate their domestic market while competing aggressively across emerging markets. GE Vernova's strategic decision to retrench its onshore wind footprint around a standardized North American fleet represents a direct concession to those cost disparities.
Cornered resource, network effects, branding. These structural powers remain minimal or non-existent across heavy industrial equipment. Turbomachinery exhibits no direct network effects: an additional turbine deployed in the field does not inherently increase the utility of another operator's fleet. Proprietary patents protect specific component geometries, but core engineering talent and raw materials remain accessible across the global supply base. While the GE industrial monogram commands historical recognition, regulated utilities and commercial developers purchase equipment based on verified heat rates, availability guarantees, delivery schedules, and financing terms, rather than corporate brand affinity.
Porter's Five Forces, Briefly
- Threat of new entrants: almost non-existent in heavy-duty gas turbines, given extreme capital requirements, specialized metallurgy, and decades of operational qualification. Moderate and rising in transformers and transmission hardware, where international manufacturers are actively establishing greenfield capacity across North America.
- Buyer power: depressed in the current market, as utilities and hyperscalers compete for constrained factory production slots. Under normalized market conditions, however, buyer power remains structurally high: regulated electric utilities operate under strict prudential cost reviews, while hyperscalers represent sophisticated institutional buyers capable of imposing stringent commercial terms. Strazik's observation that customers begin "getting grumpy when there's nothing left" as equipment pricing escalates illustrates the commercial tensions accumulating beneath peak-cycle demand.14
- Supplier power: moderate to elevated. Heavy equipment manufacturing depends on a concentrated tier-one supply base for specialized large forgings, rotor castings, grain-oriented electrical steel, and high-purity nickel superalloys.
- Threat of substitutes: low across the medium term for firm, dispatchable utility-scale power. Over a multi-decade horizon, the threat expands as utility-scale battery storage, long-duration chemical storage, and advanced nuclear platforms gradually mature.
- Rivalry: disciplined within the three-player gas turbine oligopoly, intense across the global wind turbine sector, and poised to accelerate in grid electrification as newly funded global capacity enters service.
Taken together, GE Vernova's structural competitive advantages are concentrated most heavily within its gas turbine installed base, and least established within the electrification and renewables divisions where public markets project the most rapid top-line growth. Reconciling that strategic tension is central to auditing management's long-term capital allocation and incentive structure.
VIII. Management Credibility, Incentives & Capital Allocation Stress Test (30–35 min)
The Two Operators
Scott Strazik built his executive reputation by repairing a distressed franchise rather than stewarding an established winner. On quarterly conference calls, Strazik tends to deliver expansive, operationally detailed answers that consistently frame near-term results within long-term capital cycles. Chief Financial Officer Ken Parks, who joined the leadership team in October 2023, brings a complementary background. A certified public accountant who began his career at Coopers & Lybrand, Parks previously served as CFO at Owens Corning, Mylan, and Wesco International, following divisional finance and investor relations roles at United Technologies.38 His executive commentary focuses tightly on cash conversion, working-capital discipline, and preserving an investment-grade balance sheet.
Promises vs. Outcomes
Auditing management credibility requires measuring stated commitments against realized performance across both multi-year projections and annual guidance.
The multi-year outlook. At the April 2024 spin-off, management targeted mid-single-digit organic revenue growth and a 10% adjusted EBITDA margin by 2028.1 Eight months later, in December 2024, leadership raised the 2028 baseline to roughly $45 billion in revenue and a 14% margin, while projecting at least $14 billion in cumulative free cash flow across the 2025–2028 period.34 In December 2025, management lifted those targets again, to $52 billion in revenue, a 20% margin, and at least $22 billion in cumulative free cash flow.27 Following the Prolec acquisition in January 2026, the target expanded once more, to $56 billion in revenue and at least $24 billion in cumulative free cash flow.24
Annual guidance. A parallel pattern unfolded in annual targets. In December 2025, leadership projected 2026 revenue of $41 billion to $42 billion and free cash flow of $4.5 billion to $5.0 billion.27 Incorporating Prolec lifted that range to $44 billion to $45 billion in revenue and $5.0 billion to $5.5 billion in free cash flow.24 By July 2026, management raised full-year guidance substantially, projecting $45.5 billion to $46.5 billion in revenue and $11.5 billion to $12.5 billion in free cash flow—more than double the cash flow projected seven months earlier.25 That revision followed an already robust 2025 performance: full-year revenue of $38.1 billion and free cash flow of $3.7 billion24 comfortably exceeded the initial January 2025 guidance of $36 billion to $37 billion in revenue and $2.0 billion to $2.5 billion in cash flow.21
The Wind divergence. The sole exception to this upward trajectory occurred in Wind. As examined previously, management reduced its 2028 segment EBITDA margin target from 10% to 6%, while the completion schedule for legacy offshore contracts slipped by more than a year.
Attributing the beats. How should these compounding guidance increases be evaluated? Market observers generally offer two competing interpretations. The first attributes the beats to deliberate conservatism, arguing that leadership established low initial hurdles to build market credibility. The second contends that an extraordinary cyclical tailwind lifted fundamentals so rapidly that almost any leadership team would have been forced to revise estimates upward. The operational performance in Wind provides a useful control test: in the one segment where industry tailwinds failed to materialize, management fell short of its targets. While that shortfall does not indicate flawed execution—since many legacy offshore contracts were originated under previous conglomerate leadership—it does demonstrate that the exceptional upgrades across Power and Electrification reflect external demand shocks at least as much as internal managerial prowess.
What the Pay Plan Actually Rewards
A frequent assertion in bullish commentary is that GE Vernova's executive compensation structure explicitly discourages growth for its own sake by anchoring incentives to return on invested capital. The company's 2026 proxy statement tells a different story. The 2025 annual incentive plan weighted performance across free cash flow (40%), adjusted EBITDA (40%), and organic revenue growth (20%), further adjusted by individual performance and a safety and sustainability modifier of plus or minus 10 percentage points.39 Meanwhile, long-term incentive compensation—the 2025–2027 performance share units—is tied equally to three-year cumulative adjusted EBITDA (50%) and free cash flow (50%), modified by relative total shareholder return by plus or minus 20%. Return on invested capital is absent from the formula.39 For 2025, executive payouts ranged from 157% to 200% of target, while the CEO's target annual bonus was increased from 135% to 150% of base salary.39
That structure offers meaningful improvements over legacy practices. Weighting cash generation and operating profitability avoids the aggressive volume targets and non-cash accounting metrics that characterized the Immelt era, and limiting top-line revenue to a 20% weighting discourages undisciplined bidding. Yet from a governance perspective, the framework leaves two structural vulnerabilities unaddressed. First, without a capital-intensity or return-on-capital hurdle, the formula does not directly penalize overinvesting in plant capacity—the exact strategic error that crippled GE Power during previous upcycles. Second, heavily weighting free cash flow during a capacity crunch rewards management for customer down payments and reservation fees that temporarily inflate cash balances ahead of actual equipment delivery. Distributing maximum 200% incentive payouts when cash generation is propelled by slot reservations risks conflating cyclical customer anxiety with enduring operational performance.
Capital Allocation: The Record So Far
Returns to shareholders. In December 2024, the board instituted a $0.25 quarterly dividend alongside a $6 billion share repurchase authorization, formalizing a capital-allocation policy to return "at least one third of cash generation" to shareholders.34 One year later, in December 2025, the company doubled the dividend to $0.50 per share and expanded the repurchase authorization to $10 billion.27 During 2025, GE Vernova repurchased 8.2 million shares at an average price of $406.24 By mid-2026, it had repurchased an additional 4.3 million shares at an average price of $854, deploying $2.3 billion in the second quarter alone.25
The sharp escalation in repurchase pricing illustrates a classic capital-allocation dilemma. Repurchasing shares at $854 represents paying more than double the prior-year average price, near all-time trading highs. Share repurchases compound intrinsic value only when executed below a stock's discounted future cash flows; buying heavily at peak valuation multiples risks destroying capital if operating margins normalize. A policy anchored to returning a fixed percentage of operating cash flow mechanically forces a business to repurchase the greatest volume of shares when cash generation—and typically equity valuation—reaches a cyclical zenith.
Portfolio moves. Management's corporate transactions have remained tightly focused on core infrastructure. In the third quarter of 2024, the company monetized high equity valuations in South Asia by selling a 16% stake in its publicly listed subsidiary, GE Vernova T&D India, generating approximately $700 million in pre-tax proceeds while retaining majority control.16 In early 2026, it consolidated control over transformer manufacturing by acquiring the remaining half of Prolec GE for $5.275 billion.22 Later, in July 2026, the company completed a bolt-on technology transaction, acquiring robotics firm Robotech Automation.26 None of these transactions resemble the speculative conglomerate diversification of the Alstom era; each targeted existing core product lines. Nevertheless, this transactional record spans only thirty months of standalone operation, all during an extraordinary demand expansion. True capital allocation discipline is proven during industry downturns, an environment this independent leadership team has not yet navigated.
Balance sheet signals. Rating agencies have endorsed the initial financial trajectory. On August 12, 2026, Fitch Ratings upgraded GE Vernova's long-term issuer default rating to 'A-' from 'BBB+', citing rapid margin expansion, robust cash generation, gross debt leverage running at just over one times EBITDA, and a cash balance exceeding $13 billion.23
The Q2 2026 Call
The earnings call in July 2026 captured the strategic tensions confronting the enterprise. Although quarterly orders climbed 88% organically, annual guidance expanded sharply, and quarterly free cash flow surpassed cash generated during the entire prior year, the stock dropped roughly 3% in premarket trading after earnings per share missed consensus estimates.26 When analysts questioned whether 2026 marked the cyclical peak for equipment bookings, Strazik pointed to the company's trajectory toward at least 125 gigawatts under contract by year-end, predicting an "inflection point" during the second half of the year when "orders in backlog will be greater than gigawatts on slot reservation agreement."26 That operational metric was specific, measurable, and auditable against future filings—the hallmark of disciplined guidance. Yet it is also precisely the argument management offers at the apex of a capital cycle. Commercial results across the second half of 2026 will reveal whether that confidence marks a durable expansion or the crest of a historic boom.
IX. Risk Radar & The Skeptical-Investor Stress Test (25–30 min)
The View From a Short Seller
A skeptical investor evaluating GE Vernova in September 2026 would rarely argue that the underlying franchise is broken. The core critique is more disciplined: public markets are paying peak-cycle valuation multiples for peak-cycle cash flows. Four operational and structural risks test whether those premium valuation multiples are sustainable.
1. Offshore Wind and Quality Contagion
How it could hurt. Although the legacy offshore backlog is approaching completion, legal exposure remains significant. Vineyard Wind's breach-of-contract lawsuit, seeking $853 million in claimed damages,30 remains an active liability in Massachusetts Superior Court, while turbine installation on the Dogger Bank project in the UK continues.26 The broader risk, however, is reputational contagion. Because the blade failure at Gaspé was an adhesive manufacturing defect rather than an inherent aerodynamic design flaw, any subsequent manufacturing fault across the broader portfolio—whether in high-voltage grid equipment or heavy gas turbines—risks being judged through that same lens. If execution inconsistencies appear across disparate divisions, utility customers and project financiers may begin questioning GE Vernova's overarching quality assurance systems.
How big. The near-term financial loss is largely ring-fenced, given that management has guided the Wind segment to an operating loss of roughly $400 million in 2026.25 The reputational risk, however, is far more difficult to quantify. The definitive warning sign for investors would be an unexpected warranty provision or quality-related remediation charge emerging outside the Wind division.
2. A Hyperscaler Slowdown
How it could hurt. Commercial exposure to hyperscalers is compounding rapidly across multiple divisions. At the December 2025 investor update, Strazik noted that technology companies accounted for approximately 10% of the gas turbine backlog, but projected that hyperscaler commitments would expand to "more like a third."14 In parallel, data center infrastructure bookings in Electrification surpassed $5 billion during the first half of 2026 alone.5 If capital expenditure across the artificial-intelligence sector decelerates—whether due to underwhelming returns on computing infrastructure, breakthroughs in algorithmic efficiency, or tightening corporate liquidity—the initial impact would register as a slowdown in slot reservation conversions and net equipment bookings, followed by margin compression as pricing power softens.
The protection. Crucially, the majority of GE Vernova's order backlog remains anchored by regulated utilities and independent power producers worldwide. Strazik has pointed to robust procurement pipelines spanning Taiwan, Saudi Arabia, Mexico, Southeast Asia and Qatar.26 Furthermore, customers must commit non-refundable advance payments to secure production schedules. Nevertheless, slot reservation agreements are options rather than binding purchase commitments. The definitive metric to monitor is the conversion rate of those reserved gigawatts into firm backlog over coming quarters.
3. Policy on Gas and Carbon
How it could hurt. While federal and state policies currently prioritize grid reliability and dispatchable capacity, the regulatory framework governing fossil-fuel generation remains volatile. Stricter emissions standards for thermal generating stations, expanding state renewable portfolio mandates, or mandatory carbon-capture compliance rules could constrain the running hours of newly commissioned gas turbines. Such dispatch restrictions directly threaten the company's financial model, because high-margin service revenue is tied mechanically to fired operating hours and turbine starts.
The Wind segment illustrates the opposite face of regulatory vulnerability. Strazik cited "permitting delays and tariff uncertainty" as the primary drivers of subdued onshore equipment demand,26 while a federal stop-work order halted Vineyard Wind construction when the project was roughly 95% complete.31 While GE Vernova's balanced portfolio provides a theoretical hedge—offering equipment aligned with competing political agendas—it also ensures that individual operating segments remain perpetually exposed to shifting regulatory priorities.
4. Supply Chain and Cash Flow
How it could hurt. Scaling annual manufacturing capacity to 30 gigawatts depends directly on a constrained global supply base for specialized large forgings, rotor castings, grain-oriented electrical steel, and specialized manufacturing labor. Parks has noted that workers are being trained ahead of demand to limit productivity losses during the manufacturing ramp.26
A more subtle vulnerability lies in the composition of reported cash generation. Management increased 2026 free cash flow guidance to between $11.5 billion and $12.5 billion.25 The multi-year framework introduced in January 2026 targeted at least $24 billion in cumulative free cash flow across the 2025–2028 period.24 Combined with the $3.7 billion generated in 2025, that target implies that an outsized portion of the four-year cash total is arriving in 2026 as customers prepay for production slots years ahead of equipment delivery. While those cash inflows represent valid balance-sheet liquidity, they essentially draw working capital from future periods. As manufacturing catches up with delivery schedules, those deferred revenues burn off with minimal incremental cash collection, meaning reported free cash flow could compress even as operating margins remain robust. Evaluating free cash flow alongside changes in contract liabilities is therefore essential to avoid extrapolating 2026 cash conversion. Furthermore, Fitch Ratings' decision to treat more than $900 million in supply-chain financing obligations as funded debt23 underscores the degree to which working-capital financing mechanisms support current liquidity.
Accounting judgment. Long-term contractual service agreements inherently require management to make multi-decade assumptions regarding maintenance intervals, component degradation, thermal stress, and customer dispatch profiles—the exact accounting mechanics that exacerbated the 2017–2018 writedowns. While no accounting restatements or audit concerns have emerged at GE Vernova, those subjective long-term estimates remain an intrinsic feature of industrial equipment accounting.
Each of these operational and financial vulnerabilities connects directly to lessons from the company's corporate history, which provide the analytical foundation for the subsequent section.
X. Playbook: Durable Business & Investing Lessons (20–25 min)
Lesson 1: The Conglomerate Discount Was an Operating Problem, Not Just a Valuation One
In 2018, outside investors could not evaluate GE Power's underlying unit economics through the opacity of the parent conglomerate's consolidated accounts. By 2026, those same assets operate with divisional reporting transparency, regular disclosure of contracted gigawatt volumes, and an executive compensation structure tied directly to standalone performance. The corporate separation did more than eliminate a conglomerate trading discount; it fundamentally restructured managerial focus. While the expansion of GE Vernova's market valuation from approximately $36 billion to roughly $252 billion across thirty months2 was propelled predominantly by a cyclical demand surge, independence provided the operational transparency that allowed public markets to identify and reward that recovery.
Lesson 2: An Installed Base Is Only as Valuable as How Much It Runs
The recurring service annuity that anchors current valuation models nearly collapsed in 2018, when thermal fleet utilization dropped and contractual margin assumptions proved overly optimistic.12 An installed base provides a formidable technical defense against rival equipment manufacturers, but it offers little insulation against a cyclical decline in fleet utilization. For any capital-goods franchise underpinned by an aftermarket model, recurring cash flows cannot be taken for granted without first examining how intensively the machines are dispatched, how durable the supplier's pricing power remains, and how conservatively long-term service liabilities are accounted for.
Lesson 3: Don't Underbid the Energy Transition
Underbidding first-of-a-kind projects in an inflationary environment creates liabilities that can erase years of manufacturing profits. GE's legacy offshore wind commitments—underwritten at fixed prices on an unproven turbine architecture before supply-chain bottlenecks and rising interest rates roiled the sector—generated billions of dollars in cumulative contract losses and culminated in protracted litigation. Siemens Gamesa endured an analogous operational breakdown that ultimately required a German government-backed rescue.37 The capital equipment providers compounding value across the energy transition prioritize standardized hardware platforms, collect customer down payments to secure production schedules, and leave civil engineering and construction liabilities to developers—mirroring the operational pivot Scott Strazik executed when Gas Power exited turnkey construction contracts.
Lesson 4: Lean Manufacturing Is Financial Engineering in Reverse
Where the legacy conglomerate relied on financial engineering and leverage at GE Capital to generate accounting earnings, lean operational execution seeks to unlock manufacturing capacity directly from the factory floor. According to management, roughly 75% of the planned doubling in power transmission capacity is engineered to come from optimizing existing industrial assets and labor, with only 25% requiring new brick-and-mortar facilities.16 Similarly, rationalizing the Onshore Wind portfolio around standardized workhorse turbines lifted fleet availability to approximately 98%.16 Incremental shop-floor efficiencies lack the headline glamour of multi-billion-dollar corporate acquisitions, but they compound durable operating margins without generating catastrophic goodwill impairments down the road.
Lesson 5: Forecasts Can Be Wrong by a Factor of Three
Long-term demand projections in capital goods are notoriously fragile. In 2018, GE's chief executive projected that the annual heavy-duty gas turbine market was settling into the "25 to 30 GW range for the foreseeable future."12 Seven years later, the same leadership team outlined an addressable market that could reach 80 gigawatts annually.14 Both estimates were formulated by well-informed industry executives using the best available commercial data. For long-term investors, the takeaway is straightforward: an investment thesis cannot hinge on the precision of multi-year macroeconomic projections. It must be built to withstand the reality that industrial forecasts can miss the mark by a factor of three—a realization that frames the fundamental bull and bear cases that conclude this analysis.
XI. Bear vs. Bull Case & The Forward KPIs (25–30 min)
The Bull Case: Owning the Bottleneck
The thesis. Electricity consumption has transitioned from nearly two decades of flat demand into steady expansion,4 and GE Vernova controls critical manufacturing bottlenecks in heavy-duty gas turbines and high-voltage grid equipment. The bull case contends that this procurement cycle will persist well into the next decade rather than dissipating in a brief cyclical spike.
Supporting evidence. - Realized pricing power. Gas turbine orders booked in the first half of 2026 were priced more than 20% above the fourth quarter of 2025,26 driving backlog margins higher as elevated slot reservation agreements convert into firm commitments.14 - Backlog visibility. With a total backlog of $176 billion5 and management targeting roughly $200 billion by 2028,27 production capacity is effectively booked out for several years. - Margin expansion toward 20%. Management guidance projects segment EBITDA margins in the high teens for both Power and Electrification in 2026,25 targeting 22% for each by 2028.27 - Long-dated service annuities. As newly delivered turbines age into major maintenance intervals during the 2030s, recurring service revenue is poised to expand across an installed base protected by high switching costs.14 - Diminishing wind drag. As Wind contracts to a smaller share of consolidated revenue, its operating losses have a diminishing impact on corporate profitability. - Balance-sheet capacity. An 'A-' investment-grade credit rating from Fitch, a cash position exceeding $13 billion, and gross debt leverage running at roughly one times EBITDA23 provide ample liquidity to reinvest through cyclical downturns and sustain share repurchases.
What the bull case assumes. The heavy-duty gas turbine oligopoly maintains pricing and capacity discipline, international grid competitors expand slowly, hyperscaler infrastructure demand remains durable, and turbine utilization stays high enough to generate robust aftermarket cash flows in the next decade.
The Bear Case: A Cycle Valued as a Trend
The thesis. Heavy electrical equipment manufacturing is inherently cyclical, and public equity markets typically assign peak valuation multiples to peak cash flows. At an enterprise valuation of roughly $252 billion,2 GE Vernova is priced as though peak operating margins and temporary supply shortages represent a permanent steady state.
Supporting evidence. - Fragile demand forecasting. Leadership projected an annual gas turbine market of 25 to 30 gigawatts in 2018, only to forecast an 80-gigawatt market seven years later; neither baseline represents a reliable guide, leaving peak-cycle valuations vulnerable to macro forecasting errors.12 14 - Open competition in grid equipment. Strazik acknowledged that grid equipment is "a much more open playing field," with international manufacturers from China, Korea, and Brazil actively expanding capacity across North America;14 consequently, Electrification's 18% segment margin25 could face competitive margin compression well before gas turbine pricing softens. - Cash flow pull-forward. Sizable customer prepayments and slot reservation fees are artificially inflating 2026 free cash flow, creating working-capital reversals in future years as equipment is manufactured and delivered without matching cash collections. - Customer concentration risks. With hyperscalers projected to account for approximately one-third of the gas turbine backlog,14 exposure to a small cohort of sophisticated technology buyers leaves order books vulnerable to any spending pauses in artificial intelligence. - Share repurchases at cyclical highs. Repurchasing equity at an average price of $854 per share25 risks destroying capital if operating margins normalize and public markets re-rate the business as a cyclical industrial manufacturer. - Protracted quality and legal liabilities. Vineyard Wind's $853 million breach-of-contract lawsuit30 remains an unresolved liability, underscoring that quality control failures surfaced twice in six years—first with HA turbine blades in 2018, and again with offshore wind blades in 2024.
What the bear case assumes. Capital expenditure by hyperscalers moderates by 2027 or 2028, transmission equipment prices decline as global manufacturing additions enter service, and the market re-rates GE Vernova from a secular compounder to a cyclical industrial capital-goods producer.
Weighing the Two Cases
The weight of historical and operating evidence points toward a narrower, more disciplined version of the bull case. The heavy-duty gas turbine franchise operates as an entrenched oligopoly underpinned by high customer switching costs and verified pricing power. Electrification is an essential business benefiting from structural grid deficits, yet it is currently realizing peak margins in a market that leadership acknowledges is exposed to new entrants. Meanwhile, Wind has contracted sufficiently that it no longer dictates consolidated performance. GE Vernova's corporate history does not dispute that it owns premier heavy-industrial assets, but it confirms that its primary profit pools remain cyclical. The analytical challenge is determining the duration of that cycle, rather than assuming it will not turn.
The Three KPIs That Matter Most
-
Gas Power gigawatts under contract and conversion velocity. Tracking the aggregate volume of firm backlog and slot reservation agreements—which management expects to reach at least 125 gigawatts by the end of 20265—alongside the conversion rate of reservations into binding orders. This single metric reveals underlying utility and hyperscaler demand, confirms realized pricing gains, and signals whether prospective buyers are finalizing commitments or deferring delivery slots.
-
Electrification book-to-bill ratio and segment EBITDA margin. Electrification delivered a book-to-bill ratio of roughly 1.7 times alongside an 18.4% segment EBITDA margin in the second quarter of 2026.25 If book-to-bill normalizes toward 1.0 times while margins remain resilient, the trend points to a standard digestion cycle. If book-to-bill and operating margins compress in tandem, it signals that incoming global manufacturing capacity is eroding pricing leverage.
-
Power services organic growth. Power services expanded 12% organically in the second quarter of 2026.25 This metric serves as the definitive test of the installed-base moat across an entire cycle. If contractual service revenue continues to compound even after cyclical equipment orders plateau, the secular compounding thesis holds. If service revenue slows in tandem with equipment orders, it signals that fleet utilization is softening, echoing the vulnerabilities that triggered the 2016–2018 downturn.
These three indicators resolve the core uncertainties that define the investment case, setting up the concluding examination of GE Vernova's systemic role in the global energy landscape.
XII. Epilogue: Industrial America's Rebirth & The Energy Trilemma (10–15 min)
Back to the Trilemma
Energy policy has always had to navigate a structural trilemma: balancing electricity that is sustainable, reliable, and affordable. For nearly two decades, Western policy prioritized decarbonization, and capital markets followed. Regulators subsidized wind and solar additions, utilities accelerated coal plant retirements, and natural gas was widely treated as a bridge fuel destined for managed decline. GE's 2022 corporate identity—complete with its verdant branding and a corporate address in Cambridge—reflected the clean-energy consensus of that period.18 19
Then energy security reasserted itself, electricity consumption turned upward after nearly two decades of flat demand,4 and the largest new buyers of power emerged as technology companies requiring firm, round-the-clock baseload generation. Reliability and cost returned to equal footing with sustainability. GE Vernova's portfolio maps directly across that trilemma: heavy-duty gas turbines delivering dispatchable power today, high-voltage grid equipment connecting disparate regional resources, an onshore wind business resized for modest profitability at lower volumes, and small modular nuclear reactors targeting commercial deployment at Darlington in late 2029.35 The company's primary strategic advantage is fuel neutrality: it does not have to gamble on which clean or thermal power technology prevails. Its corresponding vulnerability is political fragmentation, as each operating division relies on a distinct, shifting regulatory coalition.
The Full Circle
In September 1882, six Jumbo dynamos at Pearl Street Station began sending current to illuminate roughly 400 lamps in lower Manhattan.6 In 2026, an assembly plant in Greenville, South Carolina, is scaling toward an annualized run rate of 20 gigawatts of gas turbines—equipment capable of powering tens of millions of homes.5 The sprawling conglomerate that linked those two eras no longer exists, and the standalone energy business that emerged from it is simpler, more operationally disciplined, and far more valuable than public markets contemplated during the depths of 2018.
The coming decade will determine whether this performance represents an enduring industrial operating model or another turn in the same capital-goods cycle that built and eventually crippled the legacy enterprise. The severe demand-forecasting errors of 2018 and the protracted offshore wind liabilities of recent years counsel analytical humility. Conversely, the realized pricing gains, multi-year backlog visibility, and customer prepayments of 2024–2026 indicate that operational discipline has taken hold. Thomas Edison's enterprise was established to generate electric power. Nearly a century and a half later, its successor remains anchored to that foundational mandate—leaving investors to watch how much of its current ascent reflects repeatable operational execution, and how much stems from an extraordinary global demand wave.
References
-
GE Vernova completes spin-off and begins trading on the New York Stock Exchange — GE Vernova, 2024-04-02 ↩↩↩↩↩↩↩
-
GE Vernova (GEV) Market Cap & Net Worth — StockAnalysis, 2026-09-23 ↩↩↩
-
New GE chief slashes dividend as US reviews $22 billion power writedown — Washington Examiner, 2018-10-30 ↩↩↩
-
After more than a decade of little change, U.S. electricity consumption is rising again — U.S. Energy Information Administration, 2025-05-13 ↩↩↩
-
GE Vernova reports second quarter 2026 financial results and raises 2026 financial guidance — GE Vernova, 2026-07-22 ↩↩↩↩↩↩↩↩
-
Milestones: Pearl Street Station, 1882 — Engineering and Technology History Wiki (IEEE) ↩↩↩
-
1,093 Light Bulb Moments: The Many Inventions From The Wizard of Menlo Park — GE News ↩↩
-
Curtis 5000-kW Vertical Turbine — ASME Engineering History Landmarks ↩↩
-
Belle Isle Gas Turbine — ASME Engineering History Landmarks ↩↩
-
GE Completes Acquisition of Alstom Power and Grid Businesses — GE, 2015-11-02 ↩↩↩↩
-
Financial and Gas Turbine Blade Troubles Plague GE Power — POWER Magazine, 2019 ↩↩↩↩↩↩↩↩↩↩↩↩↩
-
H. Lawrence Culp, Jr. Named Chairman and CEO of GE — GE, 2018-10-01 ↩↩
-
GE Vernova 2025 Investor Update Transcript — GE Vernova, 2025-12-09 ↩↩↩↩↩↩↩↩↩↩↩↩↩↩↩↩↩
-
Q3 2024 GE Vernova Inc Earnings Call Transcript — GE Vernova / LSEG StreetEvents, 2024-10-23 ↩↩↩↩↩↩↩↩↩↩↩↩↩↩↩↩↩
-
GE Plans to Form Three Public Companies Focused on Growth Sectors of Aviation, Healthcare, and Energy — GE, 2021-11-09 ↩↩↩
-
GE Unveils Brand Names for Three Planned Future Public Companies — GE Vernova, 2022-07-18 ↩↩
-
GE Vernova selects Cambridge, MA as its global headquarters — GE Vernova, 2022-12-15 ↩↩↩
-
Transition of Energies: A Timeline of GE Vernova's Spin-off — GE Vernova ↩↩
-
GE Vernova reports fourth quarter and full year 2024 financial results — GE Vernova, 2025-01-22 ↩↩↩↩
-
GE Vernova completes Prolec GE acquisition, accelerating Electrification segment growth trajectory — GE Vernova, 2026-02-02 ↩↩↩
-
Fitch upgrades GE Vernova rating to A- on margin expansion — Investing.com, 2026-08-12 ↩↩↩↩
-
GE Vernova reports fourth quarter and full year 2025 financial results; increasing outlook with Prolec GE acquisition — GE Vernova (Form 8-K Exhibit), 2026-01-28 ↩↩↩↩↩↩↩↩
-
GE Vernova Q2 2026 Earnings Press Release — GE Vernova (Form 8-K Exhibit), 2026-07-22 ↩↩↩↩↩↩↩↩↩↩↩↩↩↩↩↩↩
-
Earnings call transcript: GE Vernova Q2 2026 results miss EPS, stock slips — Investing.com, 2026-07-22 ↩↩↩↩↩↩↩↩↩↩↩
-
GE Vernova raises multi-year financial outlook, doubles dividend and increases buyback authorization — GE Vernova, 2025-12-09 ↩↩↩↩↩↩↩
-
GE Vernova suspects 'manufacturing deviation' was behind Vineyard Wind blade failure — Utility Dive, 2024-07 ↩↩↩↩
-
GE Vernova reports third quarter 2024 financial results — GE Vernova, 2024-10-23 ↩
-
Vineyard Wind sues to force GE Renewables to complete work on 800-MW offshore project — Utility Dive, 2026-04 ↩↩↩↩
-
Construction of Vineyard Wind 1 Completed — Offshore Wind (offshorewind.biz), 2026-03-16 ↩↩↩
-
GE Vernova's Pensacola energy surge: Over 2.7 GW of U.S.-built turbines fuel SunZia build out and U.S. wind farm upgrades — GE Vernova, 2025-03-27 ↩
-
GE Vernova raises multi-year financial outlook, initiates dividend and authorizes buyback — GE Vernova, 2024-12-10 ↩↩↩
-
Canada Approves First Grid-Scale SMR Construction at Darlington — POWER Magazine, 2025-04 ↩↩↩
-
Leading three manufacturers providing two-thirds of turbines for gas-fired power plants under construction — Global Energy Monitor, 2024-08 ↩↩
-
Siemens snags massive government bailout amid deepening wind turbine woes — RenewEconomy, 2023-11-15 ↩↩
-
GE Vernova Inc. 2026 Proxy Statement (Form DEF 14A) — US Securities and Exchange Commission, 2026-04-02 ↩↩↩
 LinkedIn
 WhatsApp
 Reddit
 Hacker News
 Email
Email Kindle
 RSS Feed
 Spotify
 Apple Podcasts
 Amazon Music
 Audible
 YouTube