Cincinnati Financial: The Agent's Insurance Company
I. Introduction & Episode Roadmap
On the morning of January 7, 2025, the Santa Ana winds came down out of the canyons above Los Angeles at highway speed, and within hours the Palisades and Eaton fires had become the most expensive wildfire event in American insurance history. Sitting 2,200 miles away in Fairfield, Ohio, an insurer with roughly one percent of the national property-casualty market and almost no brand recognition outside the agencies that sell its policies watched its single largest catastrophe loss ever assemble itself in real time.
By the time the estimates settled, Cincinnati Financial's gross losses from those three weeks were $942 million — nearly four times the company's previous record catastrophe event, a December 2022 winter storm that cost $247 million.1 The first quarter of 2025 closed with a net loss of $90 million and a combined ratio of 113.3%, meaning the insurance operation paid out $1.13 for every dollar of premium it earned.2 For a company that had produced an underwriting profit in fourteen consecutive years and raised its dividend in sixty-five consecutive years, this was not a rounding error. It was a stress test.31
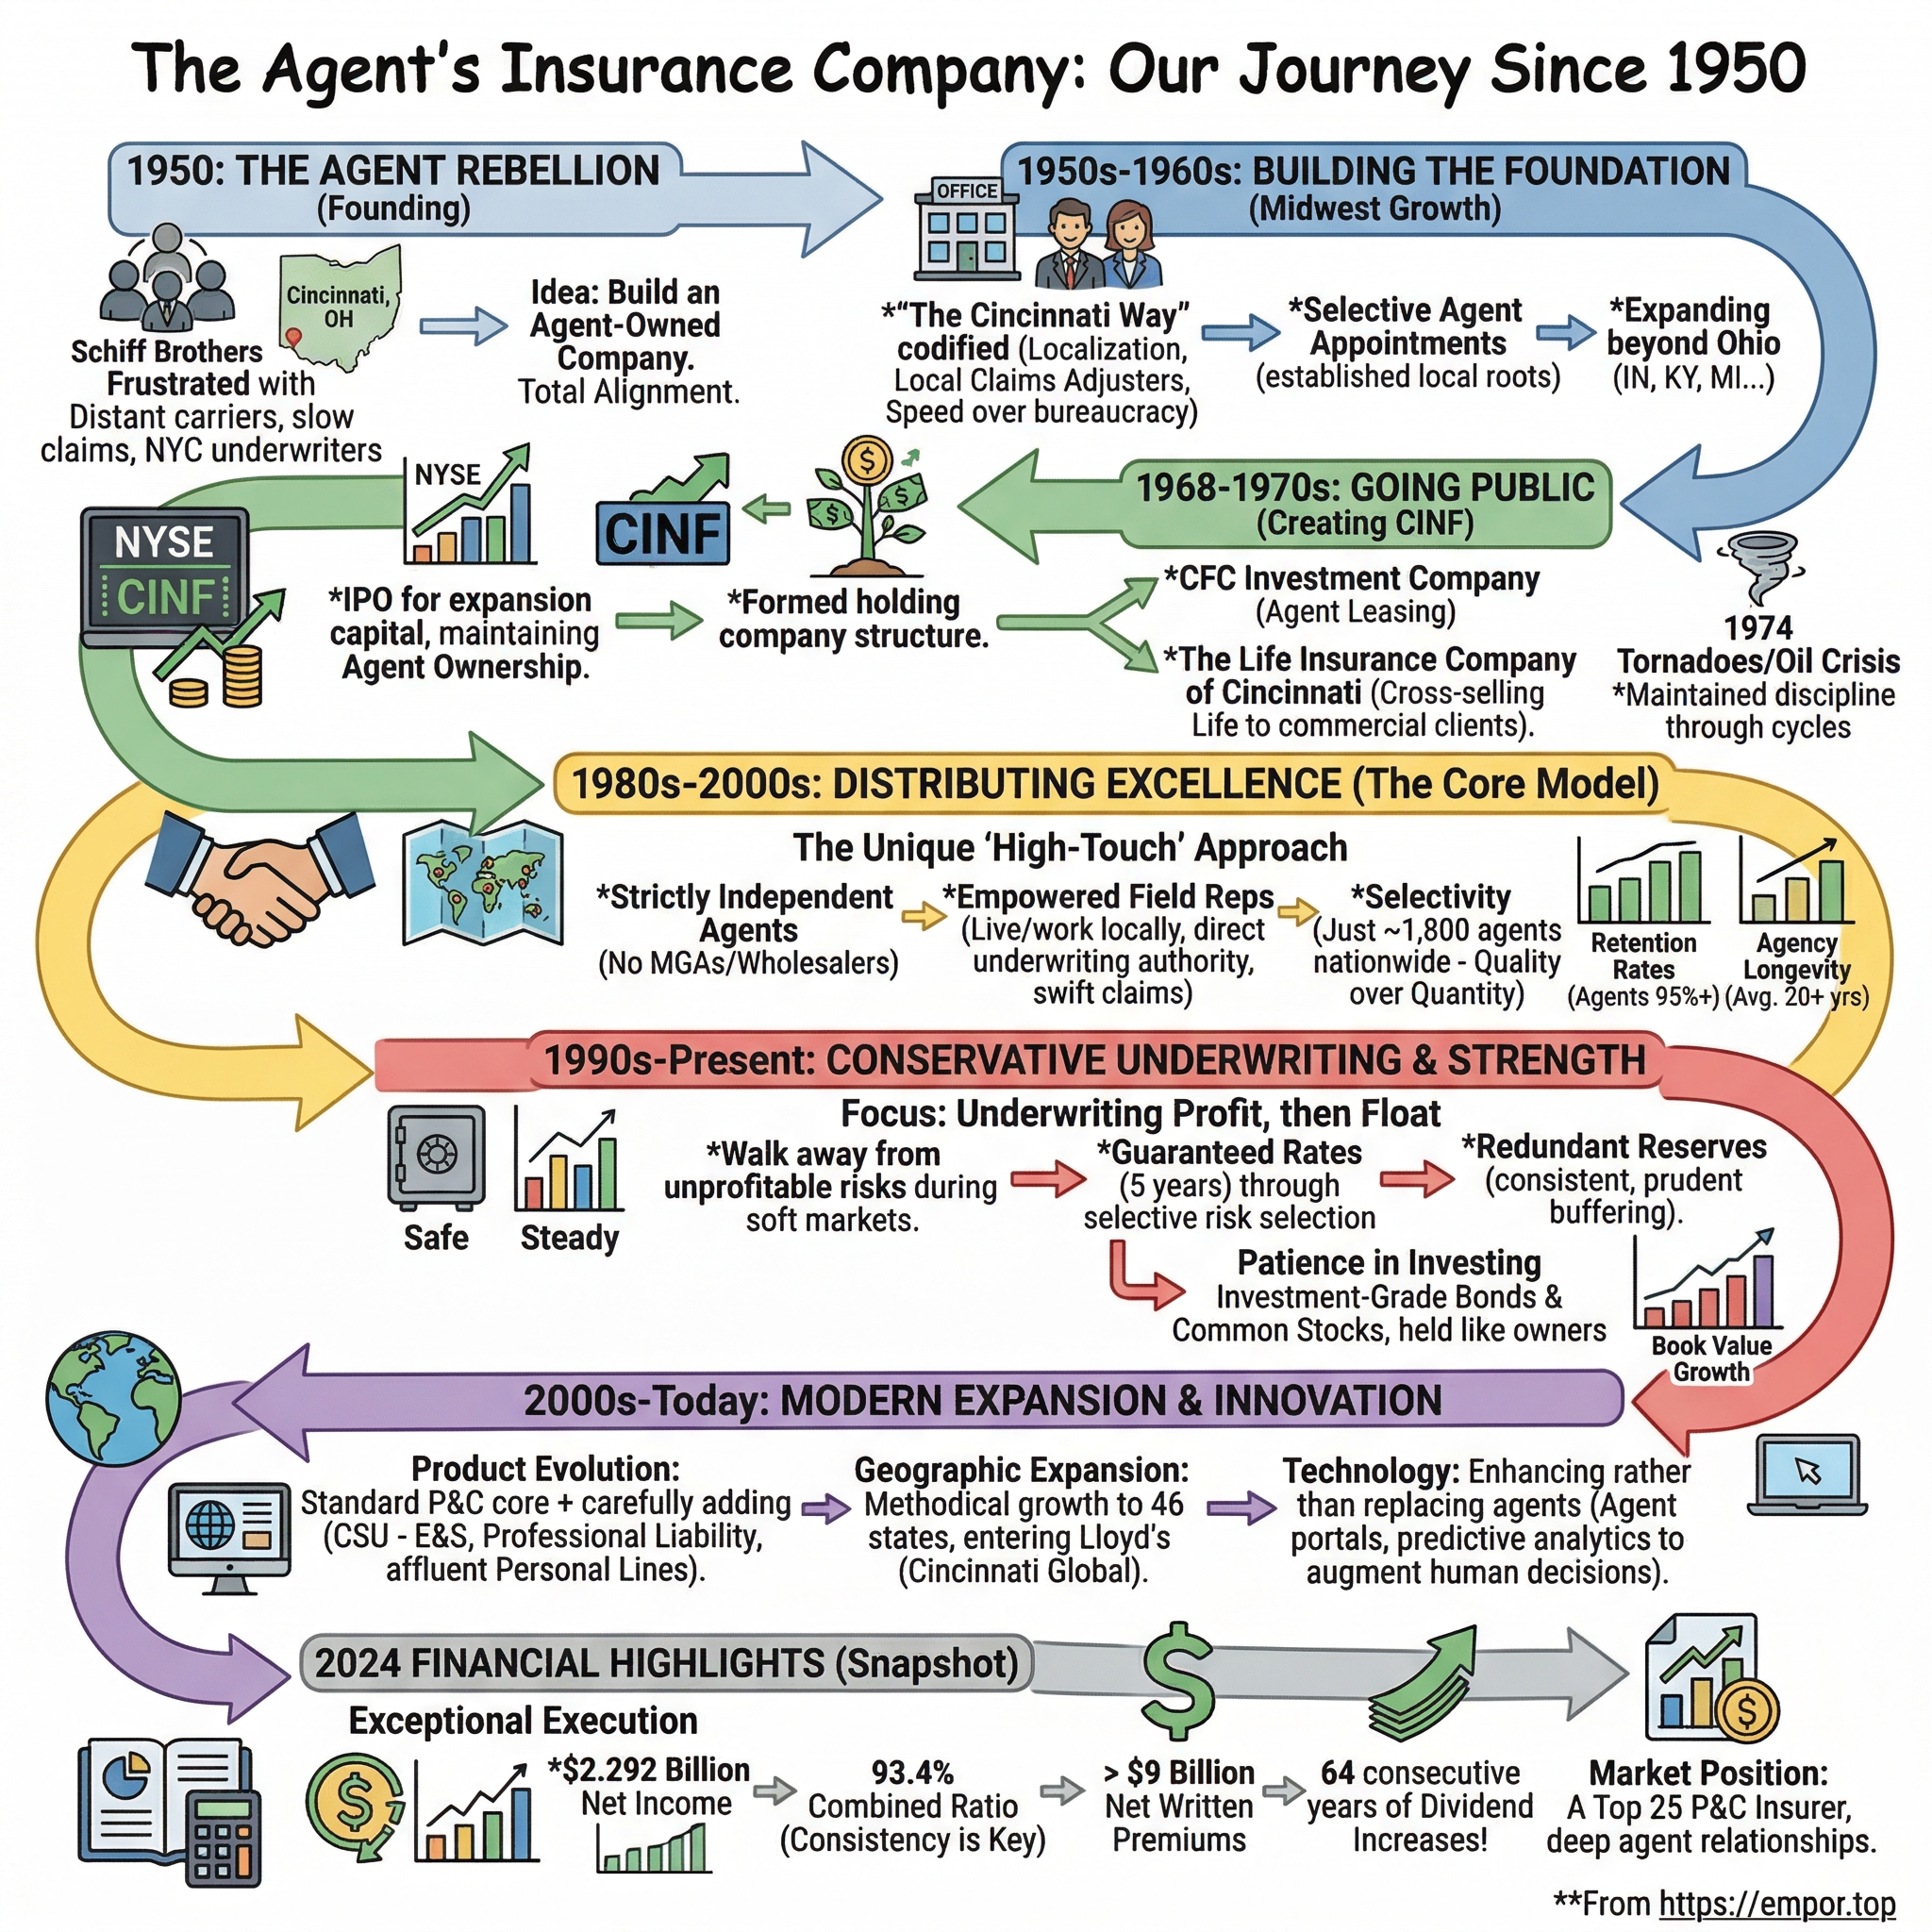
Here is what makes Cincinnati Financial worth an episode. The company was founded in 1950 by four independent insurance agents — John J. Schiff, Robert Schiff, Chester Field and Harry Turner — who were tired of being treated as disposable by the national carriers whose products they sold.4 Their fix was to build a carrier owned and run by agents, for agents. Seventy-six years later, that has not changed in any structural way. Cincinnati still sells every single policy through independent agencies. No direct-to-consumer channel. No captive agents. No managing general agents. In an industry where GEICO advertises during the Super Bowl and Progressive built a comparison-rating machine, Cincinnati distributes the way it did when Truman was president.
The scale that model produced is real but bounded. Full-year 2025 revenues were $12.631 billion, up 11%, with net income of $2.393 billion and net written premiums crossing $10 billion for the first time.3 The company employs 5,705 people, operates in 46 states through 2,292 agency relationships, and ranks among the 25 largest property-casualty insurers in the United States out of more than 2,000 competing groups.1 As of early September 2026, its market capitalization stood at roughly $26.4 billion.5
And here is the tension this episode exists to resolve. Through 2024 and most of 2025, the story wrote itself: a disciplined underwriter riding a hard market, compounding book value at a rate management's own scorecard put near 20% a year. Then the model started showing strain in places that had nothing to do with California. In the second quarter of 2026, Cincinnati's commercial lines segment — the flagship, the largest book, the part of the business that is supposed to be least cyclical because it is priced by humans who know the accounts — posted a combined ratio of 104.1%, up 11.2 points year over year.6 Only 4.9 of those points came from catastrophes.7 The rest came from somewhere else.
At the same time, the tide that had lifted everything went out. Chief Executive Steve Spray told analysts on the July 28, 2026 call that the property-casualty market was softening, that renewal price increases had stepped down from the first quarter, and that consolidated premium growth had slowed to 3%.7 Personal lines new business, which had doubled the segment's premium base in four years, was already declining — new business written premium in that segment fell 21% in 2025, before the softening even became a talking point.1
So: is 2025-2026 cyclical noise inside a durable machine, or the first real test in a decade of whether the agent model actually insulates anything?
The roadmap. We will compress the origin story into the business model it produced, then trace how that model became a distribution moat through the 1990s. The bulk of the episode sits on the modern five-segment machine and how each piece actually earns money. Then the investment portfolio — the thing that makes Cincinnati genuinely unlike almost any other public insurer. Then the London and reinsurance bets, the capital allocation record, current management's report card, the 2025-2026 stress test, the competitive war-game, and what a skeptic would attack.
One framing note before we start. Cincinnati publishes a metric called the value creation ratio, and it is the number management uses to judge itself. It combines the change in book value per share with dividends declared, expressed against beginning book value.1 It is a reasonable scorecard for a business whose earnings power is split between underwriting and a very large equity portfolio. It is also, as we will see, a number that flatters the company in bull markets and will do the opposite when equities turn. Keep it in mind.
 Subscribe on LinkedIn
II. Origins, Compressed: Agents Build Their Own Carrier (1950-1968)
Picture four men in a small building on Cincinnati's Central Parkway in the summer of 1950, pooling $200,000 in capital to start an insurance company they had no obvious business starting.8 None of them were carriers. All of them were independent agents — the middlemen who represent multiple insurers, place a client's business with whichever one offers the right coverage, and live or die on their local reputation.
Their grievance was specific and, in the industry of that era, universal. A national carrier would appoint an agent, build a book of business through them, and then — when a rate class turned unprofitable, or a state's loss experience deteriorated, or a home-office actuary redrew a map — pull out. The agent, who had sold those policies to neighbors, was left holding relationships with no product behind them. Claims decisions were made hundreds of miles away by people who had never met the policyholder. The agent absorbed the reputational damage; the carrier absorbed none of it.
The Schiff brothers — John, universally called Jack, and Robert — together with family friend Chester Field, decided the answer was a carrier "created, owned, and operated by insurance agents themselves."8 Harry Turner became the first president. The first policy went out on January 25, 1951.4 Gross premiums that first year were $92,000. Five years later they were $928,000.8
What matters is not the growth curve. It is what got hardwired into the operating model in those first two decades, because almost all of it is still there.
Agents as owners. The founders did not merely promise to treat agents well; they made agents shareholders. By the early 1990s, agents appointed by Cincinnati collectively owned roughly one-fifth of the company's equity.8 That is a structural alignment mechanism, not a slogan — an agent who owns the carrier's stock has an interest in the carrier's underwriting profit, which is a different interest from simply maximizing commission volume.
Local authority. Rather than centralizing underwriting and claims in a home office, Cincinnati pushed both out to people who lived in the same communities as the agencies they served. This was expensive. It was also the direct operational answer to the founding grievance: the person deciding whether to pay a claim was someone the agent could call, or drive to see.
Consistency through cycles. The founding promise was not to abandon a rate class or a territory when it turned bad. In insurance, that promise is only credible if the carrier's balance sheet can absorb the bad years — which is why financial conservatism and agent loyalty at Cincinnati have always been the same policy viewed from two angles, not two separate policies.
In 1968, the operating company reorganized under a holding company, Cincinnati Financial Corporation, and listed publicly.4 The stated reason was investment freedom: as a holding company, Cincinnati could deploy assets into categories that insurance-company regulation restricted, and "more profitably invest our assets to benefit both our insureds and our investors."9 That sentence is the seed of Section V. Turner became chairman; Jack Schiff became president, and chief executive in 1973.8
We are stopping here deliberately. The 1950s and 1960s growth mechanics are not where the analytical value sits. What matters is that the founding grievance became a set of operating commitments — agent ownership, local decision authority, cycle consistency, balance-sheet strength — and that those commitments are testable against the modern record. Everything from here forward tests them.
III. Building the Distribution Moat: Going Public Through the 1990s
Two years after the holding company was formed, Cincinnati did something that no ordinary insurer does. In 1970 it created CFC Investment Company — not to underwrite anything, but to buy and sell commercial real estate, and to provide low-cost loans, vehicle leases and equipment financing to its own agents and their customers.9
Read that again, because it is a strategic tell. A carrier with a strong balance sheet has two obvious uses for it: absorb more underwriting risk, or buy other carriers. Cincinnati chose a third — lend the balance sheet to the distribution channel. If an agency wanted to finance a fleet of cars, or a policyholder needed equipment leasing, Cincinnati could do it. Every one of those transactions deepened a relationship that was already producing insurance premium. Public stock offerings in 1971 and 1972 raised about $14 million, some of which retired debt, and the diversification continued: The Life Insurance Company of Cincinnati and Queen City Indemnity followed in the early 1970s.84 As Jack Schiff Jr. later put it, "the subsidiaries serve a common purpose: to sell insurance."9
The field model, and why it is expensive. By the mid-1980s, when Cincinnati moved into its Fairfield campus, the structural difference from a typical national carrier was clear.4 Today the company deploys 2,195 field associates who live in the communities its agents serve, plus 940 locally based field claims representatives who work out of their homes and show up in person.1 The field team is coordinated by field marketing representatives who carry actual underwriting authority for new commercial business, supported by specialists in claims, loss control, key accounts, personal lines, excess and surplus, machinery and equipment, management liability, surety, premium audit and life.1
Contrast that with a call-center claims model, where a policyholder photographs the damage, uploads it, and an algorithm and a remote adjuster settle it. The call-center model is cheaper per claim. It is almost certainly faster on simple auto glass. What it cannot do is put a human being in a small-business owner's parking lot the day after a fire, with authority, whom the agent knows by name. Cincinnati has bet seventy-six years that on complex risk, that difference is worth paying for.
Selectivity as the actual mechanism. Here is the part that is easy to miss. The independent agency channel is not proprietary to Cincinnati. In 2025, independent agencies placed 62% of all U.S. property-casualty premium and a dominant 87.7% of commercial lines premium.10 Nearly every standard-market commercial carrier of consequence sells through the same agencies. So the channel is not the moat. Something Cincinnati does within the channel has to be.
That something is share of wallet, and Cincinnati publishes the number. Across its reporting agency locations, Cincinnati holds an average 4.2% share of the standard-lines property-casualty insurance those agencies place.1 On its own, 4.2% sounds like nothing. But the company also discloses the distribution behind the average, and that is where the mechanism becomes visible:
- Agencies that have represented Cincinnati for more than 10 years: 7.4% share
- Six to 10 years: 3.2%
- Two to five years: 1.5%
- One year or less: 0.4%1
That is a compounding curve. A new appointment produces almost nothing. A decade-old appointment produces roughly eighteen times as much. The interpretation is straightforward and it is the most concrete evidence in the entire filing for the relationship thesis: whatever Cincinnati does — the field representative, the local claims authority, the profit-sharing economics — it takes years to work, and once it works it compounds. That is a real switching-cost-like dynamic, because the asset being built is the agency's accumulated experience of how Cincinnati behaves on a hard claim.
It also explains why the company's growth strategy is measured in agency appointments rather than advertising spend. Cincinnati made 420 new appointments in 2025 and ended the year with 2,292 agency relationships, up from 2,175.31 Each of those is an option that pays out in year six and beyond, not in year one.
Where the honesty has to come in. Two caveats belong right here, next to the claim, not in a distant risk section.
First, the curve is not proof of causation. Agencies that stay with a carrier for ten years are, by selection, the agencies that found Cincinnati useful. The disclosure cannot distinguish "Cincinnati earns share over time" from "Cincinnati keeps the agencies where it was always going to win." Both are probably true; the filing cannot separate them.
Second, this is a diffuse, not a concentrated, franchise. Cincinnati's largest single agency relationship accounted for approximately 0.5% of total property-casualty earned premiums in 2025, and no ownership group exceeded 8%.1 That is genuinely good risk management — no single broker consolidation can crater the book. It is also a reminder that Cincinnati has no irreplaceable customer. Every agency in that network can and does place business with Travelers, Chubb, The Hanover, Selective, Auto-Owners and Erie. Cincinnati is a preferred market, never an exclusive one.
Which brings us to the question of what, precisely, all that distribution is selling.
IV. How the Machine Makes Money Today: Segment Economics
Strip away seventy-six years of history and Cincinnati Financial is five businesses stapled to one very large investment portfolio. In 2025 the five wrote $10.442 billion of net written premium, split as follows: commercial lines $4.998 billion (47.9% of the total), personal lines $3.430 billion (32.8%), excess and surplus lines $729 million (7.0%), life insurance $360 million (3.4%), and the "Other" bucket containing Cincinnati Re at $591 million and Cincinnati Global at $334 million.1
That mix tells you where to spend your attention. Roughly four out of every five premium dollars come from standard commercial and personal lines. Everything else is diversification — real, but not yet load-bearing.
Commercial lines: the flagship, and the current problem
Commercial lines is what Cincinnati was built for. The book breaks down into commercial property ($1.655 billion), commercial casualty ($1.638 billion), commercial auto ($1.037 billion), workers' compensation ($244 million) and other commercial lines ($424 million).1 The customer is a small-to-midsize American business: a contractor, a manufacturer, a restaurant group, a regional distributor. Roughly 40% of commercial lines premium comes from accounts paying more than $100,000 a year, while accounts of $25,000 or less account for about 10%.1
Why is this the right business for an agent-mediated model? Because middle-market commercial risk has three properties that defeat algorithmic pricing. The risks are heterogeneous — no two machine shops carry the same exposure profile. Price transparency is low, because coverage terms differ enough that a headline premium is not comparable across carriers. And service intensity is high: a mid-size business having a bad year needs loss control advice, not a chatbot. Those three conditions are exactly where a field underwriter with local authority earns their cost.
For most of the last decade, the numbers supported the theory. Commercial lines produced a 91.1% combined ratio in 2025 — nine cents of underwriting profit per premium dollar.3 Then it inverted. The first quarter of 2026 came in at 98.6%, still profitable but eroding fast from 91.9% a year earlier.11 The second quarter came in at 104.1%, an 11.2-point deterioration.6
Here is the independent read, because this is where management's framing and the arithmetic need to be separated. Of that 11.2-point deterioration, 4.9 points came from higher catastrophe losses.7 That leaves roughly six points sourced elsewhere. Three contributors are identifiable from disclosure. The consolidated underwriting expense ratio rose 1.2 points in the quarter on higher commission expense and expense timing — though on a six-month basis it rose only 0.3 points, which suggests genuine timing noise rather than structural cost creep.7 Commercial casualty took $14 million of unfavorable reserve development from older accident years tied to a small number of insureds.7 And Chief Financial Officer Mike Sewell disclosed 30 new large losses above $2 million year-to-date totaling $112 million, against 26 losses for $101 million a year earlier — property large losses up about $20 million, with roughly $15 million of that from one loss that reached the working treaty.7
Management's characterization was that this is variability, not trend. Spray: "Every time we have a large loss in any line of business, we do an after-action review on it to see if there's any — if there's anything that could go towards a trend. I think what you're seeing here, again, is just inherent volatility."7 Sewell added the useful denominator: as a percentage of earned premium, large losses ran 2.2% in both years, "very consistent."7
The 2.2% stability is a real and non-trivial rebuttal — it is the right way to normalize the number. But note the epistemics. Management is declaring "not a trend" on two quarters of data, in a period when multiple peers have reported the same pattern, and when the analyst who raised it (Michael Phillips of Oppenheimer) explicitly noted "we've seen this now a couple of quarters in a row from other companies."7 The honest position is that the large-loss data is currently consistent with volatility and does not yet distinguish between the two hypotheses. That is a question the next two or three quarters answer, not this one.
Personal lines: doubled, then decelerated
The personal lines story is the one that changed most in the last five years. Net written premium went from $2.302 billion in 2023 to $3.430 billion in 2025 — and Spray told analysts that over the four years through 2025 the segment doubled.17 The engine was a genuinely brutal hard market in homeowners and personal auto, and Cincinnati's balance sheet let it write into that market while others retrenched.
The strategic pivot inside that growth is toward high-net-worth. Cincinnati brands its wealth offering Cincinnati Private Client, and it now represents approximately 60% of personal lines premium.1 The logic is the mirror image of the commercial argument: a $4 million home with a wine cellar, an art collection and a detached guest house is not a comparison-shopping product. It needs appraisal, scheduled personal property, and an agent who understands the household. That is a segment where the agent channel still wins.
Spray was direct about the trajectory on the July 2026 call: "It's a little over 60% of our business today — of our personal lines business. That's grown steadily over time. And I think that will continue to become a bigger and bigger part of our business."7
Now the disconfirming evidence, which belongs in this paragraph rather than a risk appendix. Personal lines new business written premium fell 21%, or $128 million, in 2025 — while renewal written premium rose $633 million, or 25%.1 In other words, the doubling was driven overwhelmingly by rate and retention on the existing book, not by winning new customers, and new-customer acquisition was already contracting a full year before management started using the word "softening." By the second quarter of 2026, segment premium growth had slowed to 1%, with management explicitly attributing it to lower new business premiums.67 The 2025 combined ratio was 103.6% — an underwriting loss, driven by seven points of additional catastrophe load.3
Spray's own answer, pressed by Josh Shanker of Bank of America on whether the growth trajectory had changed, was that the pressure sits in middle-market personal lines rather than high-net-worth, and that "you shouldn't think any differently about our growth of high net worth going forward."7 He also conceded that the visible slowdown partly reflects "our retrenching a bit in California post wildfire loss."7
So how should an investor hold this? The high-net-worth claim is credible but young. It has produced growth in a market where price was rising for everyone, and it has not been tested through a full soft cycle or a second catastrophe year. The claim that survives is narrow: Cincinnati has built a materially larger personal lines book, its mix has genuinely shifted toward a segment where agent value is higher, and that book has not yet demonstrated it can grow profitably when rate is not doing the work. Management itself is guiding to slower growth and calls it "profit first."7 Take them at their word on the priority, and price the growth accordingly.
Excess and surplus lines: the small engine that works
The excess and surplus lines segment — operated through The Cincinnati Specialty Underwriters Insurance Company, launched January 1, 2008 — is the cleanest-performing piece of the company.4 E&S exists to write risks that standard-market carriers won't touch at filed rates: unusual occupancies, difficult loss histories, coverage that needs to be custom-drafted. Because E&S carriers are not bound by state rate and form filings, they can price and structure freely. The trade is that the business is inherently more volatile.
Cincinnati's version has not been. Earned premiums grew 13% in each of 2024 and 2025 to $698 million, and the segment's combined ratio ran 90.6% in 2023, 94.0% in 2024 and 88.4% in 2025.1 Underwriting profit more than doubled in 2025 to $85 million.1 New business written premium rose 17% in 2025, and the segment grew net written premium 8% in the second quarter of 2026 with a 90.5% combined ratio while standard commercial was posting a loss.16
The strategic point is subtle and worth naming. Cincinnati did not enter E&S to chase a hot market. It entered because its own agents were placing E&S business with somebody else, and every such placement was a hole in the wallet-share machine described in Section III. The 10-K says it directly: the company operates an E&S brokerage so it can offer those products through the same agencies, and estimates roughly half of the E&S premium its agents place matches the business types Cincinnati targets.1 E&S is a channel-defense product that happens to be highly profitable.
The caution: E&S is 7% of premium. It cannot offset a six-point deterioration in a segment nearly seven times its size. And its pricing tailwind is fading — renewal price increases stepped down from the high-single-digit range in 2025 to the high end of the low-single-digit range by the second quarter of 2026.17 That deceleration is the leading indicator for this segment.
Life insurance: ballast
Cincinnati Life wrote $360 million of net written premium in 2025, essentially flat, of which term life was $245 million.1 In the second quarter of 2026 it grew net income 15% and term life earned premium 5%.7 It is a small, steady, profitable business whose real function is to generate long-duration liabilities that support long-duration investing, and to give agents another product to place. It is not a growth vector and this episode will not pretend otherwise.
The scoreboard
The cleanest way to see which lines are carrying the company right now is the second-quarter 2026 combined ratio by segment: commercial lines 104.1%, personal lines 99.9%, excess and surplus lines 90.5%, Cincinnati Re 87.6%, Cincinnati Global 110.8%, consolidated 100.8%.67 The specialty and reinsurance operations are subsidizing the core. That is the opposite of the historical pattern, and it is the single most important operating fact in the current story.
But headline earnings told a completely different tale that quarter — and understanding why requires looking at the other half of Cincinnati Financial.
V. The Investment Engine: Why Cincinnati Isn't a Normal Insurer
In the second quarter of 2026, Cincinnati Financial's insurance operations lost money. The company reported net income of $1.255 billion, or $8.05 per share.6
Both statements are true, and the gap between them is the most important thing to understand about this company.
Here is the mechanic in plain terms. Almost every property-casualty insurer invests its float — the premium collected today against claims paid later — predominantly in bonds. Bonds match the duration and predictability of insurance liabilities, and regulators and rating agencies prefer them. Cincinnati does something else. Roughly 40% of its approximately $32 billion investment portfolio sits in common stocks.12 For a P&C insurer of this size, that allocation is close to unique among public peers.
Since 2018, U.S. accounting rules have required that changes in the fair value of equity securities flow directly through the income statement, whether or not anything is sold. So Cincinnati's reported net income is, quarter to quarter, substantially a function of the stock market.
The second quarter of 2026 is the textbook illustration. Of that $1.255 billion of net income, $882 million after tax was the increase in fair value of equity securities still held — securities Cincinnati did not sell and had no intention of selling.7 Strip that out and non-GAAP operating income, which captures underwriting results plus recurring investment income, was $224 million — down from $311 million a year earlier.6 Headline earnings nearly doubled while underlying earnings power fell 28%.
Anyone reading a headline EPS number for this company without checking the operating line is reading the wrong number. That is not a criticism of the accounting; it is a permanent feature of how Cincinnati is built.
What the portfolio actually looks like. At June 30, 2026, the total investment portfolio carried approximately $8.6 billion of net appreciated value. The equity portfolio sat in a net gain position of $8.9 billion; the fixed-maturity portfolio was in a net loss position of $326 million, the residue of buying bonds before rates rose.7 The bond book is doing its own quiet work: second-quarter investment income rose 12% to $319 million net of expenses, bond interest income rose 14%, and the pretax average yield on fixed maturities reached 5.08%, up 15 basis points year over year, with new purchases going in at 5.66%.67 Over 2021-2025, pretax investment income compounded at 11.7% a year.1
That is the underappreciated part of the story. Rising rates have handed Cincinnati a durable, growing, low-volatility earnings stream that requires no underwriting skill at all. Cash flow from operations was $1.4 billion in the first half of 2026, up 29%.7 Every dollar of that gets reinvested at yields the company has not seen in fifteen years.
The value creation ratio, and what it hides. Management's primary scorecard is the value creation ratio: change in book value per share plus dividends declared, over beginning book value.1 The record:
- 2023: 19.5%
- 2024: 19.8%
- 2025: 18.8%
- Three-year average through 2025: 19.4%. Five-year average: 13.8%.1
Against a stated target of 10-13% annually over the next five years, that is a clear beat.1 Book value per share went from $77.06 at the end of 2023 to $89.11 at the end of 2024 to $102.35 at the end of 2025, and reached a record $108.64 at June 30, 2026, supporting nearly $17 billion of GAAP shareholders' equity.167
Now decompose it, because the decomposition is where the analysis lives. In 2025, of the 18.8% total, 9.1 points came from net income before investment gains — the actual insurance and recurring-income business. The remaining 9.7 points came from investment gains: 8.2 points from equities and 2.0 from fixed maturities, less 0.5 points of other items.1 In 2024, of 19.8%, 9.9 points came from operations and 9.6 from equity gains.1
Roughly half of Cincinnati's headline value creation over the last two years came from owning stocks during a bull market. That is not a criticism — it is a deliberate, disclosed, seventy-year-old strategy, and it is why the 1968 holding company was formed in the first place. But it means the VCR is not a measure of insurance skill. It is a blended measure, and the blend is currently flattering. The first half of 2026 makes the point in the other direction: VCR of 8.0%, versus 4.6% in the first half of 2025 — better, but well off the full-year pace, because the first quarter contributed only 0.2%.611
The falsification test management set for itself. Cincinnati publishes its own investment objective: a total return on the equity portfolio over a five-year period that exceeds the five-year total return of the S&P 500.1 Over the five years ended December 31, 2025, the equity portfolio compounded at 12.4% against 14.4% for the index. In 2025 alone, 15.7% against 17.9%.1
Management missed its own stated investment target, and disclosed the miss plainly in the 10-K. That deserves credit for transparency and a mark against the claim that the equity strategy is a source of alpha. The portfolio favors large-capitalization, high-quality, dividend-growing stocks with a slight value tilt — a defensible style that lagged a mega-cap-growth-led index.1 The honest conclusion: the equity allocation has been a source of book value compounding relative to a bond-only insurer, which is a real and material advantage, but it has not been a source of stock-picking outperformance. Those are different claims and only the first survives the evidence.
The tradeoff, named plainly. A 40% equity allocation means that in a sharp equity drawdown, Cincinnati's reported earnings and book value fall harder than a bond-heavy peer's. If that drawdown coincides with a severe catastrophe year — and equity markets and hurricanes are not correlated, but recessions and everything are — the company absorbs two hits to capital simultaneously. There is a five-year data point on relative performance: over the five years ended December 31, 2025, a $100 investment in CINF with dividends reinvested returned 111.5%, against 96.2% for the S&P 500 and 121.7% for the S&P Composite 1500 Property & Casualty Insurance Index.1 Cincinnati beat the market. It trailed its own industry.
That last comparison is the one that matters for an investor choosing among insurers, and it sets up the next question: what did Cincinnati do with the capital that produced those returns?
VI. The London and Reinsurance Bet: Cincinnati Re and Cincinnati Global
For sixty-five years, Cincinnati Financial's answer to "how do we diversify?" was essentially "we don't." Then, within four years, it did two things that were genuinely out of character: it built a reinsurance operation from scratch, and it bought a Lloyd's syndicate in London.
Cincinnati Re. The company had carried a small assumed-reinsurance line since the 1990s — the kind of thing that produces $11 million of premium and no strategic conversation. In 2015, Cincinnati launched Cincinnati Re as a dedicated operation and assembled a specialist underwriting team to price and manage assumed risk.4 The economics of assumed reinsurance are the inverse of primary insurance: instead of underwriting a policyholder, you underwrite another insurer's book, taking a slice of their losses in exchange for a slice of their premium. It requires actuarial and portfolio skill rather than distribution, which meant Cincinnati was competing on a dimension where its agent moat was worth exactly nothing.
Eleven years in, the record is good. Cincinnati Re wrote $591 million of net written premium in 2025, essentially flat against $597 million in 2024, and grew net written premium 16% in the second quarter of 2026 with an 87.6% combined ratio.16
Spray was refreshingly unwilling to dress this up as a compounding growth line. Asked by Gregory Peters of Raymond James why Cincinnati Re was growing when the market was competitive, he said: "that's obviously an assumed reinsurance operation, can be a little more opportunistic. They can — they're a little more nimble, can move in and out of different covers. And so their growth can also be a little more seasonal."7 That is management describing its own segment as episodic rather than compounding, which is both accurate and unusually candid.
Cincinnati Global. The one genuine acquisition in the modern history of this company was announced on October 12, 2018: MSP Underwriting Limited, purchased from Munich Re for £102 million (about $134 million) based on projected net asset value at closing.13 MSP was the managing agent of Lloyd's Syndicate 318, writing $162 million of net written premium in 2017, split roughly 62% direct-and-facultative property, 31% property binders and 7% aviation, with over 70% of the business sourced from the U.S. and Canada.13 The syndicate had earned underwriting profits in 20 of the prior 24 years.13 The deal closed in February 2019 and the business was rebranded Cincinnati Global.4
Then-CEO Steve Johnston framed it as channel-adjacent rather than empire-building: adding MSP "brings experienced underwriters who we believe will open opportunities for us to support our agents in new geographies."13
Seven years on, Cincinnati Global wrote $334 million of net written premium in 2025, up from $280 million in 2023 — real growth off a small base.1 It is also, right now, the worst-performing segment in the company: a 110.8% combined ratio in the second quarter of 2026 with premium growth of just 1%.67
The reasons are instructive, because they are exactly the risks you buy when you buy a Lloyd's syndicate. Sewell attributed the quarter's deterioration to two items: roughly $10 million net from a conflict-related loss in the Middle East, and about $7.5 million reserved for a contingency exposure connected to a European heat wave — event cancellation, in American terms.7 Spray corrected the record mid-call to specify the loss occurred in Saudi Arabia.7 Spray also noted that Cincinnati Global's near-flat growth reflects pricing discipline under pressure "primarily from larger property shared and layered direct and fac."7
That is a segment whose loss experience is driven by geopolitical conflict, European weather and global property cycles — genuinely uncorrelated with an Ohio middle-market commercial book, which is precisely the point of owning it, and genuinely volatile, which is the price.
Materiality check. Together Cincinnati Re and Cincinnati Global wrote $925 million in 2025 — 8.9% of total net written premium.1 They are not yet a second pillar. They are a hedge that costs something in earnings volatility and buys something in geographic and peril diversification. The reasonable expectation is that they continue to matter at roughly this weight, with Cincinnati Re's opportunism producing lumpy results and Cincinnati Global's Lloyd's exposure producing occasional quarters like this one.
The more revealing question is not what these two segments earn. It is what their existence says about how Cincinnati deploys capital at all.
VII. Capital Allocation and the M&A Record
Most insurance episodes contain a graveyard: the acquisition that destroyed a decade of underwriting profit, the reserve strengthening that revealed the deal diligence was fiction, the goodwill write-off. Cincinnati Financial has almost no graveyard, for a reason that is either admirable discipline or a failure of nerve depending on where you sit.
The philosophy, in numbers. At June 30, 2026, parent-company cash and marketable securities stood at $5.7 billion, and debt to total capital remained under 10%.7 For context: an insurance holding company's parent-level liquidity is what allows it to pay dividends, buy back stock and recapitalize subsidiaries after a catastrophe without selling investments into a bad market or issuing equity at a bad price. Cincinnati carries an unusually large one. It also carries almost no leverage, in an industry where 20-25% debt-to-capital is unremarkable.
That is a real and verifiable conservatism claim, and it survived the actual test: the largest catastrophe event in company history in January 2025 was absorbed without a capital raise, a dividend cut, or a suspension of buybacks.21
Buybacks: "maintenance plus." In the second quarter of 2026 Cincinnati repurchased approximately 1.3 million shares at an average price of $161.93, or $216 million, bringing the year-to-date total to 2.4 million shares.7 Sewell's own framing is worth quoting because it is unusually unglamorous: "It does feel maybe that's plus when I said maintenance plus. But within the last 5 years, we did have 1 year where we repurchased 3.7 million shares. So it is not outsize of anything that we've done in the past."7
Translation: Cincinnati buys back roughly enough stock to offset equity compensation dilution, plus a bit, and does not treat repurchase as a primary capital return lever. With 153.5 million shares outstanding, a 2.4 million-share half-year pace is roughly 1.6% annualized — meaningful but not transformative.5
The dividend, which is the real record. Through 2025, Cincinnati increased its annual cash dividend rate for 65 consecutive years — a streak the company states is matched by only seven other publicly traded U.S. companies.1 The 2025 declared dividend was $3.48 per share, up 7% from $3.24; the quarterly rate rose to $0.94 in 2026 from $0.87.36
This is one of the few genuinely unfalsifiable-in-the-good-sense claims in the story. A 65-year streak spans the 1970s inflation, the 1980s liability crisis, the 2001 reserve shocks, the 2008 financial crisis, 2020, and the 2025 wildfires. It is verifiable, rare, and it constrains management behavior in a way that markets can observe. You cannot fake it.
The M&A record, honestly assessed. Cincinnati has made essentially one material acquisition in its 76-year history, and it was small. The £102 million paid for MSP Underwriting equated to roughly 1% of Cincinnati's shareholders' equity at the time, and priced the business at approximately 0.8 times its then-current net written premium — a modest multiple for a Lloyd's specialty syndicate with a 20-of-24-year underwriting profit record.13 No evidence of overpayment surfaced in the filings and disclosures reviewed for this episode; there has been no impairment of that acquisition disclosed in the 2025 10-K.1
But "did they overpay" is the wrong test for a company that barely buys anything. The right test is the opposite one: is the absence of M&A disciplined compounding, or is it a missed opportunity?
The evidence cuts both ways and should be weighed rather than left side by side.
For the discipline case: over 2021-2025, Cincinnati grew net written premiums at an 11.4% compound annual rate against an estimated 8.8% for the industry, with a statutory combined ratio averaging 93.6% against an estimated 99.6% for the industry.1 That is organic growth well above the market at a cost of capital well below the market's underwriting cost. A company producing that does not obviously need acquisitions.
For the missed-opportunity case: the five-year total shareholder return through December 2025 was 111.5% for CINF, against 121.7% for the S&P Composite 1500 Property & Casualty Insurance Index.1 Over the same window, more acquisitive specialty compounders — W. R. Berkley and Markel are the usual comparisons — built businesses through both organic underwriting and portfolio construction. Cincinnati beat the broad market and trailed its own sector.
The calibrated conclusion: Cincinnati's capital allocation is genuinely conservative and genuinely low-risk, and the record contains no destroyed capital that this review surfaced in the filings and press disclosures examined. What it does not contain is evidence that the conservatism produced superior returns versus insurance peers over the last five years. The claim that survives is "Cincinnati has not destroyed capital and compounds book value steadily," not "Cincinnati's capital discipline is a source of outperformance." Those are different, and only the first is supported.
The people making those decisions deserve their own examination.
VIII. Management Today: Spray, Johnston, Sewell — Incentives and Credibility
Steve Spray did not come up through actuarial or finance. He started his career as a producer at an independent insurance agency — the customer side of Cincinnati's own business — before joining Cincinnati Insurance in 1991 as a Bowling Green State University graduate.14 He worked as an underwriter and as a field marketing representative, the role that puts a Cincinnati employee physically inside agencies with binding authority. From 2011 to 2016 he ran sales and marketing, including field underwriters and agency relationships. From 2016 to 2019 he led commercial lines. From 2019 to 2022 he was chief insurance officer of the property-casualty subsidiaries. He became president in 2022.14
On January 26, 2024, Cincinnati announced he would become chief executive officer effective May 4, 2024, with Steve Johnston moving to executive chairman.15 The board simultaneously expanded from 12 to 14 directors, adding Spray as a non-independent director and Peter Wu, an insurance analytics and artificial intelligence specialist, as an independent one.15
Two things stand out. First, this was telegraphed, not sudden — a two-year presidency preceding the CEO title, with the predecessor staying on as chairman rather than departing. Second, Cincinnati appointed a former agency producer to run the agents' insurance company. Whether that is symbolism or substance is testable, and we get to test it below.
Steve Johnston ran the company from 2011 to 2024, a period spanning the E&S buildout maturing, the Cincinnati Re launch, the MSP acquisition and the personal lines expansion. He now leads the board, maintains agency and investor relationships, and works with Spray on long-range strategy.15 The record reviewed here — the 2025 10-K, the 2026 proxy-related disclosures and recent earnings calls — surfaced no restatement, no material weakness in internal control over financial reporting, and no reversal of a previously announced capital-allocation strategy.1 That is a bounded negative finding about specific documents over a specific period, not a general assurance.
Mike Sewell, the chief financial officer, is the most analytically useful voice on these calls because he states a reserving philosophy and then behaves consistently with it. The stated approach: net reserves aimed at the upper half of the actuarially estimated range.7 In practice, for the first six months of 2026, Cincinnati added $981 million to property-casualty loss and loss expense reserves, of which $845 million was IBNR — incurred but not reported, the estimate for claims that exist but haven't been filed yet.7 That is a high IBNR proportion, which is what conservative reserving looks like mechanically.
The more telling moment came in the Q&A. Matt Palazola of Bloomberg Intelligence asked how much of the commercial casualty deterioration was large claims versus a changed view of loss costs. Spray's answer: "If you look at that ex cat accident year casualty loss ratio, we've held that pretty close to the pick we had at the end of the year 2025. And a lot of that is being prudent due to things that you're hearing from the industry and you're hearing from us, legal system abuse, just pressure on severity on that line... So I think it's — we're holding prudent reserves in that line of business until we have further data as it progresses."7
Unpack what that means. "Legal system abuse" is industry shorthand for social inflation — third-party litigation funding, aggressive plaintiff advertising, and jury verdicts scaling faster than economic inflation. Cincinnati is choosing not to lower its casualty loss pick even though the current data would arguably permit it, which means it is declining to book earnings it could have booked in a quarter it visibly needed them. Second-quarter operating income fell 28% year over year; releasing casualty reserves would have narrowed that.6 They didn't.
That is a credibility data point in management's favor, and it should be weighed as such. It is also worth noting the countervailing detail in the same disclosure: commercial casualty took $14 million of unfavorable development in the quarter from older accident years, and accident years prior to 2024 were unfavorable by $46 million in aggregate for the first half — against favorable development of $127 million for accident year 2025 and $42 million for 2024.7 The pattern — older years developing adversely, recent years favorably — is exactly what you would expect in an environment where social inflation is real and recent picks have been set conservatively in response. It is consistent with the stated philosophy rather than contradicting it.
The commission question: a live test of the alignment claim. The most important exchange on the July 2026 call had nothing to do with reserves. Michael Phillips asked, in effect, whether Cincinnati would use agent commissions as a lever — either cutting them to protect the expense ratio in a softening market, or raising them to buy growth.
Spray declined both. "By design and deliberately, we have a very, I think, very fair above-average profit sharing contract with our agents. And it is driven off of underwriting profit for a profitable business, they send our way. And we feel that when an agent writes profitable business with us, that we'll share more of that with them than many of our competitors. That, again, by design, it's our agency focus and aligns us with our agencies. So we feel like our compensation to agents is already the strongest, and we see no need for amending that."7
This is the founding grievance from 1950, restated in 2026, under direct pressure, in a quarter where the underwriting expense ratio had just risen 1.2 points on higher commission expense.7 Sewell's follow-up made the cost of that choice explicit: Cincinnati intends to hold non-commission expense growth below premium growth, and "as you see premiums slowing down, we're going to have to double down our efforts on watching our costs... So my job might be a little bit harder."7
The alignment claim held under the exact pressure that would break it. That is a genuine, dated, on-the-record test that the moat thesis passed. Note the boundary, though: it held for one quarter of a softening market. Commission structures typically come under real pressure two or three years into a soft cycle, not two quarters in.
Governance and skin in the game. The 2026 annual meeting on May 2 produced ordinary results: all 14 directors elected, roughly 96% support for the non-binding say-on-pay resolution, ratification of Deloitte & Touche as independent auditor for 2026, and approval of amended and restated articles of incorporation.16 A shareholder proposal to lower the threshold for calling a special meeting to 10% received support from approximately 27% of shares present and entitled to vote and failed — but the board's own amendment, lowering the threshold from 50% to 25%, passed.16 Read fairly, that is a board that pre-empted a governance criticism with a partial concession and won the vote. It is a minor friction point, not an activist campaign; no active activist position at Cincinnati Financial surfaced in the 2026 meeting disclosures and coverage reviewed here.
One honest observation on ownership: Cincinnati is a professionally managed public company today, not a family-controlled one. The Schiff name remains on the board in a non-executive capacity, but the founding families no longer control the business, and the chief executive's direct economic stake is modest relative to his authority — a normal condition for a large-cap American company and worth naming plainly rather than implying founder-level alignment that no longer exists.
Which sets up the question the whole episode has been building toward: when the model was actually stressed, what held?
IX. The 2025-2026 Stress Test: What Actually Broke, and What Didn't
This is where the thesis meets the evidence. Four claims have been made so far — the reinsurance and balance-sheet conservatism claim, the reserving discipline claim, the agent-alignment claim, and the claim that underwriting discipline insulates commercial lines from the cycle. Three of them survive. One does not survive intact.
Test one: the wildfires, and whether the reinsurance program worked
The January 7-28, 2025 California wildfires produced $942 million of gross losses for Cincinnati including Cincinnati Re and Cincinnati Global — nearly four times the company's second-worst event ever.1 Net of reinsurance, the calendar-year 2025 charge for that event was $448 million, of which personal lines absorbed $325 million, the Other segment (Cincinnati Re and Global) $122 million, and commercial lines just $1 million.1 Reinsurance recoveries related to the wildfires totaled $435 million as of December 31, 2025, excluding Cincinnati Re's own recoveries, plus $34 million estimated from the Cincinnati Re-only program effective June 1, 2024.1
The first quarter of 2025 closed with that $90 million net loss, a 113.3% combined ratio, 25 points of catastrophe load — roughly three times the ten-year first-quarter average — and a personal lines combined ratio of 151.3%.2 Book value per share fell $1.33 in the quarter and the value creation ratio went negative at -0.5%.2
The reinsurance program did what it was purchased to do: roughly half the gross loss was ceded. But the more interesting evidence is what Cincinnati did next, because a company's response to a loss reveals more than its recovery on one.
For 2026, Cincinnati raised its property catastrophe treaty limit from $1.5 billion to $2.0 billion, retaining the first $200 million of any event.1 It added a $150 million catastrophe bond through Skyline Re II Ltd., a Bermuda special purpose insurer, covering events between $1.0 billion and $1.8 billion with no reinstatement, maturing in January 2030.1 The ceded premium estimate rose to $108 million from $98 million.1 The net effect: maximum exposure to a $2.0 billion covered event fell from $803 million as of July 1, 2025 to $523 million as of January 1, 2026 — a 35% reduction in tail exposure, bought at roughly a 10% increase in reinsurance spend.1
That is management responding to a loss by buying more protection and paying for it, rather than by declaring the event a once-in-a-century outlier. It is the single most concrete piece of evidence in the story that the conservatism is behavioral rather than rhetorical.
The strategic retrenchment was equally real, and Spray described it without euphemism: "post California wildfire, we took a hard look at California and just took a different view of the risk for homeowners, specifically, aggregations, different terms, conditions, pricing."7 In plain English: fewer policies, tighter terms, higher prices, less concentration in the state. Cincinnati already routes higher-risk wildfire and hurricane exposure through its excess and surplus company where possible.1
Verdict on the reinsurance and conservatism claim: intact. The largest loss in company history was absorbed without capital raising, dividend interruption or buyback suspension, and the program was subsequently strengthened. The forward test is whether the $200 million retention holds through a second major event before the 2026 treaty resets.
Test two: commercial lines, and the claim that discipline insulates the cycle
This is the claim that does not survive intact.
The proposition, stated fairly, is that Cincinnati's local underwriting judgment and predictive analytics let it price middle-market commercial risk more accurately than competitors, and therefore hold profitability when the market softens. Through 2025 the evidence supported it: commercial lines produced a 91.1% combined ratio in a year when the industry's statutory combined ratio ran near 99.6%.31
Then: 98.6% in the first quarter of 2026, 104.1% in the second.116 Catastrophes explain 4.9 points of the second-quarter deterioration. They do not explain the rest.
The consolidated picture offers a genuine counterweight that deserves equal billing. Spray disclosed that the current accident year combined ratio before catastrophe losses for the first six months of 2026 was 87.8%, against 87.7% for the first six months of 2025 — essentially flat.7 That is the cleanest available measure of underlying underwriting quality, and it says the underwriting engine did not deteriorate at the consolidated level. The company also took $42 million of net favorable reserve development in the second quarter, benefiting the combined ratio by 1.7 points.7
So which is it? Both, and the resolution matters. The consolidated ex-catastrophe accident-year ratio held flat because excess and surplus lines, Cincinnati Re and personal lines improved enough to offset commercial's slippage. Commercial lines specifically — the largest segment, the one where the moat argument is strongest — went from comfortably profitable to unprofitable in a single quarter, on a mix of catastrophes, higher commission and expense timing, adverse older-year casualty development, and a modest uptick in large property losses.
Verdict: narrowed, not rejected. The evidence supports "Cincinnati underwrites better than the industry average over five-year periods" — the statutory combined ratio gap of roughly six points over 2021-2025 is large and consistent.1 It does not support "Cincinnati's commercial book is insulated from cycle and catastrophe pressure quarter to quarter." Nobody's is.
The KPI that resolves it: the commercial lines current-accident-year loss ratio excluding catastrophes, tracked over the next two to three quarters. If it stabilizes while the pricing cycle continues softening, the discipline claim is confirmed at the narrower scope. If it keeps climbing, the claim was cycle-dependent all along.
Test three: management telling you the tailwind is ending
The most valuable disconfirming evidence in this entire story came from management, unprompted, in its own prepared remarks.
Spray opened the July 2026 call by describing "maintaining pricing discipline in a softening property casualty insurance market."7 He then quantified it: renewal price increases in most lines were lower in the second quarter than the first; commercial lines and E&S averaged increases near the high end of the low-single-digit range, down from mid-single-digit in 2025 and high-single-digit for E&S in 2025; consolidated net written premium growth slowed to 3%, of which roughly two-thirds was rate and one-third exposure; personal lines new business declined.71
This belongs directly beside the personal lines growth story in Section IV and the commercial pricing story above, not in a risk appendix. The four-year doubling of personal lines and the 11.4% five-year premium CAGR were produced substantially by a hard market that management is now telling you has turned. Growth from here has to come from share gains within agencies — the 4.2%-to-7.4% wallet curve — rather than from rate. That is a slower, more grinding source of growth, and it is the one Cincinnati has always claimed as its edge. The next three years will demonstrate whether that claim was doing real work or was merely coincident with a rising tide.
Test four: the alignment claim
Covered in Section VIII and it held, in the specific sense that management declined to touch agent commissions under direct analyst pressure in a quarter when the expense ratio had deteriorated. Worth restating only as a verdict: passed, at one quarter of a soft market, with the real test still ahead.
The competitive question is what these results look like relative to everyone else fighting for the same agency shelf space.
X. Competitive Landscape, Porter's Five Forces, and the Distribution Question
Walk into a mid-sized independent agency in Ohio, Indiana or North Carolina and look at the carrier list on the wall. Travelers will be there. Chubb, probably. The Hanover and Selective, likely. Auto-Owners, if you are in the Midwest — private, mutual, and the carrier agents most often name as Cincinnati's philosophical twin. Erie Insurance, if you are in Pennsylvania or the mid-Atlantic — similarly agent-first, and growing faster in recent years. And Cincinnati.
That wall is the competitive arena. Cincinnati is not fighting for consumers. It is fighting for shelf space and share of wallet inside roughly 2,292 agency relationships, in 46 states.1
Rivalry: high. Every standard-market commercial carrier of consequence competes for the same agency relationships with broadly similar products. Differentiation happens on service, claims speed, coverage breadth, underwriting appetite and commission economics — not on a product feature a competitor cannot copy. Cincinnati's response is to be a top-quartile payer and to keep local authority, which raises its expense ratio relative to a centralized competitor. That is the trade.
Threat of new entrants: low at scale. Writing property-casualty insurance nationally requires regulatory approval in every state, an A.M. Best financial strength rating agents will accept, decades of loss data to price casualty risk, and enough capital to survive a bad catastrophe year. Insurtech entrants have repeatedly demonstrated that the software is the easy part and the underwriting is not. This barrier is real.
Buyer power: moderate, and specific. Cincinnati's "buyer" is the agent, not the policyholder. Agents have genuine power — they can move a book to a competitor. But the wallet-share curve shows the power is asymmetric over time: an agency ten years into a Cincinnati relationship has accumulated experience, systems familiarity and profit-sharing history that a new appointment would take years to rebuild. Cincinnati's diffuse book, with no single agency above 0.5% of earned premium, means it can lose any individual relationship without material damage.1
Supplier power: cyclical. Cincinnati's key supplier is the reinsurance market, and its power waxes and wanes with global capital. In a hard reinsurance market, retentions rise and ceded premium costs more; Cincinnati's 2026 renewal cost $108 million for the property catastrophe treaty, up from $98 million, though it bought more limit.1 Access to catastrophe bonds via Skyline Re II widens the supplier base slightly.1
Substitutes: the real threat, and it is proven. Here is the disconfirming evidence that a blanket "insurance is a relationship business" claim cannot survive. Over four decades, direct writers and captive-agent carriers — Progressive, GEICO, State Farm, Allstate — have taken structural share in personal auto specifically. The channel data confirms it: independent agencies placed 87.7% of commercial lines premium in 2025 but only 39.5% of personal lines.10 The channel is dominant where risk is complex and nearly absent where it is commoditized.
That is a decades-long, well-documented refutation of the general claim, and it explains Cincinnati's strategy rather than contradicting it. Cincinnati's personal lines pivot toward high-net-worth is a direct response — a retreat into the segment of personal lines where complexity, appraisal and service still defeat a comparison rater. Whether it works is an open question. What is not open is that the general "relationship moat" claim has already been falsified in personal auto over four decades.
The Helmer lens. Run Cincinnati through Hamilton Helmer's 7 Powers and most of them come back empty. There is no network effect — Cincinnati's policies do not become more valuable as more people buy them. There is no cornered resource. There is no meaningful scale economy; at roughly 1% of the national market, Cincinnati is a scale disadvantage case, not a scale case. Brand power exists with agents, not with consumers.
Two powers register. The first is counter-positioning via distribution economics: a direct writer or captive-agent carrier structurally cannot match Cincinnati's above-average, underwriting-profit-linked agent profit sharing without abandoning the model that makes it a direct writer. Progressive cannot pay Cincinnati's commissions. That is the textbook definition of a business model a competitor cannot copy without cannibalizing itself. The second is a modest process power in claims and local underwriting — 940 field claims representatives and 2,195 field associates who live in the territories, an operating structure built over decades that cannot be assembled quickly.1
But name the limits. Counter-positioning protects Cincinnati against direct writers, not against Travelers, Chubb, Auto-Owners, Erie, Selective or The Hanover, all of which use the same channel and can pay similar economics. Process power in claims is a quality edge, not an exclusivity edge. The moat is real, narrower than the rhetoric, and specific to one channel in one part of the market.
Scale, stated plainly. Cincinnati is one of the 25 largest U.S. property-casualty groups among more than 2,000 competitors, which sounds impressive until you translate it: roughly 1% national share.1 It cannot compete for the largest national accounts against Chubb or Travelers, which have the balance sheets, global claims networks and multinational programs those accounts require. Cincinnati's edge lives in middle-market and small commercial, where a local underwriter's judgment about a specific business still beats a national algorithm. That is a genuine niche, and it is bounded.
XI. Playbook: Business & Investing Lessons
Strip the specifics away and Cincinnati Financial offers a handful of transferable lessons, most of them uncomfortable.
Distribution loyalty is a real moat, and it has to be re-bought every year. The 4.2%-to-7.4% wallet curve is one of the better pieces of disclosed evidence anywhere that relationship depth compounds into economics.1 But notice what sustains it: above-average profit-sharing tied to underwriting results, and local people with authority. Both are ongoing costs, visible in the expense ratio, that a competitor could match by choosing to spend the same money. This is not a patent. It is a strategy that only works as long as management keeps paying for it — which is exactly why Spray's refusal to cut commissions in a softening market is the most load-bearing management decision in the recent record.7
Organic compounding is a legitimate alternative to the roll-up, with real costs. One acquisition in seventy-six years, at roughly 1% of equity, is close to the limit case.13 The upside is obvious: no integration disasters, no goodwill impairments, no dilution. The downside is equally real: no ability to buy a capability the company lacks, and a five-year total return that trailed the P&C index.1 Investors who value certainty over optionality get paid for that preference; investors who want compounding through capability acquisition should look elsewhere.
Running equities inside an insurer is a legible trade, if you read the right line. A 40% equity allocation buys long-run book value compounding and sells earnings predictability.12 The practical discipline for an investor: for any given quarter, non-GAAP operating income tells you about the business, and net income tells you about the stock market. The second quarter of 2026 — $1.255 billion of net income against $224 million of operating income, down 28% year over year — is the permanent illustration.6
Reserving conservatism shows up as a refusal, not an announcement. Any insurer will tell you it reserves prudently. The tell is behavioral: does the company decline to release reserves in a quarter where releasing them would help? Cincinnati held its commercial casualty loss pick flat in a quarter when operating income fell 28%, and said so on the call.76 Watch for that pattern in any insurer's disclosure. It is one of the few management-quality signals in this industry that is hard to fake and easy to observe.
"Boring" underwriting-first insurance can compound, but only under supervision. Fourteen consecutive years of underwriting profit and a 93.6% five-year statutory combined ratio against an industry near 99.6% is a genuine track record.31 It is also a record that says nothing about the fifteenth year. Discipline is a choice made quarterly by hundreds of underwriters, and it decays quietly under growth pressure. The combined ratio is not a description of a company's character. It is a measurement that has to be retaken.
And a meta-lesson: read the metric management chose. Cincinnati picked the value creation ratio as its scorecard, which is defensible for a company whose earnings are half investment-driven. But roughly half of recent VCR came from equity gains, and the company simultaneously missed its own stated objective of beating the S&P 500 with its equity portfolio over five years.1 The scorecard a company selects is itself information — about what it wants you to watch, and about what it would rather you not.
XII. Bear vs. Bull Case
Bear Case
The largest segment turned unprofitable, and catastrophes only explain part of it. Commercial lines went from a 91.1% combined ratio in 2025 to 104.1% in the second quarter of 2026, with only 4.9 points of the 11.2-point deterioration attributable to catastrophes.367 The remainder came from commission and expense timing, adverse development on pre-2024 casualty accident years totaling $46 million in the first half, and higher large-loss activity.7 Management calls the large-loss element volatility; two quarters of data cannot distinguish volatility from an early trend, and the same pattern has appeared at peers.7
Social inflation is unresolved by the company's own admission. Cincinnati is holding commercial casualty reserves flat because of "legal system abuse" and severity pressure.7 That is prudent, and it is also management saying it does not yet know where casualty loss costs settle. Roughly $1.638 billion of commercial casualty premium plus 89% of the E&S book sits in liability lines exposed to this.1
The pricing cycle has turned, and management said so first. Renewal increases decelerated across every major line between the first and second quarters of 2026; consolidated premium growth fell to 3%; personal lines new business had already fallen 21% in 2025.71 The 2021-2025 growth record was substantially rate-driven. That engine is switching off.
Personal auto share erosion is a four-decade, structural fact. Independent agencies place only 39.5% of personal lines premium versus 87.7% of commercial.10 The high-net-worth pivot is a sensible response to a losing structural position, not evidence that the position is winning.
Equity concentration cuts both ways. A 40% equity allocation means a sharp market drawdown hits reported earnings, book value, and rating-agency capital metrics at once — potentially simultaneously with a catastrophe year.12 Book value per share fell in the first quarter of 2025 and again in the first quarter of 2026 (to $101.60 from $102.35), and neither was a severe equity market.211
Catastrophe concentration is structural. California wildfire and Midwest convective storm exposure are recurring features, not one-offs; 2025 saw four separate events above $25 million of net losses beyond the wildfires.1 The California retrenchment reduces the tail and caps growth in the largest state economy in the country.
The activist's angle. A skeptical investor would press three points: why does a company with $5.7 billion of parent liquidity and sub-10% leverage repurchase only "maintenance plus"?7 Why is a 40% equity allocation the right use of insurance capital when the portfolio has trailed its own benchmark over five years?1 And why has a company with a demonstrable underwriting edge in one channel never used its balance sheet to acquire capability, when the sector index outperformed it over the same five years?1 None of these are scandals. All three are legitimate questions about whether conservatism has tipped into under-optimization.
Bull Case
The reinsurance program and the balance sheet passed a real test with real capital. The largest catastrophe in company history — $942 million gross — was absorbed with roughly half ceded, no capital raise, no dividend interruption, and a subsequent decision to buy 35% less tail exposure at a 10% higher cost.1 That is not a philosophy statement. It is a demonstrated behavior with a date on it.
The wallet-share mechanism is disclosed, quantified, and compounding. 0.4% share in year one rising to 7.4% beyond year ten is unusually concrete evidence for a relationship moat, and it means the 420 agency appointments made in 2025 are options that mature later.13
Excess and surplus lines is genuinely good and genuinely growing. Combined ratios of 90.6%, 94.0% and 88.4% over 2023-2025, 13% earned premium growth in each of the last two years, 17% new business growth in 2025, and 90.5% in the second quarter of 2026 while standard commercial lost money.16 It is small, but it is working.
Agent alignment survived direct pressure. Asked point-blank whether commissions would be cut as margins compressed, Spray declined and defended above-average profit sharing as core to the model.7 The alternative — protecting a quarter's expense ratio at the cost of the channel relationship — is exactly what the founders left their carriers over in 1950.
Sixty-five years of dividend increases and sub-10% leverage across every crisis of the modern era. Matched by only seven other U.S. public companies, per the company's own count.1 This is a verifiable, unfakeable record of financial conservatism.
The investment income tailwind is durable and underrated. Bond interest income up 14%, portfolio yield at 5.08% with new money going in at 5.66%, operating cash flow up 29% to $1.4 billion in the first half.7 This grows regardless of the underwriting cycle and requires no underwriting skill — a real earnings floor beneath a softening market.
Management is not chasing growth into a soft market. Premium growth decelerating to 3% while the company describes its stance as "profit first" is what discipline looks like from the outside.7 The uncomfortable version of the bull case is that a shrinking growth rate is the evidence.
XIII. Risk Radar
Reserve and social inflation risk. Commercial casualty loss costs are rising industry-wide from third-party litigation funding and expanding jury verdicts. The mechanism at Cincinnati is direct: $1.638 billion of commercial casualty premium and an E&S book that is 89% liability coverages.1 Management is holding reserves flat rather than releasing, which protects credibility but signals the company does not consider the risk resolved.7 Watch prior-year development on accident years 2019 through 2023 — the years written before the industry recognized the severity trend.
Cycle-timing risk. The mechanism is straightforward and does not require anything to go wrong: if premium growth slows while underwriters feel pressure to hit growth targets, price adequacy erodes and the combined ratio follows with a lag of one to two years. Cincinnati's stated posture is profit-first, and its actual second-quarter behavior — 3% growth, declining new business — is consistent with that.7 The risk is that the posture changes if slow growth persists for three or four quarters.
Equity-market correlation risk. This is the one genuinely unusual risk in Cincinnati's profile. A 40% equity allocation means an equity drawdown simultaneously reduces reported net income, book value, and the capital that supports underwriting capacity.12 In a year that combines a market correction with a major catastrophe, those hits arrive together. Most P&C peers do not carry this correlation because their portfolios are bond-heavy.
Catastrophe and climate concentration. California wildfire and Midwest convective storm exposure are structural to the book's geography — Ohio alone was $1.233 billion of earned premium in 2025, and the ten largest states produced 50.2% of consolidated property-casualty earned premium.1 The 2026 reinsurance program cuts the tail materially, but retention on the first $200 million of any event is unchanged, and frequency of mid-sized events is what actually grinds a combined ratio down.1
Scale and national-account limitation. At roughly 1% share, Cincinnati structurally cannot pursue the largest commercial accounts.1 This is not a risk that materializes suddenly; it is a permanent ceiling on the addressable market, which makes agency-appointment growth and wallet-share deepening the only available growth levers over the long run.
Key personnel. Chief Claims Officer Marc Schambow, who has spent nearly 40 years at Cincinnati and led claims since 2020, announced his retirement effective January 2027, with Todd McMillan — a nearly 30-year industry veteran most recently head of liability claims at Safety National, with prior roles at The Hartford and GEICO — assuming responsibility for headquarters and field claims.17 Claims quality is central to the agent-relationship thesis, which makes this worth watching. It is a planned transition to an experienced outside hire, not a strategic event.
Risks that do not belong on this list, and are omitted deliberately: generic AI-disruption narratives (middle-market commercial underwriting is where algorithmic pricing is weakest, and Cincinnati has added an AI-focused independent director), supply chain exposure, and refinancing risk at a company with sub-10% debt to capital and $5.7 billion of parent liquidity.7
XIV. What to Watch Next
Three things, and only three.
First and most important: the commercial lines current-accident-year loss ratio excluding catastrophes. Third-quarter 2026 results, expected in late October, are the first clean read on whether the second quarter's deterioration continued through hurricane season or began to stabilize. This is the KPI that resolves the central question of the episode. If it flattens while the pricing cycle keeps softening, the underwriting-discipline claim is confirmed at its narrower scope. If it keeps climbing, the claim was a hard-market artifact.
Second: excess and surplus lines renewal pricing. E&S renewal increases have already decelerated from the high-single-digit range in 2025 to the high end of the low-single-digit range by mid-2026.17 E&S is Cincinnati's best-performing growth engine and the segment most exposed to specialty market softening, because E&S pricing turns faster than standard-market pricing in both directions. Continued deceleration would be a leading indicator that the last profitable growth vector is compressing.
Third, and secondary: the value creation ratio's operating component. Not the headline VCR, which is a market-beta reading, but the "net income before investment gains" contribution within it — 9.1% in 2025, 9.9% in 2024.1 That line isolates what the insurance company earns without the stock market's help, and it is the honest measure of whether the underwriting franchise is still doing its job.
The claims-leadership transition announced September 2, 2026 is worth a note but not a KPI.17 It is a planned handoff to an experienced successor, disclosed four months ahead.
XV. Epilogue: Seventy-Six Years of Betting on the Agent
Four independent agents put $200,000 into a company in 1950 because they were tired of carriers who abandoned them when the numbers turned.8 The whole architecture — agents as shareholders, local claims authority, above-average profit sharing, a balance sheet conservative enough to keep promises through bad years — was designed backward from that grievance. Seventy-six years later, the architecture is intact and the company is one of the 25 largest property-casualty insurers in the country, still selling every policy through the same channel.1
What 2025 and 2026 actually established, weighed rather than listed:
The defenses held. The reinsurance program absorbed the largest catastrophe event in company history and the company then bought more protection.1 Reserving discipline held — management declined to release casualty reserves in a quarter it needed the earnings.7 Agent economics held under direct analyst pressure to cut them.7 The dividend streak reached sixty-five years.1 These are not claims. They are dated behaviors, and they are the substance of what "conservative" means at this company.
The growth assumptions did not. The four-year doubling of personal lines was substantially a hard-market phenomenon, and new business in that segment had already begun contracting in 2025 while the headline premium was still compounding.1 Commercial lines slipped into an underwriting loss on a mix of catastrophes, expense timing and older-year casualty development.67 Management itself now describes the market as softening.7 The strategy is being revised in real time by the people running it, in public, which is at least the right way to do it.
The honest resolution is neither "the model is broken" nor "this is noise." It is that Cincinnati Financial has demonstrated, with real capital, that its defensive commitments are behavioral rather than promotional — and has not yet demonstrated that its offensive engine works when the market is not doing the work for it. The last time this company had to grow through a genuinely soft commercial market with no rate tailwind, the industry looked different, the channel looked different, and the personal auto business had not yet been hollowed out by direct writers.
Which leaves a clean question for the years ahead. Cincinnati's whole thesis is that a carrier which never abandons its distribution channel earns something in return — a rising share of each agency's wallet that compounds over decades and shows up in the combined ratio when it matters. Every one of those years has, until now, been a year when either the market was hard or the equity portfolio was rising, and usually both.
The market has turned. The test is running now.
References
-
Cincinnati Financial Corp — Form 10-K, FY2025 (SEC EDGAR) ↩↩↩↩↩↩↩↩↩↩↩↩↩↩↩↩↩↩↩↩↩↩↩↩↩↩↩↩↩↩↩↩↩↩↩↩↩↩↩↩↩↩↩↩↩↩↩↩↩↩↩↩↩↩↩↩↩↩↩↩↩↩↩↩↩↩↩↩↩↩↩↩↩↩↩↩↩↩↩↩↩↩↩
-
Cincinnati Financial Reports First-Quarter 2025 Results — PR Newswire, 2025-04-28 ↩↩↩↩↩
-
Cincinnati Financial Corp — Fourth-Quarter and Full-Year 2025 Results, Form 8-K Exhibit 99.1 (SEC EDGAR), 2026-02-09 ↩↩↩↩↩↩↩↩↩↩
-
Cincinnati Financial Corporation (CINF) Stock Overview — Stock Analysis, accessed 2026-09-02 ↩↩
-
Cincinnati Financial Reports Second-Quarter 2026 Results — PR Newswire, 2026-07-27 ↩↩↩↩↩↩↩↩↩↩↩↩↩↩↩↩↩↩↩↩
-
Cincinnati Financial Corporation (CINF) Q2 2026 Earnings Call Transcript — Seeking Alpha, 2026-07-28 ↩↩↩↩↩↩↩↩↩↩↩↩↩↩↩↩↩↩↩↩↩↩↩↩↩↩↩↩↩↩↩↩↩↩↩↩↩↩↩↩↩↩↩↩↩↩↩↩↩↩↩↩↩↩↩↩↩↩↩↩↩↩
-
Cincinnati Financial Corporation — Company History — International Directory of Company Histories ↩↩↩↩↩↩↩
-
New Beginnings: Launching Cincinnati Financial Corporation — Cincinnati Insurance ↩↩↩
-
Big I: Independent Agencies' Market Share Up Slightly in 2025 — Insurance Journal, 2026-06-23 ↩↩↩
-
Cincinnati Financial Reports First-Quarter 2026 Results — PR Newswire, 2026-04-28 ↩↩↩↩
-
Cincinnati Financial Has Raised Its Dividend for 65 Straight Years — The Motley Fool, 2026-07-26 ↩↩↩↩
-
Cincinnati Financial to Acquire London Specialty Underwriter from Munich Re — Insurance Journal, 2018-10-12 ↩↩↩↩↩↩
-
Leading Ohio Insurance Carrier Appoints New CEO with Agent Experience — Ohio Insurance Agents, 2024 ↩↩
-
Cincinnati Financial Corporation Announces Executive Leadership Transition, Expands Board to 14, Appoints Two New Directors — PR Newswire, 2024-01-26 ↩↩↩
-
Cincinnati Financial shareholders endorse strategy but stop short on activism — Insurance Business ↩↩
-
People Moves: Cincinnati Insurance Chief Claims Officer Schambow to Retire, McMillan to Assume Responsibilities — Insurance Journal, 2026-09-02 ↩↩
 LinkedIn
 WhatsApp
 Reddit
 Hacker News
 Email
Email Kindle
 RSS Feed
 Spotify
 Apple Podcasts
 Amazon Music
 Audible
 YouTube