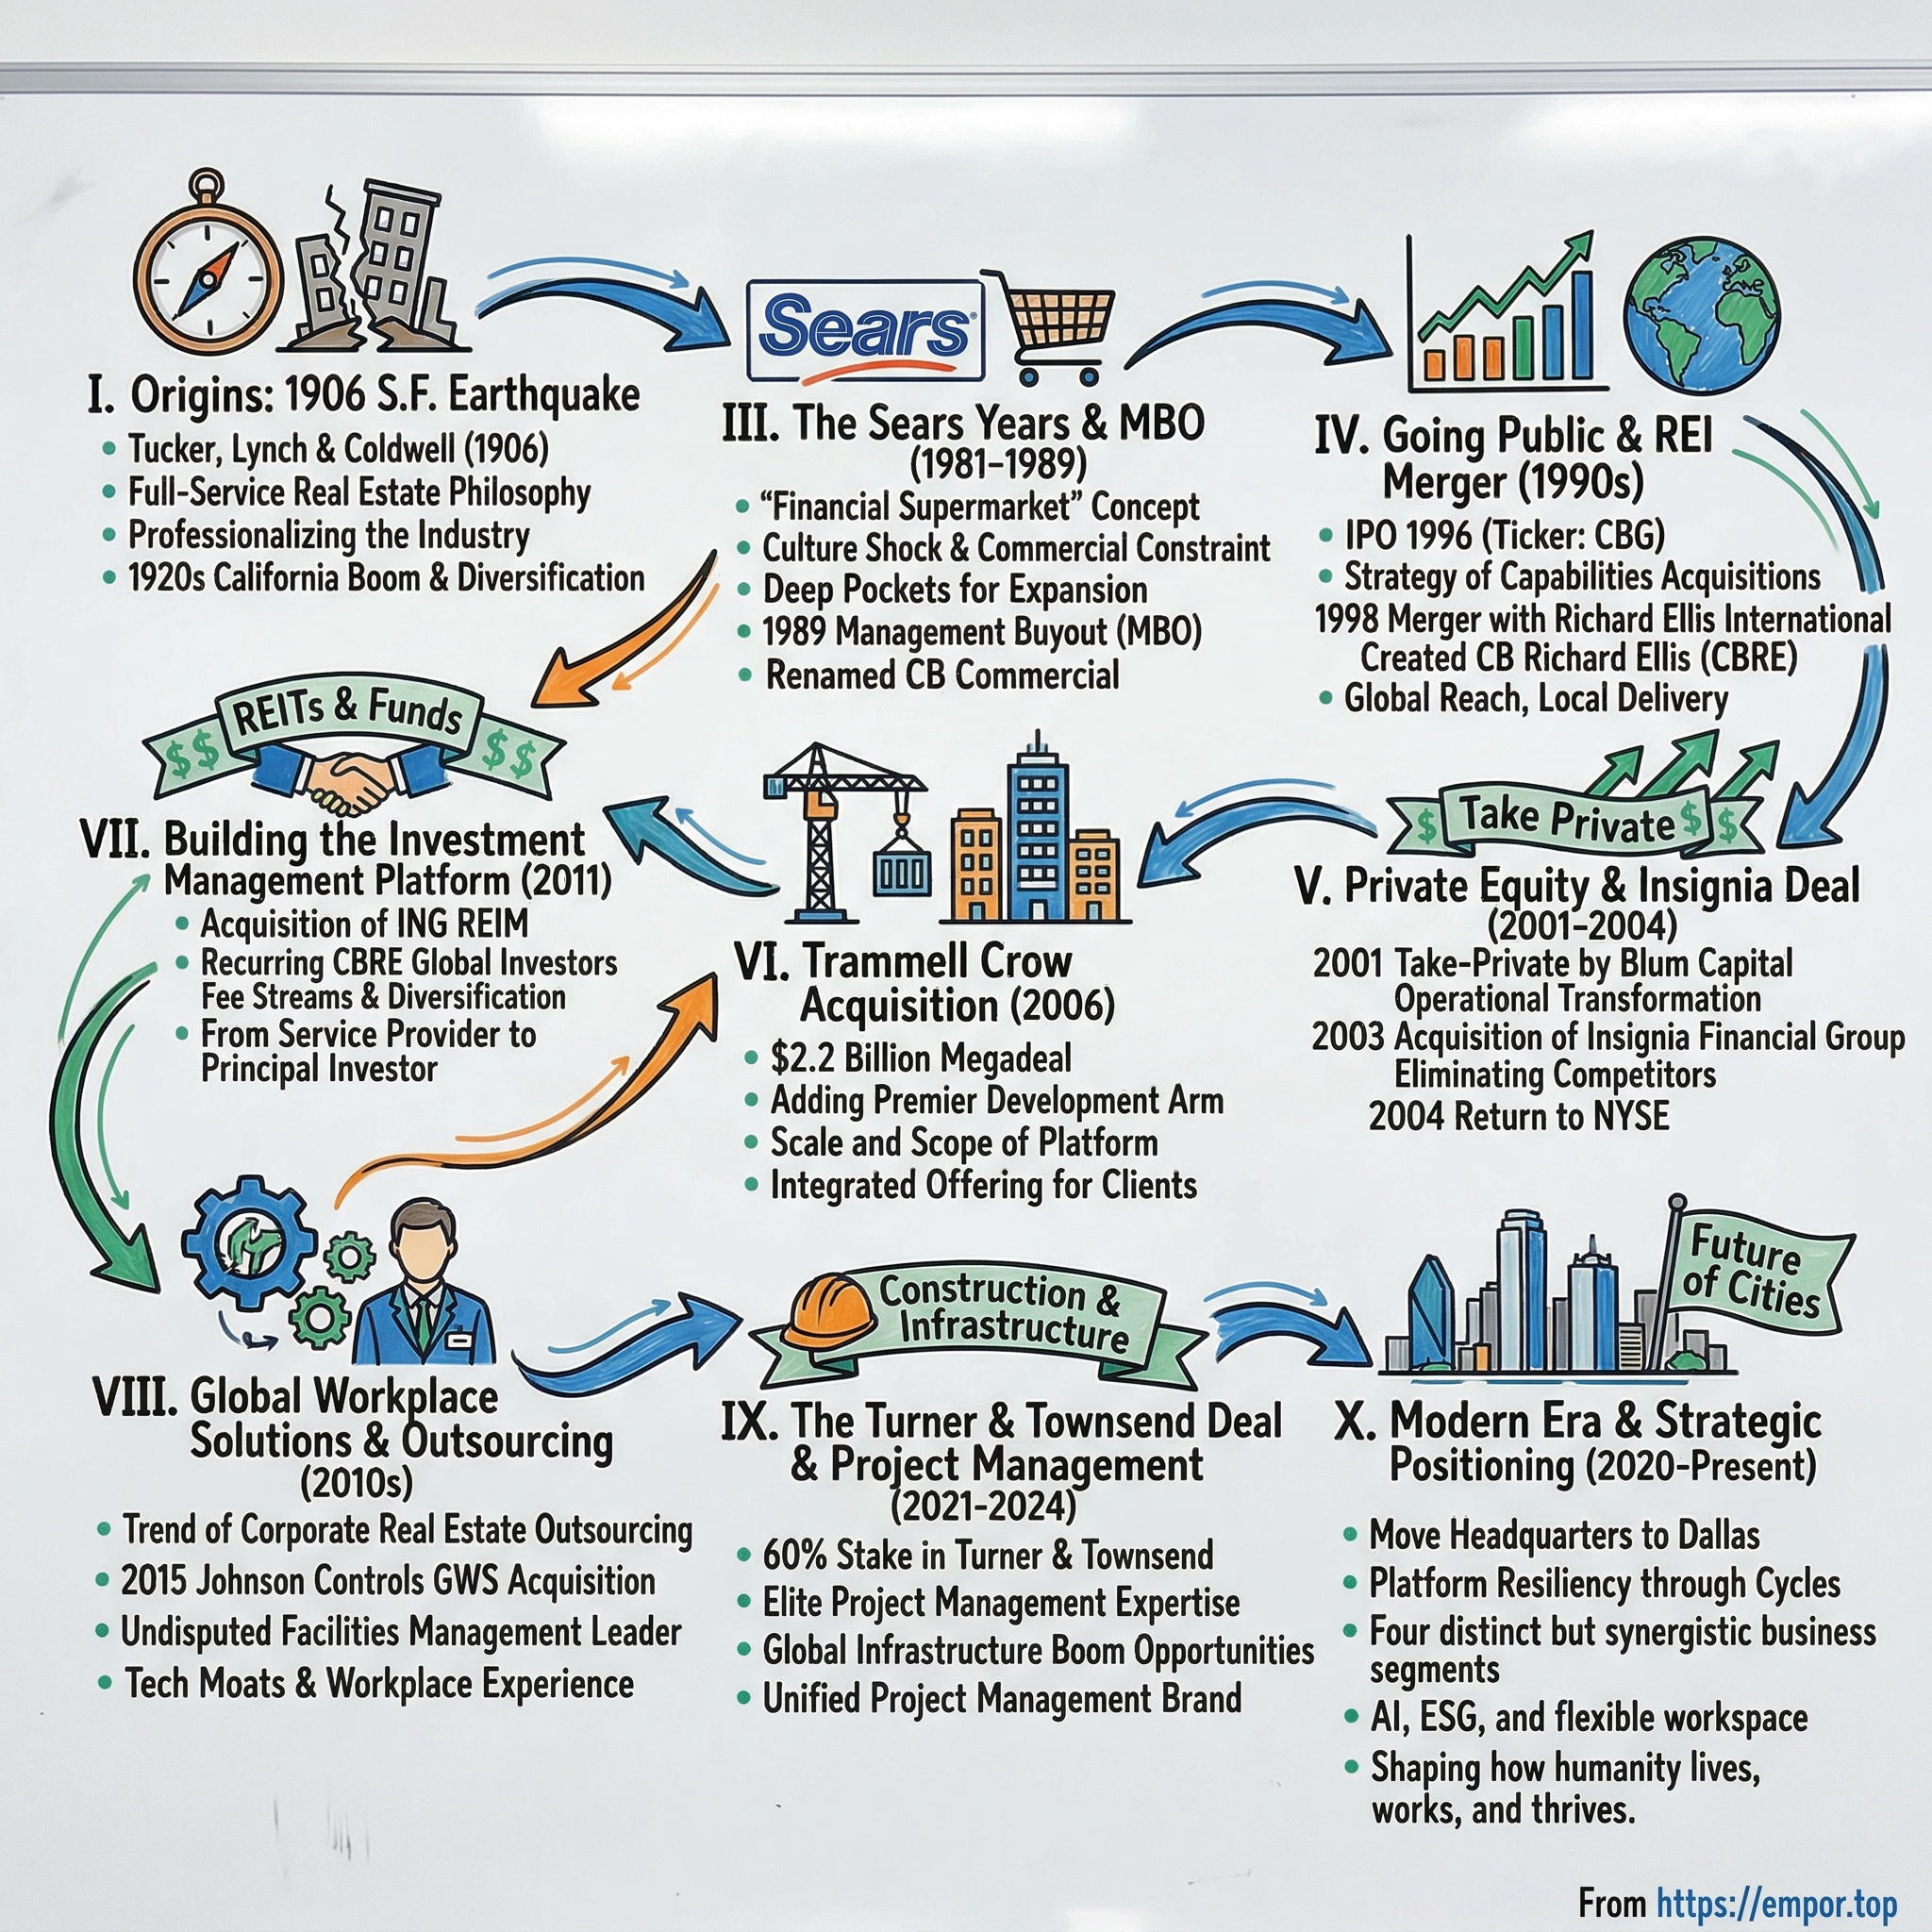
CBRE Group: Building the World's Largest Commercial Real Estate Empire
I. Introduction & Episode Roadmap
On July 29, 2026, CBRE Group reported that its second-quarter revenue rose roughly 16% to $11.2 billion, while core earnings per share climbed 30% to $1.56. The result marked CBRE's fifth consecutive quarter of core EPS growth of at least 18%, a notable stretch for a business historically viewed by investors as purely cyclical.12 Following the strong quarter, management raised its full-year earnings guidance for the second time in three months to a range of $7.80 to $7.90 per share.1
Buried in the same release was a figure detailing a contrasting reality. Reported GAAP net income fell 5% after CBRE absorbed a $168 million non-cash charge to bolster reserves for fire-safety remediation in its U.K. residential development unit—covering buildings constructed years earlier by a firm CBRE acquired in 2019 under a 2022 British law reaching back 30 years.1 Excluding that charge, GAAP earnings per share would have risen 57%. The contrast summarizes the broader investment profile: a strong services business periodically burdened by legacy liabilities from attached balance-sheet assets.
CBRE is the largest commercial real estate services firm globally by revenue, employing more than 155,000 people across more than 100 countries.3 Full-year 2025 revenue grew 13% to $40.6 billion, generating core EPS of $6.38 and core EBITDA of $3.3 billion.2 The firm ranks 118th on the 2026 Fortune 500 list, its highest position to date.4 To illustrate its market scale, second-place Jones Lang LaSalle generated $26.1 billion in 2025 revenue, followed by Cushman & Wakefield at $10.3 billion, Colliers at $5.6 billion, and Newmark at $3.3 billion.21222324 CBRE's annual top line exceeds that of its two closest competitors combined.
The firm traces its roots to a partnership established in San Francisco on August 27, 1906, in the aftermath of the earthquake and fire that devastated the city's commercial district.5 Over 120 years, it evolved from a three-person brokerage into a Fortune 500 real estate and corporate services conglomerate. The primary strategic question is not how the firm expanded—serial acquisitions account for most of that growth—but whether its current structure is inherently more durable than the transactional model on which it was founded.
The core paradox. Brokerage offers exceptional operating leverage during economic expansions, yielding high margins on commercial transactions. In a credit freeze or market downturn, however, fixed operating costs quickly press against revenues that can fall by half. CBRE experienced this volatility in past downturns. Over the past 15 years, management sought to mitigate cyclicality by expanding into contracted, non-transactional services—such as facilities management, project management, valuations, loan servicing, and asset management fees—building a resilient earnings base designed to buffer downturns.
Three myths worth dismantling before the story starts.
Myth one: roughly 70% of CBRE's segment profit now comes from resilient businesses, permanently insulating it from the property cycle. While widely cited, this 70% figure reflects performance in 2023 rather than a permanent structural baseline. CBRE's June 2026 investor presentation shows resilient segment operating profit accounted for 69% of the total in 2023, 66% in 2024, and 62% in 2025.17 The ratio has declined primarily because higher-margin transactional profits have recovered faster than resilient income streams during the recent upturn. Consequently, revenue mix reflects the broader market cycle rather than permanent structural shift alone, aligning with management's stated long-term target of greater than 60%.17 The underlying metric of stability is dollar expansion: resilient segment profit grew from $413 million in 2012 to $2.28 billion in 2025, establishing a substantially higher earnings floor.17
Myth two: CBRE's enterprise facilities contracts renew at rates above 95%. Although frequently cited in market commentary, CBRE does not publish official contract renewal or retention rates in its Form 10-K, earnings reports, or June 2026 investor presentation. While contract stickiness remains a key pillar of the bull case, the claim relies on external estimates rather than verified disclosures—an ongoing reporting gap for investors.
Myth three: CBRE operates purely as a capital-light services firm. While core services fit this model, CBRE also maintains capital-intensive exposures through Trammell Crow Company, which holds a development portfolio and pipeline of $29.6 billion. Additionally, its former U.K. residential development business generated legacy liabilities that required hundreds of millions of dollars in remediation provisions not apparent at acquisition.13
What follows. This analysis reviews the firm's origin story and its brief ownership by Sears before detailing four decades of transformational expansion: the Richard Ellis merger, the Blum leveraged buyout, and the acquisitions of Insignia, Trammell Crow Company, ING REIM, Johnson Controls' Global Workplace Solutions, Turner & Townsend, and Industrious, culminating in its 2025 four-segment corporate reorganization. Across each phase, core investment theses are evaluated against historical execution and disclosures to assess the durability of CBRE's business model.
 Subscribe on LinkedIn
II. Origins: From the 1906 San Francisco Earthquake to West Coast Dominance
Four months after the April 1906 earthquake and fire, downtown San Francisco remained a grid of scorched lots and temporary shacks. Property titles were in chaos, owners were scattered, and speculators roamed the rubble seeking distressed sellers who did not yet know the true value of their land. Into that market, on August 27, 1906, 23-year-old Colbert Coldwell formed a partnership with Albert Nion Tucker and John Conant Lynch called Tucker, Lynch & Coldwell.5
The founding insight was not a market call; it was a governance decision. Real estate in early 20th-century San Francisco was an industry where brokers frequently represented both sides of a transaction, took secret positions in the properties they sold, and profited from information asymmetry. Coldwell's firm adopted the opposite posture: represent a single client, take no principal stake, and disclose all conflicts of interest. In a market where counterparties routinely expected manipulation, a firm that could credibly promise single-sided representation offered a distinct competitive advantage.
What made this business model commercially durable was how it aligned with the firm's target clients: corporate and institutional property owners rather than short-term speculators. An institution buys commercial property infrequently but requires ongoing advisory and brokerage services across multiple transactions, whereas a speculator relies on one-off deals. Building for repeat institutional clients set the firm's economic direction for the next century.
Benjamin Arthur Banker joined as a salesman in 1913 and made partner the following year.5 The masthead churned through several permutations—Coldwell, Kern & Banker, then Coldwell, Cornwall & Banker by 1920—before settling on Coldwell, Banker & Co. in 1940.5 The firm incorporated on July 1, 1963, issued its first publicly traded shares in 1968 (offering roughly 503,000 shares, or about 29% of the company, at $25 apiece), and moved to the New York Stock Exchange in 1971.5 In 1969, it stepped decisively outside California by acquiring Henry Broderick, Inc. in Seattle and Forest E. Olson, Inc. in Southern California.5
The strategic significance of that mid-century period lay in how it reshaped the work itself. Commercial brokerage in the 1930s relied almost entirely on individual relationships. Coldwell Banker gradually built an institutional firm by establishing research departments, appraisal capabilities, standardized documentation, and property management alongside sales. Each capability represented a fixed cost that a solo broker could not absorb but that a larger organization could spread across hundreds of transactions. This introduced the core economic engine driving CBRE today: leveraging fixed-cost intensity as a competitive barrier against smaller rivals.
For investors, the primary takeaway from the firm's first 75 years is a structural limitation: despite its growth, the company had not yet established a defensible national franchise. By the late 1970s, Coldwell Banker was well regarded and broadly established across the West Coast, but it remained fundamentally a network of local brokerage operations whose primary assets left the office every evening. It was, in short, precisely the type of firm vulnerable to acquisition by a conglomerate seeking to build a broad financial supermarket—which is exactly what happened next.
III. The Sears Supermarket Experiment & Management Buyout (1981–1989)
In 1981, Sears, Roebuck & Co. was the largest retailer in the United States. Its chairman, Edward Telling, harbored a broad thesis: the American middle class would prefer to manage its financial life the way it bought appliances—under one roof, from a brand it trusted. Sears already owned Allstate, added Dean Witter Reynolds for stock brokerage, and purchased Coldwell Banker for $179 million, or roughly $42 per share, to supply real estate services.5 The Discover Card followed. The strategy became known as the "financial supermarket."
The consumer logic was at least plausible for residential brokerage—a family buying a home might reasonably seek a mortgage, insurance, and appliances from a single source. It was virtually irrelevant to commercial real estate. A pension fund acquiring a Chicago office tower shared no operational overlap with a consumer purchasing a Kenmore washer, and the corporate bureaucracy required to manage a national retail chain was ill-suited for commercial brokerage.
Operational friction emerged in three primary areas: compensation, capital allocation, and speed. On compensation, commercial brokers earned large, deal-dependent commissions that conflicted with retail pay structures. On capital allocation, commercial real estate required episodic, opportunistic investments—such as opening a new office or recruiting a competing team—whereas Sears evaluated capital through rigid retail-store expansion metrics. On speed, brokerage required immediate execution. Under a corporate parent focused on a struggling retail core, the commercial unit was neither starved nor nurtured; it was simply administered.
By the late 1980s, the financial supermarket strategy had collapsed, forcing Sears to divest non-core assets. In 1989, an investor group led by The Carlyle Group acquired the commercial operations for approximately $305 million, supported by roughly $44 million from an employee leveraged buyout, while Sears received an additional $100 million for a five-year non-compete agreement.5 The residential business retained the Coldwell Banker name—eventually passing to Realogy and later Anywhere Real Estate—while the independent commercial arm operated briefly as Coldwell Banker Commercial Real Estate Group before rebranding as CB Commercial Real Estate Group in 1991.5
Two elements of that buyout defined the firm's subsequent development. First, employees invested their own capital. A brokerage owned by its senior producers operates with different incentives than one managed by salaried executives, establishing an equity-ownership culture that persisted for decades. Second, the buyout left the business independent, sub-scale, and heavily levered just before the early-1990s commercial property downturn—the deepest U.S. real estate contraction since the 1930s.
That crisis led management to a central strategic conclusion: a local or regional commercial brokerage lacks a defensible moat. Its core human talent can leave at any time, and its revenue remains tightly linked to transaction volume and credit availability beyond its control. Escaping that vulnerability required building scale to spread fixed infrastructure costs over broader deal flow, alongside expanding non-transactional services to maintain revenue when transactions slowed. CB Commercial spent the following three decades executing that strategy, turning to public equity to finance the expansion.
IV. Going Public, Platform Building & The Richard Ellis Merger (1990s)
The 1996 initial public offering raised roughly $80 million.5 The capital raise provided CB Commercial with both cash and publicly traded equity to use as acquisition currency. The firm targeted a fragmented commercial real estate industry populated by boutique specialists that each focused on a single service line.
Acquisitions began prior to the offering and accelerated rapidly after. In 1995, CB Commercial purchased Westmark Realty Advisors for $37.5 million, establishing an institutional real estate investment management arm that eventually grew into a $155 billion assets-under-management business.51 In 1996, the firm acquired mortgage banking and debt placement firm L.J. Melody & Co. for $15 million, gaining a loan servicing portfolio that today exceeds $468 billion and generates fee income independent of transaction volume.51 The 1997 acquisition of Koll Real Estate Services nearly tripled the square footage CB Commercial managed, transforming property management into a primary service line.5
Together, these transactions attached contracted revenue streams to a cyclical commission business. Investment management generated base fees tied to assets under management, loan servicing produced annual per-loan fees, and property management delivered recurring monthly contract fees per building. These contracted revenues continued flowing even when transaction volume slowed. The strategy CBRE would eventually market as through-cycle resilience was taking shape as early as 1995 across a firm generating $700 million in revenue.
The firm expanded internationally on December 9, 1997, by announcing the acquisition of REI Limited—the holding company for Richard Ellis's operations outside the United Kingdom, a business tracing its origins to 1773 in London. The transaction closed on April 21, 1998, with financial terms undisclosed.6 REI generated roughly $119 million in 1997 revenue, compared to CB Commercial's $730 million-plus. The combined entity, rebranded as CB Richard Ellis, generated 1997 pro forma revenue of $848 million, employing more than 8,000 people across more than 200 offices in 29 countries.6
The strategic rationale centered on the globalization of commercial real estate capital. Institutional investors and corporate tenants—such as a European insurer acquiring a Chicago office tower or an American firm leasing space in London—increasingly required advisory services across multiple geographic markets. A strictly regional firm could not service these cross-border transactions, creating a competitive advantage for an enterprise with dual-continent scale.
Historical falsification: does geographic diversification protect brokerage earnings?
Management argued at the time that geographic expansion would smooth earnings by balancing regional downturns across North America, Europe, and Asia. However, performance over the subsequent five years disproved that assumption.
The Asian financial crisis unfolded shortly after the merger was announced, followed by the 2000 dot-com collapse and a subsequent contraction in U.S. commercial real estate. Transaction fee revenues did not rotate among regions; instead, volume fell globally. Transaction activity is driven less by isolated regional GDP growth than by the global availability and cost of capital. Because capital markets are interconnected, geographic expansion alone provided little insulation against broader credit contractions.
The financial impact was immediate. By 2001, CB Richard Ellis faced a depressed valuation, significant debt burdens from recent acquisitions, and limited operational headroom to earn its cost of capital through the economic trough, leading to its departure from the public markets.
The durable advantage of global scale lay not in geographic revenue offsetting, but in client capture—specifically securing multinational corporate accounts requiring unified services across multiple countries. However, true earnings stability stemmed from the contract type securing those relationships rather than geographic presence alone. International reach without recurring revenue contracts failed to protect brokerage earnings, a lesson that shaped the firm's strategy in subsequent market cycles.
V. The Blum Capital LBO, Insignia Deal & S&P 500 Listing (2001–2006)
San Francisco investor Richard C. Blum, who held a long-standing interest in the company, saw opportunity in the public market's deep discount on CB Richard Ellis. In his view, restructuring the cost structure required private ownership willing to absorb short-term operational shifts away from quarterly public market scrutiny.
On July 20, 2001, Blum CB Holding Corporation—incorporated earlier that year and later renamed CBRE Holding, Inc.—completed the buyout of CB Richard Ellis Services, taking the firm private at $16.00 per share in cash. Equity financing was supplied by Blum's affiliates, Freeman Spogli & Co., the California Public Employees' Retirement System, and participating management and staff at the $16.00 purchase price, while DLJ Investment Funding provided $65 million of mezzanine units.25
Under private ownership, management aggressively streamlined operations. Beginning in May 2001, the firm flattened its organizational hierarchy, closed or consolidated underperforming offices, and reduced overhead to realign its cost base with lower transaction volumes.
Beyond immediate cost reductions, private ownership provided strategic flexibility. Unburdened by quarterly earnings targets and backed by sponsor capital, CBRE could pursue large-scale consolidation during an industry downturn while listed competitors remained constrained.
That capability manifested on February 18, 2003, when CB Richard Ellis agreed to acquire Insignia Financial Group for $11.00 per share in cash, a transaction valued at approximately $415 million including net debt repayment and preferred stock redemptions. Blum Capital contributed up to $145 million of fresh equity, while Credit Suisse First Boston committed the debt.7 The combination created a firm with revenue above $1.8 billion and 16,000 employees across 47 countries, establishing market leadership in major financial hubs including New York, Los Angeles, Chicago, London, Paris, and Hong Kong.7
The Insignia acquisition highlighted the strategic value of local market density in commercial brokerage. Commercial leasing and investment sales are information-driven businesses: the firm handling the highest volume of deals in a city gains unmatched visibility into tenant demand, landlord requirements, and pricing trends. By acquiring dominant market share in key global gateways at a cyclical trough from a motivated seller, CBRE turned local deal volume into a compounding competitive moat.
With operations restructured and market share expanded, the sponsors executed a swift public exit. On June 10, 2004, CB Richard Ellis Group returned to the public markets on the NYSE at $19.00 per share, selling 24.0 million shares—7.7 million from the company and 16.3 million from selling holders—for approximately $138 million of net proceeds to the company, earmarked for deleveraging and retiring high-coupon debt.8 In 2006, it became the first commercial real estate services company included in the S&P 500.27
In eight years, the enterprise transformed from a $700 million regional brokerage into an S&P 500 benchmark constituent. Operating privately during market troughs enabled management to build scale and local market leadership before returning to public markets during the cyclical recovery.
However, relying on debt-funded acquisition cycles to drive expansion carried inherent balance-sheet risk—a strategy management was about to test once more on an even larger scale.
VI. The Trammell Crow Watershed Deal & Navigating the GFC (2006–2010)
In the autumn of 2006, the U.S. commercial property market reached historical peaks. Capitalization rates compressed toward levels that assumed low-cost debt would persist indefinitely, commercial mortgage-backed securities (CMBS) issuance set records, and institutional demand for real estate assets expanded rapidly.
Against this backdrop, CB Richard Ellis announced an agreement on October 31, 2006, to acquire Trammell Crow Company. The transaction closed on December 20, 2006, at $49.51 per share in cash—valuing the acquisition at approximately $2.2 billion.926
The strategic rationale proved enduring. Trammell Crow provided three key capabilities CBRE lacked: a large U.S. development platform, deep corporate outsourcing relationships with commercial occupiers, and an experienced management bench. Among those executives was Bob Sulentic, a 22-year Trammell Crow veteran who began as an industrial leasing agent in Houston in 1984, became president and CEO in October 2000, and assumed the role of chairman in April 2002.4 Beyond acquiring an asset base, CBRE secured an executive team that would lead the enterprise within six years.
However, the transaction structure introduced significant balance-sheet risk. CBRE financed the purchase largely with debt at the peak of a leveraged commercial property cycle—a vulnerability for a services business whose revenue depended directly on transaction volume. In December 2007, near the market peak, the company completed a share repurchase program, buying back 28.8 million shares at an average price of $22.03, returning $635 million to shareholders.27
Historical falsification: did CBRE overpay, and what does it say about capital allocation?
CBRE's financial disclosures illustrate the severe impact of that leverage during the subsequent downturn. Consolidated revenue peaked at $6.0 billion in 2007 before falling 15% to $5.1 billion in 2008. The company reported a net loss of $1.0 billion for 2008 after recording $1.2 billion in non-cash impairment charges against goodwill and other non-amortizable intangibles—reflecting the write-down of assets acquired near the top of the market.10 Revenue declined another 18.8% in 2009 to $4.2 billion, while net income fell to $33.3 million.10 Across 24 months, roughly 30% of the company's top line vanished.
To avoid defaulting on its obligations, management restructured its balance sheet. On March 24, 2009, CBRE amended its credit facility to raise its permitted leverage ratio from 3.75x to 4.25x and reduce its required interest coverage ratio from 2.25x to 2.00x for eight quarters.28 Concurrently, the company targeted annual structural cost reductions of $475 million to $500 million compared to 2007 operating levels.28 To maintain liquidity, CBRE issued equity across four separate offerings at depressed valuations:
- November 18, 2008: 57.5 million shares for $206.7 million in net proceeds—approximately $3.60 per share.10
- June 10, 2009: 13.4 million shares placed directly with Paulson & Co. for $97.6 million.10
- June 11, 2009: 5.7 million shares via an at-the-market equity program for $48.8 million.10
- November 2009: 28.3 million shares via an at-the-market program for $293.8 million.10
The sequence highlighted the financial risk of pro-cyclical capital allocation. In December 2007, CBRE repurchased 28.8 million shares at $22.03 per share; 11 months later, under financial distress, it issued 57.5 million shares at roughly $3.60 per share. By purchasing shares near the market peak with debt and issuing equity at trough valuations to satisfy debt covenants, the company diluted existing shareholders by nearly 100 million shares. By the end of 2009, total stockholders' equity stood at $629 million against $1.3 billion of remaining goodwill.10
This historical experience remains directly relevant to how investors evaluate CBRE's capital allocation and share buyback strategy, a theme revisited in Section IX.
The crisis also altered the company's executive trajectory. In 2009, Sulentic was appointed chief financial officer—an uncommon assignment for an operational executive during a balance-sheet crisis—and signed the 2009 Form 10-K as principal financial officer alongside CEO Brett White.104 Managing debt covenant renegotiations, four dilutive equity issuances, and a $500 million cost-reduction campaign shaped the operational strategy of the leadership team that assumed executive control in 2012.
The central lesson management drew from the Great Financial Crisis was structural: reliance on transaction commissions creates acute earnings volatility during a credit freeze, when deal volume contracts rapidly. To insulate the enterprise against future downturns, management prioritized expanding contracted, recurring revenues that persist regardless of property market transaction activity.
VII. The Pivot to Recurring Fee Revenue: ING REIM & JCI GWS (2011–2018)
The pivot to recurring fee revenue began with a distressed seller. Following the 2008 financial crisis, ING Group received state aid from the Dutch government and faced European Commission pressure to divest non-core assets. Its real estate investment management unit, ING REIM—then one of the world's largest—was put up for sale.
In February 2011, CB Richard Ellis agreed to acquire the bulk of ING REIM for approximately $940 million in cash, encompassing its European and Asian operations alongside U.S.-based Clarion Real Estate Securities. The Asian acquisition closed on October 3, 2011, followed by the European unit on October 31, 2011, establishing a combined investment manager with nearly $97.5 billion in assets under management.11 Reflecting its evolving corporate identity, the firm renamed itself CBRE Group, Inc., dropping "Richard Ellis" after 13 years to adopt the four-letter acronym.
Investment management operates on fundamentally different economics than commercial brokerage. A manager collects base fees on committed or invested capital under multi-year fund structures, alongside performance fees triggered when investment returns exceed specified hurdles. While base management fees function like predictable annuities, performance fees remain highly variable. In the second quarter of 2026, investment management operating profit rose only modestly. Capital raising totaled $1.6 billion, falling short of internal targets as Chief Financial Officer Emma Giamartino noted that Middle Eastern investors remained cautious amid geopolitical volatility.18 Assets under management ended the quarter at roughly $155 billion.1
Four years later, CBRE executed the transaction that reshaped its business model. On March 31, 2015, the firm agreed to acquire Johnson Controls' Global Workplace Solutions (GWS) business for $1.475 billion in cash, completing the transaction on September 1, 2015.12
What corporate facilities management actually is. In practical terms, corporate facilities management allows multinational corporations—such as banks, pharmaceutical manufacturers, or technology firms—to outsource physical property operations. Rather than directly employing building engineers, HVAC technicians, lab cleaners, space planners, and procurement specialists, a client transfers these functions to a single provider under a multi-year master contract. The provider assumes or hires the operational staff, standardizes procedures across the client's global facilities, leverages volume purchasing for supplies, and manages ongoing service delivery.
The segment's underlying financial profile is frequently misunderstood due to gross revenue accounting. In 2025, CBRE's Building Operations & Experience segment generated $23.5 billion in revenue but $1.1 billion in segment operating profit, representing an operating margin of roughly 4.7%.17 By contrast, Advisory Services generated $8.7 billion in revenue and $1.68 billion in operating profit, yielding a margin near 19%.17
While this comparison suggests lower profitability, two factors explain the divergence. First, a substantial portion of facilities management revenue consists of client reimbursements for direct operational costs. CBRE's 2025 Form 10-K discloses that costs for approximately 61% of its workforce (excluding Turner & Townsend) are directly reimbursed by clients, with the vast majority situated in facilities management.3 Calculating margins on top-line revenue that includes pass-through labor and materials depresses reported margin percentages relative to the underlying service fee profitability. Second, unlike transaction-driven advisory fees, facilities management profits recur every quarter under multi-year contracts regardless of underlying real estate transactional activity.
The moat mechanism, and how much of it is proven. The bullish investment case for facilities management rests on two main pillars: high switching costs and procurement scale. High switching costs arise once CBRE integrates its personnel, vendor networks, and reporting platforms directly into a client's corporate infrastructure across hundreds of locations. In its June 2026 investor presentation, CBRE noted that of the roughly 45,000 employees in its Enterprise Facilities Management unit, more than 85% work on client sites.17 Replacing an incumbent provider requires a complex operational transition that risks business interruption. The second pillar is procurement scale: managing approximately 8.5 billion square feet and serving 90% of the Fortune 100 provides substantial bargaining power when negotiating vendor pricing for maintenance, equipment, and building supplies.17
While both mechanisms are economically sound, public disclosures provide incomplete verification. As highlighted in Section I, CBRE does not publish client retention rates, average contract durations, renewal pricing realization, or competitive win rates against rivals such as Jones Lang LaSalle. Consequently, the switching-cost thesis relies primarily on indirect behavioral evidence rather than detailed operating metrics. The strongest evidence is performance stability: the segment grew revenue every year through the 2023 commercial property downturn—even as transaction volumes contracted—and has expanded organically at a low double-digit compound rate.17 Broad client dissatisfaction or aggressive price-shopping would likely preclude such steady expansion. Nevertheless, revenue stability aligns with a competitive moat without conclusively proving its magnitude.
Contract structures also place a practical ceiling on pricing power. Corporate facilities management agreements frequently operate on an open-book basis, where clients inspect underlying costs and negotiate fixed fee margins. Under this model, procurement savings are largely passed through to clients rather than retained by the service provider, limiting margin expansion to modest annual incremental gains. Demonstrating this dynamic, CBRE's June 2026 disclosures report 70 basis points of operating leverage on gross revenue within this segment between 2023 and 2025.17
Ultimately, the expansion into recurring fees achieved its core strategic objective. During the 2023 commercial property downturn, resilient segment operating profit remained steady while transactional earnings fell—validating management's post-GFC diversification strategy. Subsequent declines in resilient revenue as a percentage of total earnings reflect the rapid cyclical rebound of higher-margin brokerage transactions rather than operational deterioration, illustrating why the relative revenue mix is less instructive than absolute dollar profit growth.
VIII. Modern Expansion: Turner & Townsend, Industrious, & Telford Remediation (2019–2024)
If the 2010s focused on acquiring recurring service fee streams, the 2020s shifted toward buying exposure to corporate and public capital expenditure—along with the unexpected balance-sheet liabilities attached to development assets.
Turner & Townsend. On November 2, 2021, CBRE completed the acquisition of a 60% interest in U.K.-headquartered program management firm Turner & Townsend for £960 million (approximately $1.3 billion), with 55% paid at closing. The transaction brought more than 7,000 professionals across 112 offices in 46 countries.13 Chief Executive Bob Sulentic framed the deal as advancing diversification "across four dimensions – asset types, lines of business, clients and geographies."13
Program management differs fundamentally from traditional project management. When a government constructs a rail line, a utility builds a power grid, or a technology enterprise expands a data center campus, an independent specialist must oversee cost estimates, schedules, risk registries, contractor procurement, and change orders across multi-billion-dollar timelines. That oversight is rarely handled internally by property owners or delegated to general contractors whose financial incentives run counter to cost control. Instead, it is executed by specialized consultancies paid on fee-for-service and staff-time structures. The business model mirrors high-end professional services: light capital requirements, zero inventory, revenue tied to billable hours and project milestones, and pricing power derived from institutional track record.
On January 3, 2025, CBRE combined its internal project management business with Turner & Townsend, increasing its equity stake to 70% while Turner & Townsend Chair and Chief Executive Vincent Clancy joined CBRE's Board of Directors.14 The combined unit had produced approximately $3 billion in net revenue in 2023, with CBRE disclosing that Turner & Townsend's revenue had compounded at more than 20% annually since becoming a majority-owned subsidiary.14 In 2025, the consolidated Project Management segment generated $7.4 billion in top-line revenue and $543 million in segment operating profit.17
The core strategic thesis posits that global capital expenditure—spanning data centers, energy infrastructure, transportation, and defense—grows faster and with less cyclical volatility than commercial property transactions. Recent execution supports this premise: Project Management revenue rose 19% in the second quarter of 2026, driven by a 30% increase in infrastructure activity and a 28% rise in segment operating profit.118 On the July 2026 earnings call, Sulentic noted that Turner & Townsend had expanded its data-center consulting workload at over 30% annually "for a decade now," pointing to U.S. market expansion and large-scale energy projects as key future growth vectors.18
An important operational constraint remains: Chief Financial Officer Emma Giamartino advised analysts on the same call that Project Management's operating leverage would "moderate in the back half of the year given the timing of costs."18 Consulting business models experience utilization cycles, meaning a single 28% profit quarter does not represent a permanent baseline.
Industrious and the flexible workspace bet. On January 14, 2025, CBRE announced an agreement to acquire the remaining interest in Industrious while establishing its Building Operations & Experience reporting segment. The transaction closed at 100% ownership on January 16, 2025, with CBRE paying approximately $400 million for the outstanding 60% stake at an implied enterprise value near $800 million.15 Among recent deals, flexible workspace carries the highest conceptual risk, given the sector's history of significant capital destruction. Management contends that Industrious operates as a premium corporate service provider rather than a landlord arbitrage vehicle, using hospitality capabilities to enhance CBRE's broader enterprise occupier offerings. On the April 2026 earnings call, Sulentic reported that unit additions were running ahead of original underwriting.19 While an encouraging early indicator, the flexible workspace model's primary failure mode—a demand downturn tested against fixed lease obligations—has yet to be evaluated under CBRE's full ownership.
Historical falsification: what Telford Homes reveals about buying balance-sheet businesses.
In July 2019, CBRE offered £3.50 per share to acquire London build-to-rent developer Telford Homes plc, valuing the enterprise at £267.4 million before completing the purchase in October 2019.16 Telford had generated roughly £354 million in revenue and £40 million in pre-tax profit during the twelve months ending March 2019—appearing on paper as a reasonably priced, profitable addition to Trammell Crow's development platform.16
The regulatory landscape shifted with the passage of the U.K. Building Safety Act 2022. On April 28, 2022, Telford signed the U.K. government's Fire Safety Pledge, and on March 16, 2023, it entered a legally binding agreement to remediate or fund the remediation of life-critical fire-safety defects across every Telford-constructed residential building of 11 meters or higher in England completed over the preceding thirty years.3 The legislation also retroactively extended the statutory limitation period under the Defective Premises Act to thirty years for residential developments completed before June 2022.3 Consequently, a 2019 acquisition exposed CBRE to historical construction liabilities extending back to the 1990s under statutory rules enacted years after closing.
The resulting financial liabilities expanded across consecutive reporting periods:
- Telford recorded a £193 million pre-tax loss following an initial £143 million building-safety provision.[^17]
- Subsequent pre-tax losses accumulated as required remediation reserves expanded.[^18]
- By December 31, 2024, CBRE carried an estimated remediation liability of approximately $204 million on its balance sheet.3
- By December 31, 2025, that estimated liability increased by $117 million to approximately $321 million, after regulatory guidance indicated "a much greater scope of remediation work than initially expected," requiring internal structural remediation across nearly all in-scope properties.3
- In the second quarter of 2026, CBRE recorded an additional $168 million non-cash charge to further increase remediation reserves.1
This sequence represents four consecutive upward reserve adjustments over four years. In its Form 10-K disclosures, management acknowledged that these estimates "remain subjective, highly complex and dependent on a number of variables outside of Telford Homes' control," citing shifting regulatory interpretations, unexpected physical findings during work, materials availability, and a shortage of qualified fire safety engineers.3
The calibrated conclusion. This history does not invalidate CBRE's broader M&A track record—large acquisitions like Turner & Townsend and Global Workplace Solutions have driven substantial enterprise value, and Telford remains modest relative to a $40 billion revenue firm. However, it directly refutes the premise that CBRE's acquisition process reliably prices long-tail liabilities in balance-sheet-heavy development businesses. In both the 2006 Trammell Crow transaction and the 2019 Telford acquisition, the firm purchased asset-heavy entities only to uncover liabilities that standard income-statement due diligence could not surface. Service businesses fail through client churn, which occurs gradually and visibly. Development businesses fail through unbooked contingent obligations, which remain invisible until they materialize.
The key metric that will validate or refute management's risk mitigation is whether Telford's remediation reserves stabilize. Two consecutive fiscal quarters without an upward reserve adjustment would indicate that the physical scope of work is fully bounded. Additional reserve increases in future filings would signal ongoing scope expansion, justifying a continued valuation discount on CBRE's principal development exposures.
IX. Current Management, Governance & Capital Allocation
Bob Sulentic did not rise through the traditional brokerage ranks. Holding a computer science degree from Iowa State and an MBA from Harvard Business School, he began leasing industrial space in Houston in 1984, served as chief executive of Trammell Crow Company starting in October 2000 and chairman from April 2002, joined CBRE through the 2006 merger, stepped into the chief financial officer role during the 2009 debt covenant crisis, became president and CEO in December 2012, and assumed the board chair position in November 2023.4 Additionally, he served as independent chairman of Staples until its sale in 2017.4
That progression from developer to CFO strongly influences his management approach. Developers evaluate what an enterprise could be worth over a multi-year horizon, while financial officers who have managed balance-sheet distress focus on downside protection when assumptions fail. Under Sulentic, CBRE has combined aggressive M&A expansion with conservative balance-sheet leverage.
Compensation and alignment. Sulentic's total compensation for 2025 reached $24.3 million ($24,325,039).20 He directly holds 1,015,052 shares, with an additional 50,731 shares held through the Sulentic Family Foundation; collectively, all fifteen current directors, nominees, and executive officers beneficially own 1,336,985 shares, representing less than 1.0% of total shares outstanding.20 Two-thirds of executive long-term equity awards are granted as performance-based restricted stock units (RSUs).20
This structure points to two key governance realities. Sulentic's personal stake, valued in the hundreds of millions of dollars, aligns his financial interest directly with equity performance. However, the overall insider ownership of under 1% highlights that CBRE remains a broadly held institutional enterprise rather than a founder-led firm, meaning governance alignment depends heavily on incentive design. Linking performance RSUs to relative return on invested capital (ROIC) and earnings growth aligns pay with disciplined capital allocation, penalizing value-destructive acquisitions. Whether those hurdle targets are sufficiently demanding remains an open question, given recent proxy disclosures showing above-target payouts.
Beyond Sulentic, the executive team includes key operational leaders across financial and strategy roles. Chief Financial Officer Emma Giamartino manages capital allocation in coordination with operational and investment leaders.20 Vincent Clancy joined the board of directors following the integration of Turner & Townsend.14 Chief Operating Officer Vikram Kohli oversees cost programs and technology implementation; on the April 2026 earnings call, Sulentic noted that Kohli maintains direct authority over access to and expenditure on artificial intelligence tools—reflecting a centralized approach to technology cost management.19
Capital allocation: the record and the test. Between 2021 and 2025, CBRE generated approximately $7 billion in free cash flow. Over that five-year period, management deployed roughly $6 billion into M&A, co-invested $2.4 billion in gross capital into real estate investments, and spent about $4.5 billion on share repurchases, retiring 47 million shares at an average price of roughly $96.17 In 2025 alone, the firm repurchased 7,052,481 shares at an average price of $135.52 under its 2024 authorization, leaving approximately $4.9 billion in remaining repurchase capacity.3 Free cash flow reached roughly $1.7 billion in 2025 and maintained that level on a trailing twelve-month basis through June 2026, representing a cash conversion rate of approximately 78%—within management's target range of 75% to 85%.21917
Management's capital deployment priorities have remained consistent: funding M&A growth first, with share repurchases serving as a secondary deployment mechanism. Giamartino reiterated this strategy during both the April and July 2026 earnings calls, clarifying on the July call that the firm's objective is "not to deploy more than we generate in free cash flow in buybacks," indicating that repurchase activity would taper accordingly.1819
The influence of the Great Financial Crisis is most evident in the firm's approach to debt leverage. Net leverage stood at 1.24x at year-end 2025 and rose to 1.60x by June 30, 2026—a step-up driven by the Pearce Services acquisition and share repurchases—against total debt of $7.4 billion, cash balances of $1.5 billion, and total liquidity of $4.4 billion.21 For an enterprise whose predecessor required credit agreement amendments when leverage approached 4.25x during the 2008 downturn, maintaining net leverage under 2.0x represents a structurally more conservative financial posture.
The stress test on the buyback. Giamartino has repeatedly stated that share repurchases reflect management's "conviction that our stock price is meaningfully undervaluing the enduring long-term growth we see ahead."18 However, execution data shows that repurchases expanded as equity valuations rose: the five-year average repurchase price was approximately $96, increasing to $135.52 in 2025, and reaching roughly $148 in the first quarter of 2026.17319 Accelerating repurchases alongside a rising share price reflects growing cash flow availability rather than strict valuation discipline. The critical analytical question is whether CBRE is repeating its 2007 mistake of funding peak-cycle buybacks with leverage. Current balance-sheet metrics indicate a disciplined process: repurchases are funded from and capped by organic free cash flow while net leverage remains below 2.0x. While this structure prevents the severe equity dilution seen in 2008, it reflects cash flow matching rather than opportunistic market timing.
A second-layer note on disclosure. Two accounting items warrant attention. First, CBRE recast its segment reporting effective in the first quarter of 2026 following changes outlined on the fourth-quarter 2025 earnings call and detailed in a March 24 Form 8-K, restating prior periods accordingly.19 This recast explains why reported 2025 segment operating profit figures differ between the February earnings release and the June investor presentation—Advisory segment operating profit was reported at $1.834 billion in the earnings release versus $1.683 billion in the updated presentation.217 While structural rather than operational, this shift resets multi-year historical comparisons. Second, CBRE reclassified fleet-related amortization within the Building Operations & Experience segment in 2026, elevating reported segment margins. Addressing analyst questions in July 2026, Giamartino clarified that underlying full-year margin expansion was roughly "20 basis points or so," with the remainder driven by the accounting reclassification.18 The disclosure clarifies that headline margin gains in the segment resulted significantly from presentation adjustments rather than organic expansion alone.
Where management has been vague. CBRE's consolidated balance sheet reflects $697 million in loans to related parties—primarily non-executive employees—representing forgivable sign-on bonuses, retention incentives, and prepaid commissions, down from $780 million in the prior year, bearing interest rates up to 5.30% with maturities extending through 2035.3 This balance represents the capitalized cash outlay required to recruit and retain high-producing brokers—a substantial ongoing retention cost that remains largely absent from management's public narrative.
X. Current Business & Four-Segment Structure (2025–Present)
Effective January 1, 2025, CBRE reorganized into four reportable segments, announced alongside its acquisition of Industrious.15 The structure groups operations by underlying economic driver rather than legacy organizational history, providing greater reporting clarity across the enterprise.
Advisory Services represents the firm's core historical business, comprising leasing, property sales, mortgage origination and servicing, valuations, and portfolio services. In 2025, the segment generated $8.8 billion in revenue and $1.83 billion in segment operating profit on an as-reported basis.2 High-margin and capital-light, Advisory remains the line most exposed to interest rate movements and transaction volumes. Performance accelerated in the second quarter of 2026, with revenue rising nearly 18% and segment operating profit climbing 29%. Global leasing grew 24%, property sales rose 20%, valuations increased 12%, and U.S. office leasing set a second-quarter record driven by large deals in gateway markets.118 Meanwhile, the loan servicing portfolio expanded beyond $468 billion.1
Management contends that Advisory has not yet reached its cyclical peak. During the July 2026 earnings call, Chief Financial Officer Emma Giamartino noted that U.S. leasing volume remains below 2019 levels and property sales are early in their recovery—forming the foundation for expected core EPS growth of at least 15% in 2027.18 She also noted that Advisory operating margins have returned to 2019 levels, characterizing them as a steady-state baseline.19 Consequently, future earnings growth in Advisory depends on transaction volume expansion rather than further margin expansion.
Building Operations & Experience represents CBRE's largest revenue line, generating $23.2 billion in revenue and $1.09 billion in segment operating profit in 2025.2 The segment encompasses enterprise facilities management, local facilities management, property management, critical infrastructure services, and Industrious. In the second quarter of 2026, revenue increased 15% while segment operating profit grew 25%.1
Growth within the segment reflects distinct sub-segment dynamics. Critical infrastructure services revenue rose 68% year over year in the second quarter of 2026, supported by nearly 30% growth in data center solutions and the November 2025 acquisition of Pearce Services for approximately $1.2 billion.1218 Local facilities management—the mobile unit serving mid-sized regional occupiers—expanded 11%, continuing to outpace enterprise outsourcing. Giamartino attributed this trend to geographic expansion, highlighting that the U.S. local business has grown 20% to 30% annually since its launch five years ago, compared with low-teens growth in the mature U.K. market.18
Unlike enterprise outsourcing, local facilities management relies less on global integration or switching costs and more on brand equity and balance-sheet scale against regional trade contractors. Growth in this sub-segment represents market-share gains in a fragmented sector rather than high-switching-cost client lock-in.
Project Management houses the combined Turner & Townsend platform, delivering program management, project controls, cost consulting, and construction management across infrastructure and data centers. Driven by transportation and utility contracts in Europe and the Middle East alongside hyperscaler expansion in North America and Asia, the segment posted CBRE's highest percentage growth rate in mid-2026.118
Real Estate Investments combines CBRE Investment Management, which oversees approximately $155 billion in assets under management, with Trammell Crow Company's development business. The segment generated $879 million in revenue and $324 million in segment operating profit in 2025, marking the firm's only revenue decline due to the fee-based nature of its investment management receipts.217 In development, CBRE held roughly $900 million in embedded gains slated for realization over four to five years, supported by a $29.6 billion total development portfolio and pipeline at mid-2026, including $21.2 billion in principal projects.118
Trammell Crow's development platform has increasingly pivoted toward data center site preparation. In April 2026, Sulentic explained that the unit focuses on acquiring, entitling, and improving land, securing approximately 30 U.S. sites by mid-2026 with data center development potential.1918 He also emphasized the operational hurdles, noting, "it's really hard. You have to get approvals, you have to get power, you have to get water. And as a result, we have not been overly aggressive about forecasting what might happen there."19
Because land sales generate episodic capital gains rather than recurring service fees, development earnings remain inherently volatile. Management projects fourth-quarter 2026 segment performance to be flat relative to the prior-year period due to significant land-sale realizations in late 2025.18
The infrastructure thread spanning all four segments. Infrastructure engagements span all four business units, generating approximately $3.3 billion in gross revenue in 2025—about 8% of enterprise total—with $2.5 billion originating from data center projects.17 Across its divisions, CBRE manages more than 1,300 data centers, completed over 250 data center transactions in 2025, and oversees more than 150 data center construction projects.17 Management estimates that data centers generated roughly 15% of core EBITDA in 2025, with about half that contribution coming from recurring services outside Trammell Crow land gains.17 In the second quarter of 2026, infrastructure services revenue reached nearly $1.2 billion, rising over 45%, with data center services accounting for more than $700 million.18
Sulentic outlined targets for the infrastructure portfolio, projecting data center services revenue to grow approximately 25% annually for five years and above 15% as the build cycle matures. Management aims to build a $10 billion infrastructure franchise generating more than $1 billion in EBITDA by 2030.18 Sulentic compared this secular expansion to CBRE's initial shift into corporate outsourcing during the 1990s and 2000s, characterizing it as "at least as profound... and much faster."19
This ambition represents CBRE's primary growth initiative, tying enterprise performance directly to institutional technology capital expenditure cycles.
XI. Competitive Landscape & Industry Dynamics
Analyzing the competitive landscape reveals a clear industry asymmetry: commercial real estate services is simultaneously one of the most concentrated and one of the most fragmented sectors in the economy, depending on the customer segment being served.
At the enterprise level, the market functions as a duopoly-plus. CBRE, with $40.6 billion in 2025 revenue, and Jones Lang LaSalle (JLL), with $26.1 billion, stand as the only two global providers capable of offering a full suite of service lines to Fortune 100 occupiers across all major markets.221 JLL remains a direct competitor, expanding 2025 revenue by 11%, adjusted EBITDA by 22% to $1.45 billion, and adjusted EPS by 33% to $18.80.21 Cushman & Wakefield generated $10.3 billion in total revenue and $7.1 billion in fee revenue in 2025—up 9%—while focusing on debt reduction following its 2015 merger with DTZ.22 Colliers operates a decentralized structure with expanding investment management operations, generating $5.6 billion in revenue and $732.5 million in adjusted EBITDA in 2025.23 Newmark, heavily weighted toward brokerage, led peer percentage growth with 2025 revenue rising 20.3% to $3.3 billion by aggressively recruiting top producers.24 Marcus & Millichap focuses on private-client retail and multifamily transactions, while Eastdil Secured operates as a specialized boutique in large capital markets assignments.
Threat of new entrants: low at the top, high at the bottom. Constructing a global platform requires substantial capital, complex software integration, regulatory compliance across more than 100 countries, and global procurement scale. CBRE has deployed over $5 billion in M&A and capital expenditures in its Building Operations & Experience segment alone to build its platform.17 At the local level, however, barriers to entry are minimal: a new brokerage requires little more than experienced brokers and basic office infrastructure. Consequently, the industry features thousands of local competitors alongside only two global multi-service platforms. This dynamic makes local facilities management—CBRE's fastest-growing outsourcing area—a continuous battle for market share rather than a protected monopoly.
Buyer power: it depends on the contract. In individual property transactions, clients maintain significant leverage. Brokerage services are largely commoditized at the firm level, where individual talent serves as the primary differentiator, fees are transparent, and multiple firms compete for major assignments. In integrated enterprise facilities management, leverage shifts toward the incumbent due to substantial operational transition risks, such as potential disruptions to trading floors, research labs, or data centers. However, institutional clients mitigate this advantage by negotiating open-book pricing and fee benchmarking clauses, constraining operating margins across the segment.
Supplier power: the brokers. Broker leverage represents a significant cost pressure within the industry, as reflected on CBRE's balance sheet. The firm carries $697 million in related-party loans—comprising forgivable sign-on bonuses, retention incentives, and prepaid commissions—to retain top producers.3 Competitors like Newmark explicitly target these producers for recruitment. Asked in April 2026 whether platform scale would eventually reduce broker commission splits, Chief Executive Bob Sulentic acknowledged, "The answer has always been no. The real value in that business comes from that creative strategic thinking."19 His comment highlights that in Advisory Services, key revenue generation remains tied to individual talent rather than institutional infrastructure, placing a natural ceiling on the margin share CBRE can extract from brokerage fees.
Threat of substitutes: the AI question, argued both ways. A primary downside thesis suggests that artificial intelligence could automate analytical tasks—such as market research, property comparables, lease abstraction, financial modeling, and valuations—compressing fees and allowing tech-enabled platforms to intermediate transactions. On the July 2026 earnings call, analyst Jade Rahmani questioned whether AI tools might enable corporate clients to unbundle facility management contracts and reduce the scope of outsourced services.18
Sulentic responded with a two-part defense. Regarding brokerage, he noted that operating expenses consist predominantly of broker commissions rather than analytical overhead, arguing that automating research does not eliminate transaction fees: "if you really know how that business works, the vast majority of what we spend in that business goes to our brokers."19 Regarding facilities management, he pointed out that over 85% of enterprise facilities personnel work directly on client sites, performing physical tasks that digital models cannot replicate.17 Addressing technology disruptors directly, Sulentic added, "I would ask them to show you their revenue stream and see what you get."19
An independent assessment indicates a middle ground. Near-term substitution risk in physical property management and complex commercial transactions remains low. CBRE's disclosures indicate that transactions under $2.5 million account for roughly 3.5% of U.S. sales volume, while deals under $1 million represent about 6% of U.S. leasing volume, confirming that smaller, easily automated transactions form a minor portion of total activity.17 Furthermore, expanding AI infrastructure capital expenditure currently provides a net revenue tailwind for CBRE's project and facilities management lines. However, management's positioning overlooks potential internal efficiency shifts. CBRE is simultaneously targeting a 25% reduction in its own HR and shared-services expenses through AI implementation.17 If corporate clients achieve similar administrative savings internally, their outsourcing requirements and contract pricing may face downward pressure during future renewals. The primary risk is not sudden disintermediation, but gradual pricing and scope compression during multi-year contract renewals.
Rivalry: high, and rational. Major competitors compete aggressively for enterprise accounts primarily on operational capability rather than price discounting, as underbidding multi-year facilities contracts risks locking in sustained losses. Competition is most intense within Advisory Services, where firms compete directly for key broker talent through guaranteed compensation structures.
XII. Helmer's 7 Powers Analysis
Hamilton Helmer's framework asks a demanding question: does a business possess a structural condition that generates differential returns while remaining durable against competitor arbitrage? Applied to CBRE, two of the seven powers are clearly present, one is real but bounded, and one frequently claimed by market observers does not withstand scrutiny.
Scale economies — present, and the primary power. CBRE spreads the fixed costs of a global research and data infrastructure, a compliance framework across more than 100 countries, and enterprise technology platforms over a $40 billion revenue base. Its Broker Platform integrates roughly 600 billion data points from more than 30 sources—a fixed investment no regional firm can amortize.17 In procurement, purchasing HVAC equipment, electrical services, janitorial contracts, and security services across 8.5 billion square feet yields unit costs that regional providers cannot match.17 The proof point is platform breadth: CBRE's June 2026 investor presentation claims full coverage across nine of 11 core business lines, compared to partial or no coverage across those lines for JLL, Newmark, Cushman & Wakefield, Colliers, Walker & Dunlop, and Savills.17 While that comparison reflects company-selected metrics, the underlying top-line revenue gap between CBRE and every competitor is independently verifiable.
The limitation on this power is that scale economies in a labor-intensive service business are inherently weaker than in software. Doubling revenue in facilities management requires a proportional increase in frontline headcount. The cost savings are real but incremental—as reflected in the 70 basis points of operating leverage achieved in Building Operations & Experience over two years.17
Switching costs — present, bounded, and under-evidenced. The mechanism driving switching costs is operational entanglement in enterprise facilities management. However, these costs apply meaningfully only to integrated corporate relationships, which generate a minority of CBRE's total revenue. A brokerage client faces virtually no switching cost, while a property management client faces moderate friction. Only the integrated enterprise facilities client experiences high switching costs. Moreover, because CBRE does not publish customer retention metrics, the precise magnitude of this switching cost remains an inference rather than a disclosed fact.
Counter-positioning — claimed, but does not apply. Counter-positioning requires that an incumbent be unable to respond to a challenger because doing so would damage its existing core business model. CBRE's integrated services structure does not fit this definition. Primary competitor JLL offers a substantially similar integrated platform and executes it effectively, while Colliers maintains a decentralized structure by strategic choice rather than structural constraint. No established competitor faces a business-model dilemma that prevents it from offering unified services; the barrier to matching CBRE is simply capital and time—which is scale economies restated. Characterizing this advantage as counter-positioning misapplies the framework and inflates the firm's competitive moat.
Process power — plausible, with a documented failure mode. Repeatedly integrating major acquisitions without disrupting the acquired organization is exceptionally difficult, and CBRE has demonstrated this capability across numerous transactions, including Insignia, Trammell Crow, Global Workplace Solutions, Turner & Townsend, Norland, J&J Worldwide, Direct Line Global, and Pearce.17 Turner & Townsend's top-line revenue compounding at more than 20% annually under CBRE ownership serves as strong evidence, as acquired professional services businesses often experience growth deceleration.14 However, process power must be evaluated across all transactions rather than just successful ones: the same acquisition framework produced the pro-cyclical timing of the Trammell Crow purchase and the unpriced legacy liabilities of Telford Homes. The more accurate conclusion is that CBRE possesses strong operational integration capabilities alongside a mixed track record in risk-pricing balance-sheet acquisition targets.
Cornered resource — absent. CBRE possesses no proprietary patents, exclusive licenses, or irreplaceable physical assets. Its most valuable asset is its talent pool, whose members remain free agents requiring $697 million in capitalized loans to retain.3 The firm's proprietary data—promoted in its June 2026 presentation as "more real estate data than any company in the world"—represents its closest potential cornered resource, but data compiled from more than 30 sources can eventually be replicated by a well-capitalized competitor.17
Net assessment. Evaluating CBRE through Helmer's framework reveals a durable but bounded competitive moat: scale economies that compound incrementally, switching costs constrained to specific enterprise contract types, and proven operational integration capabilities. This combination supports above-average returns and steady market-share gains without establishing a permanent or widening competitive advantage. Management's long-term target of low-to-mid-teens core earnings-per-share growth through economic cycles—aligned with its 14% compound annual rate since 2012—reflects the realistic scope of this edge.17
XIII. Investment Story Spine: Bull vs. Bear Case
Why CBRE wins from here.
The strongest bull argument rests not on the percentage mix of resilient revenue, but on the expansion of its underlying dollar floor. Resilient segment operating profit grew from $1.61 billion in 2022 to $1.73 billion in 2023, $1.99 billion in 2024, and $2.28 billion in 2025.17 Crucially, it expanded straight through 2023, the most severe downturn for commercial property transactions since 2009. That performance validated the primary premise of the firm's post-2010 strategic pivot. The bull case does not require resilient services to represent a growing share of total revenue; it merely requires those contracted earnings to continue compounding in absolute dollars—a far lower and better-evidenced threshold.
The second pillar is CBRE's differentiated exposure to infrastructure and data centers. CBRE is the only global real estate services firm operating across the full lifecycle of these assets in all four reporting segments: brokering land and leases, entitling and developing sites, managing construction programs, and operating completed facilities.17 Chief Executive Bob Sulentic highlighted this integration on the July 2026 earnings call, noting, "I don't think I ever remember us being involved in any area of our business where the revenue synergies were as great as they are in the data center business."18 Crucially, more than half of data center revenue originates downstream from recurring management, refitting, and facility operations, providing contracted income streams independent of new construction activity.18
Third, ongoing industry consolidation favors market leaders. Multinational corporate occupiers and institutional property owners have spent two decades streamlining vendor lists, a structural trend that CBRE explicitly cites in its Form 10-K as a core competitive advantage.3
Fourth, balance-sheet discipline preserves strategic optionality. With net leverage maintained below 2.0x, $4.4 billion in total liquidity, approximately $1.7 billion in annual free cash flow, and $4.9 billion in remaining share repurchase authorization, the enterprise retains substantial capacity to execute opportunistic acquisitions or buybacks during cyclical downturns.13
What breaks the case.
The bear case does not dispute CBRE's operational quality; rather, it contends that several load-bearing assumptions mistake cyclical recoveries for permanent structural shifts.
The infrastructure expansion depends heavily on hyperscaler capital expenditure. Data centers generated approximately 15% of 2025 core EBITDA and continue to expand far faster than the broader enterprise.17 Management's five-year target of 25% annual growth in data center services implies sustained expansion; however, if artificial intelligence capital spending slows—whether due to power shortages, water availability, supply chain bottlenecks, labor scarcity, or local regulatory hurdles detailed by management in July 2026—the primary driver of premium segment growth would decelerate.18 While downstream facility management provides recurring revenue, the broader growth trajectory remains tied to an unprecedented technology buildout.
Office market improvement represents a cyclical recovery rather than a structural reset. Second-quarter 2026 global leasing revenue growth of 24% reflects strong rebound activity, yet U.S. leasing volumes remain below 2019 levels.18 Management's assertion that hybrid work patterns have stabilized is supported by observed deal behavior—specifically that average office lease lengths have not shortened relative to pre-pandemic baselines.19 However, returning toward historical transaction levels reflects a cyclical recovery rather than a permanent expansion of the market, and management's 2027 guidance explicitly assumes Advisory growth will moderate.18
Development liabilities present ongoing balance-sheet risks. The recurring remediation adjustments in the Telford Homes unit demonstrate that development-adjacent businesses carry exposure to long-tail legal and regulatory liabilities that standard acquisition due diligence may fail to uncover.
Broker compensation pressures constrain Advisory margins. Management has reiterated that it will not reduce commission splits for top producers amid intense recruitment competition from rivals such as Newmark and Jones Lang LaSalle. During cyclical recoveries, guaranteed compensation packages for high-performing teams escalate, as reflected in the $697 million in employee retention loans carried on CBRE's balance sheet.3
Flexible workspace models remain untested through an economic downturn. Industrious has expanded under CBRE ownership, but its operating model has yet to be stress-tested by a severe contraction in office demand.
Investment management capital raising faces near-term headwinds. Second-quarter 2026 capital raising of $1.6 billion fell short of internal targets, with management citing investor caution in the Middle East.18 Because management fee income depends directly on total assets under management, sluggish fundraising limits fee expansion.
The honest synthesis. CBRE represents a market-leading enterprise with a structurally higher earnings floor than during the 2008 financial crisis. However, its current growth rate reflects two concurrent cyclical tailwinds: a recovery in commercial property transactions and an acceleration in technology infrastructure spending. While the firm's structural expansion into recurring services is well-established, its recent growth rate exceeds its long-term baseline. Management's 2027 guidance targeting core EPS growth of "at least 15%"—compared to its low-to-mid-teens through-cycle target—reflects an expectation that growth will eventually normalize.1817
XIV. Current Risk Radar & Skeptical Investor Stress Test
Five risks are material enough to alter the investment case. The rest are noise.
One: the cost of capital. Property transaction volumes are a direct function of debt cost and availability. Chief Financial Officer Emma Giamartino offered analysts a specific macro threshold in April 2026: as long as the 10-year U.S. Treasury yield remains between 4.0% and 4.5%, sales and origination activity continues to grow, with only a sharp spike above that range expected to slow momentum.19 By July 2026, Chief Executive Bob Sulentic flagged choppiness in debt markets and a weak quarter in agency lending, offset by robust private-capital deal flow.18 Interest rates represent the most direct transmission mechanism between macro conditions and CBRE's earnings, operating directly on the roughly 38% of segment operating profit derived from transactions.
Two: the Telford remediation tail. As detailed in Section VIII, the primary concern is not merely the $321 million balance-sheet liability carried into 2026 along with the subsequent $168 million charge. Rather, the risk lies in regulatory scope expansion, combined with Form 10-K disclosures acknowledging that unexpected physical findings during remediation work remain an ongoing uncertainty.3
Three: artificial intelligence as a fee and scope pressure. The core risk is not immediate technology disintermediation, but rather gradual contract scope and pricing compression during multi-year renewals as enterprise clients adopt internal automation tools.
Four: execution risk in the data center build-out. Chief Executive Bob Sulentic highlighted several physical and operational bottlenecks limiting data center expansion, including local development resistance, power availability, water access, supply chain constraints, and a shortage of qualified technical labor.1819 To address the talent bottleneck, CBRE partnered with Meta to recruit, train, and place technical personnel across multiple U.S. markets, placing technicians within CBRE's operational teams as well as third-party competitor platforms.19 Whether this initiative establishes a durable workforce recruiting channel or represents an expensive workaround for broader labor constraints remains to be demonstrated.
Five: operational integration and organizational complexity. CBRE now encompasses four reportable segments: a 70/30 project management joint venture whose chief executive sits on the parent board, an institutional investment manager, a principal property developer, a legacy housebuilder in remediation run-off, and a flexible workspace operator. While multi-faceted operations can generate platform synergies, organizational complexity increases the transparency required for external investment evaluation.
The activist stress test. A skeptical institutional investor or long/short fund manager would raise three core structural challenges to CBRE's leadership team:
"Isn't this a cyclical broker wearing a services costume?" The empirical answer is largely no, supported by financial results rather than executive rhetoric. During the 2023 property market downturn, when commercial transaction volumes fell sharply, resilient segment operating profit expanded, with company disclosures showing overall core earnings surpassing their prior peak within two years of the trough.17 By contrast, during the 2008–2009 financial crisis, total revenue dropped 30% peak-to-trough and the firm absorbed a $1.0 billion net loss.10 These contrasting outcomes demonstrate a structurally higher earnings floor. What remains unproven is whether CBRE can achieve secular growth entirely decoupled from the property cycle: transactional activities still account for roughly 38% of segment operating profit, and the 2025 earnings mix shift toward transaction fees shows that cyclical earnings remain a major component of overall profitability.
"Should CBRE divest Trammell Crow to become a pure-play, capital-light services firm?" Management maintains that principal development serves as a client-acquisition wedge, where constructing an asset secures downstream rights to lease, manage, and oversee ongoing project work, while generating internal rates of return well above the firm's cost of capital.17 A secondary strategic driver is data center infrastructure optionality: Trammell Crow holds land positions with roughly $900 million in embedded gains slated for realization over time.1 Conversely, skeptical investors note that principal development activities produced both the massive goodwill write-downs of 2008 and the ongoing Telford remediation liabilities. Combining capital-intensive development risks with asset-light services can lead equity markets to apply a conglomerate valuation discount. While both arguments have merit, external evaluation is constrained because CBRE does not disclose standalone return on invested capital metrics for Trammell Crow, making management's strategic wedge thesis difficult to independently audit.
"Is the reporting getting easier or harder to trust?" Management executed two significant accounting adjustments over an 18-month period: a corporate segment recast and a fleet amortization reclassification that elevated reported margins in the Building Operations & Experience segment.1918 While executive leadership provided detailed explanations for both changes during earnings calls, multiple presentation adjustments within a short timeframe increase the reporting baseline complexity for analytical tracking.
XV. Key Operating KPIs to Track
Three primary metrics carry most of the analytical weight in evaluating whether CBRE's strategy is succeeding.
1. Resilient segment operating profit in dollars—not as a percentage. The percentage mix naturally expands during property downturns and contracts during transactional recoveries, making it an unreliable benchmark for structural progress. The absolute dollar figure establishes the actual earnings floor. The key question for investors each year is straightforward: did resilient segment profit grow, particularly in years when transaction volumes declined? A year-over-year decline outside of a major divestiture would challenge the core thesis of the firm's post-2011 strategic pivot.
2. Critical infrastructure and data center services revenue growth against management's guidance. Chief Executive Bob Sulentic committed publicly to achieving roughly 25% annual revenue growth in data center services for five years, followed by growth above 15%, alongside an objective of building a $10 billion infrastructure franchise generating more than $1 billion in EBITDA by 2030.18 These targets represent concrete, checkable commitments governing the firm's primary growth initiative. Rather than evaluating individual quarterly results—which are subject to acquisition timing and quarterly seasonality—the critical measure is long-term performance against guidance and the proportion of growth originating from recurring downstream operations versus cyclical construction cycles.
3. Free cash flow conversion within the target range of 75% to 85%. Free cash flow conversion serves as the key discipline metric, verifying whether reported earnings translate into realized cash for an enterprise with substantial pass-through billings and whether operations generate sufficient cash to fund acquisitions. Cash conversion reached 86% in 2025 and stood at roughly 78% on a trailing basis through the first quarter of 2026.1719 Sustained conversion below the target range would indicate potential working capital strain or deteriorating earnings quality long before such issues appear on the income statement.
A fourth item functions as a critical monitoring flag rather than a traditional operating metric: whether Telford fire-safety remediation provisions finally stabilize.
XVI. Epilogue & "If We Were CEOs"
CBRE's 120-year evolution was far from inevitable. Founded as a small partnership after the 1906 San Francisco earthquake, the firm survived an ill-fitting conglomerate parent, a management buyout during an early-1990s real estate collapse, a subsequent leveraged buyout, strict debt covenant restructuring during the 2008 financial crisis, and substantial equity dilution—ultimately emerging as the commercial real estate industry's largest global player, generating top-line revenue roughly 1.6 times that of its nearest rival.
Looking forward, four strategic priorities emerge from historical performance and empirical disclosures rather than executive ambition.
Disclose client retention metrics. The primary reporting gap in CBRE's investment case remains the verifiable durability of its enterprise facilities relationships. Disclosing official contract renewal rates, average contract tenure, and net revenue retention within the Building Operations & Experience segment would transform an operational inference into a verified fact. If contract stickiness is as robust as management suggests, providing these metrics would validate the switching-cost thesis and strengthen investor confidence in the segment's underlying moat.
Restrict principal balance-sheet exposure. Over two decades, development-focused acquisitions have twice introduced substantial, unforeseen balance-sheet liabilities—first through major goodwill impairment charges following the Trammell Crow purchase, and more recently through expanding fire-safety remediation reserves at Telford Homes. While principal development serves as a useful client-acquisition wedge, expanding owned-asset exposure increases downside risk. Management generates its highest returns on capital when allocating funds to technical services and project management bolt-on acquisitions—such as Pearce Services, Direct Line Global, and J&J Worldwide—where the underlying asset is an operational capability rather than a physical building.17
Distinguish AI efficiency programs from structural technology moats. CBRE's targeted 25% reduction in human resources and shared-services expenses represents a concrete internal efficiency initiative with a clear cost-savings payback.17 Concurrently, accelerating data center expansion provides an external revenue tailwind driven by broader technology investment. Neither trend constitutes a defensible technology moat. However, a durable product advantage could emerge by applying artificial intelligence to predictive maintenance and energy management across the 8.5 billion square feet the firm manages—where CBRE possesses proprietary operational data that competitors cannot easily match. Developing this capabilities platform merits prioritized capital investment.
Acknowledge ongoing cyclical sensitivity. While management emphasizes structural resilience, transaction-based activities still account for roughly 38% of segment operating profit, leaving earnings exposed to broader real estate cycles. Furthermore, mid-2026 growth reflects two concurrent cyclical tailwinds: a recovery in property sales and leasing alongside accelerated infrastructure spending. Management's through-cycle guidance targets low-to-mid-teens core earnings-per-share growth rather than recent quarter peaks of 25% or more. The gap between through-cycle targets and recent short-term performance highlights the cyclical risk investors assume when pricing current earnings.
CBRE's evolution from a regional brokerage into a global operating platform represents one of the significant corporate transformations in modern commercial services—built over three decades by acquiring contracted revenue streams, at times paying full valuations or absorbing unexpected liabilities along the way. Whether the enterprise delivers market-outperforming returns over the coming decade depends less on its competitive moat than on two external macro forces: the cost of capital, which governs commercial transaction volume, and the pace of global technology infrastructure deployment. Neither variable rests within executive control, and management's strategy reflects an awareness of those external limits.
References
-
CBRE Group, Inc. Reports Financial Results for Q2 2026 — CBRE Group, Inc. Investor Relations, 2026-07-29 ↩↩↩↩↩↩↩↩↩↩↩↩↩↩↩↩↩↩
-
CBRE Group, Inc. Reports Financial Results for Q4 and Full Year 2025 — CBRE Group, Inc. Investor Relations, 2026-02-12 ↩↩↩↩↩↩↩↩↩↩
-
CBRE Group, Inc. Form 10-K for the fiscal year ended December 31, 2025 — U.S. Securities and Exchange Commission ↩↩↩↩↩↩↩↩↩↩↩↩↩↩↩↩↩
-
Bob Sulentic, Chair and Chief Executive Officer — CBRE Group, Inc. ↩↩↩↩↩
-
CB Commercial Real Estate Services Group, Inc. — International Directory of Company Histories, via Encyclopedia.com ↩↩↩↩↩↩↩↩↩↩↩↩↩
-
CB Commercial Real Estate Services Group Inc., Form 8-K (REI Limited acquisition) — U.S. Securities and Exchange Commission, 1998 ↩↩
-
Press Release: CB Richard Ellis to Acquire Insignia Financial Group — CBRE Group, Inc. Investor Relations, 2003-02-18 ↩↩
-
Press Release: CB Richard Ellis Group, Inc. Announces Initial Public Offering — CBRE Group, Inc. Investor Relations, 2004-06 ↩
-
Press Release: CB Richard Ellis Completes Acquisition of Trammell Crow Company — CBRE Group, Inc. Investor Relations, 2006-12-20 ↩
-
CB Richard Ellis Group, Inc. Form 10-K for the fiscal year ended December 31, 2009 — U.S. Securities and Exchange Commission, 2010-03-01 ↩↩↩↩↩↩↩↩↩
-
CBRE Group, Inc. Completes Acquisition of ING Real Estate Investment Management Operations in Europe — Business Wire, 2011-10-31 ↩
-
CBRE to purchase Johnson Controls' Global WorkPlace Solutions business for $1.475 billion — PR Newswire / Johnson Controls, 2015-03-31 ↩
-
CBRE Completes Acquisition of Majority Interest in and Strategic Partnership with Turner & Townsend — CBRE Group, Inc. Investor Relations, 2021-11-02 ↩↩
-
CBRE Group Completes Turner & Townsend/Project Management Combination; Vincent Clancy Joins CBRE Board of Directors — CBRE Group, Inc., 2025-01-03 ↩↩↩↩
-
CBRE Group to Acquire Industrious, Create New Business Segment — CBRE Group, Inc. Investor Relations, 2025-01-14 ↩↩
-
CBRE Completes Acquisition of Telford Homes Plc — CBRE Group, Inc. Investor Relations, 2019-10 ↩↩
-
CBRE Investor Overview, June 2026 — CBRE Group, Inc. ↩↩↩↩↩↩↩↩↩↩↩↩↩↩↩↩↩↩↩↩↩↩↩↩↩↩↩↩↩↩↩↩↩↩↩↩↩↩
-
CBRE Group, Inc. (CBRE) Q2 2026 Earnings Call Transcript — The Motley Fool, 2026-07-29 ↩↩↩↩↩↩↩↩↩↩↩↩↩↩↩↩↩↩↩↩↩↩↩↩↩↩↩↩↩
-
CBRE Group, Inc. (CBRE) Q1 2026 Earnings Call Transcript — The Motley Fool, 2026-04-23 ↩↩↩↩↩↩↩↩↩↩↩↩↩↩↩↩↩↩↩
-
CBRE Group, Inc. Definitive Proxy Statement (Form DEF 14A) for the 2026 Annual Meeting — U.S. Securities and Exchange Commission, 2026-04-03 ↩↩↩↩
-
JLL Reports 2025 Financial Results for Fourth Quarter and Full Year — Jones Lang LaSalle Incorporated Investor Relations, 2026 ↩↩↩
-
Cushman & Wakefield Reports Financial Results for the Fourth Quarter and Full Year 2025 — Cushman & Wakefield plc, 2026-02 ↩↩
-
Colliers Reports Fourth Quarter and Full Year 2025 Results — Colliers International Group Inc., 2026-02-13 ↩↩
-
Newmark Reports Fourth Quarter and Full Year 2025 Financial Results — PR Newswire / Newmark Group, Inc., 2026 ↩↩
-
CBRE Holding, Inc. Form 10-K for the fiscal year ended December 31, 2002 — U.S. Securities and Exchange Commission ↩
-
CB Richard Ellis Group, Inc. Announces Agreement to Acquire Trammell Crow Company — Business Wire, via Houston Chronicle, 2006-10-31 ↩
-
CB Richard Ellis Group, Inc. Form 10-K for the fiscal year ended December 31, 2007 — U.S. Securities and Exchange Commission ↩↩
-
CB Richard Ellis Group, Inc. Form 8-K investor presentation on credit agreement amendment and cost containment — U.S. Securities and Exchange Commission, 2009 ↩↩
 LinkedIn
 WhatsApp
 Reddit
 Hacker News
 Email
Email Kindle
 RSS Feed
 Spotify
 Apple Podcasts
 Amazon Music
 Audible
 YouTube