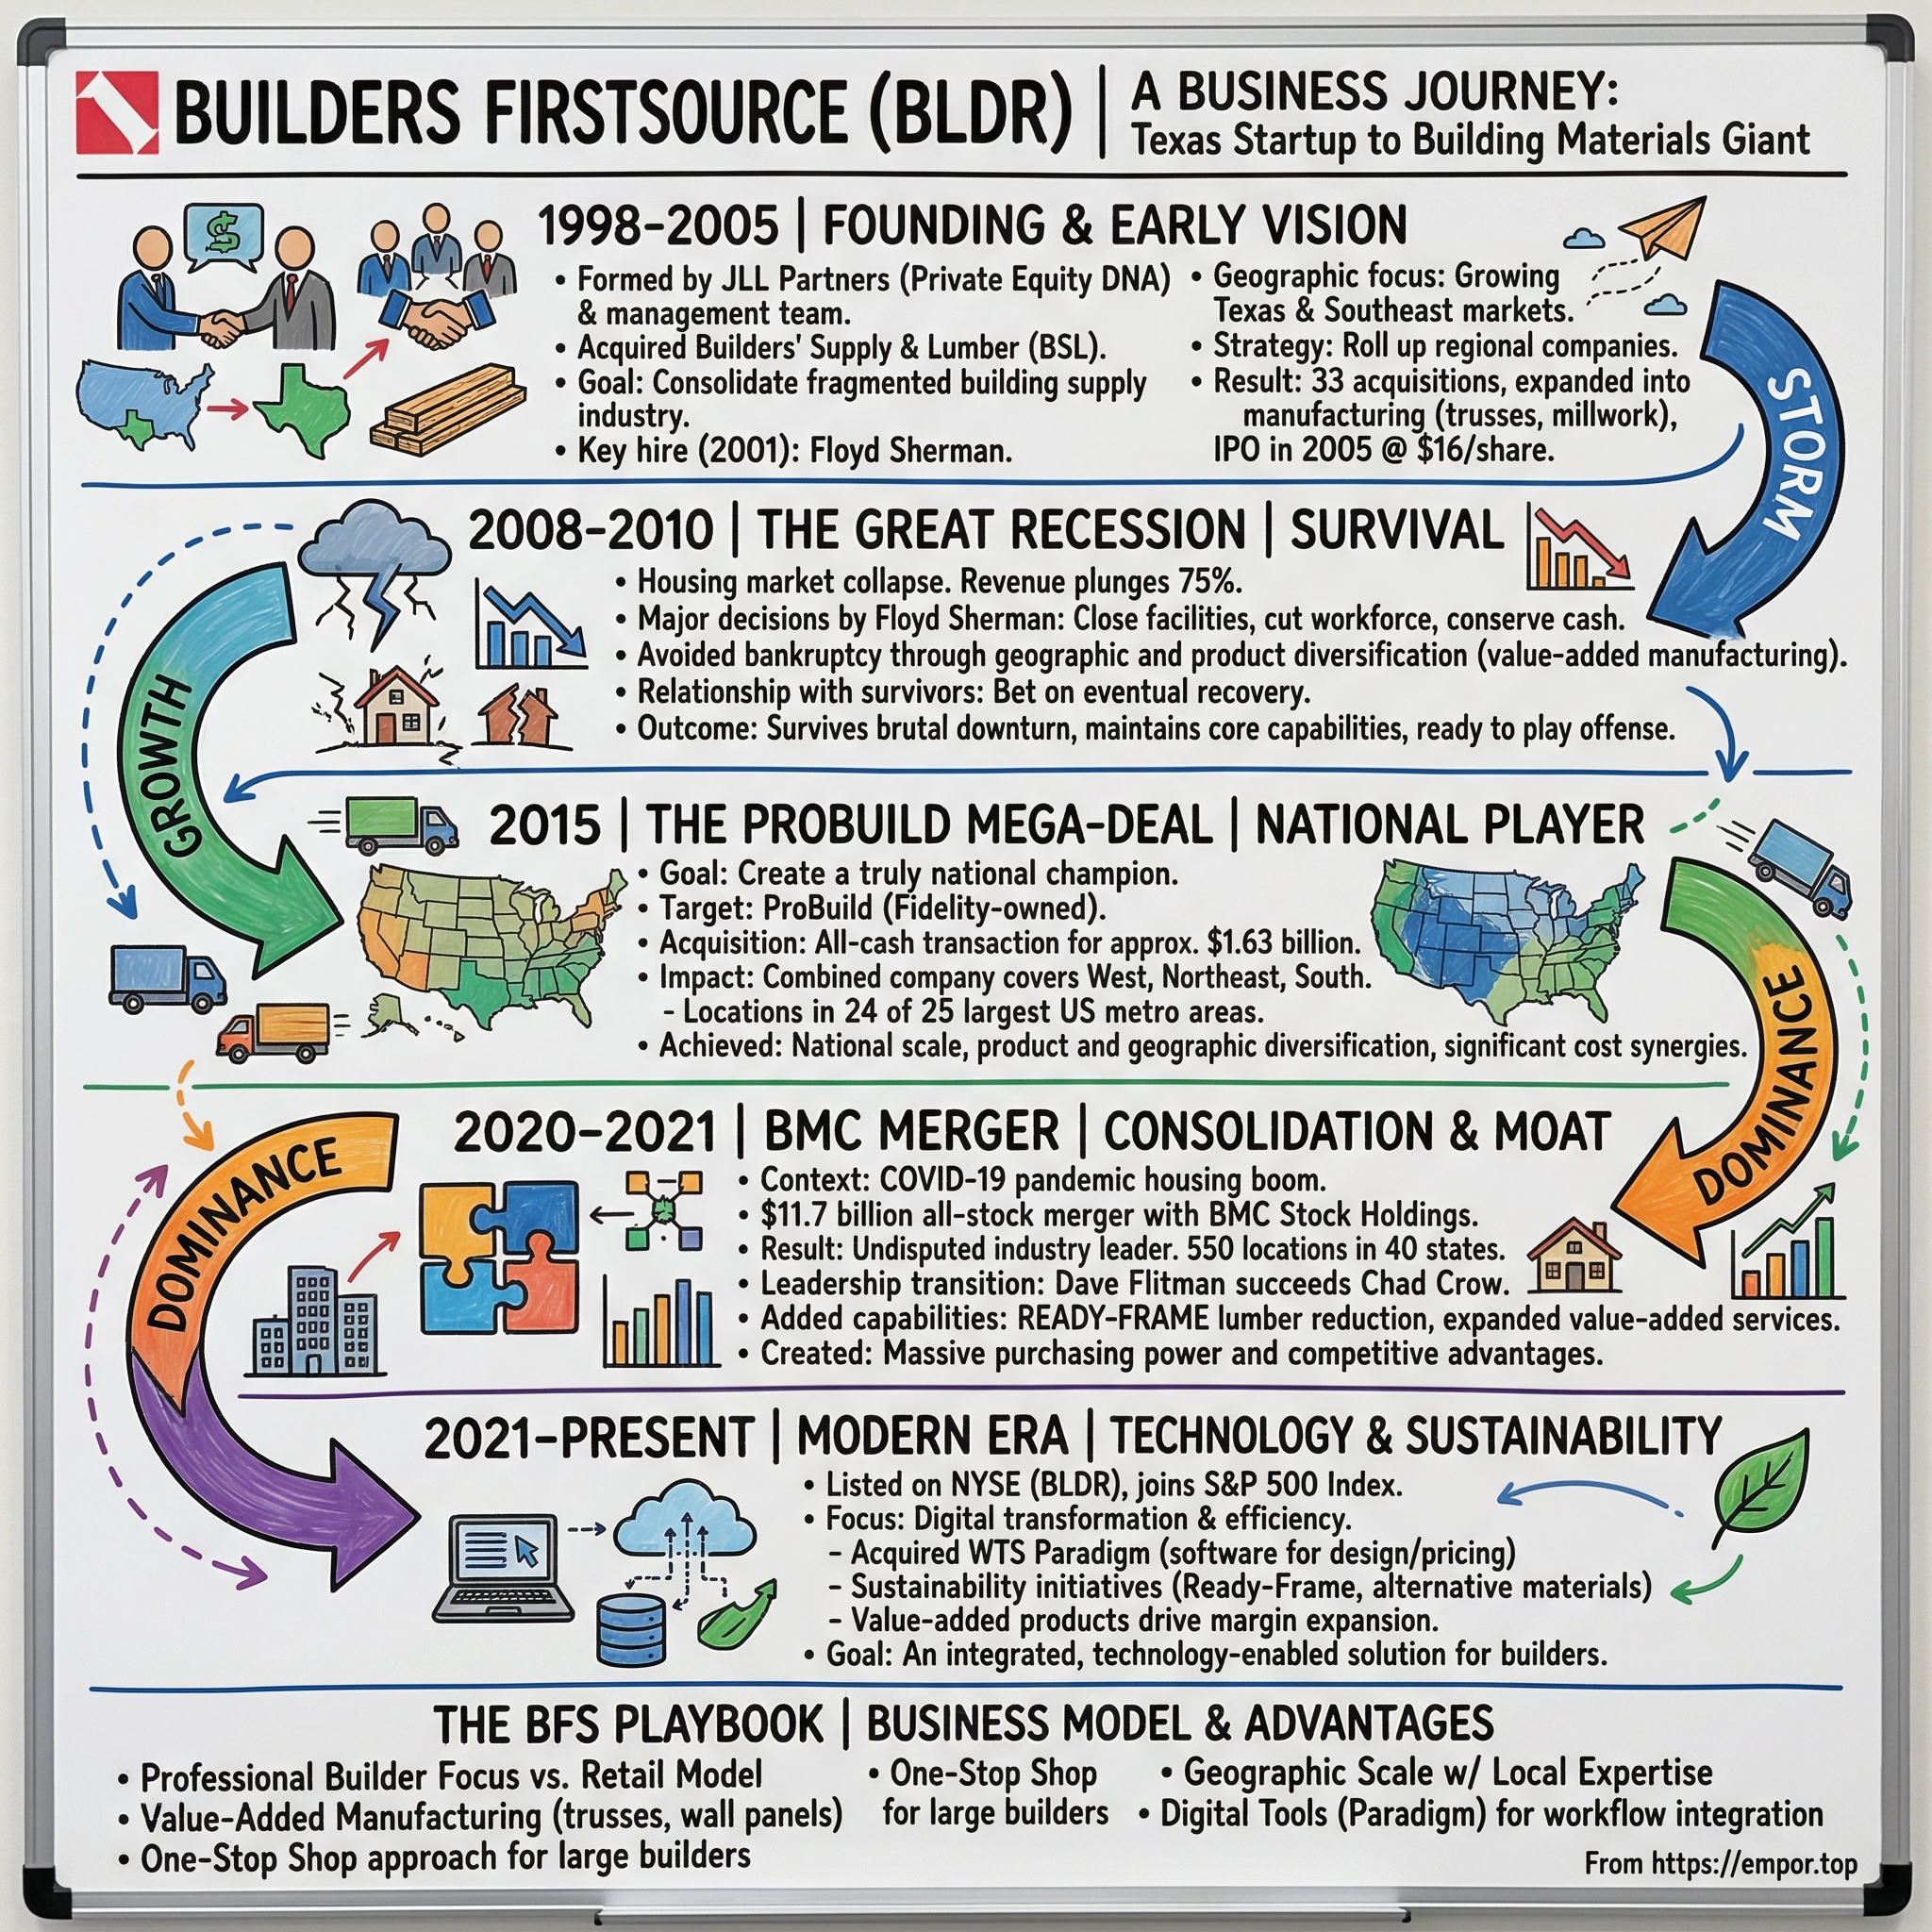
Builders FirstSource: From Texas Roll-Up to America's Building Materials Giant
I. Introduction & Episode Context
Drive an hour outside Dallas, Phoenix, or Charlotte, and you will eventually pass a fenced yard the size of several football fields: stacks of dimensional lumber wrapped in blue plastic, a row of flatbed trucks with articulated cranes bolted behind the cab, and — set back from the road — a long metal building where a machine the length of a bowling alley presses steel connector plates into wooden roof trusses at a rate of one every few minutes. There is no signage worth photographing and no consumer brand. There is simply a large volume of wood moving through a carefully sequenced process, bound for a subdivision under development.
Multiply that yard across roughly 585 locations in 43 states, and you have Builders FirstSource. The company operates in 48 of the top 50 and 94 of the top 100 U.S. Core Based Statistical Areas ranked by single-family permits, establishing a presence across virtually every major homebuilding market in the country.1 It is the largest supplier of structural building products to professional homebuilders in the United States, and it is currently navigating a steep cyclical downturn.
Two Companies, One Ticker
Here is the central tension in 2026. In 2022, at the peak of the pandemic housing boom, Builders FirstSource generated $22.7 billion in net sales and $2.7 billion in net income, with an adjusted EBITDA margin of 19.3% — financial results more typical of tech platforms than traditional building material suppliers.11 Four years later, in the second quarter of 2026, the company reported net sales of $3.9 billion, a gross margin of 28.1%, an adjusted EBITDA margin of 8.5%, and a GAAP net loss of $3.9 million.2 The share price, which touched $151 within the past year, traded in the mid-$60s in late August 2026, leaving the company with a market capitalization of roughly $7 billion.319
Which performance reflects the true underlying business? That question forms the core investment debate. The bull case holds that Builders FirstSource is no longer just a lumber distributor — that a decade of acquisitions transformed it into a manufacturer of factory-built house components with a higher structural margin, leveraging scale in purchasing, logistics, and software to maintain a durable cost advantage over independent competitors. The bear case argues that margin expansion was largely cyclical, that the value-added mix shift is smaller than advertised, and that a business tied directly to U.S. single-family housing starts cannot escape industry cycles regardless of its component manufacturing capabilities.
The company's disclosures offer evidence for both perspectives. Value-added products — manufactured components alongside windows, doors, and millwork — accounted for 47.7% of 2025 net sales, representing a significant increase over legacy levels from a decade earlier.1 Yet gross margin contracted from 32.8% in 2024 to 30.4% in 2025, and further to 28.1% by the second quarter of 2026, closely tracking the broader decline in housing starts.12 Higher-value product mix provided partial support, but could not fully offset broader cyclical pressures.
What This Story Has to Explain
What follows is the company's full evolution: a private equity carve-out in 1998 that rolled up 23 companies before encountering severe distress in 2009; two major mergers, in 2015 and 2021, that multiplied the size of the business; a commodity windfall that funded significant share repurchases; a $450 million software investment that management subsequently narrowed; and an executive transition in which a long-serving CFO assumed the chief executive role just as market conditions deteriorated. Along the way, this analysis evaluates management's strategic claims against the company's operational record — particularly given that Builders FirstSource faced a similar severe downturn during the 2008 housing collapse that brought it close to bankruptcy.
One common myth warrants addressing at the outset. A widespread narrative suggests Builders FirstSource simply "won the lumber boom" through fortunate timing when lumber prices surged. The historical sequence indicates a different driver: the company's key strategic move occurred in August 2020 via a balance sheet and capital structure refinancing executed prior to the commodity price surge. The market windfall was external; the capital allocation choices made before and after represent the primary subject for evaluation.
A counter-argument claims the company remains a standard distributor whose gross margins will eventually revert to the high-teens levels seen before its major mergers. The 2025 results complicate that view. Even during a year marked by declining single-family starts and operational contraction, gross margin remained above 30%, several percentage points higher than the company's 2019 baseline.116 The underlying reality lies between these two extremes.
The narrative begins with a lumber division that builder Pulte no longer wished to operate.
 Subscribe on LinkedIn
II. Private Equity Foundations & The 2008 Near-Death Crisis (1998–2014)
In 1998, a New York buyout firm called JLL Partners, then managing about $2.2 billion, backed a group of building-products executives to take over a lumber and components operation that the homebuilder Pulte had been running as a captive supplier. The vehicle was incorporated in Delaware as BSL Holdings, Inc.; on October 13, 1999, it took the name Builders FirstSource.1 The founding logic was straightforward and, in the late 1990s, fashionable: professional building materials supply was one of the most fragmented industries in America, dominated by family-owned yards with no purchasing scale, no professional systems, and owners approaching retirement. Buy them, standardize them, and the arbitrage between a local multiple and a national multiple does the rest.
It is worth pausing on how ordinary that idea was, and how many firms tried it. The reason this particular attempt is still standing twenty-eight years later is not that the strategy was novel. It is what happened when the strategy met its first real test.
The Roll-Up That Worked
For seven years the playbook worked exactly as drawn. By the time the company filed to go public, it had acquired and integrated 23 companies, and JLL affiliates controlled 94.6% of the equity.4 On June 22, 2005, Builders FirstSource priced its initial public offering on the Nasdaq National Market at $16.00 a share, selling 12.25 million shares for gross proceeds of $196 million — of which the company itself kept $111.6 million before expenses, with the balance going to selling stockholders.4 The company had sales of $2.14 billion in 2005, concentrated in the South and East, with prefabricated components, windows and doors alongside plain dimensional lumber.5
The timing was, in retrospect, close to the worst possible. 2005 was the top.
The Collapse, Measured Honestly
What happened next is the single most important piece of evidence in this entire story, and it deserves to be stated without softening. The thesis at the time — the same thesis the company advances today in different language — was that scale and geographic diversity provide downside protection when housing turns. The record falsifies the strong version of that claim comprehensively.
Sales went from $2.14 billion in 2005 to $2.06 billion in 2006, then $1.47 billion in 2007, then $992 million in 2008, and finally $678 million in 2009.5 That is a 68% peak-to-trough revenue decline in four years. Not a slowdown. An evisceration.
Single-family housing starts in the company's own markets fell approximately 42.7% in 2008 and a further 28.3% in 2009, and the company's revenue fell faster than starts because it was simultaneously tightening credit to avoid writing off receivables from builders that were themselves failing.5
The operating leverage that makes distribution beautiful on the way up is the same leverage that destroys it on the way down. Gross profit dollars collapsed from $545 million in 2006 to $142 million in 2009, while selling, general and administrative expenses — rent on long-term leases, truck fleets, salaried estimators, insurance — could not be cut nearly as fast.5 Losses from continuing operations totaled roughly $180 million across 2008 and 2009 alone.5 Stockholders' equity, which stood at $257 million at the end of 2006, was down to $47 million by the end of 2009.5
The company closed or idled facilities across 2007, 2008 and 2009 and remained liable on the leases for many of them — a detail that tells you how little of a distributor's cost base is actually variable in a real downturn.5
Rescued by Its Own Sponsors
Then came the part that should be permanently attached to any discussion of this company's balance sheet. On August 31, 2009, Builders FirstSource received a proposal from its two largest shareholders — JLL Partners Fund V and Warburg Pincus Private Equity IX — to restructure the company's $275 million of second-priority senior secured floating rate notes and to conduct a common stock rights offering.6 This was not opportunistic financial engineering. It was a rescue. When the rights offering and debt exchange closed in January 2010, funded debt had been cut to $165 million, and the new notes due 2016 carried interest at three-month LIBOR — subject to a 3% floor — plus 10%.5 A company borrowing at a floored double-digit spread is a company the credit markets have priced for possible failure.
Two things follow from this history, and both matter now. First, the sponsors did not walk away; they recapitalized, which is why the equity survived at all. Second, the survival was not a triumph of scale. It was a triumph of concentrated ownership willing to inject capital, plus a footprint small enough to shrink.
Under CEO Floyd Sherman — a career building-products executive who ran the company through the entire boom and bust — the business rationalized its network, held on, and clawed back above $1 billion of sales as starts slowly recovered. By the end of 2009 it operated 55 distribution centers and 51 manufacturing facilities with roughly 2,700 employees, and had a presence in just 17 of the top 50 metropolitan statistical areas.5
The comparison to today is not one-for-one, and the differences run in the company's favor. In 2009 the business was a single-region operator with roughly $678 million of sales, negative operating cash flow pressure, an equity base of $47 million, and notes it could only refinance at a floored double-digit coupon.5 In 2026 it generates positive free cash flow every quarter, holds approximately $1.6 billion of liquidity, and faces no long-term debt maturity until 2030.214 Anyone reaching for the 2009 analogy as a solvency argument is reaching too far.
What survives the comparison is the operating lesson rather than the credit one: fixed costs in yards, plants and truck fleets do not fall as fast as volumes, and no amount of geographic diversification changes that when the driver of demand is national.
The forward-looking version of the test is simple and, in 2026, live: what happens to fixed-cost absorption and interest coverage when single-family starts run persistently below roughly 1.1 million annualized units? The company is running that experiment right now, from a much larger base and with a materially different capital structure. Whether the second run produces a different answer is the question the rest of this story exists to examine.
Because in 2015, with a balance sheet barely healed, Builders FirstSource did something genuinely audacious.
III. The ProBuild Buyout: Distressed Scale at the Bottom of the Cycle (2015)
To understand the scale of the transaction announced on April 13, 2015, consider the relative sizes of the two companies. Builders FirstSource had generated $1.6 billion in revenue in 2014, whereas ProBuild Holdings had generated approximately $4.5 billion.7 Yet the smaller company announced it was acquiring its much larger rival for $1.63 billion in cash.7
ProBuild represented a parallel experiment in industry consolidation, pursuing the same roll-up strategy but with greater capital and less favorable timing. Devonshire Investors, the private equity arm of Fidelity Investments parent FMR LLC, had created ProBuild in 2006 by assembling a national network of lumberyards, component plants, millwork shops, gypsum yards, and retail stores across 40 states.7
Devonshire bought at the top of the housing market and spent the following decade discovering that rapidly acquiring companies does not automatically create an integrated business. ProBuild's operations remained highly decentralized, running on a patchwork of legacy software systems inherited from its acquired yards. As a result, the expected benefits of scale — procurement leverage and fixed-cost absorption — failed to materialize fully.
Those operational friction points explained why ProBuild was for sale and why its valuation was so low. Based on combined 2014 revenues of approximately $6.1 billion, Builders FirstSource paid roughly a quarter of one times the acquired company's sales.7 For a business possessing real estate, vehicle fleets, manufacturing equipment, and working capital, that multiple reflected distressed-asset pricing — achievable only when a seller seeks an exit and a buyer is prepared to assume significant operational integration risk.
Why a $6 Billion Business Cost $1.63 Billion
The strategic logic of the combination was straightforward. The acquisition expanded the company's reach to 40 states and 24 of the top 25 metropolitan statistical areas ranked by single-family permits, instantly converting Builders FirstSource from a regional supplier concentrated in the South and East into a national distributor.7
Management targeted $100 million to $120 million in annual run-rate cost savings within two years of closing, driven by network optimization, procurement reductions, and general and administrative savings, against one-time costs of $90 million to $100 million.7 Chief Executive Floyd Sherman framed the transaction as positioning the firm for its next growth phase as housing recovered, while JLL founder and Chairman Paul S. Levy highlighted the sponsor's long-term involvement, from founding the company in 1998 to taking it public in 2005 and building a platform to professionalize a cottage industry.7 The deal closed on July 31, 2015.
Did the Synergy Math Hold?
Evaluating the post-merger financial results reveals that expected synergies materialized slowly. Top-line expansion was immediate: Builders FirstSource reported $3.56 billion in sales in 2015, reflecting about five months of ProBuild's operations, and reached $6.37 billion in 2016 as the full year annualized. Profitability, however, lagged behind revenue growth. In 2016, despite generating more than $6 billion in sales, the company recorded pre-tax income of just $21.7 million; reported net income of $144 million was elevated primarily by a $123 million tax benefit rather than operational performance. In 2017, net income reached $38.8 million on $7.0 billion in sales — representing a net margin of roughly half of one percent — while annual interest expense totaled $193 million. Only in 2018 and 2019 did net income exceed $200 million annually on a similar revenue base.
Excluding accounting adjustments, the operational reality was demanding: for two full years after acquiring national scale, the company operated near pre-tax break-even while managing more than $6 billion in revenue. This dynamic reflected the structural weight of acquiring a larger competitor using debt.
Cash flows that might otherwise have accumulated or returned to shareholders were absorbed by debt service and the multi-year process of unifying disparate estimating, ordering, and inventory platforms onto common rails. The transaction was funded through a combination of rolled-over secured notes, a new asset-based revolving credit facility, a term loan, and new unsecured notes. This capital structure left the company carrying annual interest expense of over $200 million against operating income that, in 2016, was $236 million.7 Virtually all operating profit went to debt holders during the initial post-merger period.
Had the housing market experienced even a moderate decline in 2016 or 2017, the company's high leverage would have severely strained equity value.
Ultimately, the ProBuild acquisition is best understood not as proof of frictionless synergy extraction, but as a value purchase of distressed scale near an industry trough. The financial returns were real, but they required four to five years to materialize and depended heavily on a sustained housing recovery. The historical record indicates that while acquiring large, distressed competitors at low multiples near a cycle bottom can create substantial long-term value, the payback schedule remains tightly bound to macroeconomic conditions beyond management's control.
Having demonstrated its capacity to integrate an entity nearly three times its size, Builders FirstSource prepared for its next major strategic move — pursuing a transaction that would not require cash capital.
IV. The BMC Mega-Merger & COVID Lumber Super-Cycle (2020–2022)
August 27, 2020 was a strange moment to announce a merger. The country was five months into a pandemic, offices were empty, and nobody yet knew whether Americans would buy houses or hoard cash. Builders FirstSource and BMC Stock Holdings announced they were combining anyway — and structurally, they did it the smart way.
A Merger Paid For in Paper
The terms: BMC shareholders received a fixed exchange ratio of 1.3125 Builders FirstSource shares for each BMC share, leaving legacy Builders FirstSource holders with roughly 57% of the combined company and BMC holders with roughly 43%.8 No cash. No new leverage. The combined entity would carry more than $11 billion of annual sales, approximately 26,000 team members, and a network of 550 distribution and manufacturing locations across 42 states including 44 of the top 50 metropolitan statistical areas.8
Cost synergies were targeted at $130 million to $150 million of annual run-rate savings within three years.8 Chad Crow, who had succeeded Sherman, retired as previously planned; BMC's Dave Flitman took the CEO seat of the combined company.8 The merger closed on January 1, 2021.9
Contrast the financial architecture with 2015 and the strategic maturation is obvious. ProBuild was bought with debt at a cyclical trough and nearly consumed five years of free cash flow. BMC was bought with paper at what turned out to be the base of an enormous upcycle, and the balance sheet was left alone. If you want a single lesson from this company's history, that is it: the currency you use to buy determines how much of the cycle you can survive.
It is worth noting how unusual that discipline was in context. The 2020 merger was announced into maximum uncertainty, at a fixed ratio, with the acquirer's own shares as currency — the moment when most management teams either freeze or reach for debt because equity feels cheap. Doing the opposite is the closest thing in this history to a repeatable institutional strength, and it is the one claim in the bull case that the record affirms without qualification.
There was also genuine industrial content in the fit. BMC brought millwork depth, pre-hung door operations, and — importantly for the later story — the READY-FRAME pre-cut framing system, which the announcement explicitly listed among BMC's contributions.8 Combined, value-added products represented approximately 43% of the merged company's sales at announcement.8 That number is the baseline against which every subsequent mix-shift claim should be measured.
Then the macro did something nobody underwrote.
The Wood Bubble
Sawmills had curtailed production in early 2020 expecting a housing collapse. Instead, Americans locked down, decided they needed more square footage, and started building. The Random Lengths Framing Lumber Composite Price — the industry's benchmark for softwood framing lumber, quoted in dollars per thousand board feet — rose roughly 175% between April and September 2020, setting all-time highs in each of the final nine weeks of that span. In May 2021 it topped $1,500 per thousand board feet, nearly three times the pre-pandemic record. Framing lumber averaged about $550 per thousand board feet in 2020 and nearly $850 in 2021, each an annual record.10
For a company that buys wood, holds it briefly, and sells it, this was a windfall of an almost mechanical kind. When the replacement cost of your inventory rises every week, the material sitting in your yard appreciates between purchase and delivery, and that appreciation lands in gross profit.
Full-year 2022 net sales rose 14.2% to $22.7 billion; net income rose 59.3% to $2.7 billion, or $16.82 per diluted share; adjusted EBITDA rose 43.0% to $4.4 billion; and adjusted EBITDA margin expanded 390 basis points to 19.3%.11 At year-end 2022 the company carried net debt of just 0.7 times trailing adjusted EBITDA.11 For roughly eighteen months, one of the most cyclical businesses in America printed money.
Was the Margin Transformation Permanent?
Here is where the discipline matters, because the claim that circulated at the time — that peak margins proved a permanent structural transformation — is the single most important thing to falsify, and the company's own numbers do the work.
Follow the path down. Net sales fell to $17.1 billion in 2023, then $16.4 billion in 2024, then $15.2 billion in 2025.120 Gross margin, which the company reported at 32.8% for 2024, fell to 30.4% for 2025 and to 28.1% in the second quarter of 2026.12 Adjusted EBITDA margin went from 19.3% at the peak to 8.5% in that same quarter.211 More than half of the peak EBITDA margin evaporated within four years.
On the fourth-quarter 2025 call, CFO Pete Beckmann drew the comparison management prefers — that current gross margin sits meaningfully above the roughly 27% the business earned in 2019 — which is a fair point and is the strongest evidence that the mix shift did something durable.16
But "durable" and "structural" are not the same word. Test it against the mechanism that would actually break the claim: does gross margin hold when volumes fall? It does not. It fell 250 basis points year-over-year in the fourth quarter of 2025 and another 260 basis points in the second quarter of 2026, and in both cases management attributed the decline to the below-normal starts environment and related headwinds — not to commodity accounting.214 That is volume-driven margin compression in a supposedly mix-protected business, which narrows the claim considerably. The honest version reads: the value-added shift and the BMC integration appear to have raised the company's mid-cycle gross margin by several hundred basis points relative to 2019, and that gain has survived a two-year downturn; the 2021–2022 peak, however, was a commodity and scarcity event that has fully reversed. The KPI that settles the remaining question is gross margin percentage measured at a normalized starts level — management's own stated framework, which we will return to.
Before that, it is worth understanding what the machine actually is.
V. Core Business Architecture, Segment Economics & Competitive Landscape
Consider what occurs when a production builder opens a new subdivision of 140 homes outside Charlotte. The builder does not want 140 separate lumber orders. It requires a partner to take the architectural plans, generate a materials list, engineer the roof and floor systems to local building codes, manufacture them off-site, and deliver them to lot 47 on the exact Tuesday the framing crew arrives.
That sequencing challenge forms the core of the business. Builders FirstSource organizes its sales into four main categories, which yielded a balanced split in 2025: manufactured products generated $3.41 billion, or 22.4% of net sales; windows, doors, and millwork brought in $3.84 billion, or 25.3%; specialty building products and services accounted for $4.07 billion, or 26.8%; and dimensional lumber and lumber sheet goods totaled $3.88 billion, or 25.5%.1 The company combines the first two categories into what it terms "value-added products," which together represented 47.7% of 2025 sales.1
What a Truss Plant Actually Sells
Understanding the component manufacturing process clarifies where the company's margin differential originates. A roof truss is a triangulated wooden frame assembled flat in a factory with steel connector plates pressed into the joints, then lifted onto a structure by crane. A wall panel is a pre-framed wall section — containing studs, plates, and openings — constructed horizontally indoors and delivered ready for installation. The READY-FRAME system goes a step further: software processes house plans, calculates the exact lumber required, and automated machinery pre-cuts and labels each piece so framing crews assemble components rather than measure raw lumber on-site. The company notes that the system saves builders time and money while improving job-site safety, folding these sales into the manufactured products category. It does not publish a quantified labor-savings percentage in its annual report, so any specific figure quoted elsewhere reflects external marketing rather than company disclosure.1
A builder pays a premium for these components because skilled framing labor remains a scarce input in U.S. residential construction, and an unfinished house represents inventory financed at the builder's cost of capital. Compressing the framing timeline by even a week improves the builder's return on invested capital by more than the price premium on the manufactured components.
However, this value proposition depends heavily on labor market conditions. In a slack housing market where framing crews are available and builders prioritize cost control over schedule compression, the willingness to pay for time savings declines. This dynamic was evident in 2025, when value-added categories contracted faster than commodity lumber: manufactured products sales dropped 14.4%, compared with a 9.2% decline in lumber and lumber sheet goods.1
Because Builders FirstSource does not disclose gross margins by product line, common industry assumptions that value-added products earn roughly 30% gross margins while commodity lumber yields mid-teens are analytical estimates rather than official disclosures. Company filings confirm the general directional trend: the 10-K notes that higher gross margins are realized on more engineered and customized products, while margins on sales to the largest single-family builders tend to be lower than to smaller builders. Consequently, a mix shift toward high-volume mega-builders creates a margin headwind that partially offsets the value-added tailwind.1
Who Holds the Pricing Power
Customer disclosures show low nominal concentration: the top ten customers accounted for 14% of 2025 net sales, with the single largest customer representing 4% — a roster including major homebuilders such as D.R. Horton, Lennar, Pulte Homes, Toll Brothers, and Meritage Homes.1 This distribution eliminates single-customer reliance.
However, low customer concentration does not translate directly into supplier pricing power. Large production builders consolidate massive purchasing volume, allowing them to exert significant pricing pressure on suppliers, as Builders FirstSource acknowledges in its risk factor disclosures.1
On the supply side, the company's major vendors include established manufacturers such as Boise Cascade, Weyerhaeuser, West Fraser Timber, Specialty Building Products, James Hardie Industries, and MiTek.1 Centralized procurement for commodity wood products is managed under corporate oversight, with company disclosures highlighting that supplier diversity provides purchasing flexibility without reliance on any single mill.1 This operational structure provides negotiating leverage rather than exclusive access to supply.
The Fragmented Field, and a New Consolidator
The industry structure shapes the company's competitive position. According to the 10-K, the building materials market "remains highly fragmented," with competition spanning large national dealers, specialty dealers, home improvement centers, regional distributors, and thousands of independent lumberyards and truss manufacturers.1 Within this landscape, local yard density combined with national purchasing scale gives Builders FirstSource an operational advantage over independent dealers, which typically lack the capital to invest in automated component plants, specialized delivery fleets, or direct mill-volume purchasing.
Industry commentary frequently cites a claim that Builders FirstSource controls roughly 10% of the U.S. single-family structural building materials market. However, the company does not publish an official market share figure, and its description of a fragmented industry spread across multiple sales channels makes any specific percentage an external estimate rather than a corporate disclosure.1
Instead, management tracks an internal share proxy comparing core organic sales growth against lagged housing starts. Under this metric, management estimated that market share was roughly flat in 2025, expanded in the first quarter of 2026, and was maintained in the second quarter of 2026.16 This performance indicates incremental market tracking rather than rapid share gains.
The competitive landscape at the top of the market shifted in early 2026. In February 2026, QXO — an acquisition platform led by former XPO chairman Brad Jacobs — agreed to acquire building products distributor Kodiak Building Partners from Court Square Capital Partners for approximately $2.25 billion. The transaction closed on April 1, 2026, with QXO reporting that the acquisition expanded its addressable market to more than $200 billion within an $800 billion building products distribution sector, advancing a stated goal of reaching $50 billion in annual revenue.18 Asked about the entry on the fourth-quarter 2025 earnings call, Chief Executive Officer Peter Jackson noted that a well-capitalized player highlighting the sector validated its underlying attractiveness, while arguing that QXO's roll-up strategy differed from Builders FirstSource's focus on specialized technical services for professional homebuilders.16
The arrival of a well-funded acquirer alters market consolidation dynamics. For twenty-five years, Builders FirstSource operated as the primary scale consolidator in a fragmented market, acquiring regional yards from private owners at disciplined multiples. It is no longer the sole scale buyer. While this entry does not diminish existing operations, it increases competition for regional acquisitions at a time when Builders FirstSource faces elevated financial leverage and a paused share repurchase program.
Furthermore, an acquisition-driven competitor targeting $50 billion in revenue can alter bidding dynamics for regional distributors. Increased competition for targets could raise transaction multiples or expand the pipeline of sellers evaluating market exits, creating a key strategic variable for the industry over the coming years.
That competitive pressure brings the focus to another initiative management has highlighted for five years to differentiate the company.
VI. Digital Transformation & "Hidden" Business Optionality: WTS Paradigm & myBLDR
In June 2021, with capital from the lumber price surge filling its balance sheet, Builders FirstSource took an unprecedented step for a building materials distributor: it agreed to acquire a software company, structuring the transaction terms to absorb extraordinary deal risk.
On June 28, 2021, the company signed a definitive agreement to acquire WTS Paradigm, LLC — a Wisconsin-based software provider serving building products manufacturers, dealers, and homebuilders — for $450 million.12 Regulatory disclosures revealed an unusual contract structure: to secure exclusivity and compensate Paradigm's owners for forgoing rival bids, Builders FirstSource paid $225 million of the purchase price within three business days of signing, prior to closing. Had the deal failed on antitrust grounds, the company would have owed a termination fee equal to the full purchase price minus that initial payment, with the sellers required to liquidate Paradigm and remit the net proceeds.12 In practice, the buyer assumed virtually all regulatory risk and pre-funded half the transaction price, reflecting a conviction that software capability was vital to its long-term strategy.
What $450 Million Bought
The acquisition brought in-house Paradigm's specialized software suite for drafting, estimating, quoting, and virtual home design — tools that enable manufacturers to configure products like windows, dealers to calculate accurate quotes, and homebuilders to visualize designs.1 Building on this foundation, Builders FirstSource developed myBLDR, a customer-facing platform designed to convert architectural plans into complete product quotes and orders without manual paper takeoffs. The underlying operational process converts two-dimensional blueprints into a three-dimensional model of the home — described by management as a digital twin — from which an itemized, priced material list generates automatically.
The strategic rationale addressed a persistent operational bottleneck: manual estimating consumes significant sales time and introduces errors that disrupt builder construction schedules. Automated estimating allows sales teams to process higher quote volumes with greater accuracy while systematically attaching higher-margin value-added components to quotes that manual processes might default to standard dimensional lumber.
This conversion mechanism represents the primary financial opportunity. While basic quote digitization reduces administrative workload, systematically shifting customer demand from raw commodity lumber to manufactured components alters the product mix toward higher-margin categories.
From Platform Ambition to Sales Tool
Assessing the investment's performance requires separating operational claims from financial results. At acquisition, Paradigm was projected to generate approximately $50 million in annual revenue, placing the $450 million purchase price at roughly nine times sales at the peak of the software valuation cycle. Because Builders FirstSource does not report Paradigm's standalone financials in its 10-K filings, describing it only qualitatively as a software subsidiary, investors cannot independently verify whether the initial outlay has delivered an acceptable return.1
Instead, the company reports platform activity metrics that track processing volume rather than incremental revenue. In May 2024, management set a target of achieving $1 billion in digital sales by 2026; by February 2025, the company reported that the platform had processed $1 billion in orders, including $134 million characterized as incremental sales from new and existing customers.16 By the fourth-quarter 2025 earnings call, management reported that cumulative quote processing had reached nearly $7 billion since its early-2024 launch — representing a year-over-year increase exceeding 130% — and previewed upgraded solutions.16 In the first quarter of 2026, the platform processed nearly $800 million in quotes, with management outlining a planned four-hub platform — encompassing community, plan, selections, and construction capabilities — accessible through mybldr.com with embedded AI features.16
However, management messaging shifted three months later. On the second-quarter 2026 earnings call, Chief Executive Officer Peter Jackson stated that the company was "sharpening our focus" on digital initiatives by prioritizing sales-team effectiveness, customer connectivity, and "practical, scalable capabilities" based on "what we have learned from our AI and digital investments to date."16 While framed as strategic focus, the statement signaled a deliberate narrowing of scope: transitioning the digital initiative from an ambitious, builder-facing commercial marketplace into an internal productivity tool for the existing sales force.
This pivot reflects structural realities within residential construction. Homebuilding relies heavily on fragmented trade subcontractors — framers, trim carpenters, and installers — who operate independently of the distributor and lack contractual incentives to adopt vendor software. Even when a homebuilder adopts a digital platform, field crews continue to rely on physical blueprints. Bridging this operational gap remains an ongoing challenge, with no evidence in company disclosures that digital workflow lock-in has taken hold across job sites.
Evaluated objectively, processing volume does not equate to recognized revenue. The $134 million in incremental digital sales reported for 2024 represented less than 1% of total net sales exceeding $16 billion. Company disclosures do not substantiate earlier projections that Paradigm would generate $1 billion in high-margin incremental sales by 2026, a reality underscored by management's strategic repositioning. The defensible core thesis is narrower: digital estimating may enhance sales-force productivity and component attach rates over time. Verifying that benefit requires tracking whether value-added products increase as a percentage of total net sales during periods of flat housing starts, isolating mix gains from broader industry cycles.
The ERP Program Nobody Talks About
Alongside its commercial software investments, the company is executing a major enterprise resource planning modernization. Builders FirstSource is deploying a comprehensive SAP implementation, launching two pilot markets in July 2025 and continuing the rollout through 2026, with elevated selling, general, and administrative expenses directly attributed to the project.116 Enterprise software transitions among large distributors frequently carry operational risks and service disruptions, a challenge management acknowledged by noting that such conversions "are always challenging."16 Given that the company's competitive standing relies on reliable delivery execution, the ERP deployment represents a material operational variable alongside broader housing demand.
Both initiatives — the Paradigm digital platform and the enterprise software overhaul — ultimately reflect executive capital allocation choices regarding technology investments and operational scale.
VII. Management & Capital Allocation Playbook under CEO Peter Jackson
The chief executive seat at Builders FirstSource has changed hands four times in six years—a notable succession cadence for a company of its scale.
Floyd Sherman led the business through the mid-2000s housing boom, the 2008 collapse, and the ProBuild acquisition. Chad Crow succeeded him, negotiated the BMC merger, and retired as planned upon its completion. Dave Flitman joined from BMC as chief executive of the combined entity on January 1, 2021, but departed less than two years later, in late 2022, to lead US Foods—leaving at the height of the company's pandemic-era earnings boom.
Dave Rush, a 25-year company veteran, stepped in as chief executive in November 2022 to guide the business through the cyclical slowdown. On November 6, 2024, Rush retired and Chief Financial Officer Peter Jackson assumed the role of president and chief executive officer, while Pete Beckmann—formerly head of financial planning and analysis and with the company and its predecessors since 1999—was named chief financial officer.13
Jackson is a finance executive by background, a background evident in his communication style. On earnings calls, he focuses on leverage mechanics, working capital management, and share buyback math, addressing competitive questions with operational detail. As former chief financial officer, he was also the primary architect of the capital allocation program that defines the company's recent record. Evaluating Jackson's leadership therefore requires examining the share repurchase program—a record more nuanced than headline figures suggest.
Half the Company, Retired
The top-line figure is striking: from the program's launch in August 2021 through mid-2026, Builders FirstSource repurchased 102.6 million shares—representing 49.7% of its total shares outstanding—at an average price of $81.26 per share, for a cumulative outlay of $8.3 billion.2 In effect, the company retired nearly half its equity base in five years. By the end of 2025, cumulative repurchases since January 2021 had reached nearly $8.0 billion under successive board authorizations, leaving $500 million available under its April 2025 authorization.1
Decomposing the buybacks by annual vintage, however, reveals a more complex timing record.
In the fourth quarter of 2022, as equity markets priced peak earnings as unsustainable, the company acquired 10.2 million shares at an average price of $64.17.11 That initial tranche proved highly effective, deploying cash flow into a leading distribution franchise at a low earnings multiple.
In 2023, the company repurchased 17.8 million shares at an average price of $100.49, allocating $1.8 billion primarily to offset dilution from the BMC merger.1 In 2024, repurchases shifted higher in price: the firm spent $1.5 billion to buy back 8.9 million shares at an average price of $170.74—which included 0.9 million shares repurchased at $176.73 per share in the third quarter of 2024 alone.113 As market conditions softened in 2025, buybacks slowed to 3.4 million shares at an average price of $118.65, totaling $0.4 billion.1 In the first quarter of 2026, amid a weakening housing environment, the company bought 3.3 million shares at an average of $92.25 for $302.9 million.15 By the second quarter of 2026, as leverage rose to 3.6 times net debt to trailing adjusted EBITDA, management paused share repurchases entirely.2
Viewed chronologically, the execution pattern shows heavy capital deployment at market peaks and a complete halt as share prices fell to multi-year lows.
The Uncomfortable Vintage Analysis
With the share price trading in the mid-$60s in late August 2026, the program's cumulative average purchase price of $81.26 sits roughly 20% above prevailing market value.23 Notably, the largest annual capital commitment—$1.5 billion deployed in 2024—occurred at prices more than double the late-2026 trading level.
This outcome does not imply the overall program failed. Retiring nearly half the share count at an average price that could prove reasonable during a normalized housing market represents a defensible deployment of pandemic windfall cash, particularly compared to overpaying for large acquisitions at a market top. However, claims that management consistently bought shares well below intrinsic value are unconfirmed by current market prices. Instead, the buyback highlights a structural challenge common among cyclical firms: capital deployment accelerated as operating cash flow peaked and equity prices rose, then ceased as cash flow declined and leverage expanded. Because free cash flow and equity valuations follow the same housing cycle, the program functioned procyclically in aggregate. The 2022 repurchases demonstrated opportunistic countercyclical buying, whereas the 2024 purchases reflected momentum-driven execution.
This capital allocation record shapes the company's current leverage profile. Net debt reached $4.6 billion against trailing adjusted EBITDA of $1.3 billion at the end of June 2026, raising leverage to 3.6 times compared to 0.7 times at year-end 2022.211 This increase resulted primarily from declining EBITDA rather than substantial new debt issuance, but it materialized after $8.3 billion had already been spent on share buybacks. Total liquidity remains solid at approximately $1.6 billion, and company filings show no long-term debt maturities until 2030—providing a critical buffer against liquidity distress.214 Management has stated it expects leverage to return to its target range as EBITDA recovers, though that outcome depends on an industry rebound.16
From a credit perspective, two structural factors frame the balance sheet. In May 2025, the company amended its revolving credit facility to increase commitments from $1.8 billion to $2.2 billion and extend its maturity to May 2030; its springing fixed-charge coverage covenant applies only if excess availability drops below approximately $165 million, a scenario far removed from current liquidity levels.1 Conversely, annual interest expense rose by $66.2 million in 2025 to $273.9 million following the issuance of $750 million in 6.750% senior unsecured notes due 2035, which were used to pay down revolver borrowings.1 The balance sheet remains solvent, but it no longer provides the offensive flexibility it possessed in 2022.
Reinvestment and the M&A Record
Capital allocation toward internal operations and acquisitions shows greater consistency. Builders FirstSource invested over $110 million in new, expanded, or upgraded value-added facilities during 2025 and has completed 42 acquisitions since the BMC merger, adding nearly $2.3 billion in annual sales—an aggregate volume equivalent to a top-six industry competitor built through small bolt-on transactions.16 Recent acquisitions illustrate this strategy: millwork suppliers Builder's Door & Trim and Rystin Construction in Las Vegas in October 2025; Lengefeld Lumber in Central Texas and modular manufacturer Pleasant Valley Homes in November 2025; Premium Building Components, its initial truss and wall panel plant in New York, in January 2026; and Precision Design & Trim in Boise in June 2026.16 When analyst Ivy Zelman inquired on the fourth-quarter 2025 earnings call whether deal multiples had softened, Jackson noted that acquisition multiples held in historical ranges, but acknowledged that payback periods had lengthened because market volumes declined more than initial underwriting models projected, while adding that returns remained within modeled downside ranges.16
Financial analysis highlights three additional areas of operational and accounting scrutiny. First, disclosure practices present an asymmetry: the company reports dollar volumes of quotes processed through its digital platform—a metric that does not map directly to recognized revenue or profit—while withholding standalone financial results for its $450 million Paradigm software acquisition. Second, non-GAAP adjustments create a wide divergence from statutory results: in the second quarter of 2026, the company reported a GAAP net loss of $3.9 million alongside adjusted net income of $126.1 million and adjusted diluted earnings per share of $1.17, a gap driven primarily by intangible asset amortization stemming from prior acquisitions.2 Third, asset impairment risks remain elevated: following years of consolidation across ProBuild, BMC, Paradigm, and 42 smaller deals, company disclosures caution that sustained housing weakness could trigger goodwill or intangible asset impairments at specific operating units.1 Through mid-2026, no impairment charges have been recognized.
Executive compensation structures are detailed in the company's annual proxy filings rather than operating reports, and specific metric weightings are not evaluated here.21 Instead, the practical test of executive guidance lies in operational performance against targets during market contractions.
VIII. Strategic Frameworks: 7 Powers & Porter's 5 Forces Analysis
Strip away the narrative and ask the war-game question: if a well-funded competitor wanted to take share from Builders FirstSource in a specific metropolitan market, what would stop it?
Start with Hamilton Helmer's framework. Scale economies represent the clearest structural advantage, operating through two distinct channels. The first is procurement: a centralized purchasing platform for commodity lumber, negotiating across multiple markets with North America's largest mills, secures lower pricing than a single-market yard.1 The second is route density: logistics costs per delivery fall when a distributor operates multiple yards and delivery trucks in close proximity to active job sites.
Neither advantage is absolute. Disclosures in the annual report emphasize that supplier diversity provides purchasing flexibility — the positioning of a large buyer rather than a monopsonist — while 2026 disclosures on fuel-cost sensitivity demonstrate that logistics scale does not fully insulate the cost structure.116
Process power represents a more compelling claim, rooted in component manufacturing. Operating high-speed truss and panel plants efficiently requires specialized expertise: engineering components to local codes, sequencing production to match job-site schedules, and optimizing lumber yields. While this capability is difficult to master quickly, it is not proprietary. Equipment suppliers such as MiTek sell component machinery to any buyer, and regional component manufacturers operate across every market. Ultimately, process advantage provides marginal benefits and contributes to gross margin expansion, but it does not block competent local rivals. Management commentary from the second quarter of 2026 — describing "aggressive price discovery" across the industry, with competitors taking actions that were "sometimes too aggressive" and yielding "meaningful regret" — demonstrates that pricing power remains vulnerable during downturns.16
Two of Helmer's powers are largely absent. Branding power does not apply in a market where professional builders buy on price, service reliability, and delivery schedules rather than brand names. Nor does the company possess a cornered resource: it owns no timberland, proprietary patents, or exclusive supply agreements that rivals cannot replicate. This absence is significant because branding and cornered resources typically endure through industry downturns, whereas the company's existing advantages depend heavily on maintaining operational volume.
Counter-positioning against big-box home improvement retailers represents the company's most durable structural advantage. While retailers like Home Depot and Lowe's target professional contractors, retail stores designed for consumer traffic cannot accommodate truss manufacturing plants or coordinate specialized delivery fleets for large housing developments. Competing for structural framing packages would require fundamental changes to the big-box business model, which earns high returns on its existing footprint. This structural separation remains stable.
Switching costs represent the weakest proposed advantage. The argument that builders become locked into the company's software workflow is unconfirmed by operational results. Management's mid-2026 shift away from a broad commercial platform model indicates that digital tools have not created structural customer lock-in. Furthermore, the company reported that it merely maintained market share in the second quarter of 2026 after expanding share in the first quarter — a fluctuation Chief Executive Peter Jackson attributed to routine market competition.16 Customer retention in building materials relies primarily on sales relationships rather than software platforms: field representatives who manage job-site logistics provide the primary retention mechanism, supported by approximately 2,700 sales representatives and roughly 2,550 sales coordinators and specialists at year-end 2025.1
Porter: Where the Pressure Actually Comes From
Evaluating the business through Porter's Five Forces framework clarifies where competitive pressures concentrate. The threat of new entrants at national scale remains low due to substantial capital requirements, land acquisition needs, equipment costs, and regulatory permitting. However, competitive pressure can emerge from recapitalized existing distributors, as demonstrated by QXO's entry into the sector.18 Supplier power is moderate and balanced: while lumber mills are consolidated, Builders FirstSource represents one of their largest customer channels, preventing individual suppliers from dictating terms.
Buyer power represents the primary operational constraint. Annual disclosures explicitly highlight that major production and multi-family homebuilders exert significant pricing leverage, which can limit the company's ability to pass along cost increases.1 Management reinforced this dynamic during the second-quarter 2026 earnings call, noting that builders were "fighting for every penny." Although fuel surcharge recoveries increased by approximately 20% during the quarter, management acknowledged that further cost recovery remained necessary.16
Substitution risk from alternative structural materials like steel or concrete remains minimal in U.S. single-family construction. However, product substitution within homes poses a more direct headwind. Management has noted that the material value per housing start has declined by approximately 10% since 2019 as homebuilders reduced square footage and simplified floor plans to control costs.16 This trend reduces revenue per unit of construction activity independently of interest rate changes. On the fourth-quarter 2025 earnings call, management projected that material value per start would stabilize rather than continue falling in 2026, halting further decline without restoring previous spending levels.16
Competitive rivalry remains intense across local markets. Management acknowledged during 2026 that the company maintained "more capacity than we need for the existing market," prompting operational adjustments to reduce costs while preserving capacity for a market recovery.16 In a sector characterized by high fixed overhead and excess regional capacity, price competition intensifies rapidly during cyclical contractions, directly pressuring operating margins.
The Synthesis
Evaluating Builders FirstSource across these analytical frameworks reveals a distributor with durable cost advantages over smaller regional competitors, a secure structural barrier against big-box retailers, and limited pricing power against large homebuilders during market downturns. This structure generates strong profitability during periods of robust construction activity and compressed margins when market volumes decline. The operational profile reflects a high-quality cyclical enterprise rather than a compounder operating independently of broader housing cycles — a distinction that fundamentally shapes long-term valuation.
IX. Primary Evidence: Earnings Call Deep-Dive & Q&A Dynamics
A sequential review of Builders FirstSource's earnings calls across 2026 illustrates how executive narrative adapts to a deteriorating operating environment.
The progression began in mid-February 2026. When reporting full-year 2025 results, management issued initial 2026 guidance expecting net sales between $14.8 billion and $15.8 billion, adjusted EBITDA of $1.3 billion to $1.7 billion, gross margins from 28.5% to 30%, and free cash flow of roughly $500 million, under the assumption that single-family and multi-family housing starts would remain flat year-over-year.1416 By April 30, management lowered the outlook: net sales were revised down to between $14.6 billion and $15.6 billion, adjusted EBITDA to between $1.1 billion and $1.5 billion, gross margin to 27.5% to 29%, and free cash flow to between $400 million and $500 million, as housing starts expectations fell to a 2.5% decline.1516 On July 30, guidance contracted further: net sales were cut to a range of $14.0 billion to $14.8 billion, adjusted EBITDA dropped to between $1.0 billion and $1.2 billion, and single-family starts were projected to fall nearly 7%.216
These two downward revisions in six months reduced the adjusted EBITDA midpoint from $1.5 billion to $1.1 billion—a 27% contraction that represented a material departure from management's initial annual forecast.
Evaluating this shortfall requires context. Management had noted that the February outlook aligned with the middle scenario presented during the third-quarter 2025 earnings call, framing the initial figures within a broader band of possible outcomes rather than as a fixed point.16 Targeting the midpoint of a scenario range and subsequently cutting it twice reflects a housing market that contracted more rapidly than management's baseline model anticipated, rather than an explicitly promotional initial forecast.
How Management Explained the Misses
Management addressed the guidance reductions with detailed operational explanations. Opening the fourth-quarter 2025 call, Chief Financial Officer Pete Beckmann cited a sharp late-quarter sales deceleration driven by homebuilders delaying starts to clear inventory, alongside unexpected insurance cost adjustments.16 In April, Chief Executive Officer Peter Jackson attributed market weakness to geopolitical uncertainty, elevated interest rates, and persistent inflation that undermined the spring selling season, stating directly that those forces created sales and cost headwinds that the company could not fully offset during the year.16 By July, management quantified a full-year fuel headwind of approximately $100 million as higher diesel prices affected cost of goods sold and operating expenses.16
In response, the company expanded its expense reduction targets throughout the year. Initial cost actions of $100 million announced in February—comprising $75 million in direct year-over-year spending cuts and $25 million in cost avoidance across overtime, temporary labor, incentive compensation, merit increases, and site closures—were increased to $115 million by July, with an additional $40 million in savings identified.16
Operationally, Builders FirstSource consolidated 25 facilities in 2025 and an additional 36 during the first half of 2026, bringing three-year site rationalizations to 91 locations while maintaining an on-time and in-full delivery rate above 90%.16 This delivery metric indicates that management reduced excess physical capacity without impairing core service execution—an operational contrast to the uncoordinated network contraction during the 2008 downturn.
What the Analysts Pressed On
Equity analyst questioning focused primarily on three operational concerns: second-half growth assumptions, pricing power, and market share trends.
On second-half projections, UBS analyst John Lovallo noted during the July call that despite lowering the full-year single-family starts forecast to mid-to-high single-digit declines, the fourth-quarter revenue target implied approximately 4% year-over-year growth, asking whether that required a market inflection. Jackson clarified that the implied growth reflected an easier year-over-year comparison resulting from a sharp pullback in builder activity late in the prior year, rather than a near-term demand recovery.16 RBC analyst Michael Dahl questioned whether third-quarter guidance masked weaker volumes once commodity price trends turned favorable; Beckmann acknowledged the lag mechanics, agreeing that commodity benefits would remain constrained on a lower overall sales volume.16
Regarding pricing pass-through, Barclays analyst Matthew Bouley asked how effectively vendor cost increases could be passed to homebuilders. Jackson acknowledged that industry capacity exceeded current market demand and that the company was taking steps to right-size operations, while noting that product pricing had shown greater stability over the preceding six months compared to prior years.16
On market share, Bank of America analyst Rafe Jadrosich asked why market share gains recorded in the first quarter moderated to flat performance in the second quarter. Jackson acknowledged that competitive conditions felt more demanding mid-quarter, characterizing the observation as qualitative rather than strictly data-driven.16 Jackson added that certain regional competitors had engaged in pricing tactics that proved overly aggressive, reflecting heightened margin competition across regional markets.16
Where the Disclosure Thins
While management provides detailed reconciliations between housing starts and organic sales performance—including a recognized three-month lag, an estimated 10% decline in material value per housing start since 2019, and broader affordability pressures—transparency remains limited in key strategic areas.16 The company discloses no standalone financial metrics for its $450 million Paradigm acquisition. Furthermore, its long-term normalized earnings framework—reaffirmed on the fourth-quarter 2025 call in response to Stephens analyst Trey Grooms, projecting $2.1 billion to $2.4 billion in adjusted EBITDA on 1.0 million to 1.1 million single-family starts with 30% to 33% gross margins—remains unproven under prolonged market weakness.16
This normalized framework traces back to the multi-year financial targets introduced at the company's Investor Day in Atlanta on December 5, 2023, when then-CEO Dave Rush highlighted execution capabilities across a 570-location network.17 Despite subsequent market contractions and consecutive guidance reductions, management maintained these baseline targets while committing to review them at an upcoming Investor Day in late 2026.16
That event represents a key analytical checkpoint, as management will need to substantiate its normalized earning power against two years of operational headwinds or formally recalibrate long-term guidance.
X. Strategic Risk Radar & Bear vs. Bull Stress Test
The strategic risks facing Builders FirstSource are straightforward, mechanical, and largely active in late 2026.
Rate duration and the starts deficit. The company converts single-family housing starts into revenue with roughly a three-month lag, while multi-family projects lag by nine to twelve months.16 Every quarter of depressed construction activity leaves fixed overhead underabsorbed across component plants and distribution yards built for higher volume. Compounding this pressure is affordability: management noted in the first quarter of 2026 that homebuilders were responding to elevated interest rates by constructing smaller, simpler homes and offering rate buydowns—a shift that reduces revenue per start even when unit volumes stabilize.16 On the fourth-quarter 2025 earnings call, management characterized value per start as stabilizing rather than continuing to decline, which would eliminate one source of margin pressure if sustained.16 Meanwhile, multi-family construction remains the weakest end market, with management projecting continued weakness through the end of 2026.16
Commodity swings in both directions. Falling lumber and oriented strand board (OSB) prices deflate revenue and reverse inventory holding gains. When commodity prices rise, the financial benefit arrives with a delay as higher-cost inventory cycles through cost of goods sold. Chief Financial Officer Pete Beckmann confirmed this timing lag in July 2026, noting that any commodity tailwind would arrive in the second half of the year but remain muted by lower overall shipment volumes.16 Management's 2026 guidance assumes framing lumber prices average $390 to $410 per thousand board feet—aligning with the long-term historical average of $400—with lumber prices trending higher while OSB prices remain subdued.16 This dynamic creates a structural asymmetry: while commodity inflation expands top-line figures, it does not drive durable margin expansion, leading management to model commodity effects as broadly neutral.
Builder backward integration. Major production homebuilders could theoretically bring component manufacturing in-house. The economic deterrent is utilization: a builder-owned facility runs only on that builder's local project volume, whereas an independent distributor aggregates demand across multiple builders to maintain high plant utilization. That protection weakens in major metropolitan markets where a single high-volume builder starts thousands of homes annually. However, company disclosures show no evidence of builders moving toward vertical integration, leaving this threat structural rather than operational.
Two additional operational variables require monitoring. The ongoing enterprise resource planning rollout introduces implementation risks that could disrupt the reliable job-site delivery that underpins customer retention.116 Meanwhile, financial leverage reached 3.6 times trailing adjusted EBITDA in mid-2026, exceeding management's target range. Although supported by $1.6 billion in total liquidity and no debt maturities until 2030, elevated leverage has forced a pause in share repurchases and would restrict further acquisition activity if earnings compress further.214
The Bull Case
Regarding legal and regulatory risks, company disclosures reflect standard industry exposures. Builders FirstSource details routine liabilities related to product warranty, construction defects, worker safety, asbestos, and general casualty, alongside regulatory oversight covering transportation, workplace standards, work authorization, tariffs, and municipal building codes.1 Regulatory policy on immigration and trade tariffs carries direct operational implications: framing labor availability dictates builder demand for prefabricated components while influencing internal labor costs, while tariffs affect imported dimensional lumber supplies. However, neither area presents a quantified balance-sheet liability, and filings disclose no single pending legal matter capable of materially altering financial performance.
The bull case rests on three primary arguments. First, the U.S. housing market remains structurally undersupplied following more than a decade of underbuilding. Single-family starts running near 900,000 annualized units sit below demographic household formation requirements, suggesting current market weakness is cyclical rather than secular.
Second, the operational transition toward higher-margin products is established in the financial record. Value-added components and millwork represent nearly half of total net sales—up from 43% at the time of the BMC merger—complemented by a turn-key installation service generating 16% to 17% of sales that management noted outperformed the broader single-family market contraction in 2025.1816 Third, substantial share repurchases cut total shares outstanding by half between 2021 and 2026. Consequently, any cyclical recovery toward management's normalized earnings targets will accrue across a significantly smaller share base. Chief Executive Officer Peter Jackson summarized this thesis by stating the company is positioned to "deliver resilient results in the current environment and capture meaningful upside as the housing market recovers."2
The Bear Case
The bear case presents a competing structural thesis that does not depend on permanent housing market stagnation, requiring only that mid-cycle operating margins settle below executive projections. Gross margin contracted year-over-year for eight consecutive quarters through mid-2026, a decline management attributed directly to lower volume absorption rather than commodity price swings.214 Regional markets retain excess distribution capacity, driving competitive price discounting at a time when management acknowledges operating more facility capacity than current market demand requires.16
If normalized gross margins settle between 27% and 29% rather than management's targeted 30% to 33% range, projected normalized EBITDA would shrink by hundreds of millions of dollars. Furthermore, the strategic levers that historically drove growth face new constraints: market consolidation now features a well-capitalized competitor targeting $50 billion in distribution revenue, while internal digital initiatives have been narrowed from a commercial marketplace into a sales productivity tool.1618
Verdict, and the Three Numbers That Decide It
The evidence yields a nuanced conclusion. The historical record supports the thesis that Builders FirstSource maintains higher structural profitability than its pre-2020 baseline, evidenced by a 30.4% gross margin in 2025 compared to roughly 27% in 2019.116 However, the data refutes the stronger assertion that peak pandemic margins represented a permanent structural shift. The central analytical question remains unresolved: what mid-cycle gross margin can the business sustain in an industry characterized by excess regional capacity and heightened competition from well-funded aggregators?
Three specific operational metrics will evaluate this trajectory.
First, gross margin percentage. This metric serves as the primary indicator of product mix durability and pricing discipline independent of top-line volume. The test is whether gross margin stabilizes above late-2026 levels and recovers toward management's 30% to 33% target range as housing starts rebound.
Second, core organic sales growth relative to single-family starts. This represents management's primary market share proxy, adjusting for the three-month delivery lag and shifts in revenue value per start. Sustained outperformance against underlying starts provides the necessary empirical proof that national scale and specialized services capture market share.
Third, net debt to trailing adjusted EBITDA. This leverage ratio governs capital allocation flexibility, determining when the company can safely resume opportunistic asset acquisitions and countercyclical share repurchases near market troughs.
XI. Epilogue & Playbook Lessons
During the company's second-quarter 2026 earnings call, while outlining a guidance reduction, Chief Executive Officer Peter Jackson paused to recognize Ralph Cummins, an inside sales representative in Bainbridge Island, Washington, celebrating forty years with the firm — an employee known for baking weekly treats for colleagues and customers, whom Jackson nicknamed "Sweetness."16 While corporate call recognition can appear routine, in a building materials sector where customer retention relies on long-term relationships and sales representatives who know a builder's blueprints by heart, four decades of service represents a meaningful operational asset.
The near-term operational agenda remains defined: management plans to expand value-added manufacturing capacity, complete the SAP software rollout, pursue selective bolt-on acquisitions in components and installation services, and maintain strict cost control until market volumes recover, using an Investor Day in late 2026 to update long-term targets.216 Whether that strategy yields the earnings implied by management's normalized framework ultimately depends on underlying single-family housing starts — a macroeconomic variable the company can neither control nor fully hedge.
Four Lessons That Travel
Four lessons travel beyond this company.
Trough acquisitions can generate substantial returns in cyclical industries, but payback horizons are extended. Acquiring ProBuild at roughly 0.25 times sales in 2015 represented a disciplined asset purchase, yet equity returns required four years to materialize as debt service absorbed nearly all operating cash flow in the interim.7 Trough transactions create long-term value only if the buyer maintains sufficient balance-sheet strength to endure prolonged market weakness before the acquisition fully yields results.
Transaction currency matters more than acquisition price. Combining with BMC through an all-stock transaction at a fixed exchange ratio avoided adding debt, allowing Builders FirstSource to enter the subsequent commodity price surge with an unencumbered balance sheet.811 Structuring the deal with cash and debt would have severely constrained operational flexibility. In cyclical industry consolidation, capital structure choices dictate long-term strategic resilience.
Windfall-funded share repurchases tend to behave procyclically without explicit capital discipline. Retiring 49.7% of total shares outstanding significantly reduced equity count, with the fourth-quarter 2022 repurchases at an average of $64.17 reflecting effective countercyclical timing.211 However, the largest annual capital allocation occurred in 2024 at an average price exceeding $170 per share, before higher leverage of 3.6 times forced a complete pause in mid-2026 with the stock trading in the mid-$60s.123 Because free cash flow and equity valuations peak concurrently during housing upcycles, share buybacks naturally default to buying near market tops unless management systematically preserves capital for cyclical downturns.
Higher-value product mix expands structural margins but does not eliminate cyclical sensitivity. Shifting sales toward manufactured components lifted mid-cycle gross margins to 30.4% in 2025 compared to roughly 27% in 2019, demonstrating higher baseline profitability even as shipment volumes contracted.116 Nevertheless, higher-value mix did not prevent margin compression during lower construction activity, as component plants carry fixed overhead and major homebuilders retain pricing leverage. Strategic product diversification improves structural earning power, but it cannot insulate a distributor from broader housing cycles.
Across twenty-eight years, the Builders FirstSource trajectory has hinged on how management manages the balance sheet through industry turns. In 2009, severe distress forced a sponsor-led recapitalization. In 2015, an aggressive debt-funded acquisition required years of operational recovery. In 2020, an all-stock merger preserved balance-sheet flexibility ahead of an unprecedented commodity upcycle. In late 2026, with financial leverage elevated, share repurchases paused, housing starts continuing to fall, and a new scale consolidator entering the sector, the company faces that same fundamental test once again — with its capital allocation decisions likely to determine its trajectory through the next housing cycle.
References
-
Builders FirstSource, Inc. Form 10-K for fiscal year ended December 31, 2025 — U.S. Securities and Exchange Commission, 2026-02-17 ↩↩↩↩↩↩↩↩↩↩↩↩↩↩↩↩↩↩↩↩↩↩↩↩↩↩↩↩↩↩↩↩↩↩↩↩↩↩
-
Builders FirstSource Reports Second Quarter 2026 Results (Form 8-K, Exhibit 99.1) — U.S. Securities and Exchange Commission, 2026-07-30 ↩↩↩↩↩↩↩↩↩↩↩↩↩↩↩↩↩↩↩
-
Builders FirstSource Inc Quote & Financial Analysis — Wall Street Journal ↩↩↩
-
Builders FirstSource, Inc. Initial Public Offering Prospectus (Form 424B1) — U.S. Securities and Exchange Commission, 2005-06-22 ↩↩
-
Builders FirstSource, Inc. Form 10-K for fiscal year ended December 31, 2009 — U.S. Securities and Exchange Commission, 2010 ↩↩↩↩↩↩↩↩↩↩
-
Builders FirstSource, Inc. Form 8-K regarding JLL Partners and Warburg Pincus recapitalization proposal — U.S. Securities and Exchange Commission, 2009-09-01 ↩
-
Builders FirstSource to Acquire ProBuild (Form 8-K, Exhibit 99.1) — U.S. Securities and Exchange Commission, 2015-04-13 ↩↩↩↩↩↩↩↩↩
-
Builders FirstSource to Combine with BMC Stock Holdings (Form 8-K, Exhibit 99.1) — U.S. Securities and Exchange Commission, 2020-08-27 ↩↩↩↩↩↩↩↩
-
Builders FirstSource Completes Combination with BMC Stock Holdings — Nasdaq / GlobeNewswire, 2021-01-04 ↩
-
Lumber Prices in 2020 and 2021 Set Record Highs Even When Adjusted for Inflation — NAHB Eye on Housing, 2022-02-03 ↩
-
Builders FirstSource Reports Fourth Quarter and Record Full Year 2022 Results — Builders FirstSource, 2023-02-28 ↩↩↩↩↩↩↩↩
-
Builders FirstSource, Inc. Form 8-K regarding the WTS Paradigm, LLC acquisition agreement — U.S. Securities and Exchange Commission, 2021-06-29 ↩↩
-
Builders FirstSource Reports Third Quarter 2024 Results (Form 8-K, Exhibit 99.1) — U.S. Securities and Exchange Commission, 2024-11-05 ↩↩
-
Builders FirstSource Reports Fourth Quarter and Full-Year 2025 Results; Provides 2026 Financial Outlook (Form 8-K, Exhibit 99.1) — U.S. Securities and Exchange Commission, 2026-02-17 ↩↩↩↩↩↩
-
Builders FirstSource Reports First Quarter 2026 Results (Form 8-K, Exhibit 99.1) — U.S. Securities and Exchange Commission, 2026-04-30 ↩↩
-
Builders FirstSource Earnings Call Transcripts & Coverage — The Motley Fool ↩↩↩↩↩↩↩↩↩↩↩↩↩↩↩↩↩↩↩↩↩↩↩↩↩↩↩↩↩↩↩↩↩↩↩↩↩↩↩↩↩↩↩↩↩↩↩↩↩↩↩↩
-
Builders FirstSource Hosts 2023 Investor Day — Builders FirstSource, 2023-12-05 ↩
-
QXO Completes Acquisition of Kodiak Building Partners — QXO, Inc., 2026-04-01 ↩↩↩
-
Builders FirstSource Inc (BLDR.N) Stock Profile & Financials — Reuters ↩
-
Builders FirstSource, Inc. Form 10-K for fiscal year ended December 31, 2024 — U.S. Securities and Exchange Commission, 2025-02-20 ↩
-
Builders FirstSource Corporate Governance & Leadership — Builders FirstSource ↩
 LinkedIn
 WhatsApp
 Reddit
 Hacker News
 Email
Email Kindle
 RSS Feed
 Spotify
 Apple Podcasts
 Amazon Music
 Audible
 YouTube