Victory Capital Holdings: The Master Engine of Active Asset Management Roll-Ups
I. Introduction & Episode Roadmap
On the morning of August 6, 2026, a new voice opened Victory Capital's earnings call. Carly Thomas, who had spent three years directing responsible business at the firm before taking over investor relations that spring, handed the microphone to Chief Executive Officer David Brown after delivering the standard forward-looking-statements disclaimer. What followed departed from the usual routine.1
Victory reported $346 billion in total client assets and an adjusted EBITDA margin of 55.8%. It generated record net long-term inflows of $4.2 billion — a striking figure in an industry where net inflows for traditional active equity managers have been rare for fifteen years. Adjusted earnings per diluted share reached $2.21, up 41% year over year. Management also raised its long-term margin guidance from 49% to 50%, positioning the target at or near the top of the league table for publicly traded traditional asset managers.1
Thirteen years earlier, Victory Capital Management was merely the asset management subsidiary of Cleveland-based regional bank KeyCorp. The unit managed roughly $18 billion, with about 80% concentrated in U.S. equities. In 2012, it generated $112 million in revenue against $88 million in expenses, operating at a mid-twenties margin inside a bank eager to divest non-core assets.2 KeyCorp sold the business for $246 million.2 Today, that same enterprise carries a market capitalization exceeding $6.7 billion.3
That arc sits inside one of the central structural paradoxes in modern finance. The past fifteen years have presented severe structural pressure for active management. Capital has drained steadily toward index products from Vanguard, BlackRock, and State Street, while fee schedules across traditional mutual funds have compressed year after year. Invesco — a $2.2 trillion asset manager and one of the industry's largest — closed 2025 by writing down $1.79 billion in indefinite-lived intangible assets tied to U.S. retail mutual fund management contracts acquired in earlier deals, resulting in a fourth-quarter GAAP operating margin of negative 86%.4 That impairment illustrates the risk facing acquisitive active managers when market dynamics shift.
Victory Capital has pursued the opposite path. Since its 2013 management buyout, the firm has acquired eight businesses at an average cadence Brown described as roughly one every eighteen months.5 In fiscal 2025, Victory recorded a GAAP operating margin of about 42%, compared to roughly 30% at T. Rowe Price, a competitor with more than five times its revenue.6 Today, Victory oversees $346 billion in client assets with a headcount of fewer than 700 employees.7
The central question is not whether Victory Capital has generated strong financial returns — its operating history answers that. The question is why, and more critically, whether the architecture behind those results represents a durable operating model or a period of favorable timing.
The bullish thesis centers on a two-engine model: centralize all non-investment operations — trading infrastructure, compliance, legal oversight, fund administration, technology, and distribution — into a single scaled platform, while allowing autonomous investment franchises to maintain portfolio independence. Under this model, each acquired asset manager integrates into the central platform, eliminating duplicate overhead and converting incremental revenue into high-margin cash flow for shareholders.
The bearish counter-argument posits that Victory is fundamentally a roll-up operating in a contracting industry. Skeptics contend that inorganic acquisitions have masked persistent organic outflows in legacy active equity, that adjusted EBITDA metrics obscure a balance sheet dominated by goodwill and acquired intangibles — which account for roughly 87% of assets — and that a strategy reliant on major acquisitions every eighteen months risks exhausting suitable targets or disciplined pricing.
Both perspectives are backed by empirical evidence, making an evaluation of the underlying mechanics essential.
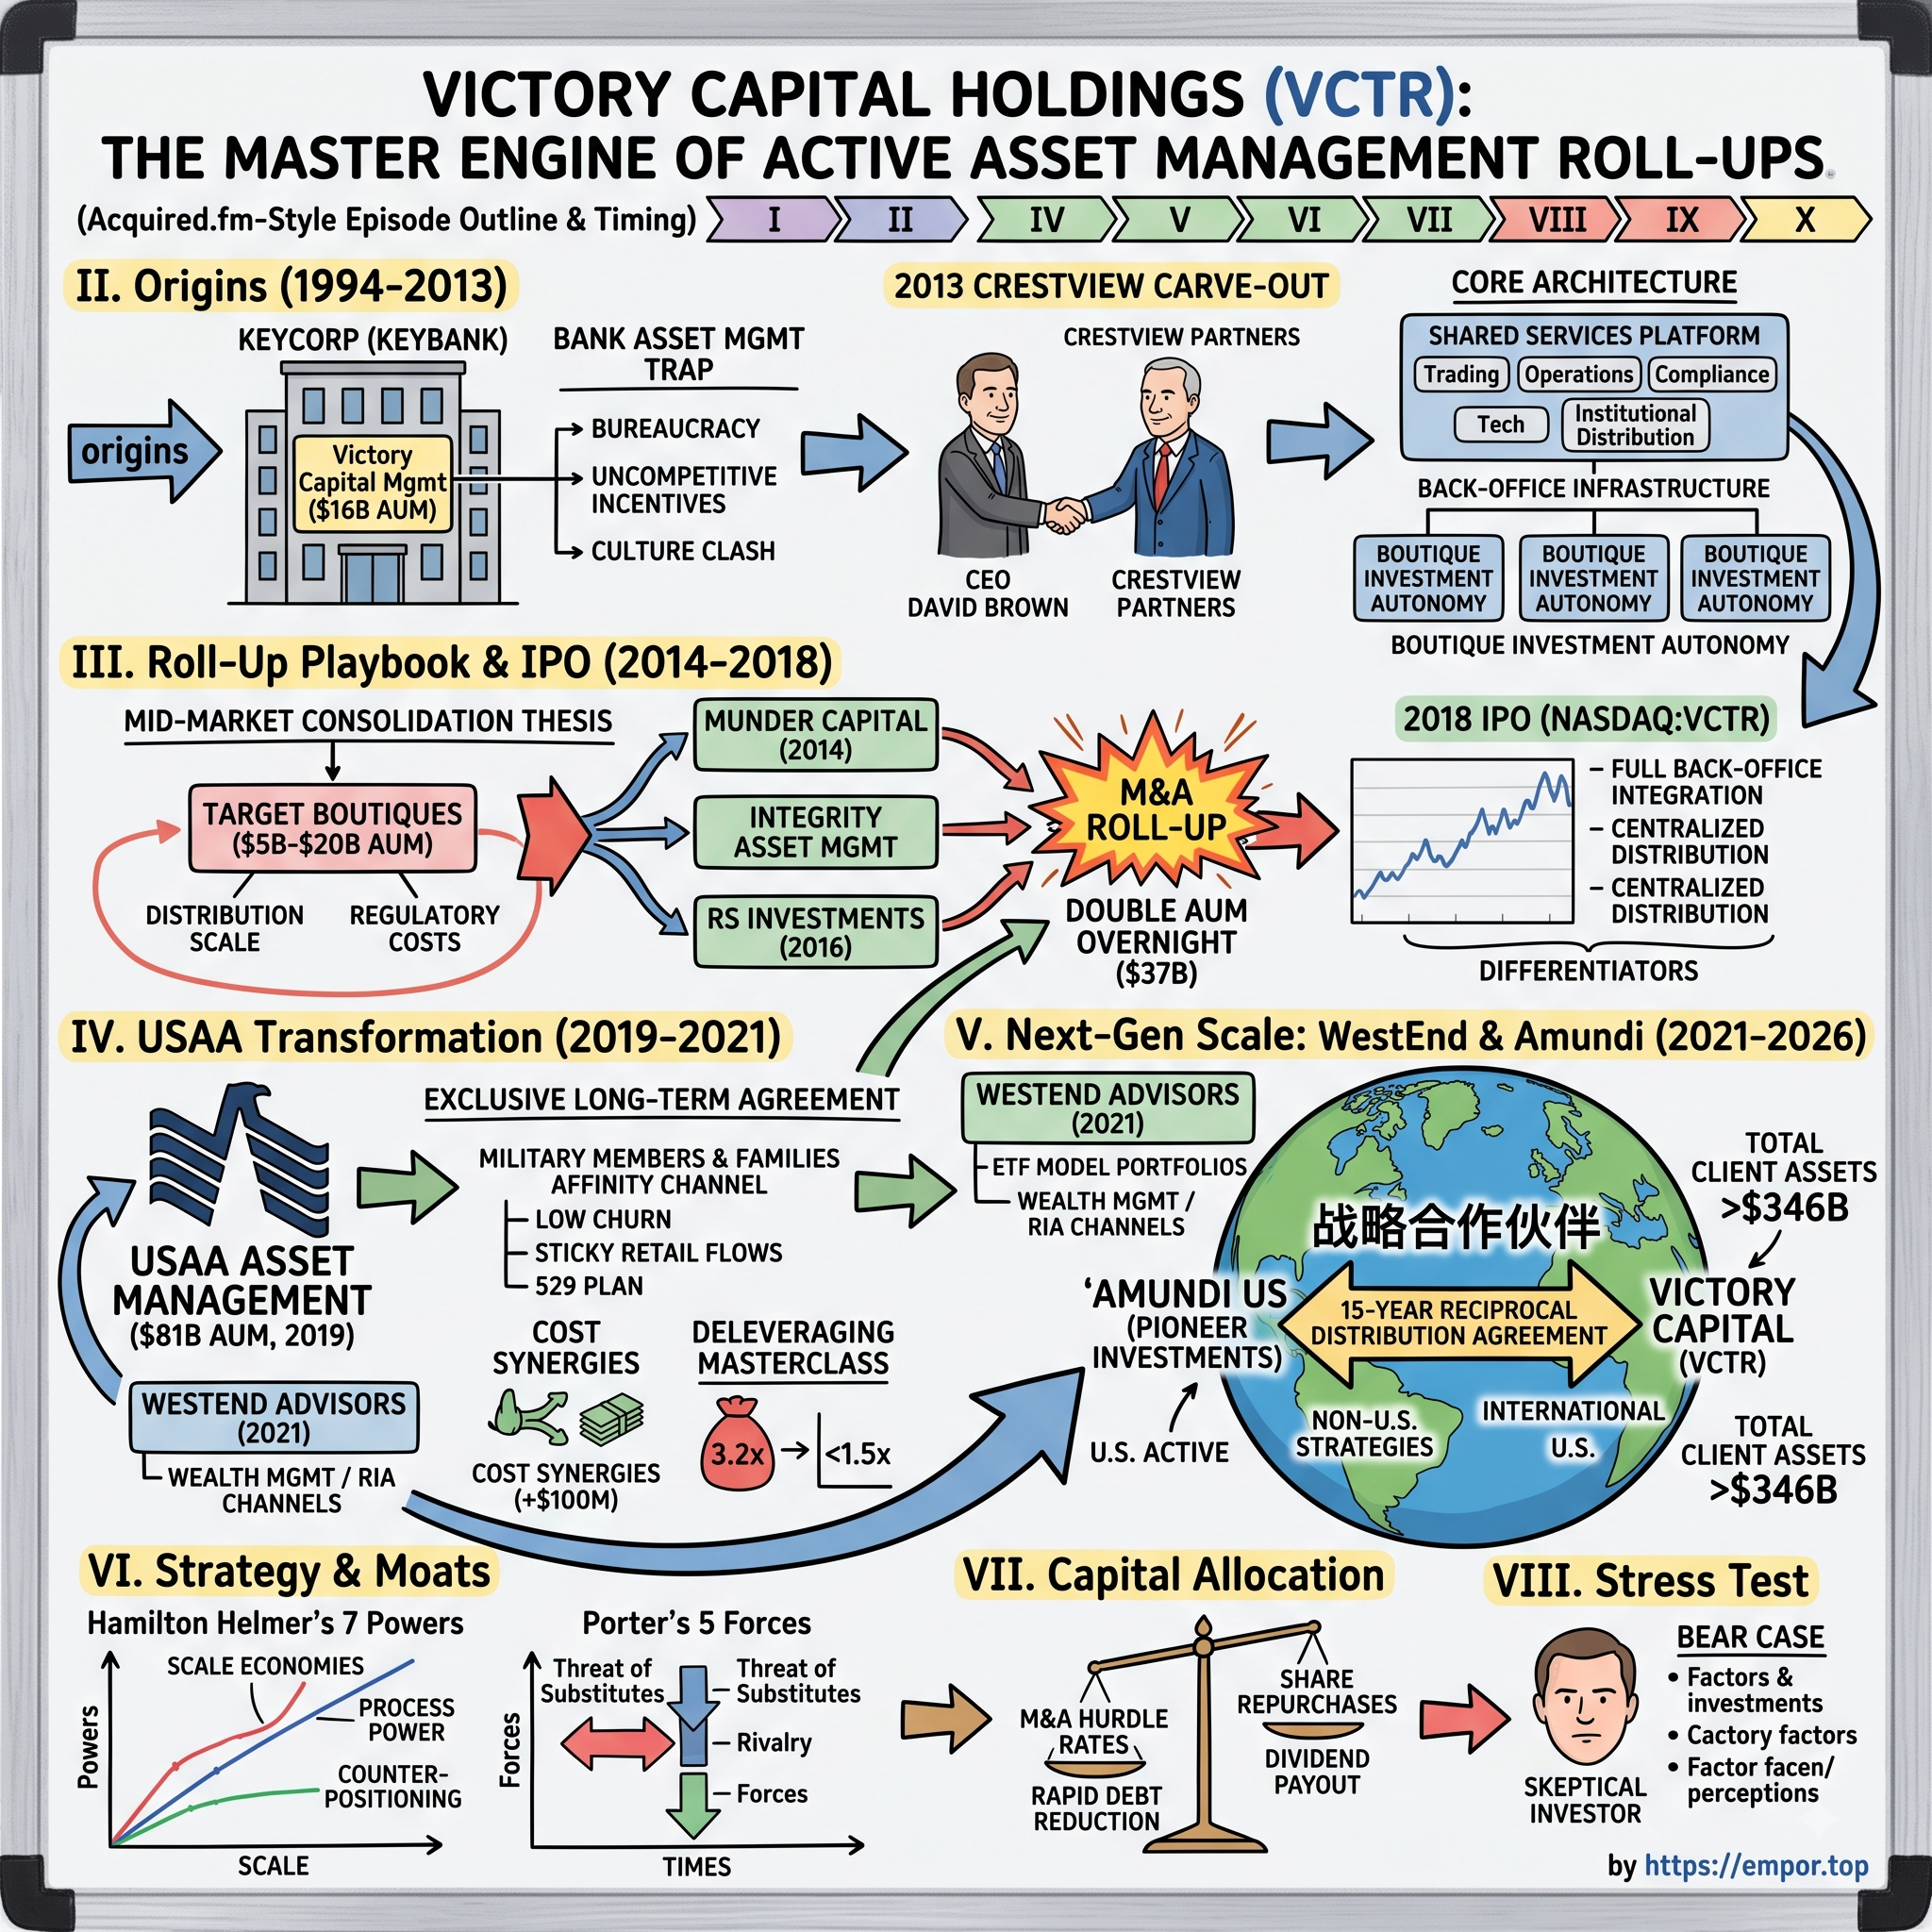
This examination traces Victory Capital's trajectory: from its 2013 carve-out from KeyCorp by Crestview Partners and management, through its roll-up execution across Munder Capital, RS Investments, and the transformative USAA Asset Management transaction. It evaluates the expansion into model portfolios via WestEnd Advisors, the 2024–2025 partnership with Amundi that revitalized the Pioneer Investments brand and unlocked distribution in over sixty countries, and the platform's economics analyzed through Hamilton Helmer's 7 Powers and Porter's Five Forces. Finally, it reviews management's capital allocation track record — including its unsuccessful $8-billion-plus attempt to acquire Janus Henderson in early 2026 — alongside the key operational metrics and risks that define the firm's forward outlook.
The story begins with a corporate parent that struggled to determine the strategic fit of its asset management arm.
 Subscribe on LinkedIn
II. Origins: The Bank Carve-Out & Building the Operating Platform (1994–2013)
For nearly two decades, Victory Capital operated inside a familiar structural mismatch common to bank-owned asset managers.
The misalignment stems from conflicting operating models. Commercial banks focus on net interest margin, regulatory capital, and credit risk, whereas asset managers rely on human capital, investment performance, and third-party distribution. Inside a bank holding company, asset management compensation is often tied to corporate pay bands rather than market rates for investment talent. Distribution is frequently limited to the bank's internal branch and trust channels, and technology spending prioritizes core banking systems over investment infrastructure.
By early 2013, KeyCorp acted on that mismatch. On February 21, 2013, the bank announced the sale of Victory Capital Management and an affiliate for $246 million, structured as $201 million in cash at closing and a $45 million seller note. Beth Mooney, then KeyCorp's chairman and chief executive, described the divestiture as "consistent with our strategic focus on businesses that leverage the competitive advantages of our core relationship banking model."2 KeyCorp booked an estimated after-tax gain of $145 million to $155 million on the transaction — an amount exceeding its initial cash proceeds, reflecting the low carrying value of the asset on the bank's balance sheet.2
The buyer was Crestview Partners, a New York-based private equity firm, in partnership with Victory's management and key employees. Equity ownership was structured so that senior executives, portfolio managers, and staff retained a substantial stake upon completion.[^8] The transaction closed on August 1, 2013.
The man who had been waiting for the phone call
David C. Brown had served at Victory since 2004, bringing an operational background that shaped the firm's strategic direction.
Rather than rising through portfolio management, Brown built his career on financial and operational oversight. He earned a bachelor's degree in political science with an accounting emphasis from Ursinus College and an MBA from Case Western Reserve University. He began his career at Ernst & Young as an assurance and advisory manager specializing in investment management clients. He later spent approximately five years at Gartmore Global Investments, serving as chief financial officer and chief operating officer of Gartmore Emerging Managers, before joining Victory in Cleveland in 2004.8
That operational background informed Brown's core thesis: boutique active managers rarely fail because of poor investment performance alone. Instead, they struggle under fixed and escalating operational costs — including compliance, trading systems, fund accounting, legal oversight, and distribution sales forces — that small asset bases cannot comfortably absorb. Because a $10 billion boutique and a $200 billion firm require similar baseline regulatory and operational infrastructure, larger platforms enjoy a distinct cost advantage.
Brown became chief executive upon completion of the buyout in August 2013 and assumed the role of chairman in April 2014.8 Alongside him, Michael Policarpo — President, Chief Financial and Administrative Officer — has directed financial and administrative operations throughout Victory's growth, establishing executive stability rare in the sector.
The architecture
The structural architecture established during the carve-out became the cornerstone of Victory's expansion strategy.
Victory separated the business into two distinct operational layers. The upper layer consists of autonomous investment franchises, each retaining its brand, investment strategy, portfolio team, and decision-making independence. The lower layer is a centralized platform that provides shared trading desks, compliance, legal oversight, fund administration, technology, and unified distribution across all franchises.
This structure contrasts with traditional multi-boutique holding companies like Affiliated Managers Group, which acquire revenue-share stakes while leaving acquired firms to manage their own back-office operations. Where AMG functions like a landlord leasing space to independent stores, Victory operates more like a department store: distinct branded counters managed by specialist teams, backed by a single centralized supply chain, checkout system, and sales force.
The commercial objective of this model is cost extraction. When Victory acquires an asset manager, it integrates the target onto its existing platform, eliminating duplicate back-office and administrative overhead while running incremental assets through scalable central infrastructure.
However, this model carries a central execution risk: centralizing administrative and sales functions can disrupt boutique culture or alienate investment teams whose client relationships depended on dedicated support.
Following the 2013 buyout, Victory held $17.9 billion in client assets — roughly 80% concentrated in U.S. equities — alongside its new operating structure and private equity backing.1 To test its consolidation strategy, the platform required its first acquisition target.
III. The Roll-Up Playbook & The IPO (2014–2018)
The first deal was, in a sense, an inside job.
Munder Capital Management was a Michigan-based equity manager whose ownership included Crestview Partners — the same firm that had just backed Victory's buyout. Grail Partners and other shareholders held the rest. In April 2014, Victory agreed to buy it; the transaction closed on October 31, 2014, bringing with it Munder's wholly owned subsidiary, Integrity Asset Management.9
The arithmetic was immediate and brutal in the best way. The combined company emerged with nine autonomous investment franchises and approximately $36 billion of assets under management and advisement.9 Victory had roughly doubled in a single stroke, and it had doubled by absorbing a firm whose entire non-investment apparatus — its own compliance officers, its own fund accountants, its own operations staff, its own sales force calling on many of the same platforms — became redundant on day one.
This is where the theory met the P&L, and it is worth being honest about what the theory actually claims. The synergy in a Victory deal is not a vague "revenue opportunity." It is the elimination of a duplicated fixed cost stack, which is the most reliable form of merger synergy that exists and the easiest to verify. You either fired the second head of compliance or you did not. That verifiability is why Victory's acquisitions have generally hit their announced cost targets, and it is also why the company has been able to underwrite deals at prices that look aggressive on a headline basis but cheap on a post-synergy basis.
Two more deals followed in quick succession, and one of them mattered far more than anyone appreciated at the time.
In May 2015, Victory acquired Compass EMP, a small firm whose assets amounted to a few hundred million dollars — a rounding error against a $36 billion platform. What Victory actually bought was an exchange-traded fund operating infrastructure and the regulatory apparatus to run it.1 Building an ETF business from scratch means exemptive relief, a listing and capital markets function, authorized participant relationships, index or rules-based construction capability, and a fund trust. Buying a functioning if tiny one collapses years of work into a purchase price. Brown returned to this decision on the Q2 2026 call, more than a decade later, and framed it as the foundation of what became VictoryShares.1 It is the clearest evidence in the record that this management team occasionally buys optionality rather than earnings — and it is worth noting, because it complicates the lazy characterization of Victory as a pure cost-synergy machine.
Then, on July 29, 2016, Victory acquired RS Investment Management, a San Francisco firm with growth equity and global/international equity capability, merging it into Victory the following week.10 The RS franchises — RS Value, RS Global, RS Growth — remain among the firm's flow contributors a decade later, which is a genuinely useful data point on whether the boutique-autonomy promise survives integration.
The IPO nobody wanted
By early 2018, the company had a story: four acquisitions, a scaled platform, expanding margins, an ETF option, and private equity backing that wanted liquidity. It took the story to public markets and got a cold reception.
Victory Capital priced its initial public offering of 11,700,000 Class A shares at $13.00 on February 8, 2018, listing on the Nasdaq Global Select Market under VCTR, with J.P. Morgan, BofA Merrill Lynch, and Morgan Stanley as joint lead bookrunners. Gross proceeds were roughly $152.1 million.11 The marketed range had been $17 to $19. The deal priced 24% below the bottom of that range — and then the stock fell 10.8% on its first day of trading, closing at $11.60.12
Brown has since made a habit of quoting the net figure. On the Q1 2026 call he noted that the company received just $157 million in net proceeds from the February 2018 IPO, against $1.4 billion of capital returned to shareholders in the eight years since.13 It is a deliberate rhetorical move, and it is also a fair one.
But it is worth sitting with why the market said no in February 2018, because the objection was not stupid. Public investors in early 2018 had seen this movie. Active management roll-ups had a poor reputation: they were levered, they used aggressive adjusted earnings, their organic growth was negative, and their acquisitions were widely read as treadmill activity — buying assets to replace assets that were walking out the door. BrightSphere and Affiliated Managers Group both traded at compressed multiples for exactly these reasons. Victory arrived carrying every one of those markers.
The financials Victory carried into the IPO did not help its case, and they are worth examining because they reveal what the roll-up actually cost before it paid. In fiscal 2016 — the year Victory absorbed RS Investments — the company generated roughly $298 million of revenue and posted a GAAP net loss of about $6 million.6 In 2017 revenue reached $410 million and net income recovered to just under $26 million; in 2018, on essentially flat revenue of $413 million, net income more than doubled to $64 million.6
Read those three years in sequence and the mechanism becomes visible. Revenue barely moved between 2017 and 2018 — but profit doubled, because the integration costs of the prior deals rolled off and the synergies stayed. This is the roll-up's actual shape: earnings are back-end loaded, GAAP results look terrible in deal years, and the payoff arrives twelve to twenty-four months later. It is also precisely the profile that public equity investors, who mark performance quarterly, tend to underwrite at a discount. Victory's founders were asking the market to pay in advance for a J-curve, and the market declined.
There is a second, less flattering reading available. A company whose GAAP earnings depend on excluding "acquisition, restructuring and integration costs" every single year is a company where the exclusions are arguably not exceptional at all — they are the operating cost of the business model. That criticism has followed Victory for its entire public life, and it is not fully answerable. The honest defense is that the costs have been disclosed, quantified, and matched against synergies that were also disclosed and quantified. The honest concession is that "adjusted" numbers in a serial acquirer always deserve an extra look.
Management's differentiation argument was structural rather than promotional: Victory does not hold passive stakes and collect a revenue share, it fully integrates the back office and centralizes distribution, so the synergies are real and the platform gets better with each deal rather than merely bigger. That argument is testable, and the subsequent decade has largely tested it favorably — Victory's margin expanded through a period when much of the peer group's did not.
What the 2018 skeptics got right, though, was the organic growth problem. That criticism was accurate then and, as we will see, remained accurate for most of the following seven years. The company's answer was not to fix organic growth first. It was to go do the biggest deal in its history.
IV. The USAA Transformation: Unlocking the Direct-to-Consumer Affinity Channel (2019–2021)
Understanding why the USAA transaction transformed Victory requires examining the nature of USAA itself. USAA is a San Antonio-based financial services organization serving U.S. military members, veterans, and their families. Membership is restricted to military personnel and eligible family members. The institutional relationship often begins at enlistment or commissioning—frequently through auto insurance—and compounds over decades into banking, home insurance, retirement planning, and college savings. Brand loyalty in this ecosystem functions not merely as marketing collateral, but as a structural feature of a closed, self-selecting community bound by shared institutional identity.
Housed within that organization was USAA Asset Management Company, which managed USAA's mutual funds, exchange-traded funds, and 529 college savings plan. As of March 31, 2019, it held approximately $70 billion in assets under management, alongside roughly $10 billion invested through USAA's brokerage managed-money product.[^15]
Victory announced the acquisition in November 2018 and completed the purchase on July 1, 2019. The agreement specified a base purchase price of $850 million in cash at closing, plus contingent earn-out payments tied to annual revenue from non-managed-money assets over the first four years, capped at $150 million, or $37.5 million annually.14 At closing, USAA Asset Management contributed $81.3 billion in assets as of April 30, 2019, expanding Victory's pro forma client assets to $142.3 billion. Financed with cash and debt, the transaction increased Victory's pro forma debt-to-EBITDA ratio to approximately 2.7 times.[^15]
Chief Executive David Brown described the acquisition at closing as one that "significantly diversifies our investment capabilities and increases our size and scale," adding that the firm was "honored to serve the investment needs of the military community."[^15] Stuart Parker, USAA's chief executive at the time, emphasized service continuity and expanded product options for members.[^15]
Two months before closing, Victory demonstrated capital discipline by terminating a signed agreement to acquire Harvest Volatility Management while confirming that the USAA transaction remained on schedule.15 Abandoning a secondary deal to concentrate resources on the largest acquisition in its history provided concrete evidence of management's willingness to enforce transaction discipline.
The affinity channel, and what it actually is
In January 2019, six months before closing, Victory announced it would relocate its corporate headquarters from the Cleveland area to San Antonio, with Brown and key executive leadership relocating.[^18] Although Victory maintained a substantial operational footprint in Cleveland alongside its other regional offices, transferring headquarters to the target firm's city signaled a shift in strategic focus.
The move reflected practical necessity rather than symbolic posturing. USAA Asset Management was not an isolated fund complex; it was a distribution relationship embedded directly within a member organization, requiring close operational integration and physical proximity.
In substance, Victory acquired a direct-to-consumer channel: a captive client base of retail investors accessing products through institutional membership rather than intermediary broker recommendations or financial platform menus. In traditional intermediary distribution, asset managers pay twice for access—first through platform revenue-sharing fees, and second through wholesaling teams tasked with securing shelf space. Intermediary assets depend on financial advisor placement and remain vulnerable to reallocation. By contrast, a direct affinity channel leverages institutional trust, established account histories, and member inertia, yielding lower client acquisition costs and higher asset retention.
The acquired 529 college savings plan illustrated this dynamic. As multi-decade, automatic-contribution accounts established early in a child's life, 529 plans represent exceptionally sticky retail capital.
However, the affinity model carries an important structural limitation: Victory does not own USAA itself. Victory owns the asset management business and operates under long-term commercial agreements to serve USAA members. Because distribution access is contractual rather than proprietary, long-term stability remains tied to contract terms and ongoing alignment with the parent organization.
The synergy and deleveraging record
The financial execution following the acquisition was substantial. Annual revenue grew from $413 million in fiscal 2018 to $612 million in 2019—reflecting a partial year of USAA ownership—and reached $775 million in 2020. Profitability expanded at an even faster pace: adjusted EBITDA rose from approximately $130 million in 2018 to $329 million in 2020, while net income increased from $64 million to $213 million over the same period.6 Adjusted earnings per diluted share expanded from $0.90 in 2018 to $2.88 in 2020.6
Leverage followed a disciplined pattern: increasing debt to fund the acquisition, then applying post-deal cash flows to pay down principal. From approximately 2.7 times EBITDA at closing, Victory systematically reduced net leverage—a deleveraging process it repeated across three deal cycles, lowering net debt to EBITDA to 1.0 times by the end of the second quarter of 2026.1
This balance-sheet reduction highlights the capital-light nature of asset management. Capital expenditures consumed roughly 0.3% of revenue in fiscal 2025, allowing the majority of EBITDA to convert directly into cash flow.6 High cash conversion enables an acquirer to support higher leverage than an industrial peer of comparable size, provided top-line revenue remains intact. However, revenue in active asset management depends heavily on broad market levels and net asset flows, both of which can shift rapidly. Victory's successful deleveraging trajectory from 2019 through 2026 benefited from a generally supportive global equity market; the model has yet to be tested by a prolonged bear market with elevated leverage.
Rather than maintaining a static, deleveraged balance sheet, management used its expanded financial capacity to pursue further acquisitions across distinct market segments.
V. Next-Gen Scale: WestEnd Advisors & The Amundi Mega-Deal (2021–2026)
By late 2021, the wealth management industry had quietly reorganized itself around a product category Victory did not yet offer.
The expansion of independent registered investment advisors and fee-based brokerage accounts altered how investment products were bought. Financial advisors increasingly shifted away from selecting individual mutual funds for each client household—a process that was labor-intensive, difficult to scale, and challenging to defend during periods of short-term underperformance. Instead, advisors moved toward model portfolios: turn-key asset allocations built primarily with low-cost exchange-traded funds, delivered into separately managed accounts, and rebalanced automatically by the model provider.
In operational terms, wealth management shifted from selling individual investment ingredients to delivering a complete asset allocation solution. Advisors outsourced portfolio construction and rebalancing while concentrating their own capacity on client relationships, financial planning, and advisory fees.
WestEnd Advisors, based in Charlotte, was a prominent provider in this market—an ETF strategist managing approximately $18 billion across four core ETF strategies and one large-cap equity strategy in tax-efficient separately managed account structures.16 Victory announced the acquisition on November 4, 2021, and closed the transaction on December 31, 2021, paying $480 million upfront ($475.8 million in cash at closing) alongside up to $320 million in contingent earn-out payments, capped at $80 million annually, tied to revenue growth milestones.16
The acquisition addressed a major structural trend in wealth distribution. WestEnd was not an active stock-picking manager; it operated as an asset allocator implementing top-down macroeconomic views through low-cost passive vehicles. Through WestEnd, Victory established a revenue stream derived from the industry-wide shift toward passive investing, capturing allocation fees even as traditional security-selection margins compressed. The transaction also secured placement on model-portfolio marketplaces across major wealth platforms, a fast-growing distribution node in U.S. wealth management.
Also in 2021, Victory acquired New Energy Capital Partners, a Hanover, New Hampshire-based firm investing debt and equity in clean energy infrastructure—marking an initial expansion into private markets that remains a modest portion of the broader platform.7
The firm's corporate footprint expanded further through a major structural transaction three years later.
The Amundi transaction: buying a business with nothing but stock
On April 16, 2024, Victory Capital and Amundi announced a memorandum of understanding, followed by definitive agreements on July 9, 2024.17
Amundi, Europe's largest asset manager, is headquartered in Paris. Its U.S. subsidiary, Amundi US, traced its lineage to Pioneer Investments, a historic fund complex founded in Boston. Amundi sought a larger U.S. operating footprint and broader distribution scale, while Victory sought international distribution capabilities that would have required substantial capital and time to build organically.
The combination was structured entirely in equity: Amundi US was merged into Victory Capital in exchange for a 26.1% economic stake in Victory, with no cash consideration involved. Two Amundi representatives joined Victory's board of directors at closing. Simultaneously, both organizations entered fifteen-year distribution and services agreements under which Amundi distributes Victory's U.S.-manufactured active strategies outside the United States, while Victory distributes Amundi's non-U.S. products inside the United States.1718 Amundi Chief Executive Valérie Baudson noted the transaction allowed Amundi to "strengthen its presence in the US via a larger US investment and distribution platform."18
Victory issued 22.9 million shares as consideration and closed the transaction on April 1, 2025.13 The Pioneer Investments brand was restored as an active Victory investment franchise, and total client assets expanded from $176.1 billion at the start of 2025 to over $300 billion by June 30, 2025—a 76% increase within a single quarter.19
The transaction structure carried clear financial and strategic trade-offs.
On the balance sheet, funding the combination entirely with equity avoided adding debt. Net leverage improved from 1.7 times EBITDA at the end of the first quarter of 2025 to 1.2 times by the end of the second quarter of 2025, even as client assets nearly doubled.19 Rather than elevating financial risk during a major asset expansion, Victory reduced its relative leverage ratio.
Conversely, issuing a 26.1% equity stake resulted in substantial dilution, granting a single strategic partner a large block of shares and two board seats. Existing shareholders ceded more than a quarter of the company's equity to secure the combined platform.
Integration: fast, and verifiably so
Management set a target of $110 million in net run-rate expense synergies to be achieved within two years of closing. Integration tracking across four consecutive earnings calls showed rapid cost extraction: $70 million by the end of the second quarter of 2025, ninety days post-closing; $97 million (88% of target) by year-end 2025; approximately $104 million by the first quarter of 2026; and the full $110 million by the second quarter of 2026—completing the synergy execution in five quarters.195131
The steady quarterly reduction of duplicate overhead provided concrete evidence of platform integration capabilities. Chief Financial Officer Michael Policarpo disclosed integration costs directly, reporting approximately $26 million in one-time deal expenses in the second quarter of 2025 and roughly $30 million in total cash outlays to capture the target synergies.19
Alongside the Pioneer integration, management rationalized subscale strategies. In April 2025, Victory closed three of its smallest investment franchises—NewBridge, Sophus, and THB—which collectively managed under $1 billion, or roughly 0.3% of platform assets, while liquidating several subscale mutual funds and ETFs.19 The closures demonstrated a willingness to exit acquired strategies when asset growth or performance failed to justify ongoing operational scale.
The shape of the company now
By the second quarter of 2026, Victory's asset composition reflected significant diversification compared to its 2013 bank carve-out profile. At the time of the initial management buyout, U.S. equity represented approximately 80% of client assets. By mid-2026, U.S. equity accounted for 31%, solutions strategies (including over $23 billion in ETFs) represented 32%, fixed income expanded to 24%, and global and non-U.S. equity comprised 11%.1
The exchange-traded fund platform emerged as an organic growth driver. VictoryShares reached $23.2 billion in assets by the end of the second quarter of 2026, up 54% year over year, supported by $2.5 billion in year-to-date net inflows that represented an annualized organic growth rate of 27%.1 The ETF platform maintained an average fee rate of 34 basis points, reflecting Chief Executive David Brown's stated positioning that Victory is "not in the race to 0" through generic market-cap indexing.1 The flagship free cash flow ETF (VFLO) reached $7.8 billion in assets; management reported that the fund outperformed the S&P 500, Russell 1000 Growth, and Russell 1000 Value indices over its three-year record without holding mega-cap technology equities—a performance track record accompanied by a five-star rating from Morningstar.1
International distribution expanded through the Amundi partnership to $62.6 billion across 61 countries, with 35 countries holding over $100 million in client assets and 23 UCITS funds sub-advised for Amundi's global distribution network.1 Cumulative net flows through the international channel remained positive following the Pioneer transaction.
However, the reciprocal distribution arrangement displayed a clear operational imbalance. In response to analyst inquiries regarding the U.S. distribution of Amundi products, Policarpo acknowledged that domestic sales efforts focused primarily on Latin American UCITS offerings, generated lower net asset flows than the outbound channel, and paled in comparison from a size perspective.1 In practice, the partnership functions predominantly as a one-way international distribution pipeline for Victory's U.S. strategies, leaving long-term commercial value dependent on Amundi's ongoing distribution focus abroad.
VI. Strategy & Moats: Helmer's 7 Powers & Porter's 5 Forces
An evaluation of Victory Capital's strategic position highlights four distinct structural attributes: a pronounced cost-scale advantage, a proven operational integration capability, a direct distribution channel with contractual boundaries, and an ongoing industry-wide shift toward passive investing.
Hamilton Helmer's 7 Powers
Scale economies. Under Hamilton Helmer's framework, scale economies occur when unit costs fall as operational volume expands. Traditional asset management represents a prime example because core platform overhead—including compliance oversight, regulatory examination infrastructure, order management technology, fund governance, and cybersecurity—remains relatively fixed regardless of whether a firm manages $50 billion or $350 billion.
Victory executes this concept by fully centralizing administrative functions across its franchises rather than permitting duplicate back-office operations. Two primary metrics illustrate this operational leverage. First, headcount efficiency: at year-end 2025, fewer than 700 employees supported $346 billion in client assets.7 Second, sequential financial performance: in the second quarter of 2026, revenue expanded 12% quarter over quarter, while total operating expenses rose roughly 6%, from $228.8 million to $241.6 million.131 On the second-quarter earnings call, JPMorgan analyst Michael Cho highlighted that general and administrative expenses remained steady at $20 million to $22 million per quarter despite quarterly revenue increasing by nearly $100 million following the Pioneer transaction. Chief Financial Officer Michael Policarpo confirmed that over two-thirds of total operating expenses are variable, preserving a lean fixed-overhead core.1
This flexible cost structure serves to protect operating margins during market downturns, as variable compensation and distribution fees automatically decline alongside top-line revenue. Policarpo noted that Victory has sustained adjusted EBITDA margins above 49% in every quarter since 2020, and above 50% in a majority of quarters—a record of financial resilience maintained through the severe market decline of 2022.13
The market downturn of 2022 and 2023 provided a clear test of this operating structure. As global equity and fixed-income markets contracted in 2022, Victory's revenue dropped from $890 million in 2021 to $855 million in 2022, eventually declining to $821 million in 2023—an 8% total contraction across two years without acquisition relief.6
Despite that revenue drop, earnings held firm. Adjusted EBITDA actually rose from $392 million in 2021 to $440 million in 2022 before moderating to $394 million in 2023.6 Net income similarly remained stable at approximately $275 million in both 2021 and 2022.6
This performance demonstrated the core mechanical premise of Victory's model: when asset values and revenues fall, variable costs contract rapidly enough to preserve profitability. Traditional asset managers burdened by heavy fixed overhead often experience sharp margin compression during market downturns. In contrast, Victory's platform maintained earnings stability under broader industry stress.
Two analytical caveats qualify this stress test. First, the 2022 market decline was relatively brief; a multi-year bear market accompanied by persistent net asset outflows would test whether variable compensation can be curtailed repeatedly without destabilizing key investment talent. Second, the 2022 financial results incorporated contributions from the WestEnd Advisors acquisition completed in late 2021, meaning the period was not entirely driven by organic performance.
Process power. Helmer defines process power as an embedded organizational capability that rivals cannot easily replicate, even when the operational playbook is public. Victory's primary process power resides in its acquisition and integration mechanism. The firm executed eight transactions over thirteen years across diverse asset classes and structures, culminating in the five-quarter integration of Amundi US—a complex, cross-border carve-out.1
Competitors have generally pursued alternative structures. Holding companies such as Affiliated Managers Group purchase equity stakes while preserving independent affiliate back offices, foregoing central cost synergies. Meanwhile, consolidated peers like Franklin Templeton, Invesco, and Janus Henderson maintain heavier legacy overhead that can complicate post-merger integration, highlighted by Invesco's $1.79 billion asset write-down in 2025.4
Distribution scale and affinity channels. Victory operates a multi-channel distribution model combining USAA's direct member network, domestic wirehouse and registered investment advisor channels, institutional coverage, and Amundi's international sales footprint spanning over sixty countries. This distribution reach reduces overall customer acquisition costs compared to peers relying exclusively on third-party intermediary shelf space.
However, this advantage does not constitute true counter-positioning under Helmer's definition, which requires an operating model that incumbents cannot adopt without harming their legacy businesses. Competing asset managers remain free to negotiate similar distribution alliances or acquire direct-to-consumer platforms. Consequently, Victory's affinity channel represents a valuable but contractually bounded asset rather than an unchallengeable structural moat.
Absence of secondary powers. Victory exhibits limited power in the remaining categories of Helmer's framework. The firm lacks brand power, as active management strategies rarely command premium pricing based on corporate name recognition alone. It gains no network economies, since fund liquidity provides minimal incremental benefit to individual shareholders once baseline scale is met. It holds no cornered resource, given that investment professionals remain mobile. Finally, client switching costs remain modest for institutional mandates and low for intermediary retail accounts.
Porter's Five Forces
Threat of substitutes (High). The ongoing migration of capital from active equity management into low-cost index products remains a structural challenge for the asset management industry. Victory has mitigated this exposure by reducing U.S. equity from 80% of client assets in 2013 to 31% by mid-2026, while expanding solutions strategies to 32% and fixed income to 24%.1 Active fixed income has demonstrated greater resilience against passive substitution due to market fragmentation and bond universe illiquidity. In response to analyst questions regarding fixed-income exposure during the August 2025 earnings call, Chief Executive David Brown noted that investors "have done very well being active" in fixed income historically—a thesis supported by structural differences between bond indices and equity benchmarks.19
Bargaining power of buyers (Moderate to High). Institutional clients and wealth management platforms exercise substantial pricing leverage across the asset management sector. Despite this pressure, Victory's realized fee rate remained remarkably steady: 47.4 basis points in the fourth quarter of 2025, 47.6 basis points in the first quarter of 2026, and 47.9 basis points in the second quarter of 2026.5131 Management repeatedly guided to a fee range of 46 to 47 basis points and consistently exceeded that projection, leading a Barclays analyst to observe on the first-quarter 2026 call that the firm regularly outperforms its guidance.13 Policarpo explained that periodic annual fee true-ups crystallize in specific quarters, enhancing realized fee capture.13 On the second-quarter call, Barclays analyst Ben Budish noted that these episodic fee revenues expanded significantly from roughly $11 million annually in 2023 and 2024 to higher levels in 2025 and 2026.1 Management maintained that these realizations represent periodic contract settlements rather than permanent fee increases.
Competitive rivalry (High). Victory operates in an intensely competitive landscape. The firm avoids direct price competition against passive giants like Vanguard and BlackRock, while competing against firms like Fidelity and Capital Group on brand visibility and distribution scale. Additionally, Victory competes against other asset management consolidators for acquisition targets—a dynamic that directly influenced its strategic bidding in early 2026.
Threat of new entrants (Low). Developing a multi-channel global distribution system and maintaining the required regulatory compliance framework demands substantial capital and operational scale. High barriers to entry protect established platforms, making Victory's centralized infrastructure attractive to boutique managers seeking distribution scale without building back-office operations independently.
In summary, Victory Capital has established a defensible cost structure and a proven M&A integration capability within an industry facing ongoing structural headwinds. These operational strengths require continuous active execution—sourcing acquisitions, extracting synergies, and driving multi-channel distribution—rather than relying on passive competitive moats, placing significant emphasis on management's ongoing strategic discipline.
VII. Management Credibility, Incentives, & Capital Allocation
Assessing management here is unusually tractable, because Brown and Policarpo have made specific, dated, quantified promises for eight years of public earnings calls, and those promises can be checked.
The scorecard on delivery is strong. The Pioneer synergy target was quantified at $110 million, tracked publicly each quarter, and delivered in five quarters against a two-year commitment.1 Margin guidance of 49% was maintained conservatively through 2025 even as reported margins ran above it, and was only raised to 50% in August 2026 after the integration was complete — the opposite of the more common pattern of raising guidance into optimism and cutting it later.191 Adjusted earnings per diluted share have compounded at roughly 23% annually since the 2018 IPO.1
There is also evidence of the harder discipline. Victory terminated the Harvest Volatility Management acquisition in 2019.15 It closed three of its own franchises in 2025 rather than defending them.19 And in March 2026 it walked away from the largest deal it has ever attempted.
The Janus Henderson episode
This is the most revealing sequence in the company's public history, and it happened in the last twelve months.
Janus Henderson — an Anglo-American manager running approximately half a trillion dollars — became a target in late 2025.20 Victory approached its Special Committee with proposals on November 24, December 8, and December 22, 2025.21 On December 21, 2025, Janus Henderson instead signed a definitive agreement to be taken private by Trian Fund Management and General Catalyst.20
Victory did not accept that. On February 26, 2026, it went public with a proposal of $30.00 per share in cash plus 0.350 Victory shares — $57.04 per share in total, a 37% premium to Janus Henderson's unaffected October 24, 2025 price and 16% above Trian's offer. Janus Henderson shareholders would have owned roughly 38% of a combined entity carrying about $16 billion of enterprise value. Victory projected $500 million of cost synergies, and put its pro forma leverage at 3.5 times 2025 EBITDA before synergies and 2.6 times after — against a contemplated 4.6 times in the Trian structure. Victory offered a lower client-consent threshold (75% versus 80%), a lower termination fee (3% versus 4%), and full specific performance with no financing outs. Brown publicly criticized the process, saying the Special Committee had "declined any meaningful dialogue" despite Victory being "the only credible, unaffiliated bidder."21
On March 17, 2026, Victory improved again, restructuring toward more cash — $40.00 per share in cash plus 0.250 Victory shares, roughly $56.84 per share, valuing the target at about $8.6 billion.22 Then on March 24, Trian and General Catalyst raised to $52.00 per share and secured the board's recommendation. Victory withdrew the same day, stating it was "only prepared to move forward with a negotiated, consensual transaction that had the full support of the Janus Henderson Special Committee," while reaffirming that it would continue to pursue transactions that increase competitiveness through size, scale, product expansion, and distribution access.23 The Trian-led take-private, backed by the Qatar Investment Authority among others, closed on June 30, 2026 at $52.00 per share, valuing Janus Henderson at $7.4 billion.20
There are three readings, and an investor should hold all of them.
The favorable reading. Victory offered a nominally higher price and lost, and it refused to go hostile. It set a limit and observed it. Since the withdrawal, Victory's shares have risen substantially — the stock closed near $108 in early August 2026 against a 52-week low of $57.03 — which means shareholders were not diluted at a low price to fund a deal that would have taken leverage to 3.5 times into an integration of a business with its own flow problems.3
The skeptical reading. Victory pursued a target of roughly its own size for five months across five separate proposals, underwrote $500 million of synergies on a company it could not conduct full diligence on, and went public with an aggressive campaign criticizing the target board's process. That is a considerable escalation from the disciplined bilateral acquirer of the prior decade, and it is a reasonable thing for a skeptical investor to file under "watch for signs of the treadmill."
The governance reading. On the February 5, 2026 fourth-quarter call — after three private proposals had already been rejected and Janus Henderson had signed with Trian — Brown told analysts the company was "extremely busy" on acquisitions, "the busiest we ever have been," and added, pointedly, that "we will buy our stock back even more aggressively, we're working on executing on our next transformational acquisition."5 No analyst asked about Janus Henderson; nothing in the prepared remarks disclosed the live pursuit. This was almost certainly appropriate — a rejected private proposal generally carries no disclosure obligation — but it is a useful reminder for anyone modeling this company that the M&A pipeline management describes in general terms can, at any moment, be a specific $8 billion transaction that has not been disclosed.
Alignment and capital allocation
Ownership alignment is real but no longer private-equity-tight. Crestview Partners has been steadily monetizing, holding roughly 4.12 million shares as of September 30, 2025, having sold down substantially over prior years.24 Amundi holds the 26.1% strategic stake with two board seats.17 Compensation is concentrated at the top: Brown's disclosed pay was approximately $6.4 million and Policarpo's approximately $2.7 million.25
One item deserves flagging for anyone using adjusted figures. Stock-based compensation ran at approximately 10.3% of revenue in fiscal 2025, up sharply from about 2.2% in 2024.6 Policarpo explained the driver on the Q2 2025 call: the Pioneer transaction brought over fully funded deferred compensation plans that will run off over several years, and the associated expense is non-cash and retentive in nature.19 That explanation is credible and the plans were funded on the acquired balance sheet. But an adjusted EBITDA margin that excludes a real economic cost of retaining the people who manage the money is, definitionally, flattering. Investors should be clear which number they are underwriting.
The capital return record is substantial and accelerating. Since the IPO, Victory has returned $1.6 billion to shareholders including $1 billion of buybacks.1 In the twelve months to March 2026 alone it returned $512 million — over $6 per share.13 It repurchased a quarterly record 2 million shares in Q1 2026 and another 1.1 million in Q2, more in the first half of 2026 than in all of 2025, and had bought back roughly 5 million of the 22.9 million shares issued to Amundi within a year of closing.131 The quarterly dividend rose to $0.50 per share.13
Brown's stated hierarchy has been consistent to the point of repetition: strategic acquisitions first, buybacks second, dividend third. When RBC's Kenneth Lee asked in May 2026 whether the record buyback signaled that M&A was not imminent, Brown's answer was flat — "it's absolutely not the right takeaway."13 Six weeks earlier he had been trying to buy a $500 billion asset manager.
The credibility verdict: this is a management team with an unusually verifiable delivery record on cost, integration, and leverage, a consistent narrative across dozens of calls, and demonstrated willingness to walk away. It is also a team whose entire strategy requires it to keep finding large targets, and whose ambition — a stated goal of $1 trillion in assets under management — is roughly triple the current size.1
VIII. Stress Test: The Skeptical Investor & Material Risk Radar
An examination of Victory Capital's business model reveals several structural vulnerabilities and operational risks that skeptics and short-sellers frequently highlight.
The roll-up treadmill
The central bear case contends that inorganic acquisitions have long masked underlying organic outflows across legacy active strategies. Until recently, historical net flow data supported that criticism.
The empirical record shows sustained flow weakness through early 2026. Victory recorded negative long-term net flows of $660 million in the second quarter of 2025 — which management noted was the third consecutive quarter of relative improvement.19 Outflows continued at $244 million in the third quarter of 2025 and expanded to $2.1 billion in the fourth quarter of 2025.5 In the first quarter of 2026, long-term net flows remained negative at $457 million.13 Not until the second quarter of 2026 did the firm turn net positive, posting $4.2 billion in net long-term inflows — a nearly $5-billion turnaround from the prior-year period that brought total net flows into positive territory for the first half of 2026.1
While two quarters of positive momentum do not establish a permanent trend, the composition of sales points to an expanding sales funnel. Gross long-term sales rose from $6.6 billion in the fourth quarter of 2024 to $17.1 billion in the fourth quarter of 2025, reaching a record $22.1 billion in the second quarter of 2026 — representing an annualized gross sales pace equal to roughly 27% of long-term assets under management.51 Chief Executive David Brown indicated on the second-quarter call that flow momentum continued into the third quarter of 2026 and that the unfunded pipeline stood near historic highs, though management does not provide specific dollar guidance on pending mandates.1
Skeptics also observe that management attributed the sharp $2.1 billion outflow in the fourth quarter of 2025 to a single platform redemption of nearly $1 billion alongside typical year-end client rebalancing.5 While single-quarter redemptions occur across asset management, relying on episodic explanations highlights how sensitive net flows remain to large institutional platform decisions.
The balance sheet nobody talks about
A second key vulnerability involves balance-sheet structure.
Goodwill and acquired intangible assets accounted for approximately 87% of Victory's total assets at the end of fiscal 2025, resulting in a negative tangible book value of roughly $1.3 billion.6 This balance-sheet profile reflects serial acquisition accounting: purchasing asset managers with debt and equity generates capital asset values composed largely of management contracts and client relationships classified as indefinite-lived intangibles.
Indefinite-lived intangibles are not amortized over time; instead, they undergo annual impairment tests sensitive to projections of assets under management, fee realization rates, and discount factors. If market levels drop or outflows accelerate, write-downs can materialize abruptly.
Peer precedent illustrates this valuation risk. Invesco recorded a $1.79 billion non-cash impairment on indefinite-lived management contracts acquired in prior retail mutual fund deals during the fourth quarter of 2025, driving its quarterly GAAP operating margin to negative 86%.4 Because Victory holds a similar intangible asset structure, a prolonged market downturn or renewed net outflows could trigger non-cash write-downs. While impairments do not consume cash directly, they reduce statutory equity, increase reported leverage ratios, and potentially tighten debt covenant compliance during deal cycles.
Key-person and franchise concentration
Victory's multi-boutique design also carries franchise-concentration risks. The economic value of key franchises like Sycamore Capital, RS Value, or WestEnd Advisors relies heavily on small investment teams and named portfolio managers. Victory does not break out individual franchise revenue or assets under management, nor does it publicly disclose manager retention agreements. The 2025 liquidation of three subscale franchises showed that boutique autonomy can end in closure when strategies lose scale.
Counterbalancing that risk is the operational persistence of acquired teams. RS Investments was acquired in 2016, yet its RS Global and RS Value strategies continued to generate positive net flows in 2026.1 Similarly, Pioneer Investments achieved positive net flows in every quarter following its April 2025 close, with Morningstar performance ratings matching or exceeding levels recorded prior to the transaction.5 These results indicate that centralizing back-office operations has not disrupted investment execution, though long-term retention remains an ongoing requirement.
Contractual dependencies, not owned assets
Three of Victory's primary growth drivers depend on contractual agreements with external partners rather than wholly owned assets.
First, access to USAA's military member base relies on commercial distribution agreements with an independent parent organization. Second, the international distribution network rests on a fifteen-year partnership with Amundi, whose global sales force dictates outbound product push. Management noted that Amundi conducted extensive roadshows for Victory strategies in 2026 and placed several offerings on concentrated focus lists.1 However, because Amundi is simultaneously Victory's largest shareholder, a board-represented entity, and its primary overseas distributor, commercial success remains tightly linked to alignment with a single European institution.
Third, exchange-traded fund distribution depends on maintaining recommended placement across major domestic wealth management platforms, including Morgan Stanley, Merrill, Wells Fargo, RBC, and LPL.5 Securing home-office approval drives retail model allocations, but platform reallocations can reverse asset flows rapidly.
The cost of capital, and a lesson already learned
Debt structure represents another operational variable. Victory finances cash-funded acquisitions primarily through floating-rate Term Loan B facilities. Rising benchmark rates increased annual interest expense from approximately $47 million in fiscal 2022 to roughly $77 million in 2023—an additional $30 million annual cost on identical principal.6
Management addressed this debt burden through opportunistic refinancing. In the third quarter of 2025, Victory consolidated its credit lines into a single $985 million term loan maturing in 2032, lowering its interest spread to SOFR plus 200 basis points and saving approximately $3.5 million in annual interest.5 In the second quarter of 2026, the firm repriced the term loan again, reducing annual interest expenses by an additional $2.5 million.1 Moody's upgraded Victory's debt outlook from stable to positive in July 2025.19
These actions demonstrated that high cash conversion and low net leverage provide balance-sheet flexibility during rate cycles. Nevertheless, floating-rate debt leaves future borrowing costs exposed to broader macroeconomic conditions when funding large transactions.
Market beta and fee compression
Victory earns an average fee rate of 46 to 47 basis points across client assets.1 Consequently, a major equity market decline automatically reduces top-line revenue. Victory's primary defense is its flexible cost structure, in which variable expenses represent over two-thirds of operating costs—allowing the firm to maintain adjusted EBITDA margins above 49% during the 2022 market decline.13
On pricing, Victory has stabilized fee margins by shifting product mix toward solution strategies and ETFs rather than discounting legacy active equity funds. Sustaining this rate requires continuously expanding strategies that command higher fee realizations.
Execution risk in the thing that has not happened yet
Finally, management's long-term target of $1 trillion in assets under management introduces execution risk. Chief Executive David Brown noted that the market includes over 110 firms managing between $50 billion and $200 billion, and more than 35 firms in the $200 billion to $500 billion bracket.1 Achieving $1 trillion would require transactions larger and more complex than past acquisitions. The unsuccessful bid for Janus Henderson highlighted these market dynamics: private equity consortiums competing for asset managers can deploy all-cash structures without public market accretion constraints, raising competition for large-scale targets.
IX. The Investment Playbook & What to Watch
Why it wins from here
Evaluating Victory Capital's forward growth trajectory highlights three core structural mechanisms.
A structural cost position that competitors cannot easily match. This efficiency is verifiable: fewer than 700 employees support $346 billion in client assets, more than two-thirds of the cost structure is variable, general and administrative expenses remained flat while post-Pioneer quarterly revenue expanded by nearly $100 million, and fiscal 2025 GAAP operating margins reached roughly 42% compared to about 30% at T. Rowe Price.716 Competitors face steep hurdles to replicate this cost structure, which was built into Victory's platform architecture from inception rather than retrofitted onto legacy operations.
An integration capability with a track record of rapid execution. Victory has completed eight acquisitions, fully integrating its largest transaction in five quarters while delivering synergies ahead of its initial two-year target and reporting progress on consecutive earnings calls.1 In a consolidating industry where integration execution is often the limiting factor, this operational discipline functions as a core competitive differentiator.
Multi-channel distribution breadth that drives asset flows. Distribution spans the direct USAA member network, domestic intermediary and institutional platforms, and international coverage across more than sixty countries. This distribution reach recently translated into fund flows, generating record gross sales and record net long-term inflows that management reported were broadly distributed across investment franchises rather than concentrated in a single mandate.1
Why it may not
Because the organic flow inflection remains recent. The positive elements of the growth thesis — net long-term inflows, international momentum, and an expanded margin target — date to the first half of 2026, following seven consecutive quarters of net outflows. Assessing the firm's forward outlook requires evaluating whether this momentum reflects a durable structural shift or a temporary cyclical tailwind driven by broad market gains and sales backlog execution.
Because the asset structure lacks a tangible capital cushion. Negative tangible book value and an asset base comprising 87% goodwill and acquired intangibles mean financial resilience rests entirely on ongoing cash flow generation rather than balance-sheet asset backing. Invesco's 2025 asset impairment illustrates how a prolonged market downturn can impact carrying values across acquired fund contracts.46
Because the strategy depends on continuous deal sourcing. Value creation relies significantly on acquiring targets below their post-synergy enterprise value. Sustaining that strategy requires a steady pipeline of suitable targets at disciplined valuations, where Victory increasingly competes against private equity consortia with distinct capital structures and return hurdles, as shown by the competitive bidding for Janus Henderson.
Because key distribution channels depend on third-party agreements. Access to the USAA military member base and the international distribution network rest on commercial contracts with external institutions whose strategic priorities or distribution focus may evolve over time.
Because equity valuation has largely priced in the operational re-rating. Throughout much of its public history, Victory traded at a valuation discount relative to its financial performance — a dynamic Chief Executive David Brown highlighted in February 2026, telling analysts that the sector was underappreciated and that Victory represented ground zero for that disconnect.5 That valuation gap has narrowed significantly. Victory's market capitalization expanded from roughly $4.1 billion at year-end 2025 to over $6.7 billion by early August 2026, with equity trading near the upper end of a 52-week range that saw a low of $57.03.63 While the operational model remains intact, the market price reflects much of the valuation re-rating management previously advocated.
The three metrics that actually matter
Evaluating Victory's operational trajectory focuses on three core performance indicators.
1. Long-term net organic flows by channel and franchise. Headline net flow figures require examination by asset class and distribution source. Broad-based net inflows across VictoryShares ETFs, international distribution, and fixed income indicate effective product diversification. Conversely, net flows driven by an isolated institutional mandate while active equity experiences redemptions suggest ongoing organic headwinds. Investors will track whether the flow inflection recorded in the second quarter of 2026 sustains across consecutive quarters to confirm a structural trend.
2. Adjusted EBITDA margin stability against the 50% guidance floor. Management elevated its long-term adjusted EBITDA margin guidance from 49% to 50% in August 2026, establishing a benchmark following years of consistent margin outperformance.1 The key operational test is whether profitability remains at or near this 50% threshold during market pullbacks, demonstrating that variable expense structures effectively protect operating margins under broader industry pressure.
3. Net debt to adjusted EBITDA as an indicator of capital deployment. At 1.0 times net debt to EBITDA, Victory carries significant balance-sheet capacity.1 Leverage levels serve as a primary indicator of corporate strategy: a sharp increase reflects major acquisition activity and initiates a new integration phase, whereas a sustained low leverage ratio accompanied by elevated share repurchases indicates valuation discipline or a scarcity of suitably priced acquisition targets.
Short-term fluctuations in quarterly fee realizations, seasonal fee settlements, and monthly asset disclosures remain secondary to these core operational metrics.
X. Epilogue & Final Verdict
The most compelling aspect of Victory Capital's trajectory is not the sheer expansion of its asset base, but the operational mechanism behind it.
The model did not rely on superstar portfolio managers or household-name funds. Victory's investment performance has been solid — management reported that 57 of its mutual funds and ETFs held four- or five-star overall Morningstar ratings as of June 30, 2026, representing 60% of rated assets under management, compared to roughly a third of rated funds industry-wide — but strong performance remains a baseline requirement in asset management rather than a structural moat.1
Instead, the firm's core advantage was architectural. Management identified a fragmented landscape of boutique asset managers burdened by fixed overhead they lacked the scale to absorb, and built an operating platform to extract those costs. The strategy rests on a fundamental principle of cost structure: in an industry defined by intangible products and heavy regulatory compliance, scale in non-investment operations carries greater economic leverage than scale within individual portfolio teams. By keeping investment franchises autonomous while centralizing trading, compliance, legal oversight, technology, and distribution, Victory converted duplicate administrative costs into high-margin operating cash flow.
That structural approach extends beyond asset management, offering a case study in how back-office centralization can extract value from fragmented, high-overhead sectors.
The primary strategic question is whether this operating model can scale to its next growth phase. Expanding client assets from $17.9 billion to $346 billion required eight transactions over thirteen years. Reaching Chief Executive David Brown's stated target of $1 trillion will require larger, more complex acquisitions — similar to the unsuccessful bid for Janus Henderson, where targets feature independent boards, formal proxy processes, and competing private equity buyers unconstrained by quarterly public earnings expectations. The playbook applied to regional boutiques and corporate carve-outs has not yet been tested at that scale.
Meanwhile, industry consolidation continues to accelerate, driven by ongoing structural pressures: rising regulatory complexity, escalating technology costs, and distribution economics that increasingly penalize subscale managers. These forces ensure a continuing pipeline of potential acquisition targets.
Whether Victory Capital continues to act as a principal consolidator or eventually becomes an acquisition target for an even larger platform remains the defining question for its next decade.
References
-
Victory Capital Second Quarter 2026 Earnings Conference Call transcript, August 6, 2026 — Victory Capital Investor Relations ↩↩↩↩↩↩↩↩↩↩↩↩↩↩↩↩↩↩↩↩↩↩↩↩↩↩↩↩↩↩↩↩↩↩↩↩↩↩↩
-
KeyCorp To Sell Victory Capital Management And Affiliate For $246 Million — KeyCorp Investor Relations, 2013-02-21 ↩↩↩↩
-
Invesco Reports Results for the Three Months and Year Ended December 31, 2025 — PR Newswire, 2026-01-27 ↩↩↩↩
-
Victory Capital Fourth Quarter 2025 Earnings Conference Call transcript, February 5, 2026 — Victory Capital Investor Relations ↩↩↩↩↩↩↩↩↩↩↩
-
Victory Capital Holdings, Inc. SEC filings, including Forms 10-K and 10-Q (CIK 0001570827) — U.S. Securities and Exchange Commission ↩↩↩↩↩↩↩↩↩↩↩↩↩↩↩
-
About Victory Capital — corporate overview and investment franchise directory — Victory Capital ↩↩↩↩
-
David C. Brown, Chairman and Chief Executive Officer — Victory Capital leadership team ↩↩
-
Victory Capital Announces Close of Munder Acquisition — Victory Capital Investor Relations, 2014-10-31 ↩↩
-
Victory Capital Holdings, Inc. Form S-1 registration statement — U.S. Securities and Exchange Commission, 2018 ↩
-
Victory Capital Announces Pricing of Initial Public Offering — Victory Capital Investor Relations, 2018-02-08 ↩
-
Victory Capital stock falls nearly 11% in first day of trading — Pensions & Investments, 2018-02-08 ↩
-
Victory Capital First Quarter 2026 Earnings Conference Call transcript, May 7, 2026 — Victory Capital Investor Relations ↩↩↩↩↩↩↩↩↩↩↩↩↩↩
-
Victory Capital Completes Acquisition of USAA Asset Management Company — Victory Capital Investor Relations, 2019-07-01 ↩
-
Victory Capital Reports Acquisition of USAA Asset Management Company on Track to Close on Time, and Announces Termination of Agreement to Acquire Harvest Volatility Management, LLC — Victory Capital Investor Relations, 2019-04-22 ↩↩
-
Victory Capital Completes Acquisition of WestEnd Advisors — Victory Capital Investor Relations, 2021-12-31 ↩↩
-
Victory Capital and Amundi Execute Definitive Agreement to Become Strategic Partners — Victory Capital Investor Relations, 2024-07-09 ↩↩↩
-
Amundi and Victory Capital sign a definitive agreement to become strategic partners — Amundi, 2024 ↩↩
-
Victory Capital Second Quarter 2025 Earnings Conference Call transcript, August 8, 2025 — Victory Capital Investor Relations ↩↩↩↩↩↩↩↩↩↩↩
-
Janus Henderson Completes Take-Private Transaction with Trian, General Catalyst, and QIA — Janus Henderson Investors, 2026-06-30 ↩↩↩
-
Victory Capital Affirms Fully Financed, Clearly Superior Proposal to Acquire Janus Henderson — Victory Capital Investor Relations, 2026 ↩↩
-
Victory Capital Submits Improved, Actionable and Clearly Superior Proposal to Acquire Janus Henderson — Business Wire, 2026-03-17 ↩
-
Victory Capital Withdraws Proposal to Acquire Janus Henderson — Victory Capital Investor Relations, 2026-03-24 ↩
-
Crestview Partners II GP, L.P. — Victory Capital Holdings Inc (VCTR) holding history — GuruFocus ↩
-
Victory Capital Holdings Inc (VCTR.O) Company Profile — Reuters ↩
 LinkedIn
 WhatsApp
 Reddit
 Hacker News
 Email
Email Kindle
 RSS Feed
 Spotify
 Apple Podcasts
 Amazon Music
 Audible
 YouTube