TIC Solutions: The Roll-Up That Has to Become a Company
I. The $1.7 Billion Bet
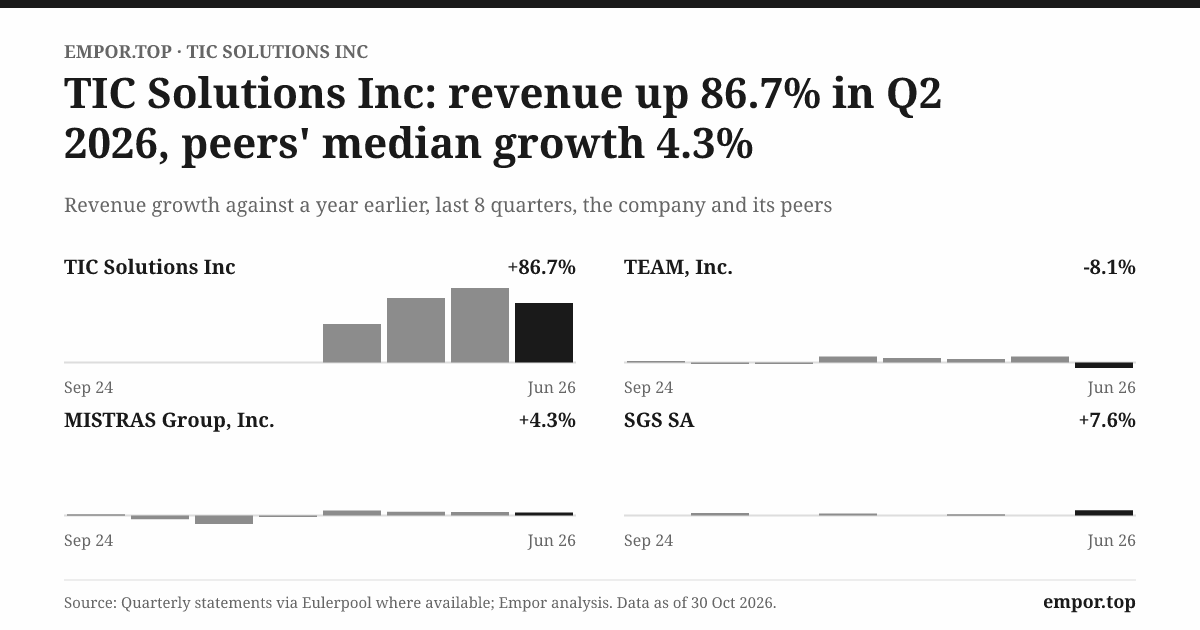
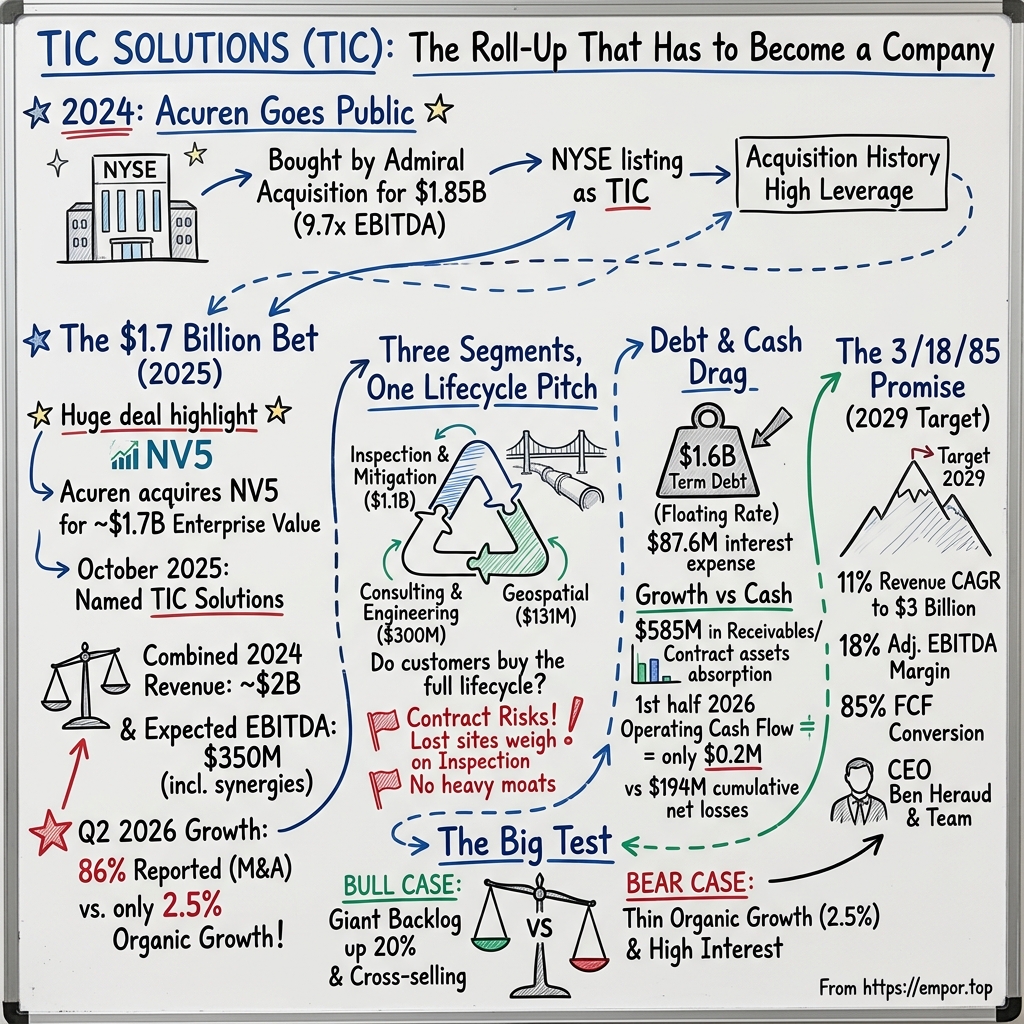
On August 6, 2026, TIC Solutions put out a set of numbers that could be read two completely different ways. Read the top line, and the company looked like a rocket. Revenue for the second quarter came to about $584 million, up roughly 86% from the same quarter a year earlier.1 Very few industrial services companies of any size grow at that speed. Then read a few lines further down, where the company strips out the businesses it bought and compares like with like. On that basis, the combined business grew 3.3%, and organic growth, the growth that came from doing more work for customers rather than from buying other companies' customers, was 2.5%.1
Eighty-six percent and two and a half percent. Both numbers were true. Both were reported by the same company in the same release. And the distance between them is the whole story of TIC Solutions.
The 86% came from a single decision made fifteen months earlier. In May 2025, Acuren Corporation, an inspection and asset-integrity company that had only recently become publicly traded, agreed to buy NV5 Global, an engineering, consulting and geospatial firm, in a cash-and-stock deal valued at about $1.7 billion including debt.23 The deal closed on August 4, 2025.4 Two months later the combined company dropped the Acuren name and became TIC Solutions, a name borrowed from the industry's own shorthand for testing, inspection and certification.4 The pitch to investors was about scale: on a pro forma basis, the two companies together had generated roughly $2 billion of revenue in 2024 and about $350 million of adjusted EBITDA once management's expected synergies were included.2
That is a big number to say out loud. Adjusted EBITDA, for listeners who have not spent their lives in earnings releases, is a measure of operating earnings before interest, taxes, depreciation and amortization, with additional items that management considers one-off stripped away. It is useful for comparing businesses with different capital structures. It is also, by construction, the most flattering profit number a company can show. Holding onto that distinction will matter for the rest of this story, because TIC's adjusted numbers and its reported numbers tell very different tales.
So the question for anyone thinking about TIC as a long-term business is not whether the NV5 deal made the company bigger. It obviously did. The question is whether it made the company better: whether buying NV5 created a platform that can grow on its own, win work in a crowded and fragmented services market, and turn that work into cash, all while carrying a large pile of floating-rate debt. A roll-up, which is what finance people call a company assembled by buying many smaller ones, can be a wonderful machine. It can also be a collection of separate businesses with a shared logo and a shared lender. The first comparable quarters suggest TIC has not yet proved which one it is.
Before going further, it helps to be precise about what "TIC" actually means as a reporting entity, because the history is tangled. The listed company is the former Acuren. NV5's results enter TIC's books only from August 4, 2025.4 Everything NV5 earned before that date belongs to a separate company that happened to be bought later, and none of it counts as TIC's own growth. When a revenue chart shows TIC's sales leaping from about $1.1 billion in 2024 to about $1.5 billion in 2025, the leap is mostly NV5 arriving for five months, not Acuren's customers suddenly needing more inspectors.4
There is one more trap, a small one but worth naming. TIC's fiscal year ends on December 31.4 Some data providers label its years as ending in November, a quirk of how they map reporting periods. A "November 2025" year in a database is TIC's calendar 2025, and a careful reader has to line the labels up with the company's own filings before comparing anything. It sounds pedantic. It is the kind of detail that, missed, makes a quarter look like a turnaround or a collapse when it is neither.
Three tests run through everything that follows. The first is organic growth: does the combined business grow without new acquisitions? The second is cash: do the adjusted earnings turn into money in the bank after customers pay their bills? The third is the balance sheet: can the company integrate, invest and keep buying while servicing debt that floats with interest rates? The Q2 report gave a provisional answer to each. Organic growth was positive but thin. Cash generation in the first half was close to zero. And the debt was still there, a little over $1.6 billion of it.5
None of that makes the bet a failure. Integration takes time, and the first year of any merger is noisy. But it does mean the burden of proof sits with the company. To see why, start where the platform itself started, with a Canadian-rooted inspection business that private equity had already been building through acquisitions for years before public investors ever owned a share.
 Subscribe on LinkedIn
II. Acuren Goes Public With a Buy-and-Build Record
Picture a refinery in northern Alberta in deep winter. A pipe carrying hot hydrocarbons has been in service for decades, and somewhere inside it, corrosion may be thinning the steel. Nobody can afford to cut it open to look. So a technician arrives with equipment that sends sound waves or radiation through the metal and reads what comes back, the way a doctor reads an ultrasound. If the wall is too thin, the plant schedules a repair before the pipe fails. If it is fine, the plant keeps running. The technician's report goes into a regulatory file, and the work is done again on a schedule set by codes and insurers.
That is nondestructive testing, usually shortened to NDT, and it is the heart of what Acuren did. Add rope-access crews who dangle from bridges, dams and towers to inspect and repair places scaffolding cannot easily reach, plus engineering and laboratory work on why materials fail, and you have a business that lives inside the maintenance budgets of refineries, chemical plants, pipelines, power stations and mines. It is unglamorous, essential, and highly fragmented, with many local and regional providers competing for site-by-site work.
Acuren grew up in that world, with a large footprint in Canada and the United States. Its geography still shows: about 36% of TIC's 2025 revenue came from outside the United States, substantially from Canada.4 For years before it reached public markets, the business was owned by private equity firm American Securities, and like many sponsor-owned services companies, it grew by stitching smaller inspection and engineering firms into a bigger network. Legacy Acuren revenue reached about $1.05 billion in 2023.4
The route to public markets was unusual. Acuren did not hold a conventional initial public offering, with bankers marketing new shares to institutions and a first day of trading on a big exchange. Instead, it was bought by Admiral Acquisition Limited, a London-listed acquisition vehicle whose leadership included Sir Martin Franklin, the deal-maker best known for building Jarden into a consumer-products conglomerate, and his long-time partner James Lillie.67 Admiral agreed in 2024 to buy Acuren from American Securities for approximately $1.85 billion, which it said equated to about 9.7 times Acuren's estimated 2024 adjusted EBITDA.7 The purchase completed in July 2024.8
Franklin's involvement is important for understanding what kind of company this was meant to be. His track record is in using public vehicles to acquire and then keep acquiring, with management incentives tied to building scale. A company with his name on the board was never going to be a quiet single-line inspection business. It was going to be a platform.
The financing reset the balance sheet. Admiral brought equity raised from its investors, and the acquisition was paid for with a mix of that cash, new borrowing and equity. The effect showed up clearly in the year-end figures. Shareholders' equity jumped from about $382 million at the end of 2023 to about $1.2 billion at the end of 2024, while borrowings rose only modestly, from about $730 million to about $813 million.84 Debt-to-equity, which had been close to two to one under private-equity ownership, fell to about 0.7.4 That is worth pausing on. The new owners did not lever Acuren up further; they put in a large slug of equity and inherited a more conservative structure than the sponsor had run. That conservatism would not last through the next deal, but at the start, the public company was better capitalized than the private one had been.
The new capital was not operating performance, though, and it is easy to confuse the two. A balance sheet that looks stronger because investors wrote a check tells you nothing about whether the inspection crews were earning more per hour. On that front, 2024 was a messy year. Because of the change in ownership, the company's accounts split the year into a "predecessor" period before the deal and a "successor" period after it, and the successor period carried a new layer of costs from purchase accounting, the rules that force an acquirer to revalue the target's assets and then depreciate and amortize them.4 The combined 2024 picture showed an operating loss of about $47 million and a net loss of about $121 million, driven in large part by those acquisition-related charges and interest.4
The public listing itself came in stages. Acuren shares began trading on NYSE American in February 2025 and moved to the main New York Stock Exchange in May 2025.4 In October 2025, by then renamed TIC Solutions, the company filed an S-1 registration statement that became effective on October 29, 2025.94 That filing was not an IPO either. It registered shares and warrants already sold in a private placement so the buyers could resell them in the market.9 So TIC arrived as a public company through a side door: a London-listed vehicle, a U.S. exchange listing, an uplisting, and a resale registration. Public shareholders have owned it for less than two years.
That short window matters. There is almost no long-run public record against which to judge management's favorite claim: that it runs a "repeatable M&A playbook." The claim is plausible. Acuren's acquisition history is real, and the Franklin network has done roll-ups before. But a playbook is proved by what happens after the deals close: whether acquired businesses grow, whether margins improve, whether any purchases have to be written down. In the record available so far, the 2024 and 2025 results are dominated by purchase-accounting charges and integration costs, which makes it hard to see whether underlying acquired businesses got better under new ownership.4 There is no disclosed large goodwill impairment, which is a modest point in management's favor. But no write-down in the first year after a deal is a low bar, not proof of skill.
The fairest reading of Section II, then, is that TIC inherited a genuine operating business with a long buy-and-build history and an owner group whose instincts run toward more deals. Integration is not a side project for this company. It is the thesis. And the deal that would test that thesis hardest was already on the way: less than a year after closing Acuren, the same team agreed to buy a company nearly as large again, in an entirely different line of work.
III. Three Businesses, One Lifecycle Pitch
Imagine a new water-treatment plant, or a highway interchange, or a hospital wing. Before it exists, someone has to survey the land and map it, often from aircraft equipped with laser scanners. Someone has to engineer it and inspect the construction as it goes up, testing the concrete and the welds. Once it is built, someone has to inspect it for decades, finding corrosion, cracks and wear before they become failures. And when the owner wants to know the condition of a thousand such assets at once, someone has to turn all those inspections and scans into data a manager can act on.
That cradle-to-grave sequence is the picture TIC Solutions sells. Management describes the combined company as a partner across the full lifecycle of an asset, from design and construction through inspection, maintenance and data work.10 The idea is that a customer who already trusts TIC to map a corridor might hire it to engineer the project, and a customer that trusts TIC's inspectors might buy its data and software. If that works, each relationship becomes worth more than the sum of its parts.
The reality, at least on the revenue line, is less blended than the pitch. TIC reports three segments. In calendar 2025, Inspection & Mitigation, the old Acuren core of NDT, rope access and related field services, generated about $1.10 billion of TIC's $1.53 billion revenue.4 Consulting & Engineering, which came mostly from NV5 and covers testing, inspection and consulting on infrastructure, buildings and utilities, generated about $300 million.4 Geospatial, NV5's mapping, surveying, data and software business, generated about $131 million.4 Those NV5 figures cover only the five months after the deal, so they understate the segments' full-year weight, but even on a pro forma view Inspection & Mitigation remains the anchor.
The segments also make money in different ways, and that difference shapes how the company behaves quarter to quarter. Inspection & Mitigation mostly works on time-and-materials or cost-plus terms: the customer pays for the hours technicians spend and the costs they incur, plus a margin.4 That model has a built-in safety feature, because if a job takes longer, the customer pays more. Its weakness is that profit depends on keeping technicians busy. A technician who sits idle between outages, or who travels to a job that gets postponed, still costs money.
Consulting & Engineering and Geospatial rely more on fixed-price and fixed-unit-price work, where TIC agrees a price up front and keeps the difference if it delivers efficiently.4 Fixed-price work can earn better margins when it is well run, but it carries more risk: an aerial-mapping project hit by bad weather, or an engineering scope that grows without a matching change order, can eat the margin. Revenue on some of this work is recognized when deliverables are completed or accepted, which makes results lumpier from quarter to quarter.4 Geospatial also sells software subscriptions, a small but genuinely recurring stream.4
Here is the key analytical point about mix. The biggest segment by revenue is not the one with the best economics. TIC's filed segment data shows Consulting & Engineering and Geospatial earning higher gross margins than Inspection & Mitigation.4 That makes intuitive sense. A rope-access technician's hour is a fairly standardized product; the price of that hour is set partly by what other contractors charge for similar skills. An engineering design, a certified mapping product or a software subscription carries more intellectual content, and customers compare those providers less purely on hourly rate. So if TIC's revenue mix shifts toward engineering and geospatial work, its overall margin should rise even if no individual business improves. That mix shift is one of the quiet engines in management's long-term plan.
The second quarter of 2026 offered a live test of how the three pieces were moving. Inspection & Mitigation revenue fell 5.5% from the year before.1 Geospatial revenue rose 7.9%.1 And the combined backlog of Consulting & Engineering and Geospatial, meaning work under contract but not yet performed, reached a record $1.18 billion, up 20%.1 In other words, the old core shrank while the newer, higher-margin pieces grew and booked more future work. If you wanted a single quarter to illustrate the bull case for the merger, this would be a reasonable candidate: NV5 brought exposure to infrastructure, utility and public-sector spending at a moment when Acuren's industrial core was soft.
But notice what that quarter does not show. It does not show cross-selling. A segment growing on its own is evidence that NV5 was a decent business to buy; it is not evidence that combining NV5 with Acuren created something new. The lifecycle story requires a specific kind of proof: customers who started with one segment and then bought from another, retention rates that rose after the merger, or prices that held up because customers valued the bundle. TIC has talked about cross-selling wins on its calls, and management has framed cross-selling as one of the levers in its 2029 plan.1112 What the company has not published is the number that would settle it: cross-sell revenue, the share of revenue from customers using more than one segment, or customer retention rates.4
There are reasons to think the lifecycle model could work. Many of TIC's customers, utilities, pipeline operators, state transportation agencies and industrial owners, buy inspection, engineering and data services from someone. They prefer fewer, qualified vendors, partly because qualifying a contractor for safety and regulatory purposes is costly. A provider already on site, already cleared for safety, with technicians the plant manager knows, has a natural opening to quote on the next scope. That is the mechanism.
There are also reasons for caution. In large organizations, the people who buy NDT for a refinery's turnaround are rarely the people who commission a geospatial survey or a building-code review. Engineering clients and industrial maintenance clients sit in different budgets with different procurement rules. A "one-stop shop" is attractive in a presentation; in practice, procurement departments often unbundle scopes precisely to keep competitors bidding against each other.
So the verdict on the lifecycle pitch is that it is a plausible strategy without proof yet. Inspection & Mitigation remains the revenue anchor; the other two segments carry better margins and stronger backlog momentum; and the advantage of combining them remains unquantified. The KPI that would change that assessment is simple to state: disclosed revenue from customers served by more than one segment, growing faster than the company as a whole. Until that appears, the lifecycle partner is an idea TIC is selling, not a result it has demonstrated. And the weak quarter in the core inspection business raises a harder question still: if this work is so essential, why did customers take some of it away?
IV. The Work Is Essential; the Contracts Can Still Walk
Somewhere in 2025, a set of customer sites stopped being TIC sites. The company has never named the customer or customers, nor said how much revenue went with them.5 But the loss showed up clearly enough. When Inspection & Mitigation revenue fell 5.5% in the second quarter of 2026, management pointed partly to those 2025 site losses, alongside lower outage activity and the timing of planned work.112 On the call, management said the segment's commercial indicators were improving, that technical yield and pricing were getting better, and that the company would lap the site losses from August.12
That small episode carries a large lesson about this industry. Inspection is essential work. Refineries cannot skip it; pipeline regulators demand it; insurers depend on it. But "the work must be done" and "the work must be done by us" are very different statements. The first describes demand. The second describes a moat. TIC clearly has the first. The question in this section is whether it has the second.
Start with who TIC competes against, because the answer depends on which of its businesses you look at. In industrial inspection and asset integrity, the closest listed comparison is MISTRAS Group, a U.S. specialist in NDT and asset-protection services. In broader testing, inspection and certification, the global giants are SGS of Switzerland, Bureau Veritas of France and Intertek of the United Kingdom, companies that test everything from consumer products to cargo and industrial equipment. In engineering and infrastructure consulting, where NV5 lived, the comparisons are firms such as Tetra Tech in the United States and WSP and Stantec in Canada. Beneath all of them sit thousands of regional and local operators.
Those comparisons need care. SGS, Bureau Veritas and Intertek are far bigger, far more global and far more diversified than TIC. WSP and Stantec are engineering design houses on a scale TIC does not approach. MISTRAS overlaps most closely with Acuren's legacy work, but not with NV5's. TIC does not publish a market-share figure that would establish its relative position across its combined platform, and no single industry ranking captures a company that spans rope access in Alberta and aerial lidar mapping in California.4 So the honest framing is that TIC is a meaningful player in several fragmented niches, not a dominant player in any single one that can be measured.
Now look at the forces that shape profitability in those niches. Customers have real power. A refinery can rebid an inspection contract; a utility can split a program across several vendors; a state agency must often tender work publicly. The site losses are a direct demonstration: customers can and do move work. On the other side, the single-customer risk is modest. No customer accounted for more than 10% of TIC's sales or receivables in any of 2023, 2024 or 2025, and no supplier accounted for more than 10% of purchases.4 That diversification means no single buyer can dictate TIC's fate. It does not mean buyers as a group lack leverage, because each of them can rebid its own slice.
Suppliers, in this business, mostly means people. TIC's real input is certified technicians, engineers and surveyors. It employed 12,760 people at the end of 2025, including 1,676 temporary workers.4 Skilled NDT technicians are certified at different levels and take years to develop; when demand spikes during the spring and autumn outage seasons, everyone competes for the same crews. That makes labor both a cost pressure and a capacity constraint, and it explains why utilization, the share of paid hours that are actually billed, is the hidden lever on margins.
New entrants and rivals face low barriers at the small end. A handful of certified technicians with equipment can bid on local work. The barriers rise for large, multi-site programs where safety records, insurance capacity, geographic coverage and data systems matter. That is where TIC's scale should help. Substitutes come mostly from technology: drones, robotic crawlers, permanently installed sensors and analytics software can reduce the number of technician hours a given inspection requires. That is a risk to a labor-billed model and an opportunity for a company that sells the technology itself, which is part of why NV5's geospatial and data business appealed to management.
Regulation deserves its own line, because it is the most common bull argument. Codes and regulators require periodic inspection of pressure vessels, pipelines, bridges and much else. That requirement supports durable demand. It does not, by itself, guarantee pricing power. The regulator specifies that an inspection must happen and to what standard; it rarely specifies who must do it. Compliance creates the market. It does not award it.
Put together, the moat conclusion is this. TIC's field expertise, safety qualifications and on-site presence probably create some stickiness: a plant manager who has worked with the same crew for years has reasons not to switch. The company describes recurring revenue and repeat business from long-standing customers.4 But TIC does not quantify recurring revenue's share, typical contract length, minimum commitments, retention rates or price realization.4 Without those numbers, switching costs remain an assertion. The site losses are the one hard data point in the public record about customer behavior, and they point the other way. The evidence narrows the moat claim to a smaller version: TIC has durable demand and diversified customers, with weak to moderate switching costs that it has not demonstrated.
What would prove that reading wrong? Three things, visible in future quarters. Sustained site wins in Inspection & Mitigation that more than offset the 2025 losses. Utilization and pricing gains that show up as rising segment margins, not just in management's commentary. And evidence of cross-selling. Management told investors in August that it would lap the site losses from that month onward.12 The third-quarter segment results will be the first test of whether the core business returns to growth once the easy comparison arrives, or whether the losses were a symptom of something more persistent.
If the moat is thin, then the price paid to build the platform matters even more. A company with strong switching costs can afford to overpay a little, because customers will eventually reward it. A company competing scope by scope needs to have bought its assets cheaply. So what exactly did TIC pay for NV5?
V. The Price of Adding NV5
In mid-May 2025, NV5's shareholders received an offer that was hard to dismiss. For every NV5 share, Acuren offered $10 in cash plus $13 worth of Acuren stock, $23 in all, representing a 32% premium to NV5's 30-day volume-weighted average share price.2 When the deal closed, NV5's former owners would hold roughly 40% of the combined company.2 Bloomberg summed it up with a headline that captured the scale: Acuren was buying an engineering firm for $1.7 billion.3
To appreciate how bold that was, recall the timeline. Acuren had only begun trading in the United States three months earlier. It had closed its own leveraged acquisition less than a year earlier. And it was now proposing to buy a company with very different customers, different contracts and a different culture, and to hand almost two-fifths of itself to the target's shareholders. This was the largest strategic shift in the company's short public life, and it was made before public investors had seen a full year of Acuren results in the new structure.
The headline valuation was about 10.3 times NV5's 2025 consensus adjusted EBITDA, or about 9.2 times once Acuren's stated cost synergies were included.2 Is that cheap? An August 2026 survey of testing, inspection and certification valuations put the median for publicly traded TIC companies at about 14.0 times EBITDA.13 On its face, Acuren paid a lower multiple than the public market was putting on the sector.
But that comparison flatters the deal for three reasons. First, the peer set is not like for like. Many of the public TIC companies in such surveys are global certification giants with decades of contract history and stable cash flows; NV5 was an engineering and geospatial firm with more fixed-price project risk. Second, public trading multiples and private takeover multiples measure different things: a takeover price includes a control premium, and a public multiple reflects minority trading. Third, the 9.2 times figure only exists if the synergies arrive, and the 10.3 times figure rests on NV5's adjusted earnings, which already excluded items NV5 itself considered non-recurring. A deal multiple calculated on adjusted earnings plus promised savings is two steps removed from the cash the business actually produces. The fairer conclusion is that the price was not obviously excessive, not that it was a bargain.
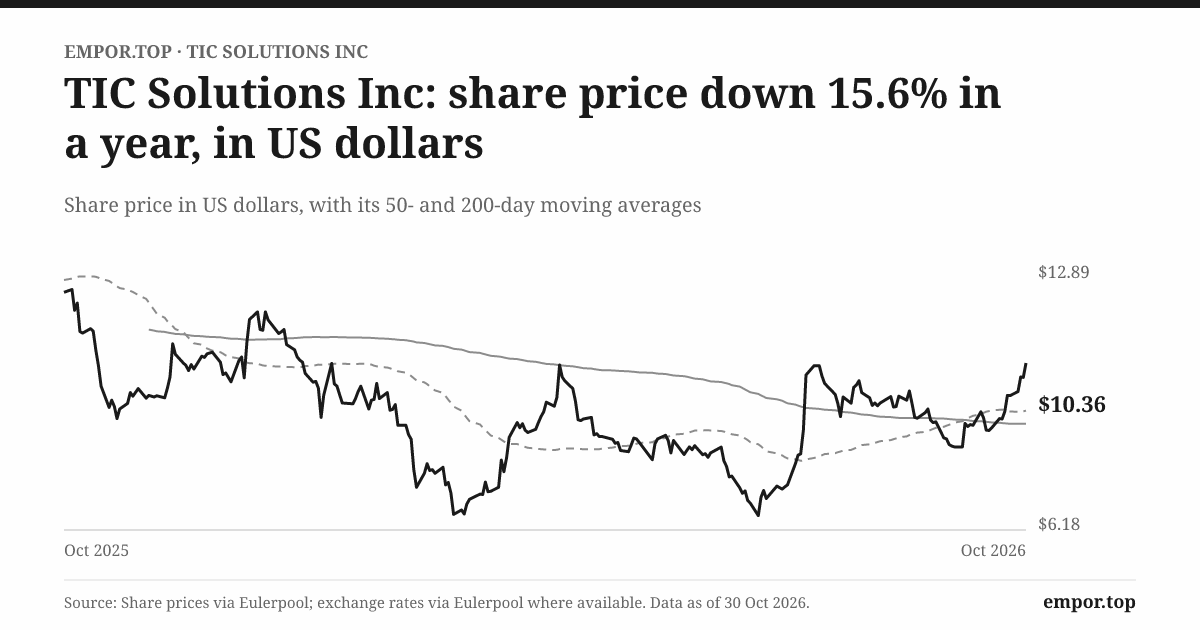
Set the NV5 price beside the Acuren price. Admiral had paid about 9.7 times estimated adjusted EBITDA for Acuren in 2024.7 NV5 cost a little more before synergies and a little less after them. That pattern is the classic roll-up arithmetic: if a company trades at a higher multiple than it pays for acquisitions, every deal appears to create value the moment it closes, because the acquired earnings get repriced at the acquirer's multiple. The arithmetic only holds if two things stay true. The acquirer's own multiple must stay high, and the acquired earnings must hold up. TIC's share price at the end of October 2026, about $10.36,14 was below the $12 price at which it sold shares in its private placement a year earlier.9 When the acquirer's own valuation falls, the roll-up arithmetic becomes less forgiving.
Financing told the second half of the story. The NV5 acquisition added $875 million of new term loans.4 Then, in October 2025, TIC raised about $250 million in a private placement of common shares and a pre-funded warrant at $12 a share.94 Total borrowings rose from about $813 million at the end of 2024 to about $1.7 billion at the end of 2025, while equity rose to about $2.2 billion.4 So the NV5 deal was paid for three ways: with new shares issued to NV5 holders, with new debt, and with fresh equity from investors. Existing Acuren shareholders absorbed dilution from both the merger shares and the placement.
Management likes to describe its capital allocation as disciplined. The observed record is more mixed than that word suggests. In the space of about two years, the company completed a large leveraged buyout, a nearly equally large merger, a $250 million equity raise, and then, in the first half of 2026, repurchased $15.7 million of its own stock.5 In August 2026, it closed three more acquisitions funded with cash on hand, which it said added about $90 million of annualized revenue.15 Buying back stock while also issuing it, borrowing heavily and continuing to acquire is not inherently wrong. But it is a sign of a management team that is comfortable using every capital-markets tool at once, and that comfort deserves scrutiny when cash generation in the first half of 2026 was close to zero.
The August tuck-ins are best understood as a continuation of the strategy rather than a new direction. TIC described them as expanding its technical capabilities and geographic reach.15 At roughly $90 million of annualized revenue, they add a little over 4% to a company guiding to more than $2 billion of revenue in 2026.151 The questions an investor should ask of any such deal are the same each time: what did it cost, how much of the acquired revenue is recurring rather than one-off projects, how much is cross-sellable into the existing customer base, and how quickly does it contribute cash after integration costs? The announcement emphasized capabilities and reach. The cash answers will show up only in later filings.
Then there is integration itself. At its May 2026 Investor Day, management described a structured approach, with 30-, 60- and 90-day milestones after each deal closes.11 By mid-2026, the company said it had actioned about $20 million of annualized savings from the NV5 integration, with a target of $25 million by year-end.12 Those are concrete, measurable claims, which is to management's credit. They are also modest relative to the combined company's cost base, and "actioned" savings are not the same as savings that appear in reported operating profit. Integration costs, retention payments and systems work can offset synergies for years.
The strongest form of the skeptic's challenge here would go something like this. TIC paid a fair-to-full price for NV5 and justified it with adjusted earnings and promised savings. It financed the purchase with debt and dilution. It then kept acquiring before demonstrating that the first large integration had produced organic growth or cash. If the stock trades below the placement price, the market is telling management that the platform is not yet worth what it cost to assemble.
The defense is equally clear. The NV5 purchase gave TIC higher-margin businesses with a growing backlog at a multiple below the sector median, during a period when Acuren's core was soft. The early synergy number is on track. Small tuck-ins are how fragmented services markets consolidate.
Between those positions, the evidence gives a verdict: the price was defensible, the financing was aggressive, and the value case now rests entirely on three outcomes. Organic growth, cash conversion and deleveraging. None of them is decided by the purchase price. All of them show up in the cash account, which is where the story goes next.
VI. The Growth Chart Meets the Cash Account
Here is a puzzle. In the first half of 2026, TIC Solutions booked more than a billion dollars of revenue.5 Its management talked up a record backlog and the promise of selling more services to existing customers.12 Its adjusted EBITDA guidance for the year stood at $330 million to $355 million.1 And over those six months, the business generated almost no cash from operations: about $0.2 million, compared with about $26.3 million in the first half of 2025.5
Where did the money go? It went into receivables and contract assets. Receivables, the bills TIC had sent but customers had not yet paid, absorbed about $36.7 million of cash during the half. Contract assets, work TIC had performed and recognized as revenue but had not yet billed or had only just billed, absorbed another $32.5 million.5 In plain terms, TIC did the work and recorded the sales, but the customers had not yet paid for a growing share of it.
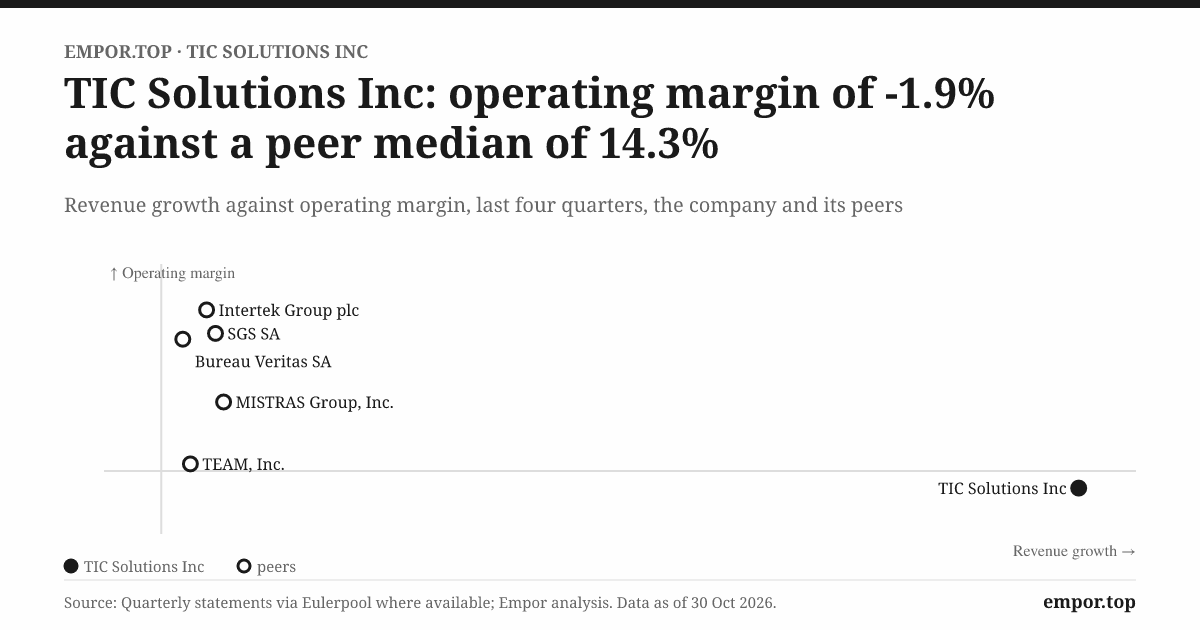
To understand why this matters, it helps to step back to the full-year picture. In 2025, TIC reported revenue of about $1.53 billion, an operating profit of only about $8.5 million, and a net loss of about $87 million.4 Operating profit of $8.5 million on $1.5 billion of revenue is a margin of about half a percent. For every $100 of work, the company kept about 55 cents before interest. That is the reported, GAAP number, the one an auditor signs off on, and it bears little resemblance to the adjusted EBITDA margin of around 15% that management emphasizes.
The gap between those two numbers is not fraud or sleight of hand. Most of it is amortization, the accounting expense created when TIC paid more for its acquisitions than the book value of their assets and assigned part of the premium to customer relationships and other intangibles. Depreciation and amortization totalled about $178 million in 2025.4 That is a real charge in the sense that it reflects money already spent on acquisitions, but it is not a current cash cost. Add interest expense of about $87.6 million, and a business with positive cash operating economics can still report a large accounting loss.4
Now the cash. In 2025, TIC generated about $95 million of cash from operations, more than its net loss would suggest.4 That sounds encouraging, and in part it is. But it was helped by favorable working-capital timing. Receivables fell by about $55.3 million and payables rose by about $12.7 million, partly offset by a $22.0 million fall in accrued liabilities and a $14.7 million increase in contract assets.4 Collecting old bills faster than you issue new ones produces cash once. It cannot be repeated forever. So the 2025 operating cash flow is better read as a mixture of underlying cash earnings and a one-time working-capital release, not as a clean measure of what the business normally produces.
Over the four years covered by the company's financial history since 2022, the cumulative picture is stark: net losses of about $194 million against about $126 million of cash from operations.4 The positive cash reflects the noncash nature of most acquisition charges. The losses reflect a business that, after interest and amortization, has not yet earned a profit for shareholders.
Then 2026 reversed the working-capital tailwind. The first half's near-zero operating cash flow arrived precisely because receivables and contract assets grew instead of shrinking. By June 30, 2026, receivables stood at about $382.8 million and contract assets at about $204.3 million, roughly $585 million combined, against an allowance for doubtful accounts of just $2.1 million.5 That allowance was down from $3.4 million at the end of 2025.4 Write-offs of bad debts were about $2.0 million in 2025, more than in prior years but still small.4 Management says historical bad-debt write-offs have not been significant.4 TIC does not disclose an aging schedule showing how long its receivables have been outstanding.5
A useful way to see the trend is debtor days, the number of days of revenue sitting in unpaid bills. On reported figures, debtor days rose from about 81 in 2023 to about 124 in 2025.4 Some of that increase is a statistical artifact: NV5's receivables appear on the year-end balance sheet in full, while NV5 contributed only five months of revenue to the year, which mechanically inflates the ratio. Engineering and public-sector clients also tend to pay more slowly than industrial maintenance clients. But the first half of 2026, a period with a full six months of the combined business, still showed receivables and contract assets growing faster than cash came in. The artifact explains part of the trend. It does not explain all of it.
Why does the composition matter? Contract assets in particular deserve attention because they represent revenue recognized before billing. On fixed-price engineering and geospatial projects, the company estimates how far along the project is and books revenue accordingly. If those estimates are right, the bills follow and the cash arrives. If a project runs late, a customer disputes a milestone or a scope gets reduced, contract assets can turn into write-downs. A growing contract-asset balance on a growing fixed-price book is normal. A growing contract-asset balance alongside flat cash flow is a yellow flag that needs to be resolved by collections.
Management's explanation for the near-term pressure focused on the operating side. In Inspection & Mitigation, lower outage and project activity reduced labor deployment efficiency, meaning technicians were less fully utilized; site losses and the timing of planned work also affected the segment.125 That explanation deserves its proper weight. Outage seasons do shift, and a services company whose workforce is partly fixed will see margins fall when volumes dip. The Q2 operating profit of about $10.8 million, down from about $18.4 million a year earlier on far more revenue, fits that story.1 But the explanation addresses margins, not collections. The rising receivables need their own answer.
So what does the evidence mean? Adjusted EBITDA is an operating earnings measure, but it is not cash from operations. The reported losses are real in the sense that TIC has paid heavily for acquisitions and owes interest on the debt it used. And the first half of 2026 shows that booked work and adjusted earnings have not yet demonstrated durable cash conversion. Backlog is a promise of future work; revenue is a recognition of work done; cash is the proof that a customer valued it.
The proof points to watch are concrete. Positive GAAP operating profit, not just positive adjusted EBITDA. Cash from operations after working-capital movements, especially in the seasonally stronger second half. Contract assets converting into billed receivables, and receivables converting into cash. And backlog in Consulting & Engineering and Geospatial turning into revenue at the margins management has promised. Which brings the story to the people making those promises, and to the specific targets they have chosen to be judged against.
VII. The 3 / 18 / 85 Promise
On May 19, 2026, TIC's leadership stood in front of investors for the company's first Investor Day under its new name and laid down three numbers.10 By 2029, they said, TIC would reach about $3 billion of revenue, an adjusted EBITDA margin of 18%, and free-cash-flow conversion of 85%, meaning that 85 cents of every dollar of adjusted EBITDA would turn into free cash.10 Three, eighteen, eighty-five. It was a tidy formula, easy to remember and easy to check. That last quality is its most valuable feature.
The man presenting the plan was new to the top job. Ben Heraud had led NV5 before the merger and came across with the deal; in March 2026, TIC announced that he would succeed Tal Pizzey as chief executive, with Pizzey retiring at the end of that month.16 Pizzey had led Acuren into public markets. Heraud's background was on the engineering and consulting side, the side TIC hopes will drive its margin expansion. Putting the NV5 leader in charge of the combined company was a statement of intent: the growth story would be told by the person who ran the higher-margin businesses, not the person who ran the larger one. Kristin Schultes remained chief financial officer, providing continuity on the finance side through the transition.6
Heraud's first two quarters as CEO were, in narrow terms, steady. Management reaffirmed 2026 guidance of $2.15 billion to $2.25 billion of revenue and $330 million to $355 million of adjusted EBITDA through the second quarter.1 It reported early synergy progress. And it showed up with a measurable long-term plan rather than vague aspirations. Those are the behaviors of a team that wants to be judged on delivery.
Now read the bridge critically. Management framed the 2029 revenue target as an 11% compound annual growth rate from its 2026 exit base.10 Compare that with organic growth of 2.5% in the most recent quarter.1 The gap between those two numbers, more than eight percentage points a year, has to come from somewhere. Some of it, management argues, will come from accelerating organic growth as cross-selling builds, the engineering and geospatial backlog converts, and Inspection & Mitigation laps its site losses. The rest will come from acquisitions. That is not a criticism in itself; for a roll-up, acquisitions are part of the plan. But it means the $3 billion target is substantially a capital-deployment target, and capital deployment requires capital, which brings the balance sheet and the share price back into the picture.
The margin target asks for about 320 basis points of adjusted EBITDA margin expansion, roughly three and a quarter percentage points.10 The mechanisms management has named are synergies, mix shift toward higher-margin segments, pricing, and better labor utilization. Each is plausible. Each is also the kind of improvement that services companies routinely promise and only sometimes deliver, because labor costs rise, competitors bid, and the savings from integration often get reinvested to win work.
The 85% free-cash-flow conversion target may be the hardest of the three relative to recent history. On a reported basis, 2025 cash from operations was about 57% of EBITDA, and the first half of 2026 was near zero.45 Reaching 85% would require both strong collections and modest capital spending. The capital spending part is credible: TIC is not capital-hungry, with cash purchases of property and equipment of about $33.8 million in 2025.4 The collections part is exactly what the first half of 2026 called into question.
The calls add texture. On the Q1 and Q2 calls, management emphasized the backlog, the synergies and improving commercial momentum in Inspection & Mitigation.1712 Analysts pressed on organic growth, the site losses, pricing, utilization and the acquisition pipeline.12 Management's answers on the site losses were consistent across the two calls: the losses were identified, they would be lapped from August, and the segment's underlying commercial indicators were improving.1712 Consistency is good. But "improving indicators" without numbers is the kind of language that should be tested against the segment's reported revenue in the second half. If Inspection & Mitigation is still shrinking after the comparison eases, the credibility of the broader plan will suffer.
Incentives matter for credibility too. In 2025, Pizzey received total reported compensation of about $2.74 million, Schultes about $2.39 million and Heraud about $0.99 million, the last for a partial year after he joined.6 Those are modest figures for a company of this size, and the proxy ties performance pay to measures the board selects.6 Ownership is concentrated among institutions rather than management. The largest disclosed holders in the 2026 proxy were Viking Global-managed entities at about 16.2%, Permian Investment Partners and Gates Capital at about 9.9% each, Alyeska at about 9.6% and P3-EQ at about 6.9%.6 Sir Martin Franklin held about 5.9%.6 That stake is meaningful alignment for the board's most influential figure, but it should not be confused with CEO ownership. The person running the integration day to day is not the person with the largest insider stake.
There is also a related-party arrangement worth noting. TIC paid Mariposa Capital, an affiliate of Franklin, about $2.0 million in advisory fees in 2025 for corporate development, M&A, investor relations and capital-allocation advice.4 The amount is tiny relative to revenue, about 0.13%. What is notable is the structure: an automatically renewing flat fee that TIC can end only with a majority board vote and six months' notice after the term ends.4 For a company whose strategy is acquisition-led, paying an affiliate of its co-chair to advise on acquisitions is the kind of arrangement that independent directors should monitor closely, even when the sums are small.
Governance has one more direct bearing on credibility, and it is the most important. TIC's auditor gave an unqualified opinion on the 2025 financial statements, meaning the numbers were fairly presented.4 But the same auditor gave an adverse opinion on internal control over financial reporting, citing material weaknesses in staffing and accounting expertise, period-end financial reporting controls, and IT general controls.4 The weaknesses touched accounts including revenue, receivables, expenses and interest.4 In ordinary language: the final numbers were right, but the process that produces them was not yet reliable enough to be trusted without extra checking. For a company asking investors to believe adjusted earnings, synergy counts and cash-conversion targets, the reliability of the reporting machinery is not a formality.
Shareholders mostly supported the board at the July 2026 annual meeting, but not uniformly. James Lillie, Franklin's long-time partner, drew the largest opposition of any director, about 14.5 million votes against versus about 126.4 million for.18 Seven of the eleven directors were classified as independent.6 That is a modest protest, not a revolt.
So how credible is the 3 / 18 / 85 plan? It is specific enough to measure, which is a real virtue. It is ambitious relative to current organic growth and weak reported profits. And it depends on behaviors that Heraud's team has had only a few quarters to demonstrate: honest explanations of misses, evidence that adjusted margins become reported earnings, and control remediation. The most immediate constraint on all of it is the same one that shaped every decision since 2024: the debt.
VIII. Debt Behind the Platform
At the end of June 2026, TIC carried about $1.61 billion of term debt.5 Against that, it had about $362 million of cash and an undrawn $125 million revolving credit facility, giving total liquidity of about $473.5 million.5 The company reported that it was in compliance with its loan covenants.5 On a snapshot, that looks comfortable. There is no near-term maturity: the term loans mature in July 2031.54 There is no revolver borrowing. There is plenty of cash.
The snapshot hides the more important feature, which is that the debt floats. TIC's term loans bear interest at SOFR, the benchmark short-term dollar rate, plus 2.75%, or at a base rate plus 1.75%.5 When rates rise, TIC's interest bill rises with them; when rates fall, it eases. Interest expense was about $87.6 million in 2025, and that was with the NV5 term loans in place for only five months.4 A full year of the larger debt load means a larger bill, all else equal. And the sensitivity is simple arithmetic: on about $1.6 billion of floating debt, every one-percentage-point move in rates is worth roughly $16 million a year in interest, before the effect of any hedges the company may hold. For a company that reported operating profit of $8.5 million for all of 2025, that is not a rounding error.4
The loans are secured, meaning lenders have claims on the company's assets, and they require quarterly principal installments, so some debt reduction happens automatically.4 Lease obligations add another layer, about $31.3 million current and $59.0 million non-current at June 30, 2026, which should be counted alongside borrowings when assessing total obligations.5 Net of cash, TIC's debt is roughly $1.25 billion, before leases.
How should an investor think about that burden? Two shortcuts are tempting and both mislead. The first is debt-to-equity, which was about 0.8 at the end of 2025.4 That looks moderate, but TIC's equity is dominated by goodwill and intangible assets created by its acquisitions. Equity built from purchase premiums does not repay loans. The second is enterprise value, which combines market capitalization and net debt: about $3.0 billion at the end of October 2026, of which the equity was worth about $1.6 billion.145 That tells you how much of the company's value is owed to lenders, nearly half of it, but not whether the business can service that debt.
The right test is net debt against cash EBITDA after integration costs. Management's preferred metric is net leverage on adjusted EBITDA. On guidance midpoint adjusted EBITDA of roughly $340 million, net debt of about $1.25 billion works out to well under four times, a level the leveraged-loan market considers normal for a sponsor-style services business. But that calculation uses adjusted earnings. If integration costs, restructuring and other excluded items are recurring cash outflows, the true cash leverage is higher. And the first half of 2026, with near-zero operating cash flow, shows how quickly the cash side can diverge from the adjusted side.
Management's deleveraging case rests on cash generation. As adjusted EBITDA grows and conversion improves toward the 85% target, free cash flow should pay down debt and lower interest costs. The record so far makes that case plausible but unproven. Debt has not fallen meaningfully since the NV5 closing; cash has been used for buybacks and, in August 2026, for three acquisitions. Using cash for acquisitions while promising to deleverage is not contradictory if the acquisitions earn more than the interest saved by repaying debt. But it means deleveraging depends on future cash, not current cash.
There is also a currency angle that rarely makes headlines. About 36% of TIC's revenue comes from outside the United States, mostly Canada, and the company does not hedge its foreign-currency exposure with forward contracts.4 Because Canadian revenue and costs are both in Canadian dollars, the operating impact is modest; management estimated that a 10% currency move would change 2025 operating income by about $2.8 million.4 But the translation effect on equity can be large: a $46.5 million gain in 2025, after losses in 2024.4 The dollar-denominated debt, meanwhile, does not move. Currency is a secondary risk here, not a primary one, but it adds noise to reported equity.
The verdict on the balance sheet is that TIC has room, but not slack. Liquidity is real; the maturity is distant; covenants are met. But floating rates, thin reported operating profit, near-zero first-half operating cash flow and continued acquisitions mean that the balance sheet will shape the next decisions. The measure to watch is straightforward: net debt divided by cash EBITDA after integration, alongside quarterly interest expense and actual debt reduction. If that ratio falls steadily through 2027, the platform has earned its leverage. If it stalls while acquisitions continue, the debt is setting the pace. Which leaves the question every investor ultimately has to answer: at today's price, what is the market betting on?
IX. Analysis & Bear vs. Bull Case
At the end of October 2026, TIC's shares traded at about $10.36, roughly 16% below their 52-week high of $12.28 and well above their low of $6.54.14 That range alone tells you the market has not made up its mind; one-year volatility was above 50%.14 At that price, the company carried an enterprise value of about 1.8 times sales and about 17.7 times trailing EBITDA.144 Against trailing operating profit, the multiple was an absurd-looking 348 times, a number that says less about valuation and more about how thin reported operating earnings are.4 And the equity traded at about 0.8 times book value.4
Those multiples point in different directions. A price below book value suggests skepticism about the acquisition premiums sitting on the balance sheet. A 17.7 times EBITDA multiple, by contrast, is above the 14.0 times median that the August 2026 sector survey found for public TIC companies.13 Against selected peers on nearby dates, TIC sat between Tetra Tech at about 14.3 times, Bowman Consulting at about 19.8 times and Montrose Environmental at about 9.5 times.192021 The differences reflect segment mix, growth, leverage and earnings quality. They also reflect a technical point: trailing EBITDA for TIC includes only part of NV5's contribution in the earlier quarters, which inflates the multiple. On forward adjusted EBITDA guidance, the multiple is lower. Valuation, in other words, cannot settle the argument. It depends on which earnings an investor believes.
So set out both cases plainly.
The bull case begins with demand. Inspection is required work. Aging refineries, pipelines, bridges and power plants need more inspection, not less, as they age. Infrastructure and utility spending supports the engineering and geospatial businesses, and the backlog in those segments grew 20% to a record $1.18 billion.1 The bull would argue that the combined company is better positioned than either predecessor: higher-margin engineering and geospatial work grows as a share of the mix, synergies arrive on schedule, Inspection & Mitigation recovers after lapping the site losses, and cross-selling begins to show. In that scenario, adjusted margins rise toward 18%, cash conversion improves, debt falls, and a company trading below book value turns out to have been cheap.
The bear case begins with the gap that opened this story. Organic growth was 2.5% in the most recent quarter.1 The site losses were real, and the company has not quantified them. Fixed-price work in the newer segments makes results lumpier. Receivables and contract assets are rising faster than cash. Reported operating profit is close to zero. Debt is over $1.6 billion and floats. The auditor found material weaknesses in internal controls. And management continues to acquire before proving that the last big deal works. In that scenario, synergies get absorbed by labor cost inflation and competitive bidding, cash conversion stays weak, and the company has to choose between deleveraging and the acquisitions its growth plan requires.
Michael Porter's five forces, applied to the evidence, favor the bear more than the bull, but not overwhelmingly. Buyer power is moderate to high at the site level, as the site losses show, and limited at the single-customer level, since no customer exceeds 10% of sales. Supplier power, which here means skilled labor, is meaningful during peak seasons. Rivalry is intense in fragmented local markets and lower for large multi-site programs. Substitution from drones, sensors and analytics is a slow-moving threat to labor-billed inspection and an opportunity for data businesses. Entry barriers are low at the small end and rise with scale, safety records and certifications.
Hamilton Helmer's seven powers framework asks a sharper question: what durable advantage lets a company earn returns above its cost of capital? Scale economies are the most plausible candidate. A national inspection and engineering network can serve multi-site customers that smaller rivals cannot, and spread overhead across more revenue. But scale economies in labor-intensive services are weaker than in software or manufacturing, because most costs scale with headcount. Switching costs exist through safety qualifications and site knowledge, but the site losses show their limits, and no retention data confirms them. Network effects, counter-positioning, cornered resources and branding are hard to find in the record; TIC's brand is new, and its technicians are not cornered resources. Process power, the hard-to-copy organizational capability that lets a company do something better over time, is the claim implicit in the "repeatable M&A playbook." It is the power TIC most needs to prove and has had the least time to demonstrate.
The moat conclusion, then, is that TIC has durable demand and the beginnings of scale, but no demonstrated power that guarantees returns above its cost of capital. That is not unusual for a young roll-up. It does mean the investment case depends on execution rather than structure.
Three KPIs matter most for tracking whether execution is working. The first is organic revenue growth by segment, latest reading 2.5% for the company with Inspection & Mitigation shrinking 5.5% and Geospatial growing 7.9%.1 Direction: positive overall, with the core segment needing to turn. The second is cash conversion including receivables and contract assets, latest reading near-zero operating cash flow in the first half of 2026, with receivables and contract assets reaching about $585 million.5 Direction: deteriorating from 2025. The third is adjusted EBITDA margin reconciled to GAAP operating profit, alongside debt reduction. The latest reading shows Q2 operating profit of $10.8 million, while adjusted EBITDA guidance for the full year is in the hundreds of millions; term debt remains over $1.6 billion.15 Direction: not yet improving.
A skeptical activist looking at TIC would probably focus on four things. The pace of acquisitions relative to demonstrated integration. The gap between adjusted and reported earnings. The related-party advisory arrangement with Mariposa. And the material weaknesses. Each is addressable. None has yet been addressed in a way that closes the question. The lessons of TIC's path so far are less about whether the bulls or bears are right than about what a roll-up has to do to become a company.
X. Business & Investing Lessons
There is a particular kind of chart that investors in roll-ups learn to distrust. It shows revenue stepping up like a staircase, each step a closed deal, each step taller than the last. TIC's chart has one of those steps, the August 2025 NV5 closing, and it is a big one. The lessons of this story come from what that chart cannot show.
The first lesson is that a deal can change the company before it changes the economics. The NV5 merger made TIC larger and broader. Reported revenue grew 86% in the second quarter of 2026, while organic growth was 2.5%.1 The first reflects dealmaking; the second, operations. Founders and boards building through acquisition should measure themselves by the second, and investors should insist on seeing it, because the first can be bought and the second can only be earned.
The second lesson is that backlog is a promise to do work, not proof the work will pay. TIC's engineering and geospatial backlog reached a record, up 20%, while the company generated almost no operating cash in the first half.15 That gap between booked work and collected cash is where margins and credibility are tested.
The third lesson is that the balance sheet is part of the integration plan. TIC took on over $1.6 billion of floating-rate debt to build its platform, paid about $87.6 million in interest in 2025, and kept buying companies with cash.4515 Leverage shortens the time available to align systems, retain people, cross-sell and capture savings, because interest is due whether or not the synergies have arrived. Acquisitive companies that treat debt as a financing detail rather than an operating constraint tend to discover, usually in a downturn, that the lender was setting the integration timetable all along.
The fourth lesson is that a moat needs customer evidence. TIC's customers are spread widely enough that none controls more than a tenth of sales.4 Yet customer sites left in 2025. Retention rates, price realization and multi-service relationships would show whether customers would rather stay than rebid. Until a company can show those numbers, the most honest description of its advantage is "probable, not proven."
Put those four together and the wider lesson for anyone watching roll-ups becomes clear. Acquisition scale buys options. It buys the option to cross-sell, to improve margins through mix, to spread overhead, to win larger contracts. Options, though, are not value. Integration, customer retention and cash collection are what turn options into value, and they are the parts no deal announcement can promise into existence. That makes the next set of quarters, and the documents that report them, the real story.
XI. Epilogue
Tonight, at the end of October 2026, TIC Solutions stands at the beginning of the first period in which it can be judged on fully comparable results. The NV5 merger passed its first anniversary. Three more acquisitions were folded in. Management reaffirmed its 2026 guidance of $2.15 billion to $2.25 billion of revenue and $330 million to $355 million of adjusted EBITDA.1 And the 3 / 18 / 85 targets hang over everything: $3 billion of revenue, an 18% adjusted EBITDA margin and 85% free-cash-flow conversion by 2029.10
The first moment that will decide the story is the third-quarter report. That is the first quarter in which Inspection & Mitigation will lap the 2025 site losses, as management promised on the August call.12 If segment revenue returns to growth, the explanation management offered, that the losses were a one-time event and commercial indicators were improving, will look credible. If it keeps shrinking, investors will reasonably conclude that the site losses were part of a broader competitive problem, and that utilization, pricing and outage work are weaker than management has suggested. Either outcome will reset expectations for the 2029 plan, because the core segment still produces most of the revenue.
The second moment is cash. TIC needs the second half to be stronger, because the first-half pace of collections offers little support for its 85% cash-conversion target. If operating cash flow for 2026 recovers to something consistent with its adjusted EBITDA, and receivables and contract assets stop growing faster than revenue, the first-half weakness will look like timing. If it does not, the 85% conversion target will look aspirational, and the gap between adjusted and reported earnings will become the defining question about the company.
The third moment is the auditor. TIC's 2026 annual report, due in early 2027, will say whether the material weaknesses have been remediated. A clean internal-control opinion would remove one of the most legitimate reasons for skepticism. Another adverse opinion would be a sign that the reporting machinery has not kept pace with the acquisitions feeding into it. This is not a formality; for a company whose story depends on adjusted numbers and synergy tracking, it is a milestone.
The fourth moment is debt. Over the coming quarters, investors will see whether net debt falls, whether interest expense declines, and whether the company chooses deleveraging over additional acquisitions when the two compete for cash. Sustained reduction in net debt and interest burden, not just additional acquisition scale, is what would show that the platform can support itself.
Behind all four sits the question this story opened with. Can a company built by buying businesses grow, earn and collect cash as one business? The tests are now scheduled. The answers will arrive in public, quarter by quarter, in numbers that will be harder to adjust.
XII. Outro
Go back to that second-quarter report one more time: 86% reported revenue growth, 2.5% organic growth.1 Most companies would be happy to have either number. TIC has both, and the distance between them is a measure of how much of its future it has already bought and how much it still has to earn.
Now picture a field crew at dawn on an aging refinery, harnessed up and ready to drop over the side of a tower with ultrasonic equipment. The work they are about to do is not going away; codes, insurers and simple physics will require it for as long as the plant runs. That is the comforting part of TIC's story. The uncomfortable part is everything that happens around the crew: TIC still has to win that contract against a dozen rivals, staff it with people it can keep busy, price it to earn a margin, and collect the bill. The roll-up is built. Now it has to become a company.
References
-
Q2 2026 Earnings Release — TIC Solutions, Inc. (SEC), 2026-08-06 ↩↩↩↩↩↩↩↩↩↩↩↩↩↩↩↩↩↩↩
-
NV5 Merger Transaction Presentation — Acuren Corporation (SEC), 2025-05-15 ↩↩↩↩↩
-
Acuren Agrees to Buy Engineering Firm NV5 for $1.7 Billion — Bloomberg, 2025-05-15 ↩↩
-
2025 Form 10-K — TIC Solutions, Inc. (SEC), 2026-03-12 ↩↩↩↩↩↩↩↩↩↩↩↩↩↩↩↩↩↩↩↩↩↩↩↩↩↩↩↩↩↩↩↩↩↩↩↩↩↩↩↩↩↩↩↩↩↩↩↩↩↩↩↩↩↩↩↩↩↩↩↩↩
-
Form 10-Q for the quarter ended June 30, 2026 — TIC Solutions, Inc. (SEC), 2026-08-06 ↩↩↩↩↩↩↩↩↩↩↩↩↩↩↩↩↩↩↩↩↩
-
2026 Definitive Proxy Statement — TIC Solutions, Inc. (SEC), 2026-05-21 ↩↩↩↩↩↩↩
-
Admiral Acquisition Limited: Acquisition of Acuren — Admiral Acquisition Limited, 2024-05-22 ↩↩↩
-
Form S-1 Registration Statement — TIC Solutions, Inc. (SEC), 2025-10-10 ↩↩↩↩
-
2026 Investor Day Presentation — TIC Solutions, Inc., 2026-05-19 ↩↩↩↩↩↩
-
2026 Investor Day Transcript — Stock Analysis, 2026-05-19 ↩↩
-
Q2 2026 Earnings Call Transcript — Stock Analysis, 2026-08-06 ↩↩↩↩↩↩↩↩↩↩↩
-
Investor Relations Overview and Stock Information — TIC Solutions, Inc., 2026-10-30 ↩↩↩↩↩
-
TIC Solutions Completes Three Strategic Acquisitions Expanding Its Technical Capabilities and Geographic Reach — TIC Solutions, Inc., 2026-08-18 ↩↩↩↩
-
TIC Solutions Reports Results for the Fourth Quarter and Full-Year 2025 and Announces CEO Succession — TIC Solutions, Inc., 2026-03-12 ↩
-
2026 Annual Meeting Results (Form 8-K) — TIC Solutions, Inc. (SEC), 2026-07-01 ↩
-
Montrose Environmental EV/EBITDA — ValueInvesting.io, 2026-09-25 ↩
 LinkedIn
 WhatsApp
 Reddit
 Hacker News
 Email
 Kindle
 RSS Feed
 Spotify
 Apple Podcasts
 Amazon Music
 Audible
 YouTube