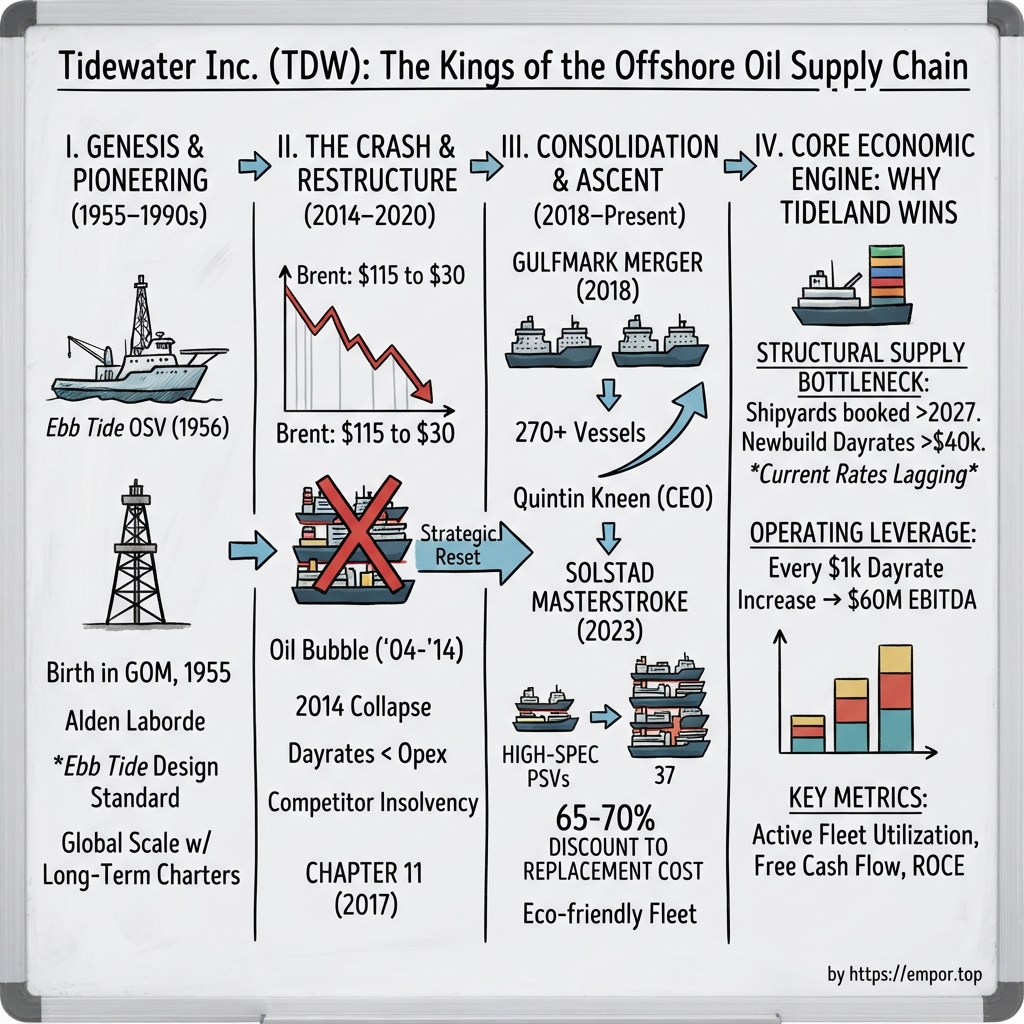
Tidewater Inc. (NYSE: TDW): The Kings of the Offshore Oil Supply Chain
I. Introduction & Episode Roadmap
On the morning of August 3, 2026, an executive conference call opened from New Orleans centered on offshore support vessels. Unlike drillships or floating production storage and offloading units (FPSOs)—the multibillion-dollar deepwater assets that typically dominate industry headlines—these steel workhorses feature forward-positioned bridges and expansive, flat aft decks. They haul drill pipe, cement, diesel, fresh water, and drilling mud to offshore rigs operating in depths exceeding 1,000 meters off Angola, Norway, Brazil, and Saudi Arabia.
The financial results reported on that call reflected a sharp cyclical recovery. Quarterly revenue reached $342.3 million. Across its active fleet, Tidewater collected an average day rate of $22,938 per vessel, up nearly 3% from the prior quarter—the largest sequential increase since 2024. Management emphasized the leading-edge day rate, which reflects pricing on newly signed contracts. That figure rose to $24,341 per day, representing a 7.5% jump over three months.1
Tidewater is the world's largest owner and operator of offshore support vessels (OSVs). The company ended 2025 with 208 vessels—comprising 139 platform supply vessels, 52 anchor handling tug supply vessels, and 17 other craft—operating across more than 30 countries through five regional segments.2 Functioning as a primary logistical link for offshore exploration and production, these vessels transport essential equipment and materials to platform sites.
The core financial story centers on the company's capital allocation trajectory and corporate restructuring. Founded in 1955 by a Louisiana engineer who designed an early specialized workboat, Tidewater established the OSV sector and operated for four decades as an industry standard-bearer. However, a severe industry downturn forced the company into Chapter 11 bankruptcy in May 2017, wiping out equity holders and transferring ownership to creditors.3 By August 2026, nine years later, shares traded near $94—close to their 52-week high of $95.32 and double their 52-week low of $46.65—bringing Tidewater's market capitalization to approximately $4.7 billion.4
This turn of events was driven largely by post-restructuring asset acquisition under Chief Executive Officer Quintin Kneen. Kneen, a certified public accountant and chartered financial analyst who joined Tidewater following the absorption of a competitor, pursued a strategy of acquiring distressed fleets rather than commissioning expensive new builds. Post-bankruptcy expansion included buying GulfMark in 2018, Swire Pacific Offshore in 2022, and 37 high-specification platform supply vessels from Solstad Offshore in 2023, along with a pending acquisition of Brazil's Wilson Sons Ultratug Offshore.
Four primary themes frame this operational and financial evolution.
First, operating leverage creates significant earnings variability in both directions. Fixed vessel operating costs—including crewing, insurance, and routine maintenance—remain largely constant whether a vessel earns $8,000 or $28,000 per day, allowing incremental revenue to flow directly to operating margin. This cost structure amplified sector losses between 2015 and 2020 and has accelerated the subsequent cash flow recovery.
Second, supply-side inelasticity has limited new fleet construction despite rising charter rates, representing a critical structural driver of contemporary market conditions.
Third, counter-cyclical consolidation allowed Tidewater to purchase existing steel from distressed sellers instead of ordering new builds from shipyards. The extent to which these four transactions generated long-term economic value remains a central strategic question.
Fourth, management's commitment to capital allocation discipline warrants scrutiny. Tidewater's board authorized a $500 million share repurchase program on August 1, 2025. However, through the second quarter of 2026, the company had not repurchased any shares under the authorization.12 The gap between share buyback authorization and active execution highlights the ongoing evaluation of capital returns versus balance sheet deployment.
This overview tracks Tidewater's progression from a Louisiana shipyard in 1955 to market forecasts extending through 2028. Key areas of examination include the industry-wide downturn, a restructuring that reshaped the company's capital structure, and an evaluation of whether the largest operator in a fragmented, capital-intensive sector maintains a durable competitive advantage.
 Subscribe on LinkedIn
II. Genesis & Pioneering the OSV: The Laborde Era (1955–1990s)
In the early 1950s, supplying an offshore drilling platform in the Gulf of Mexico typically required converting a surplus World War II landing craft—a flat-bottomed amphibious assault barge designed to disgorge troops onto beaches—and loading it with drill pipe. While functional, the vessels rolled heavily in rough seas, offered awkward cargo capacity, and were fundamentally built for combat rather than offshore logistics.
Engineers like Alden J. "Doc" Laborde recognized that adapting war surplus was the wrong solution. Instead of modifying a military craft, Laborde designed a purpose-built vessel: twin engines for propulsion, a wheelhouse positioned far forward at the bow, and a long, unobstructed aft deck. The resulting 119-foot vessel featured roughly 90 feet of open deck space, allowing drill pipe, mud, cement, and heavy machinery to be loaded and unloaded via crane without structural interference.5
To bring the concept to market, ten investors incorporated the company in Louisiana on July 8, 1954, contributing $10,000 each to generate $100,000 in seed capital for what became Tidewater Marine Service Corporation.5 Led by the Laborde family of New Orleans, John P. Laborde assumed operational leadership, and the firm commenced formal operations in 1956.6
The flagship vessel, the Ebb Tide, was launched in 1955 and entered active service in 1956 as the world's first purpose-built offshore support vessel. Its architecture—a forward wheelhouse paired with an expansive rear deck—became and remains the global design standard.5 Decades later, a modern $60 million battery-hybrid platform supply vessel operating on the Norwegian Continental Shelf relies on the exact same layout, scaled up for modern deepwater demands.
Defining the physical architecture of an entire sector conferred a distinct first-mover advantage, though one devoid of patent protection. Because the deck layout could be easily replicated, competitors quickly adopted the design. Tidewater's true competitive moat came not from intellectual property, but from early scale, established safety records, and entrenched commercial relationships with major energy producers who relied on the firm before alternative operators existed.
International expansion followed global offshore exploration. Tidewater entered Venezuela in 1958, establishing an operating presence that spanned more than five decades, and expanded across Central America, West Africa, and Australia during the 1960s.6 By the 1970s, buoyed by oil boom cash flows, the company diversified into oil and gas production, real estate, and natural gas compression—a strategic departure that foreshadowed a long-standing industry pattern of reinvesting cyclical marine cash flows into non-core assets.6
When global oil prices collapsed in the mid-1980s, severely depressing offshore drilling activity, many regional vessel operators failed. Tidewater survived the prolonged downturn due to its international scale, diversified customer base, and conservative balance sheet. The experience reinforced a core operational philosophy for the firm: preserving liquidity to endure market troughs takes precedence over maximizing leverage at cyclical peaks.
A period of rapid industry consolidation followed. Tidewater merged with Zapata Gulf Marine in 1992, roughly doubling its active fleet, before acquiring Hornbeck Offshore Services in 1996 to add approximately 90 vessels. The purchase of O.I.L. Ltd. in 1997 further expanded its international footprint. By 2000, the company initiated an aggressive fleet modernization and newbuild construction program focused on high-specification, deepwater-capable tonnage.6
While the 2000 fleet expansion responded logically to deepwater exploration trends requiring larger, higher-capacity support craft, it also entrenched a capital-intensive pattern of ordering new vessels during industry upcycles. The Laborde era established Tidewater's global scale and strong reputation among integrated energy companies, but it also left an operating footprint and cost structure premised on continuous growth in offshore capital expenditures.
For the next fourteen years, market expansion obscured the risks of that cost structure.
Crucially, the legacy of the Laborde era highlighted a key structural limitation in vessel operating economics. Tidewater built its market position on operational reliability, standardized international safety protocols, and extensive shore-base logistics. While these operational capabilities qualified the company to bid on demanding contracts with major oil producers, they did not grant pricing power during market downturns. Operational reputation ensured invitation to tender; total vessel supply ultimately dictated day rates.
III. The Great Offshore Bubble & The 2014–2020 Crash
The collapse of the offshore support vessel market began with a sharp drop in crude prices. In June 2014, Brent crude traded between roughly $108 and $115 per barrel, but by late January 2016, it had fallen to approximately $28.7 That price collapse triggered a structural crisis across the offshore maritime sector.
The decade preceding the crash was among the most expansive in offshore energy history. Sustained triple-digit crude prices made deepwater exploration economically viable in regions such as Brazil's pre-salt basins, the deepwater margins of West Africa, and the ultra-deepwater Gulf of Mexico. Each floating offshore rig required a dedicated fleet of support craft—typically two or three platform supply vessels running continuous supply service, alongside anchor handling tug supply vessels to position and moor the rigs.
Vessel operators responded to this demand surge by ordering new tonnage, despite a three-year construction lag. Supported by abundant, low-cost debt, shipyards across China, Southeast Asia, and Europe built vessels, often speculatively without charter contracts attached. Norwegian owners issued high-yield bonds, while French, Singaporean, and American operators added substantial balance sheet leverage. By 2014, the global offshore support vessel orderbook reached unprecedented levels: combined platform supply vessel and anchor handling tug supply vessel orderbooks expanded to 34% and 15% of the active fleet, respectively—compared to roughly 4% by 2026.8
When oil prices dropped, offshore exploration spending contracted sharply, yet newly built vessels continued entering the market from shipyards. The mechanics of the resulting downturn illustrate why the depression was severe and prolonged. An offshore support vessel carries high fixed operating expenses—including crew wages, insurance, class certification, routine maintenance, and port fees—that persist whether the vessel is chartered or idle. As fleet utilization collapsed and competing operators bid aggressively for scarce tenders, day rates fell below cash breakeven levels, forcing vessels to operate at rates that failed to cover basic operating costs. Owners were forced to choose between absorbing active operating losses or incurring holding costs for idle ships.
Most operators chose to idle their fleets, making "cold stacking" the defining operational response of the era. A cold-stacked vessel is taken out of service, de-crewed, and moored to minimize ongoing cash burn. Harbors from Louisiana to Aberdeen to Batam filled with idle vessels. As asset values plummeted, the underlying collateral supporting debt-financed fleets collapsed.
Financial distress spread throughout the sector. Bourbon Offshore—briefly the world's largest offshore services provider by fleet count—began deferring debt repayments in mid-2018, filed for reorganization, and in January 2020 had its assets transferred by a French commercial court to a vehicle owned by seven creditor banks, including BNP Paribas, Crédit Lyonnais, Natixis, and Société Générale. That restructuring plan reduced Bourbon's fleet from nearly 460 vessels to roughly 350.9 Norwegian operator Solstad Offshore, carrying approximately $3.5 billion in debt against roughly 140 ships, completed a fully financed debt-and-equity restructuring approved by shareholders on October 20, 2020.10 Hornbeck Offshore similarly reorganized under bankruptcy protection, while SEACOR Marine underwent prolonged retrenchment. Between 2015 and 2021, most major vessel owners completed debt restructurings that wiped out equity holders, transferred control to creditors, and left surviving companies with smaller fleets and reduced leverage.10
Two structural implications emerged from this downturn that shape market conditions in 2026.
First, corporate balance sheets across the sector were reset almost simultaneously. The competitive landscape in 2026 consists primarily of restructured, creditor-backed operators that have maintained capital discipline and avoided speculative orderings.
Second, debt restructurings eliminated financial leverage rather than physical vessel supply. Because ships do not vanish during bankruptcy, ownership transferred to creditors at a lower cost basis. The supply overhang that depressed charter rates for six years was resolved not by courtroom reorganizations, but by physical aging, long-term idling, and the gradual scrapping of older hulls that were no longer economically viable to reactivate.
Because Tidewater completed its reorganization earlier than most peers, it emerged with a cleaned balance sheet ahead of the broader market, positioning the company to acquire distressed competitor fleets while rival operators remained entangled in restructuring proceedings.
IV. Inflection Point 1: Chapter 11 Bankruptcy & Strategic Reset (2017)
Despite surviving the 1980s industry downturn, the 1998 oil price collapse, and the 2008 financial crisis, Tidewater succumbed to the debt accumulated during the pre-2014 offshore expansion boom. As oil prices collapsed, revenue plummeted while vessel operating costs remained largely fixed, rendering the company unable to service approximately $1.6 billion in principal debt.
In May 2017, Tidewater filed a prepackaged Chapter 11 bankruptcy petition in the United States Bankruptcy Court for the District of Delaware. Because terms had been negotiated with creditors prior to filing, the court confirmed the Second Amended Joint Prepackaged Plan of Reorganization on July 17, 2017, and Tidewater emerged from bankruptcy on July 31, 2017.3
The plan eliminated approximately $1.6 billion of outstanding principal debt. Combined with the rejection of certain sale-leaseback agreements, the company estimated the restructuring would reduce annual interest and operating lease expenses by roughly $73 million.3 Existing common equity holders were wiped out, transferring ownership of the company to its creditors.
The financial collapse illustrated a key principle of cyclical, capital-intensive industries: operational scale, safety records, and longstanding customer relationships cannot offset an overleveraged balance sheet when market demand contracts. However, emerging from bankruptcy in mid-2017 gave Tidewater a strategic timing advantage. While primary competitors remained bogged down in prolonged restructurings—Bourbon's court-supervised asset transfer did not complete until January 2020 and Solstad's reorganization plan was not approved until October 2020—Tidewater possessed a deleveraged balance sheet nearly three years ahead of its peers.
This position enabled management to redirect capital away from expensive new vessel construction toward acquiring existing fleets from distressed sellers. Purchasing secondhand tonnage offered clear strategic benefits: existing vessels cost a fraction of newbuild shipyard rates, entered service immediately without multi-year construction lags, frequently came with active charter contracts, and added no net capacity to an oversupplied global market. Rather than expanding fleet supply during a downturn, this strategy consolidated existing tonnage and supported supply discipline across the sector.
The 2017 reorganization also established fresh-start accounting baseline metrics that continue to shape Tidewater's reported financial results. Retained earnings remained in deficit at $277.4 million as of June 30, 2026, against $1.66 billion of additional paid-in capital, and the company carried $182.5 million of tax assets.26 Because asset carrying values, equity accounts, and tax structures were reset during Chapter 11, traditional book-value return metrics and reported effective tax rates are not directly comparable to peers that did not undergo bankruptcy. Consequently, cash flow generation and vessel-level operating margins provide the most accurate measures of underlying performance.
Tidewater's post-restructuring acquisition strategy faced its first operational test the following year.
V. Inflection Point 2: The GulfMark Merger & The Rise of Quintin Kneen
Combining two freshly restructured operators with minimal debt, overlapping customer lists, and duplicated corporate functions represented one of the most straightforward consolidation theses in corporate finance.
Tidewater completed its business combination with GulfMark Offshore on November 15, 2018. Under the terms of the transaction, GulfMark stockholders received 1.1 Tidewater shares for each share of GulfMark, leaving legacy Tidewater shareholders with approximately 74% of the combined entity and GulfMark holders with 26%.11 According to merger filings with the U.S. Securities and Exchange Commission, the primary objective was to integrate the two fleets and shore-based organizations to capture operational cost efficiencies.12 While market reports outlined potential annual synergies exceeding $45 million, official primary merger disclosures did not report a confirmed realized figure.
The transaction's most lasting impact proved to be executive leadership rather than physical vessel assets.
Quintin V. Kneen was not a traditional mariner. Holding a Bachelor of Business Administration in accounting from Texas A&M University and an MBA from Rice University, Kneen is both a certified public accountant and a chartered financial analyst—a credential combination that set him apart in an industry historically led by maritime operators. He began his career as an audit manager at Price Waterhouse in Houston, held senior finance positions at Azurix Corp., and joined Grant Prideco in 2003 as Vice President of Finance and Investor Relations. Kneen moved to GulfMark Offshore in June 2008 as Vice President of Finance, became Chief Financial Officer in June 2009, and was named President and Chief Executive Officer in June 2013, guiding GulfMark through the market crash and its subsequent restructuring.13
Following the merger, Kneen joined Tidewater as Executive Vice President and Chief Financial Officer before succeeding John T. Rynd as President and Chief Executive Officer in September 2019.14
Kneen's background as a financial executive who guided a shipping company through bankruptcy shaped Tidewater's post-restructuring operating philosophy. Rather than prioritizing fleet expansion, management established an operating strategy focused on strict capital discipline:
Free cash flow over fleet count. Management repeatedly framed the core objective as cash generation per share rather than total vessels owned. In practice, this strategy required rationalizing the fleet by selling or scrapping older, lower-specification vessels that diluted overall returns, even when those assets occasionally covered direct cash operating costs. In the second quarter of 2026, Tidewater sold two vessels, following two vessel sales in the preceding quarter.1
Disciplined reactivation terms. A central pillar of Tidewater's strategy was a refusal to reactivate cold-stacked vessels without contract terms sufficient to cover the full cost of reactivation. Controlling vessel reactivations is critical to preventing excess supply from eroding market day rates. While Tidewater maintained this discipline by avoiding speculative reactivations, Kneen noted in August 2026 that much of the idle global fleet was "effectively scrapped in place" due to age and technical specifications, meaning market discipline was further reinforced by physical asset degradation.1
Strategic consolidation over new construction. By the first quarter of 2026, Kneen highlighted that the cumulative additions of GulfMark, Swire Pacific Offshore, Solstad Offshore assets, and Wilson Sons Ultratug Offshore had established a major operational presence across every primary offshore basin, driven primarily by modern, high-specification vessels.15
At the time of the GulfMark transaction, several of those major fleet additions remained ahead. The acquisition that fundamentally reshaped the company's asset quality occurred in 2023.
VI. Inflection Point 3: The Solstad Offshore Masterstroke (2023)
Prior to the Solstad transaction, an earlier fleet purchase established the structural template for Tidewater's post-restructuring growth. On April 22, 2022, Tidewater closed the acquisition of Swire Pacific Offshore Holdings, adding 50 offshore support vessels operating primarily across West Africa, Southeast Asia, and the Middle East. Total consideration reached $215.5 million, though cash at closing was limited to $61.6 million—subsequently reduced by an $8.8 million post-closing working capital refund—with the remainder funded via 8.1 million warrants exercisable at $0.001 per share.16 The deal structure allowed Tidewater to acquire 50 active vessels for roughly $52.8 million in net cash alongside equity warrants, reflecting a parent conglomerate seeking a complete exit from offshore logistics rather than an operator seeking full asset value.
The Solstad Offshore acquisition represented a shift in scope and asset quality. Rather than acquiring a distressed fleet, Tidewater purchased high-specification vessels from a restructured competitor reorienting its portfolio toward subsea operations and offshore construction.
Tidewater announced the deal in March 2023 and completed the acquisition on July 5, 2023, paying approximately $580 million—comprising a $577 million base price plus a $3 million adjustment for fuel bunkers and consumables—for 37 platform supply vessels.17 The acquired fleet operated across the North Sea, Brazil, Australia, and West Africa, backed by approximately $620 million in contracted backlog, including option periods.18 Fourteen of the vessels were battery-electric hybrids and two were capable of running on liquefied natural gas (LNG), giving Tidewater what management described as the world's largest fleet of hybrid offshore support vessels.17
At an average purchase price of roughly $15.6 million per vessel, industry observers underscored the disparity between the acquisition cost and shipyard prices for new builds, which typically range from $45 million to $55 million for high-specification platform supply vessels—implying a 65% to 70% discount to replacement cost.
However, replacement-cost metrics require context. Shipyard construction costs vary widely by region, technical specification, currency, and timing, and Tidewater's SEC filings contain no independent, contemporaneous quotes for new construction. Nevertheless, two disclosed metrics validate the commercial logic of the purchase. First, the acquired vessels brought $620 million in contracted and optioned backlog against a $580 million purchase price, meaning full execution of the existing contracts would cover the acquisition cost. Second, in August 2026, Kneen noted that under current cost conditions, vessel day rates would need to reach the "low $30s" thousands to justify ordering a new build, a threshold he suggested might not be reached until around 2029.1 With leading-edge day rates reaching $24,341 in mid-2026, acquiring operational tonnage remained far more economical than commissioning new construction.
The transaction's capital structure also signaled a shift in financial posture. Tidewater financed the purchase using a $250 million Nordic bond issued on July 3, 2023, a $325 million senior secured term loan arranged by DNB Bank ASA, and available cash balance.17 Relying almost entirely on debt to fund a major asset purchase represented a notable risk for a company six years removed from Chapter 11.
Subsequent financial performance validated the acquisition. Annual revenue grew from $647.7 million in 2022 to $1.01 billion in 2023 and $1.35 billion in 2024, while net performance turned from a $21.7 million loss in 2022 to net income of $97.2 million in 2023 and $180.7 million in 2024.19 This cash flow expansion enabled the company to overhaul its capital structure. On July 7, 2025, Tidewater refinanced the secured term loan, its 10.375% notes due 2028, and its 8.50% notes due 2026 by issuing $650 million of 9.125% senior unsecured notes due 2030, recording a $27.1 million loss on debt extinguishment in the process.2
This refinancing replaced asset-backed secured loans and near-term maturities with a single unsecured debt obligation maturing in 2030. The transaction reflected credit markets' willingness to underwrite Tidewater's operational cash flows rather than requiring vessel collateral—raising the strategic question of whether this balance sheet strength stems from structural competitive advantages or favorable cyclical conditions.
VII. Core Business Anatomy, Segment Breakdown & Industry Structure
Strip away the financial engineering and Tidewater is a fleet, a crew roster, and a scheduling problem.
What the boats actually do. A platform supply vessel is the industry's articulated lorry. Its job is to carry consumables out to a rig or a floating production unit and bring waste and equipment back: drill pipe and casing on the open deck; liquid drilling mud, brine, fuel, potable water and dry bulk cement in tanks below. The economics favour size, because deck area and tank capacity determine how much a single voyage moves, and because larger vessels can work in harsher weather. High-specification PSVs also carry dynamic positioning systems — computer-controlled thrusters that hold the vessel within a metre or two of a fixed point beside a platform in heavy seas, without anchors. This is why the class matters commercially: a rig operator paying enormous daily rates cannot afford a supply vessel that has to stand off in bad weather.
An anchor handling tug supply vessel does a different and more violent job. It is essentially a tugboat with an enormous winch, used to tow semi-submersible rigs and floating units into position and to lay, recover and reposition their mooring anchors. AHTS work is lumpier and more spot-market-driven than PSV work, which is why its rates are far more volatile — and why the North Sea AHTS spot market is the industry's most-watched price signal.
The rest — fast crew boats, offshore tugs, light construction and maintenance support — rounds out the offering.
The revenue mix reflects this hierarchy. In 2025, PSVs contributed 72.3% of vessel revenue, AHTS vessels 24.2%, and other vessels 3.5%.2 Tidewater is, overwhelmingly, a PSV company with a valuable anchor-handling option attached.
How the money actually works. Vessels are chartered by the day. The customer pays a day rate for the vessel and its crew; fuel is typically the charterer's cost on term work. The vessel earns only when it is "on hire" — available and working — which is why the two variables that determine revenue are the day rate and utilisation, and why anything that takes a vessel off hire (a drydock, an unplanned repair, a transit between regions) is a direct revenue loss rather than a cost line. Contract tenor is the strategic variable management controls. A long charter locks in revenue and gives up upside; a short one does the reverse. Tidewater's stated policy is asymmetric by vessel class: keep the largest, most in-demand PSVs and anchor handlers on short tenor to capture repricing, and put smaller or lower-specification vessels away on longer terms where the amplitude of rate movement is lower anyway.1 That is a deliberate bet on the direction of the market, and it should be understood as such — it magnifies both the upside if rates rise and the exposure if they do not.
The segments. Tidewater reports through five: Americas, Asia Pacific, Middle East, Europe/Mediterranean, and West Africa (Africa).2 The second quarter of 2026 offered an unusually clean illustration of why geographic spread matters, because the regions moved in opposite directions at once. Gross margin rose eight percentage points sequentially in Europe and the Mediterranean, driven by an eight-point utilisation improvement and an 11% day rate increase. It fell roughly nine points in Africa on an eight-point utilisation decline, three points in both the Middle East and the Americas, and four points in Asia Pacific.1
Europe and the Mediterranean is where the pricing signal lives. North Sea AHTS spot rates for the largest vessel classes averaged over £160,000 per day during the second quarter of 2026 — the highest average on record — with individual fixtures concluded well above £200,000 per day. In the first quarter, spot rates for the largest anchor handler classes in Norway reached record highs above $350,000 per day.115 Those are not sustainable running rates; they are what happens when a genuinely tight market meets a handful of urgent requirements. But they establish the ceiling, and North Sea spot rates historically set the tone that trickles into other basins.
Africa — principally Angola, Nigeria, Namibia, Congo and Mozambique — is the high-specification deepwater PSV market, and it is lumpy in a way that punishes quarterly modelling. The second quarter of 2026 saw utilisation fall on idle days between campaigns even as day rates held flat, a useful reminder that in this business utilisation and price are separate variables that do not always move together. The forward demand picture rests on identifiable projects: Azule Energy's $5.1 billion Greater PAJ development offshore Angola reached final investment decision in late June 2026, with a 95,000 barrel-per-day FPSO scheduled for delivery and installation in late 2028, and multiple international oil company tenders were outstanding in Nigeria.1
Americas covers the Gulf of Mexico, Brazil, Mexico and the emerging Guyana–Suriname province. Brazil is the strategic prize — medium-class PSV rates there exceeded $42,000 per day in mid-2026 — though tendering slowed through 2026 as Petrobras deferred long-term awards during a Brazilian election year.1 The Gulf of Mexico, by contrast, has been flat all year, and management expects that flatness to persist into 2027; Tidewater has responded by relocating Jones Act vessels to support customers in Suriname and Guyana. That relocation is worth noting as evidence for a specific claim: a global operating platform lets you move capacity to where the price is, which a single-basin owner cannot do.
Middle East is the highest vessel count at the lowest average rates, dominated by shallow-water work for national oil companies. Saudi Aramco alone represents roughly 80% of Middle East segment revenue.20 That is a concentration risk worth holding in mind.
Asia Pacific — Malaysia, Indonesia, Australia, Taiwan — is the smallest and, on management's telling, the most likely beneficiary of energy-security-driven investment.
Customer concentration and competition. Tidewater's five largest customers accounted for 29.8% of 2025 revenue and its ten largest for 47.9%.2 The customer base is the roll-call of global energy: the supermajors, the national oil companies, and the subsea construction contractors who serve them.
The competitive set is more fragmented than "world's largest operator" suggests. Solstad remains a significant player in subsea and construction after exiting PSVs. SEACOR Marine, Bourbon Offshore under its bank ownership, and a long tail of regional operators compete on price. State-backed operators — most notably 中海油服 China Oilfield Services Limited — compete on terms that are not purely commercial. And in April 2026 the sector consolidated further when Helix Energy Solutions and Hornbeck Offshore agreed to combine, with Hornbeck shareholders taking approximately 55% of the merged entity, which will operate under the Hornbeck name and target $75 million or more in annual revenue and cost synergies.21
Kneen's reaction to that deal, on the first-quarter call, was revealing in its lack of defensiveness: "More consolidation is better. I certainly can't consolidate this industry by myself, so more the merrier."15 That is either admirable candour about the limits of one company's influence, or an admission that Tidewater's scale advantage is not large enough to set industry-wide behaviour. Both readings are defensible.
Which raises the central analytical question: is the tightness in this market a genuine structural condition, or a temporary alignment that the industry will, as it always has, eventually build its way out of?
VIII. Microeconomics of the OSV Bull Cycle: Supply-Side Inelasticity
The strongest single argument for Tidewater's core valuation rests on a simple microeconomic balance: as of the fourth quarter of 2025, the global offshore support vessel (OSV) orderbook stood at 216 vessels, split 57% anchor handling tug supply (AHTS) vessels and 43% platform supply vessels (PSVs). Combined, the PSV and AHTS orderbook represented approximately 4% of the active fleet — compared to 34% and 15%, respectively, at comparable points in the prior two cycles.8
That comparison highlights a structural shift. In 2014, the industry had committed to expanding vessel supply by more than a third. By 2026, it had committed to expanding fleet capacity by roughly one part in twenty-five.
Why nobody is ordering. Three reinforcing factors explain this supply discipline, in descending order of durability.
The first is return economics, which management cites most explicitly. Chief Executive Officer Quintin Kneen placed the newbuild threshold at an average day rate in the "low $30,000s" per vessel under current shipyard cost structures. Leading-edge fixtures in the second quarter of 2026 averaged $24,341 per day. Kneen suggested the market might reach that newbuild hurdle rate "maybe by the time we get to '29," and only after "a couple of strong years."1 Even taking that timeline at face value, a vessel ordered in 2029 would not deliver until 2031 or 2032. If demand holds, the supply lag is measured in years rather than quarters.
The second is financing. Commercial banks and high-yield investors who financed the 2010–2014 vessel construction boom suffered severe losses across virtually the entire owner base. Institutional memory in maritime finance remains constrained by those restructurings.
The third factor — where bullish narratives frequently overreach — is shipyard capacity. Industry observers often assert that global shipyards are booked through 2027 or 2028 with liquefied natural gas (LNG) carriers, containerships, and naval contracts, physically blocking OSV construction. While large, tier-one yards are indeed committed to complex builds, OSVs are typically constructed in smaller regional berths rather than LNG carrier yards. The primary barrier to OSV construction is return economics rather than physical berth scarcity; if market day rates reached $45,000 per day, yard capacity would emerge. The binding constraint is price rather than physics, meaning the moat is economic and erodible rather than permanent.
The aging fleet. More than half of the operational global OSV fleet is over 15 years old, with a median age near 18 years.22 Older vessels face escalating five-year special survey expenses and, historically, customer-imposed age limits during contract tendering.
However, fleet attrition is more nuanced than simple scrapping estimates suggest. In August 2026, Kneen noted that prior to the 2014–2015 downturn, Tidewater routinely operated vessels into their late twenties and early thirties. In his assessment, strict customer age restrictions during 2016–2018 served primarily as a tendering mechanism to cull an oversupplied market rather than a strict technical operational limit. With no technological transformation underway comparable to the 2011–2014 transition to larger, diesel-electric, DP2 vessels, Kneen expects the existing global fleet to operate "another 5 or 6 years before people need to rebuild."1
That dual perspective carries two distinct implications: it reinforces the near-term supply constraint (operators do not need to order immediately) while tempering aggressive fleet attrition assumptions (older tonnage may remain active longer than anticipated).
Operating leverage, with the arithmetic shown. Operating leverage explains why modest movements in day rates significantly impact corporate earnings. Tidewater reported operating costs of $181.8 million against revenue of $342.3 million in the second quarter of 2026, delivering a gross margin of 46.9%.1 Fixed operating expenses — including crew wages, insurance, routine maintenance, and shore-based support — change very little as day rates fluctuate.
Consider the operational math: management's guidance assumes roughly 80% utilization across an expanded fleet of approximately 213 OSVs following the Brazilian acquisition, representing 60,000 to 62,000 revenue-earning vessel days annually.1 A $1,000 per day increase in average realized fleet rates generates approximately $60 million in incremental annual revenue. Because operating costs remain largely fixed, the vast majority of that incremental revenue drops directly to gross margin.
Applying management's forward projection — an average rate increase of $3,000 to $4,000 per day in both 2027 and 2028 — yields $180 million to $240 million in incremental annual gross margin in each of those years, measured against a 2025 adjusted EBITDA base of $598.1 million.231
However, that projection represents a management forecast in a market where Tidewater acts as a price-taker. While management has cited this $3,000 to $4,000 annual expansion target across three consecutive earnings calls, historical execution shows a more gradual trajectory. The company's average day rate in 2025 reached $22,573, up 6.1% year over year, or roughly $1,300 per day.23 The fourth quarter of 2025 saw average rates decline 0.9% sequentially against the prior-year period.24 Furthermore, the first quarter of 2026 marked the first sequential increase in weighted-average leading-edge rates since the second quarter of 2025.15
While market recovery is evident, management's projected rate growth is roughly triple the pace recorded in recent quarters, making rate execution a key metric for investors to track.
The costs that eat the leverage. Two major capital lines affect net cash generation. Mandatory drydocking surveys and overhauls were budgeted at approximately $122 million for 2026, with an additional $7 million allocated for the acquired Brazilian fleet in the second half. Beyond direct cash costs, drydocks reduce fleet utilization: 949 drydock days in the first quarter of 2026 reduced utilization by roughly five percentage points, while 750 drydock days in the second quarter accounted for a four-point impact.1 Capital expenditures for 2026 were guided to approximately $52 million, including a planned $15 million upgrade for a Norwegian vessel, while baseline maintenance capital expenditures run at roughly $36 million annually.115
This maintenance figure highlights a core financial attribute of the asset base: a fleet producing over half a billion dollars in annual EBITDA requires roughly $36 million in routine annual maintenance capital. While periodic drydock expenses remain significant, the underlying free cash flow conversion rate remains robust.
Myth versus reality. Four widely cited industry assumptions warrant examination against reported operational data.
Myth: Shipyards are physically at capacity, preventing new OSV construction. Reality: The primary barrier is return economics rather than available shipyard berths. While major yards are booked with LNG carriers and naval work, OSVs are built in separate regional yards. New orders remain subdued because current day rates of around $24,000 do not cover the cost of capital for a new build requiring rates in the low $30,000s.1
Myth: An aging global fleet guarantees immediate vessel scrapping and structural market tightening. Reality: Management expects the global fleet to remain operational for another five to six years before wide-scale replacement becomes necessary, treating historical customer age limits as commercial screening tools rather than absolute mechanical lifespans.1 Attrition represents a gradual long-term factor rather than an abrupt capacity cliff.
Myth: Cold-stacked vessels represent a persistent reactivation threat. Reality: The global cold-stacked fleet count has remained largely flat for two years. The limited rate of vessel reactivations during the 2023–2024 market upturn indicates that much of the long-term idle tonnage has degraded to the point of being effectively scrapped in place.1
Myth: Corporate consolidation has granted surviving operators direct pricing power. Reality: Consolidation has eliminated distressed marginal operators, but the market remains structurally fragmented. Management explicitly characterizes competition in its highest-vessel-count region as highly fragmented.1 Day-rate dynamics continue to be driven by global supply-demand balances rather than producer concentration.
IX. Management & Governance Audit: Quintin Kneen & Capital Allocation
The evaluation of a management team rests not on rhetoric during prosperous quarters, but on whether its multi-year strategy remains consistent and aligned with operational execution.
Guidance discipline. Tidewater initiated its full-year 2026 guidance in November 2025, forecasting $1.43 billion to $1.48 billion in revenue and a gross margin of 49% to 51%, pro forma for the acquisition of Wilson Sons Ultratug Offshore. Management reaffirmed both ranges in March and May 2026 before trimming revenue guidance in August 2026 to $1.42 billion to $1.47 billion and narrowing the gross margin range to 49% to 50%. The adjustment stemmed from specific operational factors: the Brazilian acquisition's closing date was delayed by roughly two months, deferring high-margin revenue, which was partially offset by outperformance across legacy operations and additional conflict-related expenses in the third quarter.11520
The revision reflected transparent disclosure: the change was minor, the underlying mechanical drivers were clearly identified, and offsetting factors were explicitly noted. Additionally, after guiding for a roughly five-percentage-point sequential margin decline in the second quarter of 2026, management delivered a smaller 1.9-percentage-point contraction. This pattern of conservative guidance followed by modest outperformance has recurred across several quarters, pointing to deliberate forecasting conservatism rather than precision modeling.
Where the narrative has stayed consistent. Three core operational principles have remained unchanged: refusing vessel reactivations without contract terms that justify the expense, prioritizing day rates over utilization volume, and pursuing acquisitions only at prices below management's estimate of intrinsic value. Addressing capital discipline in August 2026, Kneen stated directly that the company was "not interested in acquiring vessels at a premium to our view of their current value simply for the sake of adding scale."1 Similarly, management rejected smaller acquisition opportunities, noting that "the amount of work it takes to do a three-vessel transaction is about the same as it takes for 20."1
Where capital allocation warrants scrutiny. Tidewater's board authorized a $500 million share repurchase program on August 1, 2025, representing approximately 12% to 13% of shares outstanding.215 As of June 30, 2026, the company had not repurchased any shares under this program. Tidewater executed buybacks earlier in 2025—purchasing 2.5 million shares for $98.2 million at an average price of $39.52 according to its full-year earnings release, or 2,290,204 shares for approximately $90.0 million excluding commissions and excise taxes per its 10-K filing—before pausing repurchases in the fourth quarter of 2025.223
Management attributed the pause to cash preservation for the Brazilian acquisition, which required approximately $270 million in cash consideration alongside lender consents to novate roughly $261 million in assumed debt.125 Executive leadership reiterated that repurchases remain opportunistic relative to M&A opportunities, noting that the company does "not view carrying excess cash on the balance sheet as an optimal long-term capital allocation strategy."1
However, execution reveals a clear gap between authorization and capital deployment. Although Tidewater's stock traded as low as $46.65 over the prior twelve months before rising to near $94 in August 2026, the $500 million authorization remained unused during a period of lower valuations.4 Meanwhile, cash reserves reached $613.5 million by the end of the second quarter of 2026.26 Framing capital allocation as opportunistic remains defensible only if cash is eventually deployed effectively; the test of this policy will occur as the Brazilian transaction closes and capital priority shifts back to organic cash returns.
Executive compensation structure. Commentary often suggests that Tidewater's executive incentives are weighted toward return on capital employed (ROCE) or free cash flow per share to curb empire-building. However, proxy disclosures detail a different structure. Approximately 86% of the CEO's 2025 target direct compensation was performance-based and variable, with long-term performance share units tied directly to total shareholder return (TSR)—evaluated on both an absolute basis and relative to a defined peer group. SEC filings highlight a three-year absolute TSR of 37%, a three-year relative TSR at the 75th percentile of peers, and a five-year absolute TSR of 485%.27
While TSR-linked compensation aligns management with equity performance, it differs fundamentally from return-on-capital metrics. In a deeply cyclical, commodity-exposed sector, total shareholder returns often reflect broader market recovery and entry timing—such as measuring five-year returns from a post-restructuring trough—rather than balance sheet discipline alone.
Governance and accounting items. Following the June 16, 2026 annual meeting, Tidewater's board of directors comprises seven members—86% of whom are independent—with an average tenure of 5.6 years across four standing committees, including Safety & Sustainability. Shareholders approved the advisory say-on-pay proposal with 40,548,175 votes in favor and 362,605 against.27
Two financial disclosure items require careful interpretation. First, reported 2025 net income of $333.5 million included a $201.5 million non-cash deferred tax benefit resulting from an internal restructuring of vessel ownership.23 While adjusted EBITDA expanded roughly 7% year over year, reported net income nearly doubled due almost entirely to this non-cash tax accounting adjustment. As of June 30, 2026, the balance sheet reflected $182.5 million in tax assets, the realization of which depends on taxable profitability across specific regional jurisdictions.26
Second, regarding conflict-related cost recovery, Tidewater noted that it was contractually permitted to rebill customers for war risk insurance and war-related crew wages totaling approximately $5 million through the second quarter of 2026. By mid-2026, the company had invoiced nearly $1 million of those expenses and collected less than $100,000.1 Management excluded these potential recoveries from financial guidance. Nevertheless, the delay between contractual entitlement and cash collection—in a regional segment where a single state-owned oil company accounts for 80% of revenue—illustrates commercial leverage dynamics in practice. As Kneen noted, Saudi Aramco represents "a strong customer, an important customer and also a difficult customer."1
X. Strategic Position: Porter's 5 Forces & Helmer's 7 Powers
Evaluating Tidewater's competitive position reveals a picture more nuanced than simple bullish or bearish arguments suggest.
Helmer's 7 Powers — what Tidewater plausibly maintains.
Scale economies represents the company's most defensible structural advantage, supported by operational evidence. Tidewater maintains crewing pools, shore bases, procurement networks, and regulatory compliance infrastructure across more than thirty countries.2 The operational value of this scale is fleet redeployment: when Gulf of Mexico demand flattened in 2026, Tidewater redirected Jones Act tonnage toward Suriname and Guyana; when Mediterranean demand surged, it repositioned vessels from other regions; when Asia Pacific market conditions tightened, it shifted large PSVs into that theater.115 A single-basin operator facing a soft regional market must absorb vessel idle time. In contrast, Tidewater's operational flexibility translates into higher fleet utilization that smaller competitors cannot match. This scale also drives overhead efficiency: full-year 2026 general and administrative expenses, excluding transaction costs, were guided to roughly $126 million against $1.42 billion to $1.47 billion in revenue—keeping overhead below 9% of revenue across a fleet of more than 200 vessels.1
Switching costs represents a weaker power claim that requires careful qualification. An offshore support vessel is not embedded software; a charterer can substitute one compliant platform supply vessel for another upon contract expiration. What actually creates customer retention is the asymmetry of operational failure. An energy major executing a deepwater drilling program incurs immense daily rig costs; a support vessel that fails to deliver drilling fluids on schedule or suffers a safety incident alongside a platform can idle the entire multi-million-dollar offshore operation. Consequently, major producers enforce stringent auditing, technical vetting, and safety qualification standards that long-tail operators cannot satisfy. While this creates a high hurdle for smaller competitors, it offers little differentiation against primary peers: restructured operators such as Solstad, Hornbeck, SEACOR Marine, and major state-backed entities clear the exact same operational qualification standards.
Cornered resource claims warrant the greatest skepticism. Tidewater controls the world's largest fleet of active, high-specification PSVs—a position of significant value during a tight market. However, in economic terms, a cornered resource requires preferential access to a coveted asset on superior terms. Tidewater's vessels are not unique; virtually every hull in its fleet has direct functional substitutes owned by competitors. Rather than cornering a resource, Tidewater simply holds the largest position in a temporarily scarce commodity. That reflects a cyclical supply advantage rather than a permanent structural moat.
Notably absent from Tidewater's position are network effects, counter-positioning, brand equity, and proprietary process power. This absence reflects the fundamental realities of capital-intensive maritime logistics rather than operational deficiency.
Porter's Five Forces.
Threat of new entrants: currently low, structurally moderate. New market entry remains constrained because newbuild hurdle rates far exceed current charter pricing and commercial bank debt financing remains scarce. However, this entry barrier is defined by return economics rather than proprietary technology. If leading-edge day rates reach the low $30,000s, new construction becomes economically viable, and a new entrant needs only regional scale to compete in a single basin.
Bargaining power of buyers: shifted from very high to moderate. Between 2015 and 2021, charterers dictated contract terms. With global orderbooks near historic lows and fleet utilization tightening, pricing leverage has rebalanced toward vessel owners. However, power has not inverted. Tidewater's primary clients are integrated energy majors that retain the ultimate form of buyer leverage: the ability to defer offshore capital projects. Petrobras's decision to delay Brazilian tendering during an election year, materially dampening regional activity, demonstrates this dynamic in practice.1
Bargaining power of suppliers: moderate to high, and rising. Mariner labor remains scarce and increasingly expensive, putting upward pressure on operating costs. Meanwhile, shipyard repair capacity and drydock slots are tight enough that shifting the maintenance schedule of just seven vessels reduced fleet utilization and gross margins by several percentage points across a full quarter in 2026.1
Threat of substitutes: negligible. No alternative technology exists to transport hundreds of tons of pipe, cement, and liquid drilling fluids to a offshore rig a hundred miles off the coast. The genuine substitution risk relates to overall offshore activity—specifically, the long-term energy transition away from offshore hydrocarbons. That represents a multi-decade structural variable driven by capital allocation rather than direct technological displacement of the vessel itself.
Competitive rivalry: moderating, but still fragmented. Sector consolidation has progressed through the absorption of GulfMark, Swire Pacific Offshore, Solstad's PSV fleet, and the Hornbeck-Helix combination, removing independent operators from the market. Nevertheless, management explicitly noted that competition in the Middle East remains highly fragmented, and Kneen has repeatedly acknowledged that Tidewater cannot single-handedly consolidate the sector.115
In summary, Tidewater's advantages are fundamentally operational: global logistics scale, fleet redeployment flexibility, tier-one customer qualification, and competitive access to capital markets. What the company lacks is a structural mechanism to protect pricing when the offshore cycle eventually turns. That distinction forms the core of the long-term investment evaluation.
XI. Bull vs. Bear Case & Activist Stress Test
Why this wins from here.
The bull case rests on four primary legs, ranked by the strength of supporting evidence.
Strongest: the supply cliff. A 4% orderbook relative to an active fleet with a median age of 18 years—in an industry where the cost threshold for new builds remains well above current charter pricing—is a structural fact.822 Marketed OSV utilization averaged 76% in 2025, with industry projections pointing to 77% in 2026 and above 79% in 2027.22 Further supply-side tightening does not require a surge in offshore exploration; it requires only that overall demand does not drop.
Strong: contract rollover. Tidewater's average realized day rate of $22,938 sits roughly $1,400 below its leading-edge rate of $24,341 per day, and management is deliberately keeping its highest-specification vessels on short-term charters to capture market rate increases. The company signed 25 term contracts in the second quarter of 2026 averaging roughly 12 months, with executive leadership explicitly prioritizing availability for the largest PSVs and anchor handlers.1 Legacy contracts negotiated during market troughs continue to roll over into higher current rates. This repricing provides a predictable revenue tailwind while rates rise, though it also leaves the fleet exposed if charter rates weaken.
Moderate: demand. Tendering and pre-tendering activity across offshore support services expanded through mid-2026, backed by specific project commitments: the final investment decision on Angola's $5.1 billion Greater PAJ project, major oil company tenders in Nigeria, drilling restarts in Namibia, FPSO contract awards in Brazil, and energy-security initiatives across Asia.115 Crucially, management noted that most of this increased tendering reflects projects planned before the Middle East conflict escalated, indicating that demand growth is driven by long-term field development rather than temporary geopolitical disruptions.
Weakest: capital returns. A $500 million share buyback program remains an unused authorization rather than a proven track record. Capital returns strengthen the investment thesis only when management actually deploys cash to retire shares.
What breaks the case.
Commodity price. The transmission mechanism is well established: offshore projects require substantial capital commitments and multi-year lead times. A sustained drop in crude oil prices leads energy companies to defer final investment decisions, which reduces offshore rig activity and depresses vessel demand two to four quarters later. A drop in Brent crude toward or below $60 per barrel would not immediately disrupt Tidewater's contracted backlog, but it would undermine the 2027–2028 day-rate expansion that underpins current equity valuations.
Unfulfilled day-rate projections. Management has projected annual average day-rate increases of $3,000 to $4,000 per vessel for 2027 and 2028. However, the company's average rate increase in 2025 was roughly $1,300 per day, and fourth-quarter 2025 rates declined sequentially.2324 If actual rate growth averages $1,500 per day instead of $3,500, reported earnings will fall short of market expectations, leaving shares—which doubled from their 52-week low to trade near $94—vulnerable to repricing.
Cost inflation eroding operating leverage. Vessel operating expenses rose from $166.9 million in the first quarter of 2026 to $181.8 million in the second quarter—a 9% sequential increase driven by higher repair and maintenance expenses, rising mariner wages, and conflict-related operating costs.1 Fuel expenses also climbed over 50% sequentially. If labor, drydocking, and maintenance expenses inflate at the same rate as vessel day rates, the anticipated operating leverage will be largely offset.
Geopolitical and jurisdictional exposure. Operating across more than 30 countries exposes Tidewater to local content mandates, foreign currency volatility, and regional tax disputes. Regional conflicts—referred to in company disclosures as "Operation Epic Fury"—added approximately $9.2 million in direct operating expenses during the first half of 2026, with an additional $4 million anticipated in the third quarter.1 While Tidewater suffered no vessel downtime and reported improved Middle East utilization and day rates, operating expenses increased before charter revenues adjusted, and contractual cost recoveries from state-owned clients have proceeded slowly.
Execution risk in serial acquisitions. Tidewater has completed four major acquisitions in eight years, framing each as a strategic expansion. Management has maintained that it will not pay premium valuations for scale alone, and its historical execution reflects disciplined acquisition pricing. Nevertheless, continuous consolidation carries integration risks, particularly if future transactions are executed near a cyclical market peak.
The activist stress test.
An institutional activist inspecting Tidewater's operational and financial disclosures would likely raise four specific points:
Why carry $613.5 million in cash against $653.2 million in total debt—yielding negligible net debt—in a business generating over $500 million in annual EBITDA?2623 Management cites acquisition flexibility and liquidity preservation, acknowledging that holding excess cash indefinitely is not an optimal long-term strategy. However, maintaining an unused $500 million buyback authorization while shares fluctuated between $46.65 and $95.32 reflects capital allocation by delay rather than active timing.
Does the acquisition pipeline serve as a strategic priority or a standing reason to delay share repurchases? Asked in May 2026 whether industry consolidation opportunities were narrowing, Kneen stated: "I actually don't believe that the M&A opportunities are winding down."15 While bolt-on acquisitions remain plausible, capital allocation discipline requires balancing potential fleet purchases against direct share buybacks when stock prices diverge from intrinsic asset values.
Is the balance sheet overly conservative for the current point in the cycle? Here, management's conservative stance is supported by industry history. Having navigated a 2017 bankruptcy that eliminated $1.6 billion in debt, maintaining post-acquisition net leverage of roughly 0.8 times EBITDA and total liquidity exceeding $850 million provides vital protection for a cyclical business where revenues can drop sharply during severe downturns.1
Does portfolio complexity create hidden drag? Tidewater's asset structure is unusually direct. The balance sheet carries zero goodwill and zero intangible assets—a rare feature for a company that completed multiple fleet purchases, indicating that acquisitions were booked at or below fair asset values rather than generating premium accounting entries.26
Material risk radar.
Three operational risks present specific transmission mechanisms for investors to monitor: (1) commodity price risk, where falling oil prices reduce offshore exploration budgets, lowering rig counts and depressing vessel demand on a two-to-four-quarter lag; (2) maritime labor and drydock inflation, which directly increases daily vessel operating costs and compresses gross margins; and (3) drydock scheduling and unplanned downtime, which reduces billable vessel days. Management highlighted drydock execution as the primary variable affecting near-term contract revenue, as demonstrated in 2026 when rescheduling drydocks for seven vessels caused noticeable quarterly margin shifts.1
XII. Playbook & Key Investing Lessons
Lesson one: in asset-heavy cyclicals, the balance sheet is the strategy. Tidewater's most decisive move was not an acquisition, but emerging from restructuring in July 2017—roughly three years ahead of primary competitors. Operating with a clean balance sheet while rivals remained bogged down in bankruptcy proceedings enabled every subsequent acquisition. The broader takeaway is clear: in industries with volatile asset values and fixed operating costs, long-term leadership often belongs not to the operator with the sleekest fleet, but to the firm whose capital structure survives to buy distressed assets at a discount.
Lesson two: acquiring existing vessels and building new ones represent opposing strategies, not variations of the same playbook. Ordering a new vessel expands total market supply, dampening day rates across an owner's existing fleet. Purchasing a competitor's asset adds no net capacity while consolidating market supply and reducing independent price competition. In a capital-intensive sector with fixed costs and standardized assets, secondary fleet purchases prove far more economical than new construction—explaining why Tidewater acquired existing tonnage while refraining from shipyard orders. However, this dynamic reverses once industry-wide charter rates reach newbuild economics, with the critical threshold centered around day rates in the low $30,000s.
Lesson three: supply-side inelasticity provides a more dependable pricing tailwind than demand growth, though it carries an expiration date. The central pillar of the current market structure is not unprecedented offshore drilling activity, but rather a supply response constrained by multi-year construction lags and high replacement costs. Investors in cyclical industries often overemphasize demand forecasts while underestimating physical fleet orderbooks. While demand projections remain subject to broader economic shifts, committed shipyard orderbooks represent concrete capacity constraints. Long-term monitoring of orderbook growth is essential, as supply expansion will signal the initial turn in the cycle.
Key performance indicators to track. Three primary metrics provide the clearest view of operational execution and cycle trajectory:
1. Average realized day rate versus leading-edge day rate. Tidewater reports both metrics—a realized average fleet rate of $22,938 against a leading-edge contract rate of $24,341 per day in the second quarter of 2026.1 Realized rates reflect current fleet earnings, while leading-edge rates indicate pricing on newly executed charters. A widening spread highlights embedded upside as lower-rate legacy contracts expire and roll into current market rates. Conversely, a narrowing or negative spread provides an early signal of market softening quarters before revenue declines appear in financial statements.
2. Active fleet utilization. Tidewater reported active vessel utilization of 80.6% in the first quarter of 2026 and 81.4% in the second quarter, aligned with full-year guidance of approximately 80%.1 Utilization measures fleet demand absorption, representing the volume side of revenue generation. Because planned drydocking schedules temporarily depress reported utilization, investors should evaluate underlying fleet utilization alongside quarterly drydock day disclosures.
3. Free cash flow generation and capital allocation. Reported net income provides an incomplete measure of operational health due to non-cash items, drydock amortization, and debt refinancing charges—highlighted by 2025 net income that included a $201.5 million non-cash deferred tax benefit.23 Free cash flow reached $426.0 million in 2025, followed by $34.4 million in the first quarter of 2026 and $64.4 million in the second quarter, with management projecting higher cash generation in the second half of the year.123 Tracking free cash flow deployment—whether directed toward share repurchases, disciplined fleet acquisitions, or liquidity accumulation—serves as the primary benchmark for management's capital allocation discipline.
XIII. Epilogue & Future Outlook
Seventy-one years after ten investors in Louisiana pooled capital to construct a specialized workboat, Tidewater is once again the largest operator of the vessel class it pioneered. Its path ran through rapid global expansion, a corporate diversification detour, two severe industry downturns, a Chapter 11 bankruptcy that wiped out legacy equity, and a post-restructuring recovery built primarily on distressed fleet acquisitions.
Tidewater's operational turn reflects clear structural execution: it converted a debt restructuring into a strategic timing advantage, integrated four major competitor fleets across four continents without impairing asset values, shifted its debt structure from secured obligations to a single unsecured maturity in 2030, and reached mid-2026 with nearly zero net debt, over $850 million in total liquidity, and gross operating margins near 47% despite regional conflict.12
What the company has not yet established is whether market conditions will support management's projected day-rate growth of $3,000 to $4,000 annually over two consecutive years. Charter pricing remains a function of broader industry supply and demand, leaving Tidewater as a price-taker in a commodity-driven market.
Three operational and financial catalysts will shape the company's trajectory over the next twelve to twenty-four months.
The Brazilian integration. Announced on February 22, 2026, the Wilson Sons Ultratug acquisition carries an enterprise value of roughly $500 million, including approximately $261 million in assumed low-cost amortizing debt. The deal adds 22 platform supply vessels—19 of which were constructed in Brazil—and brings nearly $441 million in contracted backlog, expanding Tidewater's regional presence from six vessels to 28. Management expects the transaction to close around September 1, 2026.251 Beyond physical steel, the acquisition grants Brazilian Special Registry tonnage rights that allow foreign-flagged vessels to operate locally on favorable terms, while Brazilian-built hulls receive priority status in domestic tenders.28 Key execution tests include whether operational integration proceeds on schedule and whether Petrobras tendering activity resumes following fourth-quarter national elections.
The day rate trajectory. Leading-edge day rates inflected upward in the first quarter of 2026 before accelerating 7.5% sequentially in the second quarter.1 Sustaining that pace over subsequent quarters will be necessary to validate management's multi-year earnings projections, while any rate deceleration would undermine high-growth expectations.
The capital return decision. Following the close of the Brazilian transaction, with net leverage near 0.8 times EBITDA and cash generation expanding, deployment of the authorized $500 million share buyback program will serve as a definitive test of capital discipline. Whether management executes repurchases, pursues further fleet acquisitions, or preserves excess cash will demonstrate whether capital allocation aligns with long-term shareholder return objectives.
Historically, the offshore supply sector has not rewarded raw fleet scale. Instead, it has favored operators that maintain balance sheet solvency through cyclical troughs and capital discipline during market expansions. Tidewater absorbed those lessons through Chapter 11 reorganization. The ultimate test for the company is whether that operating and financial discipline persists as market conditions recover or gives way to the cyclical overextension of prior booms.
References
-
Tidewater (TDW) Q2 2026 Earnings Call Transcript — The Motley Fool, 2026-08-03 ↩↩↩↩↩↩↩↩↩↩↩↩↩↩↩↩↩↩↩↩↩↩↩↩↩↩↩↩↩↩↩↩↩↩↩↩↩↩↩↩↩↩↩↩↩
-
Tidewater Inc. Annual Report on Form 10-K for FY2025 — U.S. Securities and Exchange Commission / SEC EDGAR, 2026-03-02 ↩↩↩↩↩↩↩↩↩↩
-
Tidewater Successfully Completes Financial Restructuring And Emerges From Chapter 11 Bankruptcy — PR Newswire / Tidewater Inc., 2017-07-31 ↩↩↩
-
Europe Brent Spot Price FOB — U.S. Energy Information Administration ↩
-
Westwood Insight – Offshore vessel fleets tighten amid sustained supply discipline — Westwood Global Energy Group ↩↩↩
-
Bourbon Emerges From Long Restructuring With New Private-Equity Owners — The Maritime Executive ↩
-
Solstad Offshore Completes Restructuring as Sector Struggles — The Maritime Executive ↩↩
-
Tidewater Announces Successful Completion of Business Combination with GulfMark — Tidewater Inc., 2018-11-15 ↩
-
Tidewater Inc. 2018 Proxy Statement & Agreement of Merger with GulfMark Offshore — SEC EDGAR, 2018 ↩
-
Quintin V. Kneen — President, Chief Executive Officer and Director, Executive Profile — Fintool ↩
-
Tidewater (TDW) Q1 2026 Earnings Call Transcript — The Motley Fool, 2026-05-05 ↩↩↩↩↩↩↩↩↩↩↩
-
Tidewater Announces the Acquisition of Swire Pacific Offshore, Creating World's Leading OSV Operator — Tidewater Inc., 2022 ↩
-
Tidewater Announces Completion of Acquisition and Associated Financing of Platform Supply Vessels From Solstad Offshore — Tidewater Inc., 2023-07-05 ↩↩↩
-
Tidewater to buy Solstad's 37 PSVs for $577 million — Marine Log, 2023-03 ↩
-
Tidewater Inc. SEC Filings & Financial Disclosures — Tidewater Inc. Investor Relations ↩
-
Tidewater (TDW) Q4 2025 Earnings Call Transcript — The Motley Fool, 2026-03-03 ↩↩
-
Helix and Hornbeck to Combine to Create a Premier Integrated Offshore Services Company — Helix Energy Solutions Group, Inc., 2026-04-22 ↩
-
Offshore Support Vessel Market Analysis: Aging Fleet, Soaring Values, and Supply Constraints in 2026 — IndexBox ↩↩↩
-
Tidewater Reports Results for the Three and Twelve Months Ended December 31, 2025 — Tidewater Inc., 2026-03-02 ↩↩↩↩↩↩↩↩
-
Tidewater Reports Full Year and Fourth Quarter Results — Tidewater Investor Relations ↩↩
-
Tidewater Announces the All-Cash Acquisition of Wilson Sons Ultratug Offshore — Tidewater Inc., 2026-02-22 ↩↩
-
Tidewater Inc. Quarterly Report on Form 10-Q for the period ended June 30, 2026 — SEC EDGAR, 2026-08-03 ↩↩↩↩↩
-
Tidewater Inc. Definitive Proxy Statement (DEF 14A) — SEC filing summary, 2026 ↩↩
-
Tidewater acquires Wilson Sons Ultratug Offshore in all-cash deal — Baird Maritime, 2026-02 ↩
 LinkedIn
 WhatsApp
 Reddit
 Hacker News
 Email
Email Kindle
 RSS Feed
 Spotify
 Apple Podcasts
 Amazon Music
 Audible
 YouTube