Safety Insurance: The Regional Insurer That Sold at the Peak of a Recovery?
I. The $105 Exit
On November 3, 2026, Safety Insurance Group held a special meeting at its headquarters on Custom House Street in Boston, near the waterfront. There was little suspense. Of the 14.7 million shares entitled to vote, about 11.3 million voted to sell the company to MAPFRE, and fewer than 13,000 voted against.1 Roughly three-quarters of the entire register, not just the shares that bothered to show up, said yes. The one discordant note came on a smaller question. On the advisory vote over the pay executives would collect because of the merger, about 2.1 million shares voted no, close to one vote in five.1 Shareholders were happy to take the price. A meaningful minority was less happy with how the people negotiating it would be paid.
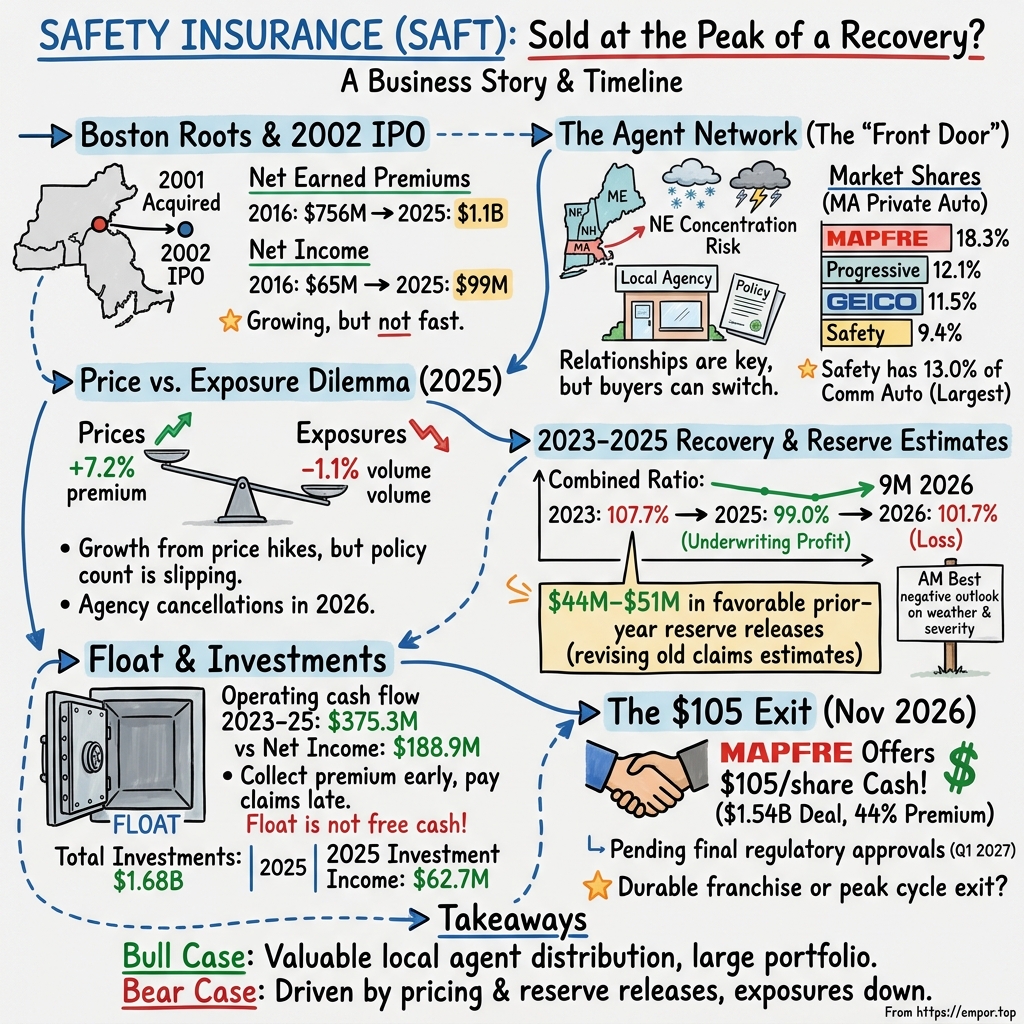
The price was $105 a share in cash, which valued Safety at about $1.54 billion and amounted to a 44% premium to where the stock had traded before the deal was announced in July.2 The proxy statement put a sharper point on it: the stock had closed at $72.50 on July 22, 2026, the last day before the announcement, so the offer was 44.8% above it.3 For an insurer whose shares had spent years drifting in the $70s and $80s, that is a large number. Investors who had held through a painful 2023 were suddenly being offered a price far above anything the stock had fetched in years.
The next afternoon, Safety reported its third quarter, and the release looked like a company hitting its stride. The combined ratio, the insurance industry's master scorecard, improved to 96.3% from 98.9% a year earlier. Net income rose to $30.0 million. George Murphy, the chairman and chief executive, credited premium increases written in earlier periods now flowing into revenue, fewer accidents in private passenger auto, and the largest quarterly net investment income in the company's history.2
Read one line further down, though, and the story changes. For the first nine months of 2026, net income was $50.2 million, against $79.1 million in the same period of 2025, and the nine-month combined ratio was 101.7%, meaning that across the year to date Safety had paid out more in claims and expenses than it had earned in premiums.2 The culprit was the winter. In the first quarter, two severe storms swept the Northeast and Safety posted a net loss of $14.3 million.3 So the strongest quarter of the year arrived in the same season as the sale, after the weakest one. That raises the question at the center of this story: is MAPFRE buying a durable regional franchise, or a recovery captured at precisely the moment the insurance cycle may be turning?
Three questions sit underneath that one, and they will carry the rest of this episode. The first is whether Safety can sustain profitable underwriting, meaning a combined ratio comfortably below 100% without help from accounting for old claims. The second is whether Safety can keep growing without leaning on price increases, because a company that raises rates while losing policies is getting more from fewer customers, which works only until it does not. The third is what exactly MAPFRE is paying for in a company that operates in three small New England states and holds less than a tenth of its home state's private auto market.
It is worth being precise about where the deal stands tonight. Safety is still an independent, listed company. The federal antitrust waiting period expired on September 14, 2026, and the shareholders approved the merger, but the transaction still requires insurance-regulatory approvals, including Massachusetts.4 MAPFRE filed its application for approval to take control of Safety's insurance subsidiaries, the so-called Form A filing, with the Massachusetts Commissioner of Insurance on August 25, 2026, and the merger cannot close until that approval arrives.3 Both companies expect closing in the first quarter of 2027.3 Until then, MAPFRE is the buyer, not the owner, and every claim paid this winter is Safety's own.
That boundary matters for how to read the numbers. Safety earned $99.3 million in 2025, up from $18.9 million in 2023.5 The sale price is anchored to that rebound. If 2025 is what a normal year looks like, the price is generous but defensible. If 2025 was a high-water mark built partly on releases from old reserves, then the shareholders have sold well, and the hard work of proving the franchise's earning power passes to Madrid. To judge which, the story has to begin where Safety itself began as a public company, with a management buyout and a Massachusetts auto market that worked like no other in America.
 Subscribe on LinkedIn
II. From a Boston Insurer to a Public Company
Safety Insurance was founded in 1979, and for its first eighteen years it wrote nothing but auto insurance.6 That single fact explains much of the company's personality. Massachusetts was, for decades, a peculiar place to sell car insurance. The state set the maximum rates insurers could charge for private passenger auto, a system the prospectus contrasted with homeowners insurance, which "unlike personal auto" did not have state-established maximum premium rates.6 In a market where the price was largely fixed, an insurer could not win by undercutting rivals. It won by choosing risks carefully, running a lean back office and being the carrier that independent agents liked to call.
Safety did that well. Between 1997 and 2001, direct written premiums rose 73%, from $272.5 million to $471.9 million, and its share of the Massachusetts private passenger auto market rose from 7.6% to 10.4%.6 The number of cars it insured, measured in what the industry calls exposures (one car insured for one year), grew from about 287,000 to 427,000, while the average premium per car rose from $748 to $918.6 By the company's own account, it had been profitable and had grown premiums every year since its founding.6 Its pitch was a relationship business: about 500 independent agents in roughly 600 locations across Massachusetts, a portal called the Agents Virtual Community through which they could submit and service policies electronically, and an expense ratio that management said ran below the industry's.6
The company that went public, however, was not quite the company that had built that record. On October 16, 2001, a newly formed holding company, Safety Holdings, acquired Thomas Black Corporation, the parent of Safety Insurance and its affiliates, from a group of shareholders that included Thomas Black Corporation's founder, members of his immediate family and the company's employee stock ownership plan.6 Safety's senior managers did not do this alone. To arrange financing and negotiate terms, they brought in The Jordan Company, a private investment firm that specialised in buying companies in partnership with management, and The Jordan Company assembled the equity investors, including the London-listed JZ Equity Partners.6 The purchase was financed with bank debt, senior subordinated notes, redeemable preferred stock and common equity.6
That structure tells you what the IPO was for. A management buyout loads a company with obligations, and the cleanest way to unload them is to sell shares to the public. Safety said it would convert its preferred stock into common shares at the offering price and use the IPO proceeds, together with a new bank facility, to reduce its debt and pay accrued preferred dividends.6 The amended prospectus filed in November 2002 carried the same story to market.7 The offering closed in late November 2002, and Safety Insurance Group began trading on NASDAQ under the ticker SAFT.89
Two cautions from that era still matter. First, the prospectus warned that because the acquisition was accounted for as a purchase, with Thomas Black Corporation's assets and liabilities restated at fair value, the post-acquisition financial statements were not comparable with the predecessor's.67 Any claim that Safety has a forty-five-year unbroken record splices together two accounting entities. Second, the IPO gave Safety a public currency and a public scorecard. Management would now be judged quarterly, and the dispersed shareholders who replaced the buyout investors would eventually be the ones who decided, in a single morning in November 2026, to sell.
In that era the company was run by David Brussard, the chief executive and president, who led a team whose members averaged more than twenty years at Safety.6 That continuity became a defining trait. The man who runs Safety today, George Murphy, was already at the company when it listed, and has spent his entire career there.9
Fast-forward through two decades and the long-run arithmetic is steady rather than spectacular. Net earned premiums, the premiums an insurer has actually "earned" by providing coverage over time, rose from $755.8 million in 2016 to $1.139 billion in 2025.105 Net income rose from $64.6 million to $99.3 million over the same span.105 Both work out to growth in the mid-single digits a year, roughly what one would expect from an insurer whose premiums track inflation, car values and repair costs in a mature market. This is a larger insurer than it was a decade ago. It is not a fast-growing one.
The years since 2023, by contrast, look like a different company. Net earned premiums jumped from $834.4 million in 2023 to $1.139 billion in 2025, a rise of more than a third in two years, and net income rose more than fivefold, from $18.9 million to $99.3 million.5 Direct written premiums climbed from about $991 million to almost $1.28 billion.5 A mature regional insurer does not normally grow a third in two years by accident. Something changed: prices, the mix of business, the claims environment or the accounting for old claims. Most likely all four.
There is one more number that frames the whole recovery. Safety's book value per share, the accounting net worth that belongs to each share, was $62.47 at the end of 2021 and $60.98 at the end of 2025.9 Over four years that included a record premium surge, the company's net worth per share went slightly backwards, even after paying generous dividends along the way. Some of that reflects bond prices falling as interest rates rose, which hit every insurer. But it means the 2023–25 surge was a recovery from a hole, not a climb to new ground. The question is what kind of hole, and the place to start is with the person who actually sells a Safety policy.
III. The Agent Network Is the Product’s Front Door
Picture a driver in Worcester or Quincy whose policy is up for renewal. She can go online and get a quote from GEICO or Progressive in minutes. Or she can call the insurance agency on Main Street that has handled her family's cars and house for years, where an agent can quote her with several carriers at once and pick the one that fits. In Massachusetts, a striking amount of business still flows through that second door, and Safety has built its entire company around it.
At the end of 2025, Safety worked with 797 independent agents operating from 1,063 locations across Massachusetts, New Hampshire and Maine.5 Auto insurance, private passenger and commercial combined, accounted for 54.9% of the company's direct written premiums, and 96.3% of auto and other direct premiums came through voluntary agents rather than through state-assigned channels.5 Safety does not sell directly to consumers on any material scale. The agent is the front door, the salesperson and often the first call after a crash.
It helps to understand what the agent is actually selling, because the revenue model is easy to mistake. A car insurance policy usually renews, and a well-run insurer keeps most of its customers from year to year. But renewals are not a subscription. Every year, the premium is reset by the number of cars insured, the price per car, the share of customers who stay, the rates the regulator allows and the mix of drivers and coverages. The customer can walk at every renewal, and the agent, who represents several carriers, can move the customer. Revenue grows only when one of those levers moves in Safety's favour without another moving against it.
Where does Safety stand in this market? In Massachusetts private passenger auto, MAPFRE led with 18.3% of premiums in 2025, followed by Progressive at 12.1% and GEICO at 11.5%. Safety came fourth with 9.4%, just ahead of Plymouth Rock at 7.9%.115 In commercial auto, the picture flips: Safety was the largest writer in the state, with 13.0% of the market, ahead of MAPFRE's 11.8%.5 In homeowners, Safety ranked third with 7.0% of the Massachusetts market in 2024, behind MAPFRE at 10.6% and Liberty Mutual at 8.1%.5 Nationally, Safety is a minnow: S&P Global Market Intelligence ranked it the 52nd largest auto writer in the United States by 2024 premiums.5
Now apply the test that matters for any claimed moat: has the advantage shown up as market share over time? The record says no. When Safety went public, it held 10.4% of the Massachusetts private auto market.6 In 2015, it held about 10.2%.12 In 2025, it held 9.4%.11 Over almost a quarter of a century, the company with the deep agent relationships and the local knowledge has not widened its position in its core product. It has held most of it, which is no small thing in a market that national direct writers entered in force, but holding is not winning.
The reason it has been hard to win is visible in Safety's own filings. Historically, many large national insurers chose not to compete in a material way in Massachusetts private auto, but since 2008, several new companies have entered the market, including some able to sustain significant losses to buy market share and others that use distribution methods that compete with the independent agent channel.5 That year matters because it was when Massachusetts began moving away from the old system of state-set rates toward competitive pricing, which made the state worth entering for carriers that win on price and advertising. The comfortable world described in the 2002 prospectus, where agents and underwriting discipline mattered more than price, gave way to one where Progressive and GEICO could take share by spending on marketing and pricing sharply.
So what does the agent franchise actually provide? Three things, credibly. It provides distribution that Safety does not have to build itself, paid through commissions as business is written. It provides local information: agents know which neighbourhoods flood, which body shops inflate bills and which customers will pay late. And it provides some stickiness, because a customer who trusts an agent tends to stay with whatever carrier the agent recommends. What it does not provide is lock-in. The customer can switch at renewal, the agent can place the customer with a rival, and Safety, like every carrier, needs regulatory approval for its rates. The decade-long share comparison is the clearest caution against claiming a widening moat. The evidence supports a durable franchise of roughly constant size, not an advantage that compounds.
The model is also geographically concentrated in a way that cuts both ways. Massachusetts produced about $1.2 billion of Safety's $1.28 billion of direct written premiums in 2025, roughly 94%.5 New Hampshire, which Safety entered in 2008, and Maine, which it entered in 2016, remain small, together contributing under $75 million.5 That concentration is a source of expertise. It is also a single weather system, a single regulator and a single claims environment. When a nor'easter hits Boston, it hits most of Safety's book at once. When Massachusetts body-shop labour rates rise, or when used-car prices push up the cost of total losses, there is no other state to offset it. Premium growth can be overwhelmed by claims frequency and severity, and Safety has nowhere to hide.
One more feature of the Massachusetts market deserves a moment, because it shows up in places investors rarely look. Massachusetts runs a residual market for drivers and businesses that cannot find coverage voluntarily, administered by Commonwealth Automobile Reinsurers, known as CAR. Insurers share in its results according to their market shares, and CAR assigns certain agents, called exclusive representative producers, to write commercial business through particular carriers.5 For Safety, the result is a striking concentration on the balance sheet. At the end of 2025, 95% of its reinsurance recoverables on paid and unpaid losses, the money it expects to collect from reinsurers, related to CAR.5 Safety's ordinary customers are a dispersed crowd of drivers and homeowners, so customer concentration is not the issue. Its exposure to a single state-run pool, by contrast, is large. Safety reports no expected credit loss on these recoverables, and a state program is not a typical counterparty, but the dependence is real: rule changes approved by the Commissioner can alter how the residual market operates, a risk Safety lists in its own cautionary statements.2
The agent network, then, explains how Safety reaches its customers and why it has held its ground. It does not by itself explain the surge of 2023 to 2025. For that, the story has to follow the price tag on each policy.
IV. Growth Came From Pricing—and Then the Policies Started to Slip
By 2025, Safety's top line looked like a growth stock's. Direct written premiums rose 7.2% to almost $1.28 billion, and the company said plainly why: the increase was "primarily driven by rate increases."5 The average premium written per policy rose 8.1% in private passenger auto, 4.6% in commercial auto and 9.7% in homeowners.5 Meanwhile, the number of things Safety insured went the other way. Total exposures, the count of cars, homes and other risks on the books, fell 1.1%.5
That is the premium bridge in one sentence: more money per policy, slightly fewer policies. It is worth pausing on why this happened, because the price increases were not greed. They were repair. Through 2022 and 2023, the cost of fixing and replacing cars rose sharply across the American auto insurance industry, as parts, labour and used-vehicle values climbed. Safety's own filings attribute its 2025 increase in losses to larger policy counts and to "current market conditions, specifically inflationary impacts" on its private passenger auto book.5 An insurer prices a policy for a year based on what it expects claims to cost; when costs jump after the price is set, the insurer loses money until the next renewal lets it catch up. The rate increases of 2024 and 2025 were Safety catching up.
Catching up has a predictable side effect. Every rate increase is a renewal-season test of loyalty. Some customers shrug and pay; others ask their agent to shop the policy elsewhere. In a market with Progressive and GEICO advertising relentlessly, the customers most likely to leave are often the ones with the best driving records, because they have the most options. The 1.1% decline in exposures in 2025 was modest, but it was a warning that price was beginning to do more of the work than volume.
Then came 2026, and the warning became a trend. In the first half, Safety's private passenger auto policy count fell 8.8% from a year earlier, and homeowners policies fell 4.0%, partly offset by a 2.7% rise in commercial auto policies.13 Direct written premiums for the second quarter fell 1.2%, and management attributed the decline "primarily" to "the cancellation of certain underperforming agency relationships."13 By the third quarter, the decline had deepened to 4.3%, and the explanation had widened: the decreases were due to "a softening, more competitive market, in addition to the cancellation of certain underperforming agency relationships."2 Across the first nine months, direct written premiums were down 1.8%.2
Look at the price-per-policy numbers in the same period and a second change appears. In private passenger auto, average written premium per policy rose only 2.0% over the first nine months of 2026, down from the 8.1% gain of 2025. Commercial auto rose 6.0% and homeowners 9.7%.2 The engine of Safety's largest line was slowing: auto prices were no longer rising fast enough to offset falling volumes. When both the number of cars and the price per car stop growing, premium growth has nowhere to come from.
The agency cancellations deserve careful handling, because they can be read in two opposite ways. On the generous reading, Safety looked at the agents whose books produced the worst loss ratios and cut them loose, accepting fewer policies in exchange for better ones. That is what disciplined underwriters are supposed to do after a bad loss year, and the improvement in second- and third-quarter combined ratios is consistent with it. On the skeptical reading, a softening market made it harder to keep business at the prices Safety needed, and "underperforming agency relationships" is a dignified description of shrinking. The two readings are not mutually exclusive. Safety has not disclosed how much premium the cancelled agencies wrote, what their loss ratios were, or how many of their customers stayed with Safety through other agents. Without those figures, the pruning remains a plausible story rather than a demonstrated one.
The most telling evidence comes from management's own forecast. When the board evaluated MAPFRE's approach in the spring of 2026, management prepared projections running through 2031. They showed gross premiums written of about $1.32 billion in 2026, rising to about $1.44 billion by 2031, growth of under 2% a year.3 After a two-year burst of rate-driven growth of more than a third, Safety's own planners expected the top line to settle back into a crawl. That is an honest forecast. It is also an admission that price increases, not a structurally larger franchise, explained the burst.
What would settle whether 2026 represents profitable pruning or lost momentum? Four pieces of evidence, all reported periodically. Renewal retention, which tells you whether existing customers are leaving. Policy counts by line, which tell you whether new business is replacing departures. Approved rate changes, which tell you how much pricing room remains. And claims-cost trends, frequency and severity, which tell you whether the prices already in force are adequate. If retention stabilises and the combined ratio holds below 100% without help, the cancellations will look wise. If policy counts keep falling as price increases fade, the franchise is shrinking. Which brings the story to the most important question of all: whether the underwriting is truly profitable, or whether it only looks that way.
V. The 2023 Loss Year Made the Recovery Look Dramatic
Every insurance story eventually comes down to one ratio, so it is worth explaining it plainly. Take every dollar of premium an insurer earns. Subtract what it pays, and expects to pay, for claims and the cost of handling them. Subtract the commissions, salaries and overhead of running the business. The combined ratio expresses those costs as a percentage of premium. Below 100%, the insurer makes money on underwriting before any investment income. Above 100%, it pays out more than it takes in and needs its investment portfolio to rescue the year.
Safety's combined ratio fell from 107.7% in 2023 to 99.0% in 2025.5 On its face, that is a clean turnaround: a seven-point underwriting loss became a one-point underwriting profit in two years, and the loss and expense ratios both improved as the rate increases earned through.5 The headline story writes itself. Prices rose, losses were brought under control, the recovery is real.
The fuller story begins with a quieter number. Each year, Safety's actuaries re-estimate what all the claims from prior years will ultimately cost. When those estimates fall, the reduction flows into the current year's income as "favorable prior-year development," often called a reserve release. Safety's prior-year reserves fell by $47.4 million in 2023, $51.9 million in 2024 and $44.6 million in 2025.5 Those releases are large relative to the underwriting result. In 2025, a 99.0% combined ratio on $1.139 billion of earned premium implies an underwriting profit of only about $11 million. The $44.6 million release was roughly four times that profit. Take the release out, and the 2025 combined ratio on business written for that year's accidents would have been roughly 103%. Apply the same arithmetic to 2024 and the ratio before releases was about 106%; for 2023, it was above 113%.
Those "accident-year" figures are estimates made on Safety's own first-pass reserving, and they carry their own story. Look at the reserve development table and something surprising emerges about 2023, the bad year. In 2024, Safety reduced its estimate of claims from accidents that occurred in 2023 by $23.7 million. In 2025, it reduced that estimate by another $11.7 million.5 In other words, 2023 was not quite as bad as it was first reported. Safety booked its losses conservatively in the year of pain, and then released part of that cushion into the following two years' earnings. The 2024 accident year has followed a similar path, with a $21.2 million reduction in 2025.5
This is the most important clue in the Safety story, and it cuts both ways. On one side, it is a sign of prudent reserving. An insurer that sets aside too much and releases it later is far safer than one that sets aside too little and must take charges later, and Safety's ten-year reserve tables show a long history of redundancy. AM Best cited "historically favorable reserve development" as one support for its strong balance-sheet assessment.14 On the other side, it means the dramatic shape of the recovery was partly an artefact of timing. Part of the 2023 loss and part of the 2024–25 recovery are the same dollars counted twice: once as a cost when reserved, once as a gain when released. The true improvement in underwriting was real but smaller than the swing from 107.7% to 99.0% suggests.
Safety itself warns against extrapolating. The 2025 annual report states that "it is not appropriate to extrapolate future favorable or unfavorable development of reserves from this past experience."5 The 2024 releases also included $8.6 million of development from the Massachusetts FAIR Plan, the state's insurer of last resort for property, which helps explain why the release shrank in 2025.5 And Deloitte, the auditor, gave a clean opinion but singled out the valuation of loss and loss-adjustment-expense reserves as a critical audit matter, the auditor's designation for areas that involve especially challenging, subjective or complex judgments.5 A clean opinion confirms the reserves were set by a reasonable process. It does not make the estimates certain.
Then comes a detail from the merger proxy that changes how to read the whole pattern. When management built its projections for the board in 2026, it included "an excess reserve release of $40.0 million" in 2026 earnings.3 The three-year version shared with potential bidders, including MAPFRE, excluded that release.3 Management, in other words, believed its reserves held about $40 million more than needed and planned to bring it into income during the year. That is a candid disclosure, and excluding it from the bidder version was the conservative choice. But it confirms that reserve releases were not happy surprises in Safety's planning. They were an expected part of the earnings stream. Of the $89.2 million of net income management projected for 2026, a pre-tax $40 million was expected to come from that release.3
The 2026 results so far fit that expectation. In the first nine months, Safety booked $31.3 million of favorable prior-year development, close to the $33.2 million of the prior year.2 Against that sits the winter. From January 23 to 26, a blizzard-strength nor'easter hit the Northeast; from February 22, a second storm brought up to 36 inches of snow and gusts above 80 miles per hour. Together they produced about 1,800 claims and $44.3 million of losses and loss-adjustment expenses for Safety.4 That is almost exactly the size of a full year's reserve release, wiped out in two storms.
Now reconcile the quarters. The second quarter's combined ratio was 95.7%, and management credited "underwriting discipline and ongoing pricing strategy."13 The third quarter's was 96.3%, credited to earlier rate increases earning in and lower accident frequency in private auto.2 Those are genuine improvements. But the third quarter included $10.1 million of favorable prior-year development; without it, the ratio would have been close to 100%.2 And the nine-month ratio of 101.7%, against 98.9% a year earlier, includes the winter.2 New England has winters every year. A combined ratio that looks healthy only in the quarters without snow is not yet a demonstrated new baseline.
AM Best's July 2026 rating action adds an independent voice to the same conclusion. The agency affirmed the operating subsidiaries' financial strength rating at A (Excellent) but moved the outlook to negative, explaining that loss-severity trends, weather and "the influence of new business" had affected underwriting results over the most recent five years and through the first half of 2026.14 Key operating metrics, it said, had "aligned closer to an assessment level of adequate in recent years," and while management had raised rates and added underwriting initiatives, results had "yet to reach the same level of comparative strength as observed in older years."14 A year earlier, AM Best had already trimmed a rating, citing weakening risk-adjusted capitalization as surplus fell while premiums, reserves and probable maximum loss grew.15
Weigh the evidence and the verdict is clear enough to state once. Safety's recovery is real: prices are now closer to adequate, and the expense ratio has benefited from a larger premium base. But the reported improvement overstates the underlying one, because favorable reserve development supported results in each of the last three years, and the current accident years, on Safety's own initial estimates, have not yet produced an underwriting profit on their own. The KPI that would settle it is the accident-year combined ratio excluding prior-year development, followed over two or three years to see whether those same years also release reserves later. Until then, a good part of Safety's profit depends on two things other than current underwriting: yesterday's reserves and today's investment portfolio.
VI. Float Helps the Insurer—but It Is Not Free Cash
In 2025, Safety reported $99.3 million of net income and $194.5 million of cash from operations.5 To a reader trained on industrial companies, that looks like a business that converts every dollar of profit into almost two dollars of cash, a sign of extraordinary quality. Over 2023 to 2025, operating cash flow totaled $375.3 million against $188.9 million of net income.5 Is Safety a cash machine?
Not in the way the numbers first suggest. An insurer is paid first and pays later. When a driver buys a policy in March, the premium arrives up front, but claims from that policy trickle in over the following months and, for injury cases, sometimes years. In between, the insurer holds the money. Warren Buffett made this concept famous as "float": money that belongs, in an economic sense, to future claimants, but which the insurer can invest in the meantime.
Safety's 2025 cash flow is float in action. The biggest contributors to the gap between profit and cash were a $90.1 million increase in loss reserves and a $34.9 million increase in unearned premiums.5 Both are liabilities. The first is money set aside for claims that have happened but not yet been paid; the second is premium received for coverage not yet provided. Operating cash flow rose because Safety's obligations rose alongside its growing book of business. That cash is real, and it earns real investment income, but it is not free. It is held against claims that will eventually come due, and the adequacy of those reserves remains uncertain.
The float is substantial. At the end of 2025, Safety held $1.688 billion of investments: $1.316 billion in fixed-maturity bonds, $221.0 million in equities and $151.0 million in other invested assets, largely limited partnerships and alternative investments.5 Compare that portfolio with the company's market value before the deal, roughly $1.06 billion at $72.50 a share, and the scale becomes clear: Safety held more invested assets than its entire stock market value.35 The investment portfolio is not a side business. For every dollar of shareholder equity, Safety was managing almost two dollars of investments.
So how much of Safety's profit comes from those investments? In 2025, net investment income, the interest and dividends the portfolio throws off, was $62.7 million, up 12.6% as the portfolio grew and maturing bonds were reinvested at higher yields.5 On top of that sat $18.0 million of realized investment gains, mostly from selling mutual funds, and $8.5 million of earnings from partnership investments.5 Pretax income was $126.7 million.5 Put the pieces together and the shape of Safety's earnings becomes plain. The reported underwriting contribution was small. Recurring investment income contributed more than five times that. Gains and partnership returns contributed more than twice the underwriting result.
That changes how to think about the 2026 results, too. In the first nine months of 2026, net investment income rose to $51.5 million, with an annualised yield of 4.1%, and the third quarter set a company record.2 Meanwhile, the change in unrealized gains on equity securities cut $15.3 million from pretax income in the first nine months, against a $13.2 million boost a year earlier.2 That swing of nearly $29 million between periods had nothing to do with insuring cars. It came from the stock market. Safety's management recognises the distinction by reporting a non-GAAP operating income figure that strips out realized gains, unrealized equity movements and credit-loss changes; in 2025, that figure was $84.7 million, against $99.3 million of net income.5
The portfolio's exposures are the ordinary ones of a regional insurer, but they are not trivial. Interest rates are the biggest. Safety's bond portfolio had a duration of 3.8 years at September 30, 2026, which means that a one-point rise in rates would knock roughly 3.8% off the bonds' market value.2 That is what happened through 2022 and 2023, and it explains much of the slide in book value. In 2026, falling bond prices pushed book value per share down to $58.29 at September 30, from $60.98 at the end of 2025.2 Unrealized losses on fixed maturities were $21.7 million at the end of 2025, and Safety attributed none of them to credit problems.5 Equity prices are the second exposure, because equities flow through net income. Alternative investments are the third, because their returns are lumpy and their valuations arrive with a lag. Safety says it does not use derivatives for speculation.5
Here is the verdict. The investment portfolio makes Safety's earnings steadier than its underwriting alone, and higher interest rates have made the float far more valuable than it was through the low-rate 2010s. That is a genuine tailwind, and it explains why a regional insurer with a thin underwriting margin still earned close to $100 million in 2025. But it shifts the source of profit toward the bond and stock markets and away from the core skill the company claims, which is selecting and pricing risk. A recovery that rests on investment income and reserve releases depends on conditions management cannot control. What is in management's control is how it allocates the capital that results, and that is the record to test next.
VII. Murphy’s Record: Stable Strategy, Cyclical Results
He has been employed by Safety's insurance subsidiaries for more than 37 years, served as vice president of marketing from October 2005, and became president and chief executive on April 1, 2016.9 He joined the board in February 2016, chairs its investment committee, and became chairman of the board in March 2023.9 He holds the CPCU designation, the professional credential for property-casualty underwriters, and sits on the board of trustees of the Insurance Library Association of Boston.9 His background, in other words, is the agent side of the business. Before he ran Safety, his job was to keep the independent agents happy.
His finance chief has a similarly homegrown profile. Christopher Whitford became chief financial officer, vice president and secretary on March 2, 2020, after serving as Safety's controller since 2012; a Massachusetts CPA, he began his career at PricewaterhouseCoopers in 2005.9 He also serves on the board of the Massachusetts FAIR Plan, whose development figures surfaced in Safety's reserve releases.95 Murphy and Whitford have run the company together through the pandemic, the inflation shock, the 2023 loss year, the recovery and the sale. There has been no turnover at the top, and most of the other executive officers have spent two decades or more at Safety.9
Continuity like that cuts both ways. It means deep knowledge of the Massachusetts market, of the agents, and of the regulators, which is precisely what a niche regional insurer needs. It also means the people who lived through the 2023 losses are the same people who designed the recovery and are now selling the company. There is no outside perspective in the corner office, and the board, while independent apart from Murphy, is chaired by the chief executive.39
The pay record offers a useful window into how the board measured him. Murphy's total compensation was about $1.96 million in 2023, $3.68 million in 2024 and $4.19 million in 2025.9 The swing came almost entirely from the annual cash incentive. In 2023, the bad year, he received none. In 2024, he received $1.39 million; in 2025, $1.48 million, plus $1.1 million of stock awards.9 That is the right direction: pay fell to the floor when results collapsed. But the metric behind the cash incentive deserves a look. The 2025 bonus was based on earnings before interest, taxes, unrealized equity gains and credit-loss expense, and actual performance of $127.8 million was 139% of a $91.7 million target.9 That metric includes the reserve releases. Strip out the $44.6 million of favorable development, and the measured result would have fallen below target. To be fair, the compensation committee raised the bar for 2025 with a target well above the $53.3 million its old method would have produced.9 Still, a bonus metric that rewards reserve releases pays executives for estimates made in earlier years.
The long-term equity awards tell a more demanding story. Performance shares granted in 2023 depended 60% on Safety's three-year average combined ratio and 40% on total shareholder return relative to peers, with a combined-ratio threshold of 100.2%.9 Safety's actual average combined ratio over 2023–25 was about 102.6%, above the threshold, which implies that the combined-ratio component would have paid nothing. A design that withholds pay for an underwriting shortfall is a credible design. The proxy even carries a sentence, apparently left over from an earlier year, stating that 2025 annual incentive results were below threshold and produced no payout, which contradicts its own tables; it is a small editing lapse, but in a document about pay, precision matters.9
Ownership is modest. Murphy owned about 0.8% of the shares, and all fourteen directors and executive officers together owned about 2.2%.9 There is no controlling shareholder. The largest named holders in the 2025 proxy were BlackRock with 14.5%, SRB Corporation with 12.5% and Vanguard with 11.2%.9 Management, in other words, has meaningful but not decisive skin in the game, and the shareholder base is the kind of dispersed institutional register that approved the sale.
Capital allocation has followed the pattern of a mature insurer that sees few places to invest. Safety paid $3.64 a share in dividends in 2025, and kept the quarterly dividend at $0.92 through 2026.52 At the pre-deal price of $72.50, that annual dividend represented a yield of about 5%. It has run a share repurchase program since 2007 with up to $200 million authorised, and by the end of 2025 had bought back about 3.5 million shares for about $175 million.5 In the fourth quarter of 2025, it repurchased 262,370 shares for $20.0 million at prices around $76.5 It also borrowed $50 million under its credit facility with Citizens Bank in 2025, and in June 2026 the facility was amended to raise the commitment to $100 million and extend its maturity to June 2031.4
Put those together and a tension appears. In the same year that AM Best was worrying about capital strain from growth and weather, Safety was returning more than $70 million to shareholders through dividends and buybacks while taking on debt. AM Best itself noted that the subsidiaries' surplus levels "are influenced by annual dividends to the parent company to pay a shareholder dividend."14 The debt is small, and Safety remained in compliance with covenants requiring minimum risk-based capital and statutory surplus.4 But a skeptical investor would ask why a company with a negative outlook on its ratings was borrowing in order, in effect, to keep paying a large dividend and buying back stock.
On acquisitions, the record is short. Safety's merger proxy says that when management engaged with other insurers over the years, it "principally evaluated potential acquisitions of other businesses."3 What it actually bought was small. Safety carries about $17 million of goodwill tied to an agency business, a distribution investment, not a carrier acquisition.5 There is no disclosed history of large insurer acquisitions to judge, and therefore no evidence either of discipline or of failure in that arena. Safety's expansion beyond Massachusetts was organic and slow: New Hampshire in 2008, Maine in 2016, and a fourth insurance subsidiary, Safety Northeast, formed in 2020.5
The final window into management credibility is how the story is told. In its written quarterly releases, management's framing has shifted in ways worth noting. The second-quarter release attributed the premium decline "primarily" to the agency cancellations.13 The third-quarter release added a "softening, more competitive market."2 Both releases led with improved combined ratios; neither chief executive quotation mentioned the reserve releases that contributed to them, which appear further down in the text.132 None of that is misleading. Every figure is disclosed. But the emphasis is on the improving quarter, not on the nine-month decline or the accident-year picture. Murphy's record, then, is one of consistent strategy and candid disclosure, delivering cyclical results that track the market more than they defy it. Which is exactly the kind of record that makes a sale look attractive to a board. The question is whether it looked equally attractive to the buyer.
VIII. MAPFRE’s Offer Puts a Price on the Franchise
The courtship began over a meeting in Boston. On January 7, 2026, Jaime Tamayo, the president and chief executive of MAPFRE's U.S. business, met George Murphy at Tamayo's invitation and told him MAPFRE was interested in exploring an acquisition of Safety. No price was discussed, and Murphy replied that Safety was focused on its standalone plan.3 Less than a month later, Murphy and Whitford travelled to Hartford, where Tamayo, MAPFRE's U.S. finance chief Jesus Amadori and operating chief Daniel Olohan presented the case for combining the two companies.3 Two other regional insurers were circling at the same time. One chief executive met Murphy twice in January and February to express general interest; another reached out in March to renew interest it had shown years earlier.3
On March 20, 2026, Tamayo put a number on paper: $103 a share in cash, unsolicited and non-binding, backed by a letter from Deutsche Bank expressing high confidence that it could arrange financing.3 That day, Safety's stock closed at $71.46.3 The offer was already a premium of more than 40%, made at a moment when Safety's first-quarter storm losses had not yet been reported.
What followed was a textbook small-company sale process, and the proxy narrates it in unusual detail. The board hired Jefferies as financial adviser and DLA Piper as legal counsel, and authorised outreach to four other potential buyers.3 One declined. One never responded. One, the insurer that had expressed interest years earlier, said on June 30 that it would not bid.3 Only one rival, which the proxy calls Party C, actually made an offer: $85.13 a share on June 10, then a range of $90 to $94 on June 16.3 Jefferies told Party C that it would need to exceed $100 to be competitive; on June 25, Party C said it would not raise its range, and was cut off from the data room.3
MAPFRE, meanwhile, inched up. It reaffirmed $103 in early June, raised to $103.85 on June 9, and then, asked for its best and final offer, moved to $105 on June 17.3 The board judged that $105 was the highest price MAPFRE was willing to pay, and the merger agreement was signed on July 23, 2026.3 The negotiations had raised the price by about 2% from the opening bid. The real premium had been there from the first letter.
The terms reflect a buyer that wanted certainty. MAPFRE's Spanish parent committed to fund up to $1.567 billion with no financing condition.3 Safety must pay a $46.2 million break fee if it walks away for a better offer, about 3% of the price, while MAPFRE must pay $111.8 million in certain circumstances where the deal fails.3 Jefferies' fee was about $17.5 million, most of it payable only if the deal closes.3 Safety's directors and executive officers signed agreements to vote their shares in favour.3
The people negotiating also had something at stake, which is where the November dissent came from. MAPFRE's opening letter said it held Murphy and his team in high regard and intended to use Safety's talent, but it made no offer of jobs or retention, and the proxy says no such discussions had taken place by then.3 Retention term sheets for the remaining senior managers arrived only on July 21, two days before signing.3 Under their employment agreements, Murphy and Whitford are entitled to change-of-control payments; at the end of 2025, Murphy's lump sum alone, three times salary plus bonus, would have been about $6.7 million, and the proxy expects both men to receive payments large enough to trigger the federal excise tax on so-called golden parachutes.93 None of that is unusual for a sale of this size. It does explain why almost one in five votes cast went against the merger-related pay, even as the merger itself passed almost unanimously.1
Now to what Safety's shareholders will receive and what disappears. They will receive $105 in cash for each share, a taxable sale, and an end to the uncertainty about the next winter and the next reserve study.3 What disappears if the transaction closes is Safety as a public company: its listing, its quarterly disclosure and its independent record of capital allocation. Safety would become a wholly owned subsidiary of MAPFRE U.S.A. Corp., the Webster, Massachusetts–based U.S. arm of a multinational insurance group headquartered in Spain.3 From that point on, Safety's growth, pricing and capital decisions would belong to MAPFRE.
How rich is the price? The transparent calculation is simple. At $105, MAPFRE is paying about 15.6 times Safety's 2025 earnings per share of $6.72 and about 1.7 times its year-end 2025 book value of $60.98 a share.5 Against the lower book value of $58.29 at September 30, the multiple is about 1.8 times.2 Spanish analysts who reviewed the deal in August argued that the multiple of 2025 earnings implied by the price was above the 11-to-13-times range typical of U.S. non-life insurers.16 Jefferies' own fairness analysis supplies a sharper benchmark. Eight publicly traded peers, from Progressive and Allstate to Mercury General and Donegal, traded at a median of about 10 times their estimated 2027 earnings; applying a range of 8.5 to 12 times to Safety's forecast 2027 earnings produced values of only about $58 to $82 a share.3 It was book-value multiples, from peers and from past insurance takeovers, and a dividend discount model that could stretch to $105 and beyond.3 On earnings, Safety's sale price is well above where similar insurers trade. On balance-sheet value, it sits at the top of the range.
Those comparisons are context, not a clean appraisal, because what a buyer can earn from Safety is not what Safety could earn alone. MAPFRE's strategic case, as its finance chief José Luis Jiménez explained it, is that the deal is "strategic for growth, financially optimal and helps raise ROE."16 MAPFRE expects $30 million a year of cost synergies from the third year, more than a 5% boost to group net profit, and at least $140 million of solvency capital freed by optimising Safety's reinsurance.16 It is MAPFRE's second-largest acquisition ever, after the 2008 purchase of Commerce Insurance, the Massachusetts insurer that is the root of MAPFRE's leading position in the state.16 Combined with Safety, MAPFRE would write about a quarter of the Massachusetts private auto market and become the region's largest writer of homeowners and commercial auto insurance.16
There is a logic here that a stand-alone Safety could never replicate. A reinsurance program priced for a regional carrier's concentration looks different inside a global group with Spanish, Brazilian and reinsurance operations. Back-office costs can be shared. And MAPFRE knows the Massachusetts market better than almost any outsider, because through Commerce it has been the market leader for nearly two decades.
The skeptic's counterpoint arrived as soon as the deal was announced. Safety's shares rose 41% while MAPFRE's fell almost 5%.16 A Banco Sabadell analyst asked whether, after years of price increases, MAPFRE might be "buying Safety at the peak of the insurance pricing cycle."16 A Bestinver analyst noted that MAPFRE aimed to stabilise Safety's combined ratio at 97%, worse than the 95% to 96% expected for MAPFRE's existing U.S. business, meaning MAPFRE was buying a less profitable book than the one it already owned.16 And MAPFRE agreed to its price before seeing what the next nine months would bring: an agency pruning, falling policy counts and a nine-month combined ratio above 100%.
The transaction is the major capital event in Safety's history as a listed company, bigger than any buyback or dividend decision. It also happens to be the one capital decision in which Safety's board extracted the full value of the franchise from somebody else. Until the Massachusetts Commissioner of Insurance signs off, however, MAPFRE's synergy targets are plans, not results. The lessons from Safety's story are about what this price did and did not prove.
IX. Business & Investing Lessons
Put three moments side by side: the underwriting loss in 2023, its apparent recovery by 2025, and a combined ratio above 100% again in the first nine months of 2026. Across 2023 to 2025, reserve releases totalled about $144 million.5 Each fact teaches something specific about owning a regional insurer through a cycle.
The first lesson: a higher premium is not the same as a larger franchise. Safety's premium growth came alongside falling policy counts, which were down almost 9% in private auto by the first half of 2026.513 For founders and investors anywhere, the deeper point is that revenue per customer and number of customers are different engines, and a business that is running on the first while the second sputters is borrowing against its future.
The second lesson: float is borrowed patience. Safety's float generated substantial cash and supported an investment portfolio larger than its pre-deal market value.53 That money is real, it earns real income, and it rescued years in which underwriting barely broke even. But it is held on behalf of drivers whose claims have not yet been paid. The patience is lent by policyholders, and it must be repaid in full. Investors who treat an insurer's operating cash flow as free cash are counting the deposit as revenue.
The third lesson: a reserve release is a verdict on yesterday, not proof about tomorrow. Safety's reserve releases show that earlier claims estimates were conservative, but do not prove current underwriting has recovered.5 Management's forecast also included another $40 million release in 2026.3 Releases are what a conservative reserver earns later for caution earlier, and Safety has a long record of them. But their size and timing are estimates, and an underwriting recovery measured with them flatters the present at the expense of an honest picture of it.
The fourth lesson: a sale price can validate a franchise and still test the buyer's discipline. MAPFRE and one rival made offers for Safety, and MAPFRE paid a substantial premium for a company whose public shares had drifted for years.53 That is real evidence that the agent network, the Massachusetts expertise and the commercial auto leadership have value, more value to an operator than to the stock market. It is not evidence that Safety's earning power is higher than the market thought. The seller locked in the gain. The buyer took on the burden of proving it.
X. Analysis & Bear vs. Bull Case
Imagine a scorecard with two lines. On the first, Safety's 2025 combined ratio: 99.0%, below the line, a profit.5 On the second, the first nine months of 2026: 101.7%, above it, a loss.2 Everything in the investment case for Safety as a stand-alone insurer comes down to which of those lines is closer to normal. And the question still matters, because the deal could be delayed or blocked, and because the same evidence will decide whether MAPFRE's price looks wise in hindsight.
The bull case, in its strongest form, runs as follows. Safety owns a durable franchise in a market most national carriers cannot easily replicate. It is the largest commercial auto writer in Massachusetts, the fourth-largest private auto writer and the third-largest homeowners carrier, with relationships with close to 800 independent agents that took decades to build.5 It has pushed through substantial rate increases, and their effect is still earning into revenue. Its reserves have proved conservative year after year, which suggests a cushion rather than a hole. Its $1.7 billion portfolio, reinvested at higher yields, generated $62.7 million of investment income in 2025, and the third quarter of 2026 set a quarterly record.52 And a sophisticated strategic buyer that knows the market better than anyone examined the books and paid a large premium.
The bear case deserves equal weight. Safety's market share in its core product has slipped from 10.4% at the IPO to 9.4% today, with larger and better-capitalised rivals such as MAPFRE, Progressive and GEICO ahead.611 Exposures fell in 2025 and policy counts dropped sharply in 2026. Every year from 2023 to 2025, favorable reserve development supplied a large share of the underwriting result, and on its own initial estimates Safety has not posted an accident-year underwriting profit in that period. Weather is getting more expensive, as the two winter storms showed. AM Best has put its ratings on negative outlook. And the company has been paying out more than $70 million a year to shareholders while borrowing.
Porter's five forces help explain why the bear case has teeth. Buyer power is real: customers face low switching costs at each renewal, and agents, who represent several carriers, can move them in bulk. The threat of substitutes is low in the sense that drivers must buy insurance by law, but the threat from direct writers is high, because GEICO and Progressive sell the same product without the agent. Supplier power shows up in two places: in the auto-repair industry, whose labour and parts costs drive claims severity, and in the reinsurance market, which sets the price of protection against catastrophe. Rivalry is intense and, since 2008, increasingly price-based. And the regulator, which approves rates, acts like a sixth force: it limits how quickly an insurer can respond when claims costs jump, so margins erode between the moment costs rise and the moment rates catch up.
Hamilton Helmer's seven powers clarify what Safety does and does not have. It has no network effects and little scale economy, since it is a fraction of the size of its national rivals. Switching costs are low. Brand matters mostly through agents, not consumers. The closest Safety comes to a power is what Helmer calls a cornered resource, its accumulated agent relationships and four decades of Massachusetts claims data, combined with a modest form of counter-positioning: national direct writers cannot embrace independent agents without undermining their own model. Those are real, but they are defensive powers. They explain why Safety has held about a tenth of the market for twenty-five years. They do not explain how it could take more.
Technology is a footnote, not a thesis. Safety describes investments in robotic process automation, artificial intelligence, machine learning and predictive models to improve efficiency, and it flags the risks of generative AI.5 The filings do not tie these projects to measurable revenue, cost savings or loss-ratio improvement. If they work, they will show up in the expense ratio and in claims handling, not as a separate business. Until then, they are best viewed as table stakes in an industry where pricing and claims analytics are being automated everywhere.
Three numbers, tracked over time, would tell an investor almost everything about whether Safety's recovery is durable. The first is the accident-year combined ratio excluding prior-year reserve development. Safety does not report it directly, but it can be estimated from the reported ratio and the disclosed releases; by that estimate, it was roughly 103% in 2025, after about 106% in 2024. The direction is improving, but the level is still above 100%. The second is renewal retention and net exposures by line. Exposures fell 1.1% in 2025, and private auto policies were down almost 9% in the first half of 2026; the direction is down.513 The third is recurring net investment income relative to underwriting profit. In 2025, investment income was more than five times the reported underwriting profit, and it is still rising.52 An insurer whose investment income dwarfs its underwriting is, in practice, a bond portfolio with a claims department attached.
A skeptical investor would put management's thesis to one simple test. If the case is disciplined underwriting, can the next phase of growth add policies without giving back price or capital? Safety's own projections answer cautiously: they foresaw premium growth of less than 2% a year through 2031, and they counted on a $40 million reserve release to deliver the 2026 profit.3 That is not a growth story. It is a stable regional franchise earning a modest return on a large float, worth more inside a larger group than on its own. The evidence supports the franchise. It does not yet support a widening moat or a stable earnings base. If the deal closes, those tests move inside MAPFRE, where public investors will see only what MAPFRE chooses to disclose.
XI. Epilogue
Tonight, Safety stands at the edge of its last winter as a public company, or perhaps its first winter as a target that never quite left. The shareholders voted. The antitrust clock ran out. The Massachusetts Commissioner of Insurance holds the Form A filing that MAPFRE submitted in August.34 Somewhere in Boston, Safety's actuaries are preparing year-end reserve estimates, and somewhere in New England, a meteorologist is watching the jet stream.
Three things will decide how this chapter ends. The first is the fourth-quarter result, which will arrive in early 2027. Management's projections assumed $89.2 million of 2026 net income, including that $40 million pre-tax reserve release.3 After nine months, Safety earned $50.2 million.2 To reach the plan, the fourth quarter would need close to $39 million, more than any quarter so far in 2026. A strong quarter would tell part of the story. The more revealing number will be the split between current accident-year underwriting and the reserve release, because a fourth quarter carried by releases would confirm the pattern of the past three years rather than break it.
The second is the policy count. After the agency cancellations, renewals and new business through the winter will show whether Safety's book is stabilising at a smaller, more profitable size or continuing to shrink. If private auto policy counts keep falling while rate increases slow, the 2025 premium surge will look like a peak. If counts steady and the combined ratio holds below 100% without help from reserves, the pruning will look like discipline. Those same measures will decide which.
The winter itself is the wild card, and Safety's reinsurance program shows why. For 2026, Safety bought three layers of catastrophe reinsurance covering property losses above $80 million, up to a ceiling of $850 million, with reinsurers taking 85% to 90% of each layer.5 That protects the company against a hurricane or a historic storm. It does nothing for the more ordinary disaster. The two storms of early 2026 cost about $44 million, well below the point where reinsurance would have paid a cent, so every dollar came out of Safety's own earnings.4 A repeat this winter would land the same way, on the balance sheet that MAPFRE has agreed to buy at a fixed price.
The third is closing. MAPFRE and Safety expect to complete the deal in the first quarter of 2027.3 If regulators approve on schedule, Safety's shareholders will receive their $105, and every question about this winter's claims will belong to MAPFRE. If approval is delayed or comes with conditions, Safety will remain exposed, and its stock, which traded at $103.42 in September, close to the deal price, will price the risk of failure.3 Safety itself has warned that its share price could fall significantly if the merger is not completed.2
That leaves the central tension unresolved. The sale has fixed a price for the franchise. The franchise's earnings, stripped of old reserves and favorable markets, have not yet proved that the price was earned.
XII. Outro
Go back to the driver in Worcester, calling the agent on Main Street because her renewal came in higher than last year. She does not know that old reserve releases helped the recent recovery, or that a bank in Madrid is waiting on a Massachusetts regulator. She knows that her agent has placed her with Safety for years, and that the price went up again.
That relationship is what Safety built across four and a half decades: trust with independent agents. On November 3, the shareholders named their price for it. Whether it was worth $105 a share will be decided not in Boston's boardrooms, and not in Madrid, but in the claims that arrive from the next nor'easter, and in whether that driver renews.
References
-
Form 8-K, Special Meeting Vote Results — Safety Insurance Group, Inc., 2026-11-03 ↩↩↩
-
Safety Insurance Group Announces Third Quarter 2026 Results — Safety Insurance Group, Inc., 2026-11-04 ↩↩↩↩↩↩↩↩↩↩↩↩↩↩↩↩↩↩↩↩↩↩↩↩
-
Definitive Merger Proxy Statement (DEFM14A) — Safety Insurance Group, Inc., 2026-09-14 ↩↩↩↩↩↩↩↩↩↩↩↩↩↩↩↩↩↩↩↩↩↩↩↩↩↩↩↩↩↩↩↩↩↩↩↩↩↩↩↩↩
-
Form 10-Q for the Quarter Ended September 30, 2026 — Safety Insurance Group, Inc., 2026-11-06 ↩↩↩↩↩↩
-
Form 10-K for the Year Ended December 31, 2025 — Safety Insurance Group, Inc., 2026-02-27 ↩↩↩↩↩↩↩↩↩↩↩↩↩↩↩↩↩↩↩↩↩↩↩↩↩↩↩↩↩↩↩↩↩↩↩↩↩↩↩↩↩↩↩↩↩↩↩↩↩↩↩↩↩↩↩↩↩↩
-
Form S-1 Registration Statement — Safety Holdings, Inc., 2002-04-26 ↩↩↩↩↩↩↩↩↩↩↩↩↩↩
-
Form S-1/A Amended Registration Statement — Safety Insurance Group, Inc., 2002-11-07 ↩↩
-
2002 Year-End Results — Safety Insurance Group, Inc., 2003-03-25 ↩
-
2026 Proxy Statement (DEF 14A) — Safety Insurance Group, Inc., 2026-04-01 ↩↩↩↩↩↩↩↩↩↩↩↩↩↩↩↩↩↩↩
-
2025 Massachusetts Private Passenger Auto Market Share — Commonwealth Automobile Reinsurers ↩↩↩
-
Safety Insurance Group Announces Second Quarter 2026 Results — Safety Insurance Group, Inc., 2026-08-05 ↩↩↩↩↩↩↩
-
AM Best Revises Outlooks to Negative for Safety Insurance Group, Inc. and Its Key Subsidiaries — AM Best, 2026-07-15 ↩↩↩↩
-
AM Best Downgrades Issuer Credit Rating of Safety Insurance Group — AM Best, 2025-06-20 ↩
-
Mapfre sale de compras para acelerar su expansión en Estados Unidos — El País, 2026-08-11 ↩↩↩↩↩↩↩↩
 LinkedIn
 WhatsApp
 Reddit
 Hacker News
 Email
 Kindle
 RSS Feed
 Spotify
 Apple Podcasts
 Amazon Music
 Audible
 YouTube