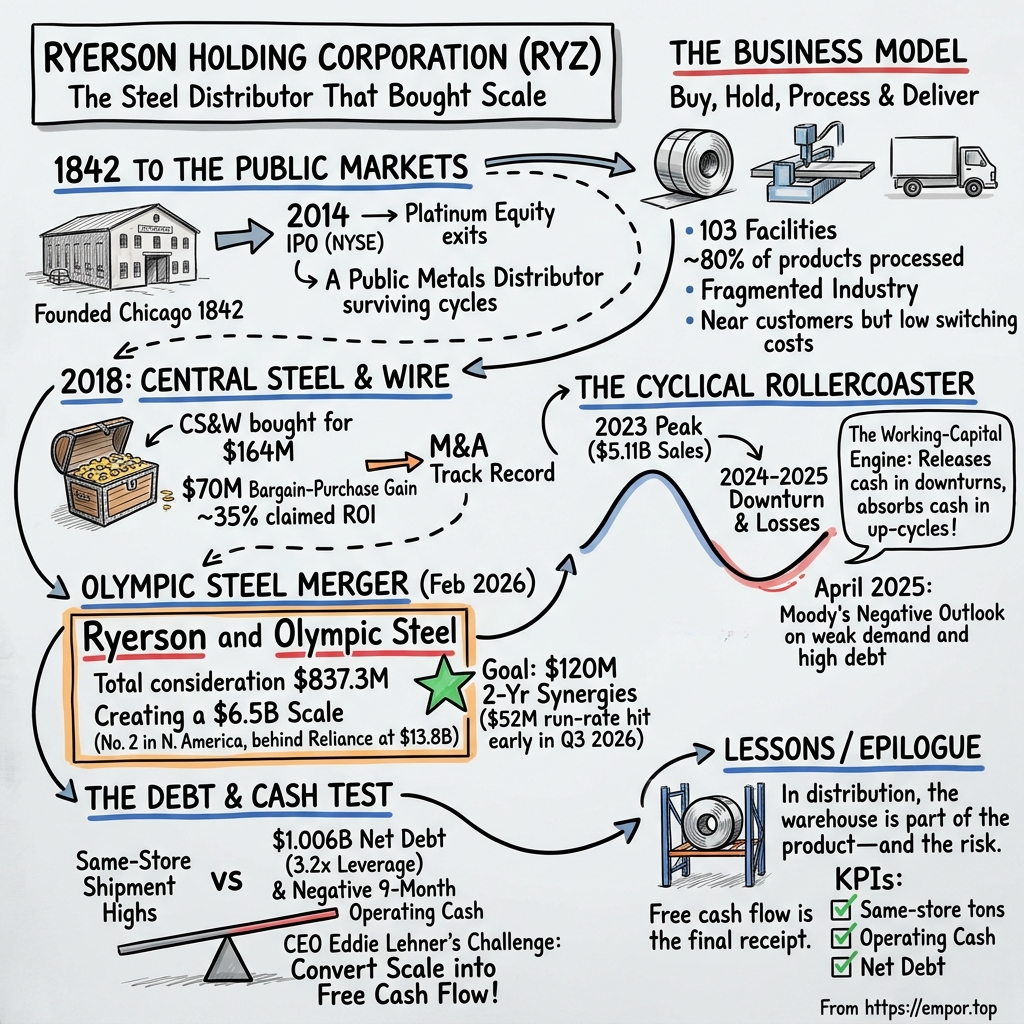
Ryerson Holding Corporation: The Steel Distributor That Bought Scale
I. A $6.5 Billion Company Still Has to Prove It Can Make Cash
On October 28, 2026, Ryerson Holding Corporation told investors something no one in the metals service-center business gets to say very often. The company said its same-store shipments, the tons moved through the facilities it had owned all along, had just reached their highest quarterly level in more than five years.1 Revenue for the third quarter came to about $2.18 billion, roughly half again what the old Ryerson used to book in a quarter.12 Management also reported that the merger with Olympic Steel, closed only eight months earlier, had already reached an annualized synergy run-rate of about $52 million, comfortably ahead of the $40 million it had promised for the first full year.12
It was the kind of quarter that a management team frames and hangs on the wall. And yet the same set of filings carried a second, quieter number. Over the first nine months of 2026, Ryerson had earned $53.5 million of net income and still consumed $176 million of cash in its operations.3 Net debt stood at about $966 million at the end of September, and it had risen by $53 million during the quarter as working capital grew.2 The company had become bigger, busier and, by its own account, better run. What it had not yet shown was that being bigger would make it a stronger generator of cash for each share outstanding.
That gap between the operating story and the cash story is what this episode is about. Ryerson is a metals service center: a business that buys steel, aluminum and stainless from mills, holds it in warehouses near customers, cuts and shapes it to order, and delivers it on short notice. It is not glamorous. It does not own a patent that matters, and its customers can, and often do, buy from more than one supplier. But it occupies a strategic middle in American industry, between giant mills that want to sell in bulk and thousands of fabricators and manufacturers who want exactly the right piece, exactly when they need it.
In February 2026 Ryerson made the largest bet of its public life. It combined with Olympic Steel, the Cleveland-based service center, in an all-stock merger that gave the combined company pro forma 2024 revenue of about $6.5 billion.43 On the company's own comparison of selected North American peers, that made it the second-largest service center by revenue, behind only Reliance.4 Scale was the point. The pitch was that a bigger network could share inventory, buy metal more cheaply, run its plants fuller and serve customers that neither company could serve as well alone.
Three questions will carry the story from here. The first is what makes a metals service center hard to replace at all, given that customers can call a competitor tomorrow. The second is whether the price Ryerson paid for Olympic, in shares and in added debt, leaves room for a return above the cost of that capital. The third is the one the October quarter put on the table: can a management team that has just delivered its strongest operating quarter in years convert that performance into cash, lower leverage and a better outcome per share?
One boundary needs drawing before the story begins. Olympic's results flow into Ryerson's statements only from February 13, 2026, the day the deal closed.3 So when the combined company reports that 2026 revenue is far above 2025, most of that difference is purchase, not growth. Management's own same-store disclosures try to separate the two, and the honest reading of Ryerson's year has to do the same. A bigger number arrived. Whether it is a better number is still being decided.
To see why that question is so hard for this particular company, it helps to go back a long way: to a Chicago merchant who started selling iron before the Civil War, and to the private-equity owner that, more than a century and a half later, took the business public.
 Subscribe on LinkedIn
II. From 1842 to the Public Markets
Ryerson traces its roots to Chicago in 1842, when the city was still a young lakeside settlement a few years past incorporation.5 For most of the next century and a half, the name stayed on the door while the ownership above it kept changing. The business grew into one of the country's best-known metal distributors, passed through corporate parents and public listings, and in 2007 was acquired by Platinum Equity, the Los Angeles private-equity firm.5 That long history matters less for its romance than for its lesson. Ryerson has always been a merchant. It has never been in control of the price of the thing it sells.
Platinum's era was one of financial engineering in a cyclical business. The firm bought Ryerson on the eve of the financial crisis, with substantial debt, and owned it through the collapse in steel demand that followed. By the time Platinum brought Ryerson back to the public market, the company was still carrying that debt, and the IPO was designed partly to lighten it.
In August 2014, Ryerson priced its initial public offering on the New York Stock Exchange: 11 million shares at $11 each.65 The proceeds did two things. Most went toward redeeming debt and paying the premiums that came with it. Part went to Platinum's affiliates, which received $25 million to terminate an advisory-services agreement under which Ryerson had been paying its owner for advice; $15 million came out of the IPO proceeds, with the remaining $10 million still owed at year-end.5 It was a standard private-equity exit fee, and a reminder of who held the pen at the moment of listing.
The public Ryerson of 2014 was not a profitable one. That year, sales were about $3.6 billion and the company lost $26.2 million.5 Platinum still owned roughly two-thirds of the shares after the IPO, and for years afterward Ryerson was, in practical terms, a listed vehicle whose strategic direction ran through its sponsor.5
That changed slowly and then all at once. Platinum sold down over the following decade until it held 12.2% at the end of 2025.7 In the third quarter of 2026, it sold another 2 million shares, and its stake fell to 3.7%.3 By then, the shareholders of Olympic Steel, who received Ryerson shares in the merger, collectively owned a far larger slice of the company than its former sponsor. The Ryerson of late 2026 is a public metals distributor with dispersed owners, not a sponsor's portfolio company with a ticker.
What did a dozen years of public life deliver? The answer is sobering for anyone hoping to find a compounding machine. Sales rose from about $3.6 billion in 2014 to $4.57 billion in 2025, an increase of roughly a quarter over eleven years, much of it explained by metal prices rather than a fundamentally larger business.57 Along the way, sales peaked at $5.11 billion in 2023, and the company earned $145.7 million that year.7 Then they fell back. In 2025, Ryerson lost $56.4 million attributable to its shareholders, a deeper loss than in the year of its IPO.7
That is the honest frame for the decade: survival and adaptation through cycles, not smooth compounding. The IPO turned Ryerson into an investable public company and gave it a path out of sponsor control. It did not remove the commodity cycle from its results, and it could not. The cycle is built into what Ryerson does every day, which is why the next question is the essential one. What, exactly, is a customer paying Ryerson for?
III. The Customer Needs the Metal Cut, Sized, and There on Time
Picture a manufacturer of agricultural equipment somewhere in the Midwest. A production line needs a particular grade of steel plate, cut to a shape the mill does not sell, by Thursday. The mill will happily sell this customer a truckload of plate, eventually, in standard dimensions, at a lead time measured in weeks. What the manufacturer actually needs is a few tons, cut, sized and delivered to a specific dock this week, with paperwork that proves the grade. That gap between what a mill sells and what a factory needs is the entire reason Ryerson exists.
The business works like this. Ryerson buys metal in bulk from producers, mostly carbon steel, aluminum and stainless. It holds that metal as inventory in a network of facilities, more than a hundred of them at the end of 2025, staffed by about 4,300 people before the Olympic merger.7 When an order arrives, it processes the metal: cutting, slitting, sawing, laser- and plasma-cutting, bending, sometimes light fabrication. Nearly 80% of what Ryerson sells has been processed in some way before it ships.7 Then it delivers, often on its own trucks, often within days.
Revenue, then, is simple arithmetic: tons shipped times the price per ton. The complications live inside that price. Metal prices move with mill pricing, scrap, tariffs, imports and global demand, and Ryerson's selling prices move with them. Its margin is the spread between what it charges and what the metal cost it, plus whatever premium it can earn for the processing and the speed. The trouble is timing. When mill prices rise, Ryerson's inventory, bought earlier at lower cost, briefly becomes more valuable and margins can widen. When prices fall, customers expect lower prices immediately while the warehouse is still full of metal bought at yesterday's cost. Ryerson's reported margins swing with this lag, and its accounting adds another layer, because it values much of its inventory on a LIFO basis that pushes recent cost changes through the income statement quickly. That is why management so often talks about results "excluding LIFO".7
LIFO deserves a plain-English translation, because it shapes almost every result Ryerson reports. Think of a pile of steel in which new metal is always stacked on top. Under "last in, first out" accounting, each sale is treated as if it came from the top of the pile, the most recently bought and therefore most recently priced metal. When mill prices are rising, that top layer is expensive, so reported cost of sales jumps and profit shrinks, even though the steel physically shipped may have been bought months earlier at a lower price. When prices fall, the effect reverses and flatters profit. In the third quarter of 2026, as carbon-steel prices climbed, Ryerson recorded a $30 million LIFO charge, almost twice what it had guided.2 Nothing about the business had broken; the accounting was simply marking the pile to a higher price. That is why investors in this industry learn to read every result twice, once with LIFO and once without, and to ask which version better describes the cash the company will actually collect.
Customers buy in two ways. Many smaller buyers place orders as needed. Larger customers often buy through programs: agreements, usually covering three to twelve months, that set prices or tie them to an index, with specific releases sent just in time or up to a month ahead.7 It is tempting to read those programs as recurring revenue. They are not. Nothing in them resembles a subscription or a multi-year lock-in, and Ryerson does not disclose any measure of how many program customers renew. A customer that dislikes the service can move its next program to a competitor, and many customers split their buying among several service centers on purpose.
The customer base is broad. In 2025, no single customer, including subcontractors, accounted for more than 6% of sales, and the top ten together accounted for only about 15%.7 About 90% of 2025 sales came from U.S. operations, with the rest from Canada, Mexico and a small presence in China.7 That diversity is a real strength in one sense: no single factory closure can sink Ryerson. It is a weakness in another: no customer depends on Ryerson so heavily that it could not live without it.
The supplier side looks very different. Ryerson's top 25 suppliers represented about 76% of its purchase dollars in 2025.7 North American steel production is concentrated among a handful of large producers, and the service center sits downstream of them. Ryerson argues that its suppliers offer overlapping products and that it could find alternatives, which is reasonable. But a distributor that buys most of its metal from a few large mills and sells it to thousands of small customers has a structural position worth naming plainly: it negotiates from strength with its customers only one order at a time, and with its suppliers only through volume.
Where does Ryerson sit in its industry? The most useful snapshot comes from the company's own merger presentation in October 2025. It placed Reliance, the industry's giant, at $13.8 billion of 2024 revenue, Ryerson alone at $4.6 billion, Olympic at $1.9 billion, and the combined company at $6.5 billion.4 Those are figures for a handful of selected public companies, not market shares; the North American service-center market is large and fragmented, filled with regional and family-owned operators who compete on the same corners as the national players.7
This is where a competitive-forces lens helps, used briefly here and in full when the story reaches the bull and bear case. Buyers have alternatives and know it. Suppliers are concentrated, though they sell overlapping products. New entrants face real costs, because a credible service center needs inventory, processing equipment and trucks in a given region, but plenty of regional players clear that bar. Substitutes come from the mills themselves, which can sell directly to large accounts and sometimes run their own processing. What Ryerson has that a small competitor lacks is reach: the ability to hold a broad range of products, to move stock between facilities when one plant runs short, and to serve a multi-site customer across the country.
That is a real advantage. It is also a modest one, and the evidence for it is indirect. Ryerson does not publish customer retention rates, win rates, price premiums over competitors or any measure of how often customers switch. Without those, no one can say that customers stay with Ryerson because they cannot leave. The more defensible claim is narrower: Ryerson wins orders where breadth, proximity and processing make it the most convenient supplier, and it has to keep winning them order by order. The two signals that would show whether that edge is strengthening are already in its disclosures. One is same-store tons, the volume through existing facilities. The other is gross profit per ton. If both rise together through a cycle, the network is doing something competitors cannot easily copy.
Ryerson has tested its own version of this thesis before, and not in theory. In 2018, it bought a struggling old-line Chicago distributor, and the way that deal played out is the best guide to what the Olympic deal might, or might not, become.
IV. Central Steel & Wire: A Bargain Purchase, Then a Long Payback
Central Steel & Wire was the kind of company that a metals veteran in Chicago would have known by reputation for most of their career: an old, independent service center on Ryerson's home turf, with a deep book of long products, tube and plate, and a footprint across the central and eastern United States. By 2018 it was also a business that had fallen behind, carrying more inventory and more property than its sales justified. In 2018 Ryerson bought it for $164 million.8
The purchase price was the first surprise. When Ryerson's accountants valued what they had bought, the fair value of Central Steel & Wire's net assets came to more than the $164 million paid. Accounting rules call that a bargain purchase, and they require the buyer to record the difference as a gain. Ryerson booked about $70 million.8
It is worth slowing down on what that gain meant and what it did not. A bargain-purchase gain is not cash, and it is not operating profit. It is an accounting recognition that, on the day of the deal, the inventory, receivables, real estate and equipment acquired were valued above the price. It tells an investor that Ryerson bought well on paper. It says nothing yet about whether Ryerson could turn those assets into returns. A seller who accepts less than the book value of its assets usually knows something: that the assets are hard to monetize, or that the business attached to them is struggling. The gain was the starting line, not the finish.
What Ryerson did next is the more instructive part. The plan it laid out was the classic playbook for a service-center turnaround. Sell surplus property. Pull excess inventory out of the warehouses and convert it to cash. Fold the acquired operations into Ryerson's systems and purchasing. Then reinvest in a modern facility to replace aging ones. By the time of its November 2022 Investor Day, management reported that the Central Steel & Wire acquisition had released about $100 million of working capital and generated about $50 million from asset sales, and it claimed a return on investment of more than 35% through the third quarter of 2022.9
Those are striking numbers, and they deserve two caveats. The first is that the return figure is management's own calculation, presented at an investor event, using a methodology the company chose. It is not an audited measure, and a different method, one that charged the deal for the capital later spent on new facilities, or that adjusted for the strong metal prices of 2021 and 2022, could produce a smaller figure. The second is timing. Ryerson's harvest of Central Steel & Wire coincided with the strongest steel-price environment in a generation, when almost any inventory sold at a profit. Some of the return belongs to the cycle rather than the deal.
Still, the mechanism was real. Working-capital extraction is the most dependable source of value in service-center deals, because an under-managed distributor almost always carries more metal than it needs. Ryerson found that metal, sold it, and redeployed the cash. That is evidence of a specific operating competence, not luck.
The wider record helps calibrate how much weight that evidence can bear. After Central Steel & Wire, Ryerson made a series of smaller bolt-on acquisitions and embarked on a heavy reinvestment program. Over 2021 through 2025, it spent $437.4 million on capital expenditures, with 2024 marking the end of a three-year cycle of new facilities and equipment.7 Capex then fell sharply, from $99.6 million in 2024 to $51.5 million in 2025, about 1.1% of sales.7 That step-down does not look like harvesting, since management redirected its attention toward productivity and the Olympic integration, but it does mean the payoff from the earlier program now has to show up in results. Across the 2018 to 2025 record, there is no large impairment or abandoned venture that would cancel out the Central Steel & Wire success. Neither is there a long series of comparable, measurable wins.
So the claim that Ryerson knows how to buy and fix service centers survives, in a narrower form. It has one well-documented case, sized at $164 million, that management says returned well, largely through working-capital release in a favorable price environment. That is a credible proof of concept. It is not a batting average. The Olympic merger is roughly five times larger by consideration, it was paid for in shares rather than bought at a discount to book, and Olympic was not a distressed seller with excess warehouses to liquidate. The playbook that worked in Chicago will have to work differently in Cleveland, and it will have to work through a downturn that Central Steel & Wire never faced. That downturn, as it happened, had already arrived.
V. The 2023 Peak Turned the Cash Question Into a Credit Question
In 2023, Ryerson had a very good year. Sales were $5.11 billion, and net income attributable to the company reached $145.7 million.7 It was the tail end of a remarkable stretch for American service centers, in which pandemic-era shortages, rebuilding supply chains and high steel prices let distributors earn margins they had rarely seen. Ryerson used that stretch to invest, to pay dividends and to reduce debt.
Then the tide went out. In 2024, sales fell to $4.60 billion and the company posted an $8.6 million attributable loss.7 In 2025, sales slipped again to $4.57 billion, and the loss widened to $56.4 million.7 Two years after its best result in a generation, Ryerson was losing money on roughly the same level of sales.
The mechanics of that slide explain a lot about the business. Two forces hit at once. The first was demand. Industrial end markets, from heavy equipment to commercial construction and transportation, softened, which meant fewer tons. Fewer tons spread the fixed costs of a service-center network, its buildings, equipment, drivers and supervisors, over less volume. The second was price. As metal prices fell from their peak, Ryerson's selling prices fell with them, often faster than the cost of the inventory sitting in its warehouses. That is the inventory-price lag, and in a falling market it works against the distributor. Lower volume and compressed spreads together turned a $146 million profit into a loss.
Here the conventional reading of the business needs testing. Most investors would look at a $55 million consolidated net loss in 2025 and assume a company in trouble. The cash flow statement tells a more nuanced story. That year, Ryerson generated $87 million of cash from operations.7 Inventory shrank, releasing $39.5 million, and the company stretched its payables to suppliers, which provided $77.9 million.7 In 2024 the effect was even larger: operating cash flow of $204.9 million, helped by about $120 million from lower inventory.7
This is the countercyclical feature of distribution that its defenders like to point to. When demand slows, a service center buys less metal than it sells, so inventory falls and cash comes in even as profits shrink. The working-capital account acts like a shock absorber. Its critics point to the other half of the same mechanism: when demand returns, the absorber compresses, and cash goes back into the warehouse. The business does not generate cash so much as move it between the balance sheet and the bank, depending on which way the cycle is turning.
The rating agencies were paying attention. On April 28, 2025, Moody's affirmed Ryerson's Ba3 corporate family rating, a speculative-grade rating three notches below investment grade, but changed its outlook from stable to negative.10 The agency's reasoning was balanced. It credited Ryerson's scale, its diversity of products and customers, its countercyclical working capital, its low maintenance-capex needs and its liquidity. It pointed to cyclical end markets, metal-price volatility, competition and weak margins through the cycle as constraints, and it flagged higher borrowing and weak performance as the reasons for the change.10 Moody's also maintained the company's SGL-2 liquidity rating, a sign that it saw no near-term funding crisis.10 Those views predate the Olympic merger and its financing. They were nonetheless the backdrop against which Ryerson's management decided to make the largest acquisition in the company's history.
Two other items in the record belong in a credit view, and neither changes it much. KPMG gave an unmodified opinion on Ryerson's 2025 financial statements and on its internal controls, and management concluded that those controls were effective.7 The principal open legal matter is environmental: the Environmental Protection Agency has named JT Ryerson as one of the potentially responsible parties for contamination at the Portland Harbor site in Oregon, but it has not allocated responsibility among the parties, Ryerson has not received a special notice letter, and management says it cannot estimate a range of possible loss.7 That is a genuine overhang in the sense that its size is unknown, and a remote one in the sense that nothing in the record suggests it is close to resolution or large relative to the business. Foreign-exchange swings, by comparison, are a footnote: about 90% of sales are American, and currency gains and losses have run to a few million dollars a year.7
Then 2026 arrived, and the picture inverted. In the first nine months of the year, Ryerson reported net income of $53.5 million, but operating cash flow was negative $176 million.3 Receivables absorbed cash, inventory absorbed cash, and higher payables offset only part of it.3 Profit had returned, and cash had gone the other way.
It would be easy to read that contrast as an earnings-quality warning, and an investor should certainly investigate it. But the context matters. The nine-month figures include the newly acquired Olympic business, whose balances came onto the books at the February closing, and they cover a year in which same-store volumes rose sharply. A growing distributor needs more inventory and finances more customer receivables. That is the absorber compressing, exactly as the mechanism predicts. The real test is whether those balances come back down when the seasonal cycle turns, which for most service centers is in the fourth quarter.
On the third-quarter call, management made its case for the operating side. Shipments rose about 1% from the second quarter when the company's own guidance had called for a seasonal decline, and same-store shipments reached their highest quarterly level in more than five years.2 Management added that North American same-store shipments were up almost 9% for the year to date, against industry growth of about 5% measured by the Metals Service Center Institute, which is the closest thing in its disclosures to evidence of market-share gains.2 But margins went the other way. Gross margin slipped half a percentage point from the second quarter to 17.2%, and even after stripping out LIFO and purchase-accounting effects it fell by a similar amount, as rising carbon-steel costs flowed through before contract prices caught up.2
Analysts pressed exactly there. One asked why program margins were still under pressure; CEO Eddie Lehner said the company had been "catching up" on costs that rose faster than it could pass them through, and noted that the gap between margins on spot, transactional business and on contract pounds had widened to about ten percentage points.2 Another asked when gross margins would recover. Lehner pointed to hedging losses, contract-pricing lags and synergies, and conceded that "margin growth is one of our biggest opportunities."2 Asked why fourth-quarter volume guidance, a decline of 6% to 8%, was no better than seasonal, he offered a candid non-answer: the company would "have to wait until February" to say.2 Those exchanges are useful precisely because they are unpolished. The volume story is real; the margin story is still a promise, and part of today's volume is being won in a transactional market where prices can reset quickly in either direction.
The 2023 peak taught a lesson that the merger has made more pointed. When this business turns down, the losses come quickly, and the cash cushion depends on shrinking the balance sheet. Once the balance sheet carries a billion dollars of debt, the cushion becomes a credit question. That leads straight into the account that sits at the center of the business: working capital.
VI. The Working-Capital Engine Can Run in Both Directions
Imagine one coil of hot-rolled steel arriving at a Ryerson facility. Ryerson has bought it from a mill, perhaps on terms that give it a month or two to pay. The coil sits on the floor. Some weeks later, part of it is slit into strips and shipped to a customer, who receives an invoice and, under typical industry terms, pays some weeks after that. For the whole time between the mill's invoice and the customer's payment, Ryerson is financing that steel with its own money or with borrowed money. Multiply that coil by thousands of products in more than a hundred facilities, and you have the reason a service center carries a large balance sheet relative to its profits.
That balance sheet is the business. At the end of 2025, Ryerson's receivables from customers stood at $463.5 million, and the company held a doubtful-account allowance of just $2.7 million against them.7 Inventory and receivables together dwarf the company's annual profit in a good year. A small percentage change in either can swing cash flow by more than the company earns.
The two directions of the engine are visible in the last three years. In 2024 and 2025, as demand softened, inventory came down and released cash, which helped the company report positive operating cash flow despite losses.7 In the first nine months of 2026, the engine reversed hard. Receivables absorbed $361.4 million and inventory $198.7 million, partly offset by $141.1 million from higher payables.3 Some of that reflects the Olympic balances and the timing of the acquisition; some reflects higher volume; some reflects higher metal prices that make each ton of inventory and each receivable larger.
It is important to be precise about what the receivables figure does and does not mean. A large cash use from receivables can signal that customers are paying more slowly. It can also simply mean that sales are larger than they were at the start of the period. Ryerson's 2025 annual report does not provide an aging table of overdue balances, and its allowance roll-forward shows only about $3 million of charges and $3 million of write-offs in 2025, small amounts for a business of its size.7 The company describes its credit terms as consistent with industry practice and generally unsecured.7 On that record, there is no sign of a credit problem. There is also no disclosure fine enough to rule one out. The 2026 cash use, by itself, does not establish deterioration.
Cash and liquidity are not the same thing, and Ryerson's numbers make the distinction vivid. At September 30, 2026, the company held $40.5 million of cash.3 Its reported liquidity was $865 million, of which $824 million was undrawn availability under its revolving credit facility.3 In other words, almost all of Ryerson's financial flexibility is the bank's willingness to lend against its inventory and receivables. That facility was enlarged at the time of the merger, from $1.3 billion to $1.8 billion of commitments, and its maturity was extended to February 2031.3 That is a comfortable runway. It is also a borrowing base, and a borrowing base shrinks when metal prices fall and inventory is worth less.
The facility is also the reason the debt figure moves so much. Ryerson's borrowings rose from $463.1 million at the end of 2025 to $1.006 billion at the end of September 2026, mostly because of the Olympic transaction and the working-capital build that followed.37 Much of that debt is variable-rate. At the 2025 debt level, Ryerson estimated that a one-percentage-point rise in rates would add about $6.1 million to annual interest; with debt roughly doubled, the same sensitivity is meaningfully larger today.7
Management's own operating gauges show where it is trying to hold the line. At the end of the third quarter, the company carried 73 days of supply, inside its 70-to-75-day target range, and its cash conversion cycle, the number of days between paying for metal and collecting from customers, was about 71 days.2 Capital spending is set at about $75 million for 2026, roughly $50 million for legacy Ryerson and $25 million for Olympic, well below the investment years earlier in the decade.2 Those figures suggest the working-capital build is being managed rather than drifting, but they also show how much money sits in the cycle: on more than $8 billion of annualized revenue, every extra day of conversion ties up more than $20 million.
Against that backdrop, Ryerson's capital returns are a meaningful choice. The company continues to pay a quarterly dividend of $0.1875 a share, and under a $100 million repurchase authorization it bought back about 159,000 shares in the third quarter for $3.8 million, at an average price below $24.2 Those are modest amounts relative to the debt. They signal confidence. They also compete with debt reduction for every dollar of free cash flow.
So working capital is both the shock absorber and the funding demand. It protects the company in a downturn and drains it in a recovery. Liquidity provides room, but it is mostly borrowed room. For investors, the measures that matter are concrete: whether receivables and inventory at the existing facilities grow faster than sales, whether operating cash flow turns positive through a full cycle, and where net debt and leverage settle after the seasonal unwind at year-end. Adjusted EBITDA will not answer those questions on its own. Cash conversion will.
And all of that matters more now because of a decision made in October 2025, when Ryerson agreed to issue a large block of new shares and assume a much larger balance sheet to become the second-largest name in its industry.
VII. Olympic Steel: Paying for the Number Two Position
On October 28, 2025, Ryerson and Olympic Steel announced that they would combine.4 The structure was all stock. Each Olympic shareholder would receive 1.7105 Ryerson shares for every Olympic share, an exchange ratio that represented a premium of about 21% to the average ratio between the two stocks over the preceding ninety days.4 No cash would change hands for the equity. Instead, Olympic's owners would trade their company for a large minority stake in a bigger one. When the deal closed on February 13, 2026, they became owners of roughly 37% of the combined Ryerson.113
Olympic Steel brought its own long history to the table. Founded in Cleveland in 1954 and built over decades under the leadership of Michael Siegal, it had grown into a service center of about $1.9 billion in 2024 revenue, with operations in carbon flat-rolled steel, specialty metals such as stainless and aluminum, and pipe and tube.114 By the time of the merger it was led by Rick Marabito as chief executive, with Siegal as chairman.11 Siegal became chair of the combined board and Marabito became Ryerson's president and chief operating officer, so the deal was as much a merger of management teams as a purchase.122
The strategic logic was operating logic. Olympic's facilities overlapped Ryerson's in some regions and complemented them in others. Its product lines filled gaps in Ryerson's offering, and its customers gave the combined company a broader base for every product. Management grouped the expected benefits into a handful of pillars: buying metal as one larger customer of the mills, consolidating overlapping facilities and logistics, removing duplicate public-company and administrative costs, and selling more products to each other's customers. The headline target was $120 million of annual run-rate synergies within two years, with $40 million expected by the end of the first year and roughly $40 million of one-time costs to achieve them.4 On revenue, the combination created a business second only to Reliance.4
Did Ryerson pay a fair price? This is the question most likely to generate strong opinions and least likely to be settled by them. The best available benchmarks come from the fairness analyses in the merger registration statement. The financial advisers looked at publicly traded service-center peers, whose median valuation was about 8.0 times estimated 2025 EBITDA and 6.9 times estimated 2026 EBITDA.11 One adviser applied multiples of 6.5 to 7.5 times to Olympic in its analysis of comparable transactions, which produced an implied range of exchange ratios from about 1.02 to 1.80 Ryerson shares per Olympic share.11 The agreed ratio of 1.7105 sat inside that range but near its top, and similarly near the upper end of some of the ranges derived from trading peers.11
The fair reading is that the filings do not show Ryerson overpaid, and they do not show a bargain either. This was a premium deal for a healthy business, priced within the ranges that independent advisers considered fair. That is a very different starting point from Central Steel & Wire, where Ryerson bought below book value and harvested surplus assets. Here, the return has to come almost entirely from synergies and from running the combined network better than the two companies ran separately.
The accounting deserves a moment because the numbers are easy to confuse. Ryerson recorded the fair value of the purchase consideration at $837.3 million, reflecting the value of the shares issued and related items at closing.3 To pay for it, Ryerson issued about 19.5 million new shares.3 It also took on Olympic's debt, which is the main reason consolidated borrowings more than doubled. Other headline measures of the price that include cash and assumed debt exist in company materials, and they are not interchangeable with the equity consideration. For a shareholder, the cleanest way to hold the transaction in mind is that roughly 37% of the combined company was handed over in exchange for Olympic's business, and the combined balance sheet absorbed Olympic's borrowings and working capital.
So the scorecard begins with synergies. Here the early news is good. By the third quarter of 2026, Ryerson reported about $13 million of realized synergies in the quarter, already ahead of the $40 million first-year target.21 On the call, Olympic's finance chief Rich Manson went further and described the business as being "in the $60 million run rate."2 Management guided to $14 million to $15 million of synergies in the fourth quarter.2 Through the third quarter, the company said it had spent only about $2.6 million of one-time costs on synergy initiatives, far below the roughly $40 million estimated in the deal materials.24 That gap is either a sign of efficient execution or a sign that the expensive steps, such as closing or consolidating facilities, are still ahead. Investors should expect most of the remaining costs to arrive as the network-optimization work moves forward.
The quarter's earnings make the same point from a different angle. Net income attributable to Ryerson was $32 million, or $0.61 a diluted share, roughly double the second quarter's $15.5 million.2 Adjusted EBITDA excluding LIFO reached $115 million, and the legacy Ryerson network alone produced $84.8 million of it, its best quarter in three and a half years.2 That last figure matters because it is the one piece of the result that the acquisition did not buy. It suggests the old business was improving on its own, which is encouraging, and it is also a reminder that some of the combined company's momentum would have arrived with or without the merger.
Olympic itself has performed better than expected. In the third quarter it contributed $30.2 million of adjusted EBITDA excluding LIFO, above management's expectation of $21 million to $23 million.132 Marabito said systems integration was "about 90% of the way there," with most of Olympic's inventory and transaction data already moved into Ryerson's systems, and he called the commercial synergies "probably the biggest pleasant surprise."2 That matters, because shared systems are what make shared inventory and joint purchasing possible. A salesperson in one legacy network can now see and sell the metal sitting in the other.
The bear case does not disappear because the first year is going well. Debt was about $1.006 billion at the end of September.3 The 19.5 million new shares increased the share count, which means every dollar of future profit is divided among more owners. Inventory purchase-accounting charges, which arise because acquired inventory is written up to fair value and then flows through cost of sales, were still affecting reported results.3 And operating cash flow was negative over the first nine months of the year, which means that synergies so far have shown up more clearly in adjusted EBITDA than in cash.3
The test, then, is not whether the $120 million target is reached on paper, but whether it shows up as cash and per-share returns that exceed the cost of the capital and dilution used to buy it. Synergies that are measured as an annualized run-rate are an estimate of future savings, not money in the bank. The people responsible for turning that estimate into cash are the next part of the story.
VIII. Eddie Lehner's Test: Targets, Incentives, and Shareholder Trust
Edward Lehner is not a Ryerson lifer, and he is not a financier dropped in by a sponsor. He is a steel-industry operator who came up through finance. Before Ryerson, he held finance roles at steel producers and recyclers, including Nucor and Steel Dynamics, and served as chief financial and administrative officer of PSC Metals, a scrap-metal processor.14 He joined Ryerson as chief financial officer in 2012, during Platinum's ownership, and in June 2015 the board named him president and chief executive, succeeding Michael Arnold.15 By the time of the Olympic merger, he had run Ryerson for more than a decade, longer than many of his peers, and through a full cycle of losses, peak profits and losses again.
His style, as it shows up on calls, is that of a CFO-turned-CEO: comfortable with numbers, fluent in the language of tons per day, days of supply and cash-conversion cycles, and willing to admit when a question cannot yet be answered. Around him today sit Rick Marabito as president and chief operating officer, who brings the Olympic network with him, and Jim Claussen, chief financial officer since January 2021.212 Their decisions over the next year, on facility consolidation, inventory, capex and the balance between debt reduction and shareholder returns, will determine whether the Olympic merger is remembered as the move that changed Ryerson's economics or as the move that made a cyclical company larger and more levered.
Credibility is built by pairing targets with outcomes, and the recent record is mostly favorable. For the third quarter of 2026, management had guided to adjusted EBITDA excluding LIFO of $88 million to $92 million; it delivered $115 million.2 Volumes also rose against management's seasonal forecast.2 Leverage fell from about 4.0 times at the end of the second quarter to 3.2 times at the end of the third, and management said it expected to get below 3.0 times by year-end.2 The company had also reported synergies ahead of its first-year target. Not everything went the right way, though. LIFO expense came in at $30 million against guidance of $16 million to $18 million, because mill prices rose faster than expected, and margins slipped.2 Management explained both openly. That is a better pattern than the reverse.
Pay is where the story becomes more complicated. Lehner's reported total compensation rose from $4.96 million in 2024 to $17.86 million in 2025.12 His salary stayed at $1.2 million in both years.12 Almost all of the increase came from a one-time, off-cycle grant of 600,000 restricted stock units, valued at $13.60 million at the grant date.12 That year, Ryerson's attributable loss widened from $8.6 million to $56.4 million.712
Two things can be true at once. Grant-date value is an accounting measure, not cash, and the actual value Lehner realizes will depend on Ryerson's share price when the units vest and on any conditions attached. A large equity award can tie a chief executive more closely to shareholders at exactly the moment a transformative deal needs him to stay. But a board that roughly triples reported CEO pay in a year of widening losses invites scrutiny, and the terms of the award, including how much of it vests on time alone and how much depends on performance, are what determine whether it rewards the right outcomes. The proxy is the place to read those conditions, and shareholders evidently did.
The voting record is where shareholder trust can be measured rather than guessed. At the 2025 annual meeting, more than 88% of votes cast approved executive pay.12 At the 2026 meeting, the vote on 2025 pay was 29.30 million shares in favor and 16.22 million against, support of only about 64%.16 That is a sharp decline in a single year and a meaningful signal from the shareholder base, which now includes former Olympic owners.
The director elections told a more specific story. Lehner himself received only about 0.53 million withheld votes.16 Jacob Kotzubei, a Platinum Equity partner who sits on the board as Platinum's nominee, received 8.37 million withheld or abstaining votes against 37.23 million in favor.16 The dissent was concentrated not on management but on the sponsor's representative, at a moment when the sponsor's stake had shrunk to a fraction of its former size. Under the investor-rights agreement, Platinum retained the right to nominate a director at the ownership level it held at the end of 2025; with its stake now down to 3.7%, whether that right continues depends on the agreement's thresholds, and investors should check the agreement rather than assume the old influence persists.7312
One small related-party item deserves a mention for completeness rather than alarm. Olympic leases a Cleveland warehouse from a partnership that is 50% owned by Siegal, now the combined company's chair, at about $225,000 a year through 2028.12 Relative to a business with billions in sales, the amount is immaterial. It is the kind of arrangement that boards should keep in plain view.
Taken together, the evidence on management narrows rather than resolves the question. Lehner's team has a documented turnaround in Central Steel & Wire, a strong record of beating its own near-term guidance in 2026, and an integration running ahead of plan. Against that, its biggest bet is barely eight months old, pay has risen faster than results, and more than a third of the votes cast on pay went against it. The way to keep score is to compare each quarter's claimed synergy with costs to achieve, cash flow and leverage, and to listen for whether explanations on the next calls stay consistent with the ones given in October. Whether that management team has built something competitors cannot copy is the question the bull and the bear argue about next.
IX. Why Ryerson Could Win—and Why the Cycle Could Take It Back
Imagine the strategy meeting at a mid-sized regional service center the week the Olympic merger closed. On one side of the map sits Reliance, still far larger than the combined Ryerson.4 On the other side sits Ryerson, telling the mills it is now a bigger buyer and telling customers it has more inventory, more processing and more facilities within a truck's drive. The regional player's question is simple: what can the bigger company now do to me that it could not do last year? The answer to that question is the moat analysis, and it belongs here, in full, once.
Start with the forces that shape profits in this industry. Customers hold real power: they can buy the same grade of steel from several service centers, and the largest negotiate programs with prices tied to indexes.7 That means a service center's ability to raise prices above the market is limited to what its speed and reliability are worth on a given order. Suppliers hold considerable power too: Ryerson's top 25 account for about three-quarters of its purchases.7 The merger's procurement pillar is a direct attempt to rebalance that relationship; when an analyst on the October call asked whether the combined company now buys from the mills as a single customer, Olympic's Andrew Greiff answered, "The easy answer is yes."2
Entry barriers are real but surmountable at regional scale, mills can sell directly to large customers, and rivalry remains intense.7 That is not a description of an industry with pricing power.
Now apply Hamilton Helmer's seven powers, the sources of durable advantage that let a business earn returns above its cost of capital. Three are plainly absent. Ryerson has no network effects in the software sense; one more customer does not make the product better for the others. It has no cornered resource, such as exclusive supply or a patent. It has no counter-positioning, since its business model is the same as its competitors'. Branding matters a little, because a long-standing name signals reliability in procurement departments, but a buyer will not pay a meaningful premium for a Ryerson logo on a plate of steel.
Switching costs are modest. Program customers integrate suppliers into their schedules and quality systems, but customers routinely multi-source, and Ryerson does not publish retention or renewal rates.7 The evidence supports some switching friction, not a lock-in.
That leaves the two powers on which the bull case actually rests. The first is scale economies. A bigger buyer can negotiate better metal costs, a bigger network can spread fixed overhead across more tons, and a bigger inventory can serve more orders from stock. Each is visible in the synergy plan, which is built on procurement, efficiency and network consolidation.2 The second is process power: the accumulated operating know-how to run a service-center network tightly, holding the right inventory, turning it quickly and processing it efficiently. Ryerson's turnaround of Central Steel & Wire is the strongest evidence it has process power, and management's operating metrics, such as days of supply held in a 70-to-75-day target range and productivity measured in tons per employee per day, are designed to show it.2
Both powers are real. Neither is yet proven durable. Scale economies in distribution are bounded: the purchasing advantage of being the second-largest buyer is smaller than the advantage of being the largest, and Reliance remains far larger. Process power in a commodity business is copyable over time by competitors that hire well and invest in systems. The proof so far is network reach and early synergies, not a measured price premium or customer captivity.
A skeptical investor, the kind who writes a short report or an activist letter, would push on three points. The first is the composition of the $120 million target. If most of it comes from removing duplicate costs and squeezing suppliers, it is real but finite: it lifts margins once and then becomes the new baseline that competitors can partly match. If a meaningful share comes from commercial gains, selling more products to more customers at better margins, it is more valuable but also more fragile, because customers can take their business elsewhere. Management's own breakdown assigns about $20 million of annual run-rate to the commercial pillar, with only about $4 million expected to be realized in the fourth quarter.2 Most of the target, in other words, is cost.
The second is the cycle. Every synergy in the plan was designed in a recovering market. When demand softens, tons fall, fixed costs are spread over less volume, and the margin gains from synergies can be overwhelmed by the loss of operating leverage. Ryerson's own record from 2023 to 2025, when a $146 million profit became a $56 million loss on only modestly lower sales, shows how fast that can happen.7 The third is leverage. Net leverage of 3.2 times trailing EBITDA at the end of the third quarter is manageable in a good year.2 It is less comfortable if EBITDA falls by a third in a downturn, which this business has done before.
The bull case, stated fairly, is this. Same-store shipments are at five-year highs and outpacing the industry, synergies are ahead of schedule, Olympic is earning more than expected, leverage is falling, and the combined network gives Ryerson a better chance of earning through-cycle margins than either company had alone.2 The company expects hot-rolled steel to remain tight into 2027, which supports prices for distributors holding inventory.2 And because Ryerson's customer base is broad, no single customer loss can derail that plan.
The bear case is equally concrete. Reliance remains much larger and better capitalized. Competition is based on service, price, quality and proximity, all of which regional players can match locally. The combined company is coming out of two years of losses, carries about a billion dollars of debt, and still faces a negative outlook from Moody's that predates the merger.103 Its working-capital needs are rising, and its synergy figures are run-rates rather than realized annual cash.
The risks are best understood as mechanisms rather than headlines. A demand slowdown reduces tons and spreads fixed costs more thinly. Metal-price inflation or deflation creates margin timing gains and losses and swings inventory value and borrowing-base capacity. Rising interest rates increase the cost of variable-rate debt that has roughly doubled. Integration execution could stall, leaving run-rate estimates that never show up as cash. Technology is not a leading threat; artificial intelligence does not disrupt the need to hold and cut physical metal near a customer's plant, though automation and scheduling tools matter as productivity levers, and the companies that use them best will run leaner networks.
What does the market think? In mid-November 2026, Ryerson's shares traded around $29, giving the company a market value of about $1.5 billion; over the prior year they had ranged from about $19 to nearly $34.17 Add roughly $966 million of net debt and the enterprise is valued at around $2.5 billion.2 A trailing price-to-earnings ratio is not useful after a loss year and a merger that changed the share count. On an EBITDA basis, the third quarter's $115 million and the fourth-quarter guidance of $100 million to $104 million, both excluding LIFO, imply a run-rate in the low $400 millions, which would put the enterprise at something like five to six times that level.2 That is below the 6.9 times median 2026 estimate for peers that the merger advisers used.11 Read plainly, the market appears to be valuing Ryerson below the peer group on run-rate earnings, which suggests either skepticism that second-half 2026 EBITDA represents the cycle, or a discount for leverage and integration risk, or both. A multiple computed on a strong half-year after a merger is a fragile number; it is a clue to what investors assume, not a verdict on value.
Three measures will tell the story from here. The first is same-store shipment tons together with gross profit per ton: volume is moving the right way, while margins are not yet.2 The second is operating cash flow after working capital, which remains negative, including about $18 million in the third quarter alone.32 The third is net debt and leverage, which are falling.2 If all three improve together through a full seasonal cycle, the scale thesis will have evidence. If volume rises while cash and leverage stall, the merger will have made Ryerson bigger rather than better.
Those numbers are the scoreboard. The lessons behind them belong to a business that has to hold the metal first.
X. Lessons From a Business That Has to Hold the Metal First
That coil, already bought but not yet paid for, is the whole company in miniature, and it carries four lessons that belong to Ryerson more than to anyone else.
The first lesson is that in distribution, the warehouse is part of the product, and part of the risk. Readiness is exactly what customers pay for, and the inventory that wins the order ties up capital.7 Founders and investors in any business that sells availability, whether spare parts, medical supplies or industrial components, should recognize the trade: the skill is not in avoiding it but in sizing it correctly for the part of the cycle they are in.
The second lesson is that a bargain is only a bargain after the turnaround. Central Steel & Wire came onto Ryerson's books with a $70 million accounting gain, which proved nothing on its own.8 The working-capital release and asset sales that followed gave it meaning, alongside a favorable price cycle.9 The Olympic merger began without a bargain, at a premium inside the fairness ranges, which means there is no accounting gain to cushion the story. Every dollar of return has to be earned through operations.
The third lesson is that a synergy run-rate is a promise measured in quarters, and free cash flow is the receipt. Ryerson's early synergy progress has yet to show up in cash, with working capital and acquisition timing explaining part of the gap.23 Investors who score a merger by its announced run-rate rather than by its cash will keep being surprised. The receipt arrives only when savings show up after integration costs, after working capital, and after the cycle has had its say.
The fourth lesson is that scale helps when the network moves metal, but it does not make the cycle disappear. Ryerson's recent results show how quickly earnings can reverse.7 A larger network spreads fixed cost over more tons and buys metal more cheaply. It does not change the fact that tons fall and prices reset when industrial demand weakens. The test of the combined company is not whether it is bigger in a good year. It is whether it loses less, and recovers faster, in a bad one.
XI. Epilogue
Tonight, Ryerson stands near the end of the first year it has ever run as a combined company. The systems are mostly merged. Olympic's inventory sits in Ryerson's databases, and salespeople from both legacy companies can see and sell each other's metal.2 The fourth quarter is underway, with management guiding to lower seasonal volume, adjusted EBITDA excluding LIFO of $100 million to $104 million, and another $14 million to $15 million of synergies.2 Net debt is near $966 million, and the company has said it expects to bring leverage below 3.0 times by the end of the year.2
The next moments that will decide this story are already on the calendar. In February 2027, Ryerson will report its fourth-quarter and full-year results, and, with them, the first full read on how much cash the combined company generated as seasonal working capital unwinds. That is when Lehner said he would answer the question of whether fourth-quarter volumes were merely seasonal.2 If operating cash flow turns strongly positive in the fourth quarter and debt falls, the year's negative cash flow will look like the ordinary price of growth and integration. If inventory and receivables stay high while volumes fall, the question will shift from integration to working-capital discipline.
The second moment arrives by early 2028, when the two-year window for the $120 million synergy target closes.4 By then, the company will have to show not just a run-rate but realized savings, net of the one-time costs that so far have been far below the deal estimate. How much of the total comes from procurement and duplicate costs, and how much from durable commercial gains, will reveal whether scale created an advantage or merely removed overlap.
The third test is quieter and slower. As purchase-accounting charges roll off, same-store tons and margins will become cleaner to read, and Olympic's contribution will no longer be described as a beat against a deal-model expectation. It will simply be part of the business. A ratio of debt to EBITDA that falls because EBITDA rose in a strong market is different from one that falls because cash paid down debt. The first can reverse with the cycle; the second is earned.
The tension that remains is the one this story began with. Ryerson is bigger than it has ever been, and by most operating measures it is performing better than it has in years. It has not yet shown that the combination makes it a stronger generator of cash per share across a full cycle. Until it does, the scale it bought is an opportunity, not a result.
XII. Outro
Go back to that coil on the warehouse floor. It is valuable only if three things happen. It has to be cut the way a customer wants it. It has to arrive when the customer needs it. And then the customer has to pay. Ryerson's nearly two centuries of history, its turn as a sponsor-owned public company, its Chicago turnaround and its Cleveland merger are all variations on making those three things happen faster, more cheaply and more reliably than the next service center down the road.
Ryerson sells readiness: metal in the right place, cut the right way, when the line is waiting for it. The Olympic deal asks whether a bigger network can make that promise more profitable before the next downturn tests it. The answer will not come from a synergy slide. It will come from the coil, and from how quickly it turns back into cash.
References
-
Ryerson Reports Third Quarter 2026 Results — Ryerson, 2026-10-28 ↩↩↩↩
-
Ryerson Q3 2026 Earnings Call Transcript — Stock Analysis, 2026-10-29 ↩↩↩↩↩↩↩↩↩↩↩↩↩↩↩↩↩↩↩↩↩↩↩↩↩↩↩↩↩↩↩↩↩↩↩↩↩↩↩↩↩↩↩↩
-
Ryerson Holding Corporation Q3 2026 Form 10-Q — SEC, 2026-10-28 ↩↩↩↩↩↩↩↩↩↩↩↩↩↩↩↩↩↩↩↩↩
-
Ryerson and Olympic Steel Merger Presentation — Ryerson, 2025-10-28 ↩↩↩↩↩↩↩↩↩↩↩
-
Ryerson Holding Corporation 2014 Form 10-K — SEC, 2015-03-25 ↩↩↩↩↩↩↩
-
Ryerson Holding Corporation IPO Prospectus, Form 424B4 — SEC, 2014-08-13 ↩
-
Ryerson Holding Corporation 2025 Form 10-K — SEC, 2026-02-23 ↩↩↩↩↩↩↩↩↩↩↩↩↩↩↩↩↩↩↩↩↩↩↩↩↩↩↩↩↩↩↩↩↩↩↩↩↩↩
-
Ryerson Holding Corporation 2020 Form 10-K, Acquisitions Note — SEC, 2021-02 ↩↩↩
-
Ryerson 2022 Investor Day Presentation — Ryerson, 2022-11 ↩↩
-
Ryerson Holding Outlook Downgraded to Negative by Moody's Ratings — Investing.com, 2025-04-28 ↩↩↩↩
-
Ryerson and Olympic Steel Merger Registration Statement, Form S-4/A — SEC, 2026-01-14 ↩↩↩↩↩↩↩
-
Ryerson Holding Corporation 2026 Proxy Statement — Ryerson Holding Corporation, 2026-03-18 ↩↩↩↩↩↩↩↩↩
-
Ryerson Reports Third Quarter 2026 Results, Exhibit 99.1 — SEC, 2026-10-28 ↩
-
Ryerson Appoints Lehner as President and CEO — Design and Build with Metal, 2015-05-14 ↩
-
Ryerson 2026 Annual Meeting Voting Results, Form 8-K — SEC, 2026-05-06 ↩↩↩
 LinkedIn
 WhatsApp
 Reddit
 Hacker News
 Email
 Kindle
 RSS Feed
 Spotify
 Apple Podcasts
 Amazon Music
 Audible
 YouTube