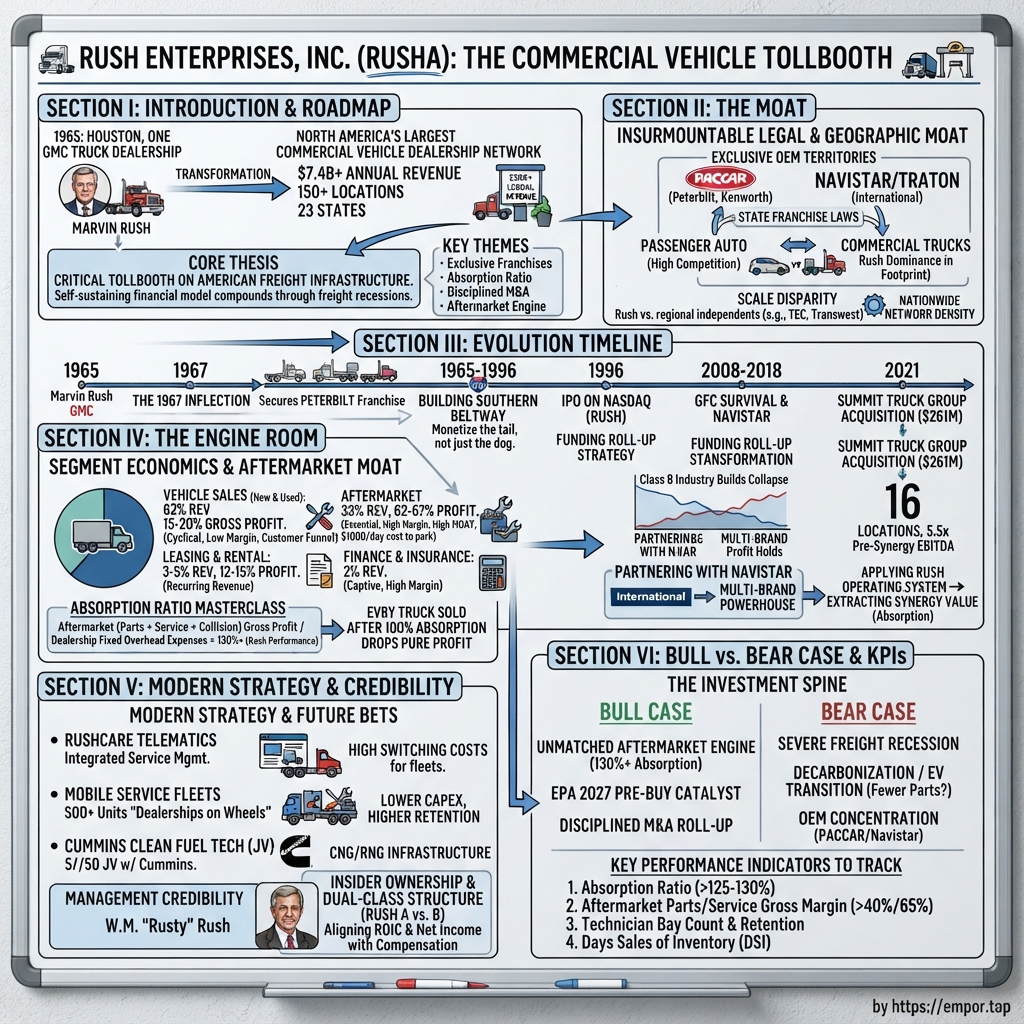
Rush Enterprises, Inc. (RUSHA): The Commercial Vehicle Tollbooth
I. Introduction & Episode Roadmap
Drive Interstate 35 south out of Austin, Texas, and about forty-five minutes later the highway opens into New Braunfels — a town known for German bakeries, river tubing, and, improbably, the corporate headquarters of North America's largest commercial vehicle dealership network. The address is 555 IH 35 South.1 It is not a glass tower. It sits directly on the interstate because the business sits on the interstate. Everything Rush Enterprises does depends on being physically close to the place where a broken truck stops.
That reality compresses the entire company into a single geographic fact. A Class 8 tractor-trailer that will not start is not merely an inconvenience; it is a stranded asset with a driver attached, a load tied to a strict delivery window, and an anxious customer on the phone. Whoever can get that truck back on the road fastest and closest to the breakdown captures the economics. For six decades, Rush has bought real estate beside highways, stocked parts behind those facilities, and employed the technicians who work inside them.
That strategy has produced unusual scale. In 2025, Rush generated $7.43 billion in revenue and $263.8 million in net income, or $3.27 per diluted share.1 Its footprint included 126 franchised Rush Truck Centers across 23 U.S. states, along with an 80%-owned Canadian subsidiary operating 12 International dealerships and two IC Bus dealerships in Ontario — totaling 120 owned locations, 80 leased ones, and 469 individual manufacturer franchises.1 It employed 7,355 people in the United States and 582 in Canada.1 No other publicly traded company in North America operates at anything like this scale.
The core thesis, stated as a question rather than a conclusion. The bullish case for Rush frames it not as a simple truck retailer, but as an aftermarket annuity provider. Selling trucks functions as a low-margin customer-acquisition funnel, while high-margin parts and service follow each vehicle for a decade. Disclosed financials support this model: in 2025, aftermarket products and services generated 33.9% of revenue but drove 63.7% of gross profit.1 Meanwhile, new and used vehicle sales accounted for 60.6% of revenue while generating just 26.7% of gross profit.1 In short, roughly two-thirds of the profit comes from one-third of the revenue.
However, an investment thesis is only as strong as its potential falsifiers, and Rush presents several. First, the company's franchise agreements with Peterbilt are, in Rush's own words, "nonexclusive."1 Second, its most-cited moat metric — the absorption ratio — has declined in each of the last three years.1 Third, its 2022 target of reaching $10 billion in revenue at a 6% pre-tax return on sales has quietly become unreachable on the original timeline.2 Finally, despite common assumptions, executive compensation at Rush is not tied to any quantitative formula at all.3
The questions this episode tries to answer honestly:
-
What does the "absorption ratio" actually measure, why do commercial vehicle dealers treat it as the single most important number in the business, and what does it mean that Rush's has fallen from 136.6% to 130.7% in three years?14
-
If the OEM franchise agreements are nonexclusive and terminable, where does the moat actually live — and how much of it is a legal artifact versus a physical one?
-
Why does a family-controlled dual-class structure exist here not merely as a governance preference but as an explicit contractual requirement imposed by PACCAR?1
-
Has W.M. "Rusty" Rush earned the benefit of the doubt on capital allocation, judged by what he promised versus what he delivered across a full cycle?
-
What does a 2027 emissions rule that keeps changing shape do to a business that makes money both from selling new trucks and from repairing old ones?
One framing note before the story. Rush trades as two securities, RUSHA and RUSHB, on NASDAQ — representing the same economic claim on the same company, but with different voting rights.1 Both are scheduled to split three-for-two on August 31, 2026, marking the second such split in three years.9 The existence of the dual class is not a footnote to the business; as this analysis will show, it is a core condition of the business, written directly into the contract with Rush's largest supplier.
Understanding Rush requires starting with the mechanics, because commercial truck retail operates quite differently from typical automotive dealerships.
 Subscribe on LinkedIn
II. The Commercial Vehicle Dealership Playbook & Industry Structure
Walk into a Rush Truck Center in Dallas and the showroom is almost an afterthought. The building's economic center of gravity lies behind it: service bays with pits and overhead cranes, a parts warehouse running to the ceiling, a collision center with a paint booth, and a yard filled with trucks in various states of repair. The company's annual report is direct about why this layout matters: differentiation among commercial vehicle dealers "has become less dependent on price competition and is increasingly based on a dealer's ability to offer a wide variety of services to their clients in a timely manner to minimize vehicle downtime."1
A quick taxonomy, in plain terms. Class 8 denotes a gross vehicle weight rating above 33,000 pounds — encompassing long-haul tractor-trailers, concrete mixers, and refuse trucks.1 These expensive, built-to-order units are assembled from major components sourced from third-party suppliers, including engines, transmissions, and axles.1 Class 4 through 7 covers medium-duty vehicles — box trucks, delivery vans, and municipal fleets that "typically operate locally and generally do not leave their service areas overnight."1 Class 3 and below consists of light-duty vehicles, which Rush sells at several of its Ford dealerships.1
The two markets follow distinct economic drivers. Class 8 demand tracks freight fundamentals: spot rates, contract rates, tonnage, and fleet age. Medium-duty demand tracks localized economic activity, such as construction, waste management, municipal budgets, and commercial leasing. Rush operates across both categories. During the freight downturn spanning roughly 2022 through 2025, medium-duty and vocational sales helped stabilize overall performance. As Chief Executive W.M. "Rusty" Rush noted in discussing 2025 financial results, strong demand from "vocational and public sector customers" helped offset volume declines among long-haul fleets.4
The manufacturers. Four major manufacturer groups account for the vast majority of North American Class 8 sales: PACCAR (Peterbilt, Kenworth), International (owned by Traton), Daimler Truck (Freightliner, Western Star), and Volvo Group (Volvo, Mack). Rush represents Peterbilt and International on the heavy-duty side, alongside a broad roster of medium-duty, bus, and specialty OEMs: Hino, Ford, Isuzu, IC Bus, Blue Bird, Blue Arc, Battle Motors, Micro Bird, and Collins Bus.1 Its dealerships compete directly against franchised networks representing Freightliner, Kenworth, Mack, and Volvo.1
Dispelling a common industry misconception. Popular framings of Rush's competitive moat often assert that commercial truck OEMs grant strict, exclusive geographic territories that block rivals from opening competing dealerships nearby. SEC filings contradict that assumption.
Rush's 10-K states: "We have entered into nonexclusive dealership franchise agreements with Peterbilt," with identical nonexclusive language governing its relationship with International.1 Rather than holding absolute geographic monopolies, Rush operates within assigned areas of responsibility — covering Peterbilt across twelve states including Texas, California, Florida, and Arizona, and International across thirteen states plus Ontario.1 These territorial designations establish geographic sales obligations rather than guaranteed legal exclusivity.
Furthermore, franchise agreements carry explicit expiration dates. Rush's Peterbilt agreements "currently have terms expiring in June 2026"; its International agreements expire between December 2026 and May 2030.1 While commercial vehicle franchises are routinely renewed and state dealer-protection statutes impose steep legal barriers against arbitrary cancellation, an investment thesis premised on a perpetual, legally enforced territorial monopoly relies on protections that do not formally exist.
The real competitive landscape. Rush's primary competitors are privately held dealership networks, such as TEC Equipment on the West Coast, Transwest in the Rocky Mountains, Truck Country in the Midwest, and Inland Kenworth. Because none of these peers is publicly traded, Rush enjoys distinct public market benefits, including direct access to equity and debt capital and transparent operational reporting. However, this private peer group also makes sweeping claims regarding relative scale disparities difficult to verify against official financial disclosures.
What remains verifiable is the industry's vulnerability to sharp demand swings. According to ACT Research data cited in Rush's disclosures, U.S. retail sales of new Class 8 trucks over the past decade ranged from a low of approximately 195,687 units in 2020 to a high of roughly 281,440 units in 2019 — representing a peak-to-trough variation of more than 40%.1 Managing through that cyclical amplitude is the baseline requirement for any commercial truck dealer.
The variables driving the cycle. Class 8 cyclicality is governed by four sequential economic variables.
Freight rates. Spot rates reflect immediate carrier profitability, while contract rates adjust to spot movements with a lag of two to four quarters. During the 2022–2025 freight recession, spot rates fell significantly below contract rates, prompting shippers to divert volume to the spot market. This trend squeezed contract rate renewals across the industry. As spot market conditions began firming in early 2026, management indicated that the spread between spot and contract pricing had normalized, leading fleet operators to anticipate mid-to-high single-digit contract rate increases rather than flat renewals.
Capacity. Transport capacity exits the industry slowly. Market tightening in the recent cycle resulted from a slowdown in new truck deliveries through late 2025 and early 2026, alongside heightened regulatory enforcement removing non-compliant commercial drivers. Management highlighted dropping tender acceptance rates — falling from near 98% down to the high 80s and low 90s — as an early operational indicator of tightening capacity.
Fleet age. When operators repeatedly delay fleet replacement, escalating repair costs eventually force vehicle retirement regardless of prevailing spot rates. Executive estimates indicate that average Class 8 fleet ages have remained approximately six months above historical fleet management targets.
Regulation. Environmental regulations periodically trigger pre-buy demand cycles. The EPA's 2027 Low NOx emission standard represents the primary regulatory catalyst for the current cycle, though shifting implementation details and compliance costs directly influence the timing of fleet purchases.
This underlying cyclicality highlights why aftermarket parts and service operations serve as the central economic engine of Rush's business model, requiring careful analysis prior to evaluating overall corporate valuation.
III. Founding Context & The Early Years (1965–1996)
The business began in Houston in 1965, when W. Marvin Rush opened a single GMC truck dealership financed on thin operating margins.5 Rush Enterprises was incorporated in Texas that same year.1
Expansion began shortly after. In 1967, the company acquired its first Peterbilt franchise — though regulatory filings date the start of Peterbilt dealer operations to 1966 — launching a partnership that management noted in 2023 had spanned more than fifty-five years.5
Securing the Peterbilt franchise provided a commercial advantage. As an aspirational marque in American trucking, Peterbilt attracted fleet owners and owner-operators who prioritized vehicle quality and were willing to invest in routine, high-quality maintenance.
Building along the corridors. Rush's growth followed a geographic logic along major Sunbelt freight corridors, expanding outward from Houston along Interstate 10 across the Gulf Coast, Interstate 35 running from Laredo through Dallas, and Interstate 20 crossing West Texas.
That initial network remains central to operations today. Texas remains Rush's largest market, accounting for 178 individual franchises across 55 locations at the end of 2025 — more than triple its footprint in any other state.1 Management maintained this corridor-based expansion strategy in 2026 with a Louisiana acquisition, framing the deal as extending coverage farther along Interstate 10, a primary southern freight artery.
Unlike automotive dealerships that rely on local residential population density, commercial truck dealerships depend on passing traffic volume. Situate a facility along a heavy freight corridor, and its addressable market grows with every long-haul shipment passing the gate. Placing headquarters directly on Interstate 35 reflects this operational focus, with management observing in early 2025 that commercial trucks accounted for over half of the passing highway traffic.
During these early decades, Marvin Rush established the operational principle that continues to guide the company: vehicle sales represent low-margin transactions, whereas ongoing maintenance provides steady, higher-margin income. To capture that recurring value, the company added truck leasing along with finance and insurance operations between 1965 and 1979, establishing an integrated sales-and-service model.5 Revenue reached $100 million by 1992.5
In June 1996, Rush Enterprises completed an initial public offering on NASDAQ under the symbol RUSH, becoming the first publicly traded commercial truck dealership network in North America.5 Historically, commercial vehicle dealerships operated as private, family-owned businesses funded through local bank debt. By accessing public capital markets, Rush acquired a liquid currency and balance sheet flexibility to execute a long-term consolidation strategy across a fragmented regional dealership landscape.
What this says about the founder. Marvin Rush served as chief executive officer from 1965 through 2006, remained executive chairman until 2013, and served on the board of directors until August 2016, prior to his death on May 17, 2018, at age seventy-nine.6 His operating model prioritized physical service capacity and strategic highway positioning over aggressive financial engineering — an orientation that continues to shape the company's expansion playbook.
The one structural decision worth isolating. The founding era's most enduring operational choice was real estate ownership. At the end of 2025, Rush owned 120 of its 200 locations.1 While property ownership requires higher initial capital deployment and temporarily lowers reported return on invested capital compared to lease-dependent peers, it provides three structural advantages: it locks in long-term occupancy costs along key transit corridors, establishes tangible asset backing for acquired businesses, and insulates the company from lease renewal pressures during freight downturns.
This capital strategy remains evident in recent transactions, such as the Summit acquisition, which included $56 million in directly acquired real estate rather than assumed leases.7
Ultimately, understanding the company's origins clarifies its current financial structure. Rush operates less like a traditional vehicle retailer and more like an aftermarket service network. The primary features of its modern financial profile — its gross profit composition, absorption discipline, and real estate ownership — stem directly from operational decisions established during its first three decades. The 1996 public listing provided the financial capital to scale that model nationwide.
IV. Going Public & The First Wave of Consolidation (1996–2007)
Public equity changed the arithmetic of acquisition. A family selling a two-store International dealership in Missouri could take Rush stock or Rush cash; either way, the seller got liquidity and a succession answer that did not exist otherwise. Rush got locations.
The roll-up mechanics, honestly described. The standard telling of this playbook is that Rush bought underperforming regional dealers at four to six times EBITDA, dropped in proprietary operating systems, and expanded service bays. The strategic logic is real and visible in company filings. What is not publicly verifiable is the multiple. Rush has never disclosed acquisition EBITDA multiples in its SEC filings, making any specific transaction multiple attributed to its historical deals unsourced.
What the filings do disclose is deal value, which remains consistently modest relative to the company's cash generation — $16.3 million for Freeway Ford Truck Sales in Chicago in December 2023, $16.5 million for Nebraska Peterbilt in July 2024, and $25.6 million for the Leeds Transit IC Bus and Collins Bus operations in Ontario and Quebec.1 These are bolt-on transactions, funded directly from operating cash flow, floor plan borrowings, and mortgages.1
That capital pattern is itself the defining operational fact. Rush avoids transformational M&A in favor of a steady cadence of small purchases, most of which come with owned real estate. That structure carries a specific investment implication: downside risk on any single deal is bounded by the underlying land and buildings, creating a far lower risk profile than paying high goodwill multiples for a pure services business.
Why the sellers sold. The supply side of this roll-up explains why the acquisition opportunity persisted for decades. A commercial truck dealership is a capital-intensive, relationship-dependent business typically held by a single family, with most of the owner's net worth tied up in real estate and franchise agreements. When a founder reaches retirement, three structural problems converge: there is no liquid market for private equity, the OEM must approve any transfer, and the owner's heirs may not wish to manage a heavy vehicle service business.
Rush solved all three challenges simultaneously. It offered cash, held pre-existing relationships with the OEMs whose consent was required, and did not require the selling owner to remain in management. That combination established Rush as a structurally preferred buyer — not because it paid the highest price, but because it provided deal certainty.
Diversification beyond Peterbilt. During this period Rush added medium-duty franchises — including Hino, Isuzu, Ford, and IC Bus — expanding exposure beyond long-haul freight into municipal, construction, and last-mile delivery fleets.1 It also built out Rush Truck Leasing on the PacLease and Idealease franchise platforms.1 By the end of 2025, that division operated 55 franchised leasing locations across 21 states plus 5 in Ontario, managing a lease and rental fleet of 9,988 commercial vehicles.1
The leasing business is frequently misunderstood as a financing arm, but it functions quite differently. Substantially all of Rush's long-term leases "contain a service provision, whereby we agree to service the vehicle through the life of the lease."1 A full-service lease is therefore a multi-year contract that secures both the asset's residual value and its ongoing maintenance revenue stream for Rush.
When a vehicle reaches the end of its lease term, Rush sells it through its used vehicle operations, where it has "historically realized gains" on those sales.1 Commercial leasing is not an ancillary credit business; it is an aftermarket service engine secured by a multi-year service contract.
The operating system that made integration work. Rush's stated strategy relies on "management by dealership units": each location runs discrete departments — new vehicle sales, used vehicle sales, financial services, parts, service, and collision — with general managers evaluating each department separately against targeted performance metrics.1 Management maintains that this structure "enhances the profitability of all aspects of a dealership."1
Departmental tracking serves a clear operational purpose. A dealership operated under a single consolidated P&L can easily mask an underperforming parts counter behind a strong quarter of truck sales. Departmental accountability makes absorption measurable at every location, rendering cost discipline enforceable. It also streamlines acquisition integration: upon taking over a store, Rush applies departmental tracking to immediately identify which operations were previously being subsidized.
Rusty Rush described what happened next during a 2026 visit to three of five newly acquired Louisiana dealerships: "I told them, I said, look, one thing I can promise you is that a year from now, you are not going to know 50% of the customers in your shop." The reason is that Rush integrates new stores directly into its national account network. A single-market dealer serves only local fleets; Rush serves national fleets passing through the territory. Acquiring a location does not merely inherit local customers — it routes Rush's existing national network into the newly acquired service bays.
Annual revenue crossed $1 billion in 2004, accompanied by a second public offering.5 By then, the consolidation model had proven effective at scale. What remained untested was whether the network could withstand a severe cyclical collapse in commercial truck demand — a test that arrived on schedule.
V. The Inflection: GFC Survival & The Navistar Transformation (2008–2018)
During the 2009 financial crisis, North American Class 8 build rates fell sharply. Fleets halted new orders, leaving dealers reliant on vehicle sales to face high fixed overhead with little transaction volume.
Rush's facilities remained active because deferred fleet replacements increased repair demand on aging equipment. This countercyclical dynamic makes aftermarket service strategically vital, enabling Rush to emerge from the downturn as an industry consolidator rather than an acquisition target.
The asymmetry that a downturn creates. A commercial truck dealer's fixed expenses—facility overhead, parts inventory, service management, and insurance—depend on operational footprint rather than sales volume. A dealer whose parts and service departments cover only 80% of fixed overhead must fund the remaining 20% through vehicle sales gross profit. When truck sales drop by half, that overhead becomes unfunded, forcing staff reductions or distressed sales.
Conversely, a dealership with an absorption ratio of 130% maintains positive operating margins even during severe volume contractions. A downturn compresses profitability without threatening solvency. As financially strained competitors seek buyers at distressed valuations, a well-capitalized network can expand at favorable purchase prices precisely when industry-wide capital is scarce.
That operational dynamic played out during the 2009 recession and repeated during the 2025–2026 freight downturn, when Rush acquired dealerships across Ontario, Tennessee, and Louisiana during a deep freight contraction.49
The Navistar decision. In 2008, Rush acquired its initial International dealership franchises, adding nearly 80 locations in subsequent years.5 Structurally, this marked the company's most significant strategic pivot.
Prior to the acquisition, Rush operated exclusively as a PACCAR franchisee, tying its performance to a single manufacturer's product cycle, market share, and management decisions. The addition of International expanded its footprint across complementary geographies, with Peterbilt anchoring the Sunbelt and West, and International establishing coverage across the Midwest, Mid-South, and Ontario.1
While the acquisition diversified revenue, manufacturer concentration remained present. In 2025, sales of new Peterbilt commercial vehicles accounted for approximately 26.1% of total revenue, International for 14.7%, and all other manufacturers combined for 11.1%.1 These figures clarify that common industry references to PACCAR and Navistar generating 55% and 30% of total revenue, respectively, overstate vehicle sales contributions.
However, Rush's regulatory filings note that the majority of total revenue resulted from sales of trucks purchased from Peterbilt and parts purchased from PACCAR Parts.1 That distinction underscores that manufacturer concentration extends beyond vehicle sales into high-margin parts supply and distribution.
Rusty Rush takes over. W.M. "Rusty" Rush became President and Chief Executive Officer in 2006 and Chairman in 2013.5 His executive communication style on earnings calls is candid and direct. During the second-quarter 2026 earnings call, he addressed regulatory uncertainty around upcoming emission standards, noting that neither represented manufacturer had priced its 2027 engine technology: "Neither of the two OEMs I rep have priced new technology. How about that? Okay. So how am I to know what it will be?"
Management commentary across calls from 2023 through 2026 reflects a cautious approach to cycle forecasting, frequently acknowledging operational headwinds directly. For instance, on the February 2026 earnings call, Chief Executive Officer Rush noted a minor fourth-quarter drop in technician headcount without minimizing the trend: "I am not sure exactly why. I am not going to say it was dramatic, so I am not going to make any big deal of it."
The systems investment. While third-party accounts frequently attribute network-wide inventory visibility to a specific enterprise resource planning system, SEC filings do not identify the vendor.
Regulatory disclosures and earnings calls confirm that Rush implemented centralized management initiatives focused on reducing vehicle dwell time, optimizing parts delivery, and streamlining inspection workflows. Management attributes a measurable share of 2025's absorption performance to these operational processes.34
By the end of the decade, Rush had transformed into a multi-brand, geographically diversified dealership network with proven countercyclical resilience.
VI. Modern M&A & Capital Deployment: The Summit Deal & Beyond (2019–2022)
On December 13, 2021, Rush completed the largest acquisition in its history, purchasing operating assets of Summit Truck Group, LLC and its affiliates for approximately $205.0 million—excluding real estate—and separately acquiring Summit's real property for approximately $56.0 million, for a total transaction value of $261 million.7 The deal's funding structure underscored Rush's conservative capital deployment strategy: it financed roughly $102.0 million under its floor plan and lease-and-rental truck financing arrangements and drew the remainder from cash on hand.7
That structure illustrates the mechanics of Rush's capital discipline. Roughly 40% of the operating purchase price was funded through inventory-secured floor plan credit—debt collateralized by the trucks being financed that unwinds automatically as those units are sold. The balance was drawn directly from cash reserves. Rush avoided issuing equity or taking on unsecured debt, expanding its footprint using self-liquidating credit and available liquidity.
What Summit actually was. The acquired footprint spanned Arkansas, Kansas, Missouri, Oklahoma, Tennessee, and Texas, adding International, IC Bus, Isuzu, Dennis Eagle, and Landoll franchises along with Idealease leasing points—including facilities in Jonesboro, Lowell, North Little Rock, Pine Bluff, Russellville, Wichita, Topeka, Salina, Kansas City, Joplin, Springfield, Sedalia, St. Joseph, Cape Girardeau, and West Plains, among others.7 Crucially, most of the underlying real estate was owned rather than leased.7 Strategically, the acquisition filled key gaps in the Mid-South and lower Midwest along the heavy transport corridors where Rush's International dealership network previously lacked coverage.
Did Rush overpay? Because Rush did not disclose the acquisition EBITDA multiple in regulatory filings, outside observers cannot independently determine the precise valuation. Unverified market assertions that Summit was acquired for approximately 5.5 times pre-synergy EBITDA do not appear in company disclosures. However, post-acquisition performance metrics offer concrete data: Rush carried $441.6 million in goodwill at the end of 2025—roughly 99% of which was allocated to its Truck Segment—and has recorded no goodwill impairment.1
Integrating Summit while simultaneously launching a joint venture with Cummins required what Chief Executive Rusty Rush described during the fiscal 2022 earnings call as "extensive work required by our employees." The company delivered record financial results the following year. While the absence of goodwill write-downs across a decade of M&A suggests disciplined purchasing, it is not definitive proof, as goodwill impairment testing relies on internal discounted cash flow models that Rush's 10-K notes are "highly subjective."1
What Summit did to the balance sheet, and what it did not. The most telling metric from the transaction was one that did not expand. Rush avoided equity dilution to fund the deal, and its share count subsequently declined rather than increased: weighted average diluted shares fell from roughly 85.7 million in 2022 to 80.7 million in 2025.1 Completing the largest acquisition in corporate history while reducing diluted share count by roughly 6% over three years demonstrates that management financed network growth through operating cash flows rather than equity issuance.
This pattern diverges from common failure modes in industry roll-ups. Acquirers often issue shares during market peaks, only to find that acquired earnings fail to support the expanded equity base during subsequent downturns. Rush pursued the opposite sequence: acquiring assets with cash and collateralized credit, then repurchasing shares during cyclical lulls.
A caveat on the "Summit went from ~100% to ~130% absorption" story. Market commentary frequently attributes integration success to Rush raising Summit's legacy absorption ratio from roughly 100% to the network average. However, Rush reports absorption metrics exclusively at the consolidated level, leaving location-specific synergy claims unverified in official disclosures.1 While the consolidated absorption ratio did rise to 136.6% in 2022—the year following the acquisition's close—that direction of travel aligns with the narrative.2 Yet because 2022 also coincided with one of the strongest commercial vehicle pricing environments in modern history, isolating operational integration synergies from macro industry tailwinds remains impossible for external analysts.
The Cummins joint venture. On January 18, 2022, Cummins acquired a 50% equity interest in Momentum Fuel Technologies from Rush, forming Cummins Clean Fuel Technologies—a manufacturer of compressed natural gas (CNG) fuel delivery systems operating out of Roanoke, Texas.81 The joint venture combined Momentum's CNG storage assembly with Cummins' powertrain engineering, with long-term aftermarket support distributed through both Rush Truck Centers and Cummins dealer networks.8
The immediate financial impact was modest: combined with Rush's purchase of an additional 30% interest in its Canadian subsidiary—bringing its ownership to 80%—the transactions contributed $0.34 per diluted share to 2022 earnings on a pre-split basis. Strategically, the venture established low-cost optionality.
By transitioning a wholly owned manufacturing operation—an asset type outside a dealership's core operating model—into a joint venture with the leading independent engine producer, Rush preserved its servicing streams while reducing operational risk. If natural gas and renewable natural gas gain market share in Class 8 fleets, Rush retains exposure to hardware sales and maintenance; if adoption lags, capital exposure remains bounded.
A note on the "150 integrations without impairment" claim. Industry analysis often highlights Rush's history of completing more than 150 dealership integrations without recording a goodwill impairment. While SEC filings confirm that no goodwill impairments have occurred, the specific count of 150 acquisitions is not officially disclosed in financial reporting. Investors should treat the precise number as an industry estimate. Nevertheless, official filings validate the broader pattern: a series of small, conservatively funded, real-estate-backed acquisitions executed without subsequent asset write-downs.
The promise that has not aged well. In the fiscal 2022 financial results release celebrating the attainment of its 2017 target—reaching $7 billion in revenue at a 5% pre-tax return on sales—management established an updated five-year goal: "achieving revenues of $10 billion with a 6% pre-tax return on sales."2 By 2025, revenue stood at $7.43 billion while pre-tax return on sales fell to 4.6%, declining from 5.8% in 2023 and 5.0% in 2024.1 Both operational metrics have moved away from executive targets.
While a multi-year freight contraction offers context for the shortfall—and Rush previously achieved its 2017 target on schedule—the updated projection has largely faded from executive commentary without formal revision or withdrawal. Tracking the trajectory of long-term corporate targets highlights the distinction between adjusting strategic goals and letting them quietly lapse during cyclical downturns.
VII. The Engine Room: Segment Economics, Absorption Ratio & The Aftermarket Moat
The operational metric that defines Rush Enterprises is the absorption ratio, and its specific mechanics are critical to understanding the company's financial model.
Absorption ratio is calculated by dividing the gross profit from the aftermarket departments — parts, service, and collision — by the overhead expenses of all of a dealership's departments, excluding only the selling expenses of the new and used vehicle departments and the carrying costs of vehicle inventory.1 Management describes the metric as being "of critical importance."1
In operational terms, fixed overhead — facility leases, administrative salaries, utilities, and general corporate expenses — represents a recurring baseline cost regardless of vehicle sales volume. The absorption ratio measures the degree to which aftermarket shop operations cover that fixed burden independently. At 100% absorption, parts and service fully fund the dealership footprint. Consequently, as Rush's 10-K notes, "all of the gross profit from the sale of a commercial vehicle, after sales commissions and inventory carrying costs, directly impacts operating profit."1 Vehicle sales effectively translate into direct incremental margin.
With an absorption ratio of 130.7% in 2025, Rush's service bays covered company-wide fixed overhead with a 30.7% surplus.1 That aftermarket cushion explains how Rush generated $263.8 million in net income during a year when new Class 8 unit sales dropped 17.4%.1 It represents a key structural advantage, providing the primary defensive support for the business across a downcycle.
Evaluating the multi-year trajectory. The metric's historical trend requires careful context. Consolidated absorption stood at 129.8% in 2021, surged to 136.6% in 2022, and subsequently moderated to 135.3% in 2023, 132.2% in 2024, and 130.7% in 2025.21 In the second quarter of 2026, absorption reached 130.8%, compared to 135.5% in the prior-year period.9 Rather than reflecting permanent structural expansion above 135%, the peak level of 136.6% in 2022 was driven by severe supply-chain constraints and inflation-fueled repair pricing. The metric has since normalized back toward its 2021 baseline. While returning to roughly 130% does not signal fundamental business deterioration — 2021 was itself a prosperous period — assuming mid-130% absorption represents a normalized baseline overestimates steady-state earnings power.
Unpacking segment economics. Dissecting the 2025 revenue composition illustrates how profitability diverges by division. New and used commercial vehicle sales generated 60.6% of total revenue but accounted for only 26.7% of gross profit.1 New vehicle sales totaled $4.14 billion ($4,139.8 million), led by Class 8 heavy-duty trucks at $2.43 billion ($2,425.5 million) — representing 32.6% of total corporate revenue.1 Medium-duty commercial trucks excluding buses contributed $1.27 billion ($1,271.1 million), commercial buses added $239.4 million, light-duty vehicles brought in $179.1 million, and used vehicle sales totaled $363.7 million.1
In contrast, aftermarket parts and service generated $2.52 billion ($2,523.0 million) in revenue — 33.9% of the company total — while producing 63.7% of total gross profit.1 Embedded within aftermarket operations, warranty-reimbursed repairs generated $182.7 million, or 2.5% of overall revenue, with OEM reimbursements paid "at retail commercial rates."1 This warranty franchise creates a distinct operational moat: independent repair shops cannot bill manufacturers directly, lack proprietary OEM diagnostic software, and cannot hold factory authorization for key engine and component brands such as Cummins, Eaton, Caterpillar, and Allison in the manner of franchised Rush service centers.1
Commercial leasing and rental contributed $369.6 million, accounting for 5.0% of revenue and 7.0% of gross profit.1 Finance and insurance (F&I) produced $21.1 million — representing just 0.3% of revenue, though its "minimal direct costs" allowed it to generate 1.4% of gross profit.1 While highly profitable on a standalone margin basis, F&I remains a minor contributor to overall earnings, making claims that it represents 2% of total revenue inaccurate.
The economic divergence between parts and service. Aftermarket operations comprise two distinct activities. Parts distribution is a high-volume, lower-margin business increasingly subject to digital price transparency. Service repair is a high-margin, labor-intensive business constrained by physical shop capacity and technician availability.
During the February 2026 earnings call, Chief Executive Rusty Rush detailed this margin dynamic, noting that blended parts-and-service gross margin reached approximately 37% in the fourth quarter of 2025, following prior quarterly readings of 37.2%, 37.6%, and 35.8%. Executive guidance targeted maintaining margins within that historical band "regardless of inflation."
This departmental mix dictates overall aftermarket profitability. When revenue shifts toward parts and away from service labor, blended margins compress. That dynamic emerged in the first quarter of 2026 as rising parts sales combined with softer service volume to reduce gross margin. Addressing the softness, Rush attributed the compression to product mix: "that's why maybe our margin mix was down a little bit, because it comes into a mix, as you know, your margin is much higher on service than parts." Cross-checking internal figures against data from roughly 200 peer dealerships, management noted that service revenue was down 3% to 4% industry-wide, indicating that the quarterly decline stemmed from broader market deferred maintenance rather than company-specific execution issues.
Testing the recurring-revenue narrative. Executive commentary often characterizes aftermarket demand as operating "somewhat like a recurring revenue stream since older trucks require more maintenance."4 Contractual arrangements provide some foundation for this view: Rush ended 2025 with 3,733 vehicles under full-service maintenance contracts, alongside service provisions built into nearly all long-term vehicle leases.1 Furthermore, Rush Truck Leasing operates 70 PacLease and Idealease franchise locations managing over 10,000 vehicles in its fleet, with more than 2,200 units under contract maintenance agreements.9
However, the qualifying phrase "somewhat like" highlights an important operational distinction. Formal maintenance contracts cover several thousand vehicles within a service footprint that attends to hundreds of thousands of commercial trucks annually. The vast majority of aftermarket revenue remains transactional, subject to discretionary spending decisions by fleet operators. When freight rates drop, fleet managers routinely defer non-essential maintenance, explaining why aftermarket revenue contracts during industry downturns.
Margin stability and overhead control. Consolidated gross margin stood at 19.6% in 2025, unchanged from 2024 and down slightly from 20.1% in 2023.1 This margin stability occurred despite full-year revenue contracting 4.7% and gross profit declining 4.6%, while selling, general, and administrative (SG&A) expenses rose by $0.6 million — remaining virtually flat year over year.1
Maintaining stable gross margins during a revenue decline reflects disciplined cost control. Management distinguished variable selling expenses — sales commissions tied directly to vehicle delivery volumes — from controllable general and administrative overhead. On the first-quarter 2026 call, Chief Executive Officer Rush reported that G&A expenses fell approximately 2.5% year over year, attributing the reduction to deliberate cost adjustments: "We had to do cutbacks. But we did them, we executed, and we've done it before."
However, operating leverage in service expansion faces inherent structural limits. Management aims to convert 40% to 50% of incremental aftermarket gross profit into operating income, acknowledging that roughly half of top-line expansion must be reinvested in service labor and support staff. During the fourth-quarter 2025 earnings call, leadership reiterated an ambition to retain "50% or more" of incremental gross profit while noting that the historical three-year conversion rate averaged "in that 40% range." Because delivering service gross profit requires dedicated technician labor, structural expense expansion naturally caps operating margin leverage during cyclical recoveries.
The operational bottleneck in technician recruitment. The primary operational constraint facing Rush is neither capital availability nor real estate capacity, but the availability of skilled service technicians. Annual turnover among Rush technicians reached 35.0% in 2025, moderating from 38.1% in 2024, compared to a company-wide employee turnover rate of 26.0%.1
The company's annual report states that "the retention of skilled technicians is critical to the success of the Company" and underscores that "demand for technicians across the country is very high."1 In response, Rush has established mentorship initiatives, formal retention interviews, pay-transparency systems, and vocational training partnerships.1 Maintaining a 35% annual churn rate within the workforce responsible for generating nearly two-thirds of gross profit represents a continuous operational challenge. At the same time, this industry-wide labor scarcity reinforces Rush's competitive moat, as rival networks face identical labor constraints that cannot be overcome simply through capital deployment.
VIII. Modern Strategy, Management Credibility & The Hidden Bets (2023–Today)
By the winter of 2025, the freight recession had stretched past three years, and Chief Executive W.M. "Rusty" Rush had stopped describing the downturn in detached corporate terms. "I have had to watch the suffering for the last 3 years," he noted on the first-quarter 2026 earnings call regarding the company's customer base. On the same call, he reported that Rush's unassigned small accounts — representing roughly 30% of aftermarket revenue and its highest-margin business — had dropped nearly another 10% year over year following three consecutive years of double-digit declines.
Then, in the second quarter of 2026, operational performance stabilized. Rush generated $1.900 billion in revenue and $72.8 million in net income, or $0.91 per diluted share, compared with $1.931 billion in revenue and $72.4 million in net income, or $0.90 per share, in the prior-year period.9 Flat top-line revenue and slightly higher net income signaled a stabilizing trend rather than a cyclical surge, marking the network's first quarterly profit increase in several years.
During the quarter, Rush delivered 3,172 new Class 8 trucks in the U.S. even as broader domestic Class 8 retail sales fell 6.7% to 54,718 units, lifting the company's market share to 5.8%.9 Aftermarket revenue expanded 1.5% to $645.7 million, generating 64.0% of total gross profit.9 Reflecting cash generation, the board declared a three-for-two stock split payable August 31, 2026, and increased the post-split quarterly dividend 10.5% to $0.14 — marking its tenth dividend increase since initiating regular distributions in July 2018.9
Hidden bet #1: mobile service. Beyond its traditional dealership footprint, Rush has expanded a dedicated mobile service strategy. The company operates a fleet of mobile service units staffed by technicians who perform maintenance inside customer facilities.1 The operational logic relies on bringing service directly to client yards overnight while vehicles are idle, eliminating brick-and-mortar facility overhead and reducing vehicle downtime while improving technician utilization.
Rush does not disclose total mobile unit counts in SEC filings, making specific market estimates such as "500+ mobile service vehicles" unverified. However, management disclosures confirm significant investment: on the fourth-quarter 2025 earnings call, Rusty Rush noted that depreciation on mobile units rose by roughly $4 million year over year in 2025, with mobile operations expanding to represent the mid-30% range of relevant service volume. He also emphasized the multi-year return timeline, noting that "the payback comes back over the next five or six years as you ramp all that up. You would like to think it is all immediate, but it is not always all immediate."
Hidden bet #2: adjacency, deliberately. In 2026, Rush initiated targeted strategic expansion beyond its core vehicle dealerships. In the second quarter, the company completed the acquisition of five Peterbilt dealerships across Louisiana — in Baton Rouge, Houma, Lafayette, Lake Charles, and New Orleans — along with five commercial vehicle dealerships in southwestern Ontario.9 On July 23, 2026, Rush announced an agreement to acquire a 50% equity interest in MCT Holdings, LLC — a joint venture formed with MCT Companies, a major Carrier Transicold dealer group — for approximately $47.5 million.10
The joint venture will operate 17 transport refrigeration and auxiliary power dealerships alongside 3 mobile service locations across California, Nebraska, Kansas, North Carolina, South Carolina, and Virginia. Rush does not plan to consolidate the entity financially, and the underlying real estate will remain owned by an MCT affiliate and leased to the joint venture.10
Addressing the strategic shift on the second-quarter 2026 earnings call, Rusty Rush stated that the transaction represented a deliberate strategy: "No. It is not a one-off deal. We are committed to the space. We have studied the space for a while now. For well over a year." He added that management will "continue to look at other adjacencies that make sense around the core expertise of Rush Enterprises."
Analyzing the strategic expansion. Transport refrigeration represents a logically aligned adjacency, sharing customer bases, parts-and-service economics, and vehicle uptime priorities. Structuring the transaction as a 50% non-consolidated joint venture without acquiring real estate limits capital risk while keeping balance sheet obligations transparent.
However, entering adjacent product markets during a cyclical recovery carries operational execution risks. As management pursues broader service lines, performance will depend on whether adjacent acquisitions maintain core financial returns, reflecting Chief Executive Rush's observation that "proof of the pudding is in the eating. So we got work to do."
Governance and supplier-mandated control. Rush's dual-class share structure features distinct voting rights that are frequently mischaracterized. Class A common stock carries 1/20th of one vote per share, while Class B stock carries one full vote.1 Chief Executive Rusty Rush and affiliated entity 3MR Partners hold approximately 0.9% of outstanding Class A shares and 44.1% of Class B shares, giving him control of roughly 36.5% of aggregate voting power — "substantially more than any other person or group."13
Crucially, this concentrated voting structure is not merely an internal governance choice; control is contractually mandated by the company's primary supplier. Under Peterbilt franchise agreements, a change of control occurs if the aggregate voting power held by designated "Dealer Principals" — including Rush, Steven Keller, Corey Lowe, Jody Pollard, Jason Wilder, Michael Goldstone, Mike Eppes, Michael McRoberts, and select former executives — drops below 22%.
As of December 31, 2025, active Dealer Principals controlled approximately 40.8% of aggregate voting power.1 A change of control is also triggered if any individual other than Rusty Rush serves as Chairman and President or CEO without PACCAR's explicit written consent.1 If these terms are breached, Peterbilt retains the contractual right to terminate its franchise agreements.
These supplier requirements tie corporate continuity directly to executive management. Rush's annual report explicitly details this structural vulnerability, noting that the company has "no control over the transfer or disposition of Mr. Rush's, or his estate's, common stock," and warning that stock transfers outside the designated Dealer Principal group "may be triggered."1 Disclosures further acknowledge that these provisions "may prevent or deter prospective acquirers" and "may adversely impact the value of our common stock."1
The governance risk carries historical precedent. Following Marvin Rush's death, litigation emerged in Bexar County involving approximately $44 million in trust assets — including Rush Enterprises shares and 3MR Partners interests — with Rusty Rush alleging his father lacked capacity when executing power-of-attorney documents, while the defendant denied all claims.11 Although the litigation did not disrupt dealership operations, it highlighted that succession management within a supplier-constrained dual-class structure represents an ongoing operational consideration.
Executive compensation: correcting the record. Contrary to common assumptions that executive pay is tied to quantitative metrics such as net income, ROIC, or absorption thresholds, regulatory disclosures confirm that compensation relies on discretionary evaluation. The 2026 proxy statement notes that executive performance reviews are based on "a subjective assessment of each officer's accomplishment and contribution to the Company and is not based upon quantitative performance measures."3 Specifically, "Mr. Rush did not use any formula in determining his compensation recommendations," and the compensation committee "accepted, without modification," his compensation proposals for other named executives in 2025.3 CEO compensation was similarly approved "based upon its subjective evaluation."3 Shareholders vote on executive compensation on an advisory basis every three years, with the 2023 say-on-pay proposal receiving approximately 89% support.3
While subjective compensation structures allow board flexibility and avoid gaming formulaic targets, the committee maintains standard governance safeguards, including an independent compensation consultant, clawback policies, anti-hedging rules, and double-trigger severance provisions.3 Nevertheless, executive compensation remains discretionary, guided by controlling shareholder recommendations, and evaluated periodically through triennial shareholder votes.
IX. Hamilton Helmer's 7 Powers & Porter's 5 Forces Analysis
Evaluating competitive frameworks requires testing specific operating mechanisms rather than relying on generalized moat narratives.
Cornered Resource — weaker than advertised, but not absent. Popular narrative often cites exclusive franchise territories as Rush's primary moat. However, official disclosures confirm that Peterbilt and International agreements are nonexclusive and time-limited.1 What Rush actually corners is a subtler, physical advantage: an irreplaceable real estate footprint along critical freight corridors.
A network of 469 franchises across 200 locations—substantially sitting on company-owned real estate at high-density interstate interchanges—cannot be easily replicated by competing capital. Acquiring equivalent positioning requires securing prime physical sites, recruiting skilled labor, and obtaining manufacturer approvals. Crucially, each of Rush's franchise agreements "requires the consent of the relevant manufacturer for the sale or transfer of a franchise."1 That consent requirement acts as a structural filter, preventing rival networks from rapidly consolidating competing footprints.
Scale Economies — real, and visible in operating leverage. Scale advantages show up in cost containment during revenue downturns, such as holding SG&A virtually flat while annual revenue fell 4.7% and reducing general and administrative overhead by 2.5% during trough quarters.1 Centralized parts purchasing, a dedicated salesforce of roughly 390 outside parts-and-service representatives, unified warranty processing, and standardized shop protocols spread across 126 franchised truck centers reduce overhead per repair order below levels attainable by regional operators.
Scale also grants inventory flexibility. Large network capacity enables Rush to "absorb multi-unit trade-ins often associated with fleet sales and effectively disperse the used commercial vehicles for resale throughout our dealership network."1 While a regional dealer taking hundreds of trade-ins faces immediate inventory concentration risk, Rush redistributes pre-owned units across geographically diverse markets.
Switching Costs — moderate, with evidence grounded in contracts rather than software. Market commentary frequently points to deep software integration between Rush's service platform and corporate fleet dispatch systems. While SEC filings confirm Rush offers "a suite of telematics products" and "vehicle telematics support," disclosures do not identify a proprietary platform, quantify client adoption rates, or describe custom software integrations.1
Documented switching costs stem instead from contractual maintenance obligations: 3,733 vehicles operated under formal contract maintenance agreements at year-end 2025, alongside full-service leases that bundle routine repairs over the multi-year life of the asset.1 These contractual arrangements bind fleet maintenance to Rush facilities, whereas software-driven lock-in remains an unverified hypothesis.
Counter-Positioning — structurally durable. Independent repair shops face structural barriers that prevent them from competing directly with franchised dealership networks. Independents are excluded from receiving manufacturer warranty reimbursement at retail commercial rates, lack proprietary OEM engine diagnostic software, and cannot achieve factory-authorized service center status across major component manufacturers like Cummins, Eaton, Caterpillar, and Allison.1 As commercial vehicles become increasingly sophisticated, regulatory disclosures note that servicing modern powertrains "requires a significant capital investment in diagnostic and other equipment,"1 widening the technological gap between independent garages and franchised centers.
Applying Porter's Five Forces highlights an unusually lopsided industry structure.
Bargaining power of suppliers: high. PACCAR and International dictate vehicle build allocations, inventory delivery cadences, warranty reimbursement terms, franchise renewals, dealership transfer approvals, and executive voting ownership thresholds.1 Disclosures explicitly highlight this reliance in a dedicated risk factor: "We are dependent upon PACCAR for the supply of Peterbilt trucks and parts, as well as the financing of Peterbilt trucks."1 Corporate performance remains intrinsically tied to PACCAR's "overall success," the "continuation of its Peterbilt division," and "the maintenance of goodwill associated with the Peterbilt brand, which can be adversely affected by decisions made by PACCAR, Peterbilt and the owners of other Peterbilt dealerships."1 Consequently, Rush's operational destiny is partially bound to decisions made by its principal suppliers and peer dealer networks.
Threat of new entrants: low. High capital intensity, scarcity of highway-adjacent real estate, required manufacturer consents, and widespread technician labor shortages create formidable barriers to prospective market entrants.
Bargaining power of buyers: bifurcated. Large national fleets command volume pricing power, compressing vehicle sales margins. Management notes that while national accounts provide stable, recurring service volume, pricing terms are structurally lower than retail rates. Conversely, small unassigned fleet accounts—which historically generated over 30% of aftermarket revenue at premium margins—possess far less pricing power. Furthermore, buyer price sensitivity evaporates during vehicle breakdowns, when minimizing downtime takes precedence over repair rates.
Threat of substitutes: low. Rail transport offers an alternative for long-haul freight corridors but cannot replace last-mile distribution or specialized vocational applications—such as construction, refuse collection, and municipal fleets—that sustain baseline demand during freight downturns.
Competitive rivalry: regional for vehicle sales, nationwide for parts and service. Dealership sales competition occurs primarily between rival OEM brands within local markets rather than among same-brand franchises. However, parts distribution and routine service face intense nationwide rivalry from independent distributors and competing networks, generating periodic margin compression during industry slowdowns.
The synthesis for an investor: Rush's competitive advantages are fundamentally physical and operational rather than legal or contractual. While nonexclusive franchise agreements offer limited formal protection, a physical footprint comprising 200 highway-adjacent locations supported by skilled service personnel forms a tangible barrier that capital alone cannot quickly duplicate. Maintaining this physical moat, however, requires ongoing capital allocation and labor investment to preserve service capacity across industry cycles.
X. The Investment Spine: Bull vs. Bear Case & Activist Stress Test
The bull case, stated at its strongest.
Evaluating the bullish thesis begins with what the recent freight trough demonstrated. In 2025, with new Class 8 unit sales down 17.4% during the third year of an industry-wide freight recession, Rush generated $263.8 million in net income, produced $973.1 million in operating cash flow, and returned $251.5 million to shareholders — comprising $58.0 million in dividends and $193.5 million in share repurchases — while increasing its dividend for the seventh consecutive year.13 A cyclical company capable of expanding capital returns at the bottom of a severe downturn behaves differently from a traditional vehicle retailer.
Second, cyclical recovery is emerging with clear operational visibility. On the second-quarter 2026 earnings call, Chief Executive Rusty Rush reported that the company was "basically sold out" on Class 8 inventory for the remainder of the year, carrying "three quarters of solid backlog" and anticipating a second half "considerably stronger than the first half."9 Industry forecaster ACT Research raised its 2026 U.S. Class 8 retail sales forecast to 228,800 units — a 7.6% increase over 2025, up sharply from its February estimate of 211,300 units.91 Average fleet ages remain elevated, creating pent-up repair demand, while Rush's higher-margin small-customer accounts stabilized with a 4% sequential revenue gain in the second quarter following three years of double-digit annual contractions.
Third, the upcoming 2027 emissions transition may prove more constructive for Rush than standard pre-buy cycles suggest, primarily because regulatory mechanics prevent a sharp demand cliff. The EPA's framework incorporates nonconformance penalties (NCPs), permitting manufacturers to continue producing existing engine architectures by paying a compliance fee per unit.
Chief Executive Rush estimated these penalties at $6,000 to $8,000 per Class 8 engine, plus the standard 12% federal excise tax on vehicles priced well above $100,000, characterizing the structure as "fairly fair." He noted: "I do not consider 2026 a pre-buy year... I could see a 2027 with NCPs." Engine supplier Cummins plans to phase in next-generation technology while continuing older engine production through September 2027, and PACCAR intends to utilize nonconformance penalties. If this transitional framework holds, vehicle demand will spread smoothly across 2026 and 2027 rather than spiking sharply and collapsing — providing dealership operations with steady, multi-year throughput.
Fourth, vehicle sales momentum generates direct mechanical tailwinds for aftermarket operations. Delivering new commercial trucks drives immediate service demand through body upfitting, auxiliary power unit (APU) installations, and pre-owned vehicle reconditioning prior to resale — generating high-margin service revenue that accelerates because vehicle transactions occur rather than in place of them.9
The bear case, stated at its strongest.
The cycle remains the fundamental business driver, and prolonged downturns represent normal operating conditions. Historical Class 8 retail volumes — ranging from 195,687 units in 2020 to 281,440 units in 2019 — reflect the baseline cyclical volatility Rush must continually navigate.1 While high aftermarket absorption cushions baseline profitability, it cannot insulate total earnings from broader industry contractions. Net income declined from $391.4 million in 2022 to $263.8 million in 2025 — a 33% drop — while operating margin compressed from 6.5% in 2023 to 5.2% in 2025.1 Modeling the business as a smooth linear compounder misinterprets its underlying cyclical mechanics.
Aftermarket operations are less countercyclical than common narrative suggests. Management directly challenged the assumption that declining truck sales automatically boost repair activity. Addressing the topic on the first-quarter 2026 earnings call, Chief Executive Rush observed: "Theoretically, people believe that when truck sales go down, that you're going to get more parts and service. Well, that's not really actually the case because people are cutting back their budgets." During freight downturns, fleet operators routinely extend maintenance intervals and defer non-essential repairs. Consequently, parts and service demand is less cyclical than vehicle sales rather than countercyclical — a reality reflected in the three-year moderation of Rush's absorption ratio.
Electrification and autonomous driving pose long-term structural questions for terminal value. Regulatory filings explicitly acknowledge that alternative drivetrain technologies "could potentially have a material adverse effect on our parts and service business, as such vehicles are currently being described as potentially requiring less service and having fewer parts."1 Today, all major vehicle manufacturers represented by Rush offer electric-drivetrain options.1
Near-term adoption timelines have slowed due to shifting regulatory enforcement — including federal actions altering greenhouse gas standards and state waiver authorities, though these regulatory rollbacks remain subject to litigation.1 Furthermore, annual disclosures note that autonomous commercial vehicles could alter "the role of franchised dealers."1 While these technological shifts represent long-term considerations rather than immediate operational threats, they directly target aftermarket service — the division generating nearly two-thirds of corporate gross profit.
Concentrated supplier dependency limits corporate autonomy. Rush's financial returns depend heavily on strategic decisions made by PACCAR and International regarding vehicle allocations, component pricing, warranty reimbursement rates, and franchise renewals. Franchise agreements carry fixed expiration dates: Peterbilt agreements expire in June 2026, while International agreements expire between December 2026 and May 2030.1 Although routine renewal remains the baseline expectation, agreement continuations remain contractually subject to manufacturer approval.
Operating cash flow metrics reflect working-capital swings across the cycle. Reported operating cash flow of $973.1 million in 2025 significantly exceeded net income of $263.8 million, primarily because inventory liquidation generated $354.9 million as total inventory decreased from $1.79 billion to $1.53 billion during the sales slowdown.1 This cash release is a typical trough dynamic that reverses during recoveries, as working capital absorbs cash to rebuild inventory levels.
Additionally, of the $399.8 million in 2025 capital expenditures, $289.6 million funded commercial vehicle purchases for the rental and leasing fleet — representing income-generating fleet investment rather than facility maintenance capex.1 Consequently, free cash flow variations — moving from negative $73.2 million in 2023 to $186.5 million in 2024 and $573.3 million in 2025 — largely reflect cyclical working-capital mechanics rather than structural changes in core earnings power.1
The activist stress test. What would a skeptical, well-capitalized outsider attack?
Corporate governance features present obvious targets, but structural constraints limit external intervention. A dual-class capital structure with a 20-to-1 voting ratio, a controlling shareholder exercising 36.5% of aggregate voting power, discretionary executive compensation, and triennial advisory say-on-pay votes represents a governance profile that typically invites shareholder activism.13
However, external activists encounter a structural barrier mandated by the primary supplier: PACCAR requires designated Dealer Principal voting control as a condition of its franchise contracts. Unwinding the dual-class structure risks violating supplier agreements that govern franchises generating 26.1% of corporate revenue.1 While governance critiques remain valid, standard activist remedies are constrained by manufacturer contracts — a dynamic that regulatory disclosures note also acts to deter hostile takeovers.1
Capital allocation execution provides a strong defense against operational criticism. Rush repurchased $193.5 million of common stock during 2025, retiring shares when Class A prices traded toward cyclical lows near $45.67 in the fourth quarter.13 As equity valuations recovered, management moderated repurchase activity, deploying just $5.5 million toward buybacks in the second quarter of 2026 under a $150 million authorization while shares traded near multi-year highs.9
Executing aggressive repurchases during cyclical troughs and curtailing buying after price recoveries demonstrates counter-cyclical capital discipline. Simultaneously, regular dividend distributions have expanded without interruption, recording ten payout increases since initiating regular dividends in 2018, including a 10.5% increase announced alongside second-quarter 2026 results.9
Financial reporting complexity and segment disclosure represent genuine analytical vulnerabilities. Rush reports financial results under a single consolidated "Truck Segment," masking standalone line-item economics across commercial vehicle leasing, retail dealership operations, and body shop collision centers.1 Furthermore, corporate operations incorporate three partially consolidated or non-consolidated entities — a 50% equity interest in Cummins Clean Fuel Technologies, an 80% ownership stake in RTC Canada, and a 50% non-consolidated interest in MCT Holdings.110
Additionally, specialized ancillary units — including Perfection Equipment, Custom Vehicle Solutions, House of Trucks, World Wide Tires, and Chrome Country — account for 18 "other locations" whose detailed financial contributions are not separately disclosed.1 While this structure reflects operational integration rather than accounting obfuscation, aggregated segment reporting increases valuation friction for public market investors, with recent joint venture expansions adding unconsolidated entities to the corporate structure.
Balance sheet debt and inventory financing facilities require ongoing monitoring. Floor plan credit facilities with PACCAR Financial Corporation (PFC) and Bank of Montreal (BMO) expire in December 2029, remain subject to variable interest rates, and "may be terminated without cause upon 360 days' notice."1 Total outstanding debt stood at $1.55 billion against $2.20 billion in stockholders' equity at year-end 2025.1 While self-liquidating floor plan debt aligns with commercial inventory cycles, interest expenses fluctuate with inventory levels: net interest expense declined 34.7% in 2025 to approximately $46 million as vehicle inventory contracted, but will expand as dealer inventory is rebuilt during the recovery.1
XI. Key Performance Indicators (KPIs) to Track
Evaluating Rush Enterprises requires tracking three primary metrics, with one serving as the central indicator of long-term business health.
1. Absorption ratio — the primary operational metric. The absorption ratio synthesizes aftermarket gross profit, overhead cost discipline, technician productivity, bay utilization, and pricing power into a single quarterly figure. Analysts monitor the metric along two dimensions: absolute level and directional trend. Maintained above roughly 130%, the ratio indicates that parts and service operations fully fund fixed overhead, allowing commercial vehicle sales to flow directly to operating income at high incremental margins.
Directionally, the moderation from 136.6% in 2022 to 130.7% in 2025 reflects the three-year freight contraction, making a sustained uptick the primary signal of an aftermarket recovery.21 If Class 8 unit sales recover through late 2026 and 2027 while absorption continues to drift downward, it would indicate structural erosion in the service franchise—whether through compressed repair pricing, rising labor costs, or unfavorable product mix—weakening the central pillar of the investment thesis regardless of top-line earnings.
2. Aftermarket revenue growth, split between national and unassigned accounts. Total aftermarket revenue remained essentially flat in 2025 at $2.52 billion ($2,523.0 million), representing a 0.3% increase.1 Revenue composition carries greater analytical weight than the headline total because customer segments yield markedly different gross margins.
National accounts offer volume-driven, contract-priced revenue that dilutes overall margins. Conversely, small unassigned accounts—accounting for 30% to 32% of service volume—generate high margins but experienced a sharp three-year decline during the freight downturn. The 4% sequential revenue gain in unassigned accounts during the second quarter of 2026 represents a key leading indicator. If overall aftermarket revenue expands while blended parts-and-service gross margins compress below the 37% baseline reported in late 2025, top-line growth is being driven by margin-dilutive volume rather than high-margin pricing power.
3. New Class 8 U.S. market share, evaluated against broader industry cycles. Rush captured 5.8% of the domestic Class 8 market in 2025 and maintained that share in the second quarter of 2026, though market share spiked to 7.2% during the severely depressed first quarter of 2026—demonstrating that dealer market share arithmetic expands during sharp cyclical downturns and normalizes during recoveries.49 Management targets full-year 2026 market share between 5.8% and 6.3%.1 The critical signal to evaluate is market share expansion during an expanding market, which reflects structural competitive gain rather than denominator contraction.
Secondary operational indicators. Technician headcount and turnover establish the physical ceiling on service capacity. Improving upon the 35.0% technician turnover rate recorded in 2025 remains essential for expanding high-margin shop throughput.1
Additionally, total inventory—which contracted from $1.79 billion to $1.53 billion during the freight trough—must rebuild to support market recovery.1 The pace of inventory accumulation determines carrying costs via floor plan interest expense while securing vehicle availability. Chief Executive Rusty Rush confirmed that stocking trucks equipped with 2026-built engines ahead of the 2027 emissions rule represents a deliberate operational strategy.
Evaluating alternative metrics. Standard retail metrics such as days sales of inventory (DSI) prove unreliable for a network carrying $1.53 billion in vehicle inventory. Inventory levels fluctuate based on OEM manufacturing schedules and pre-regulatory stocking decisions, meaning elevated DSI can reflect strategic pre-positioning rather than weak customer demand. Similarly, physical bay counts fail to capture service capacity because Rush does not disclose bay numbers and expanding mobile service operations function without dedicated facility bays. The absorption ratio effectively incorporates overall capacity utilization and profitability into a consolidated figure.
Distortions in quarterly earnings. Quarterly net income figures are subject to timing distortions. Vehicle deliveries frequently lag inventory receipts—with trucks arriving in December often delivered to customers in January or February—while custom body upfitting requires between 32 days and 5 months to complete. Furthermore, first-quarter results reflect recurring seasonal headwinds from reset payroll taxes and the front-loaded recognition of roughly half of annual equity compensation expenses. Consequently, sequential quarter-over-quarter comparisons skew underlying performance, requiring year-over-year quarterly comparisons to evaluate steady-state progress.
XII. Playbook: Business & Investing Lessons
Lesson 1: Sell the razor at cost when the blades last ten years. Rush's new vehicle business generates roughly a quarter of gross profit on 60% of total revenue.1 In isolation, vehicle retailing is a low-margin endeavor. Viewed as the customer acquisition mechanism that secures a decade-long maintenance relationship across a client's fleet—generating trade-ins, body upfitting work, warranty repairs, and pre-owned vehicle sales—new truck sales function as an acquisition cost funded by a modest gross margin rather than a marketing budget. The generalizable principle is to identify which business line serves as the funnel and avoid evaluating it as if it were the core engine.
A critical constraint governs this logic: a customer acquisition funnel is only worth subsidizing if downstream capture remains durable. Rush's model holds because a commercial truck operates for ten years and requires specialized maintenance from franchised facilities equipped with factory software and warranty authorization. If vehicle service requirements diminish significantly—such as through rapid drivetrain electrification—the funnel logic inverts, reducing the operation to a standard low-margin retail business.
Lesson 2: Fixed costs become a weapon only above 100%. The absorption framework is the most transferable operational concept in this case study, applying across capital-intensive industries with recurring service income. Any operator managing a high fixed-cost footprint attached to recurring service demand can evaluate what fraction of fixed overhead the service stream covers independently. Below 100% absorption, cyclical downturns threaten solvency. Above 100%, cyclical vehicle sales yield pure incremental margin, turning industry downturns into expansion opportunities. Rush's 130.7% absorption ratio explains how the network acquired dealerships across Louisiana and Ontario during a severe freight contraction.9
However, a high absorption ratio is not inherently self-sustaining. Because absorption is a ratio, management can elevate the figure by reducing the overhead denominator as readily as by expanding aftermarket gross profit. A company that aggressively cuts operating expenses can report elevated absorption while reducing operational capacity. Rush's general and administrative expense reductions in 2025 and early 2026 supported its absorption ratio, though management acknowledged these adjustments required tangible operational cutbacks. Consequently, absorption metrics must be evaluated alongside absolute aftermarket gross profit trends rather than in isolation.
Lesson 3: Buy assets, not multiples—and let real estate establish the valuation floor. Rush's consolidation record relies on a steady sequence of modest acquisitions backed by physical property, including transactions of $16.3 million, $16.5 million, and $25.6 million, alongside the $261 million Summit acquisition, which included $56 million in directly acquired real estate.17
Financing acquisitions with self-liquidating floor plan credit lines and internal cash flow rather than dilutive equity or high-yield debt explains why three decades of network consolidation have produced no goodwill impairments.1 The strategic lesson is not that industry roll-ups are broadly effective—most destroy capital. Rather, roll-up strategies succeed when underlying assets possess independent liquidation value and transaction debt unwinds naturally through inventory sales.
Lesson 4: In a cyclical business, evaluate capital allocation by timing rather than magnitude. Rush deployed $193.5 million toward share repurchases in 2025 while Class A shares traded between $45 and $60, but reduced buybacks to $5.5 million in the second quarter of 2026 as equity valuations neared record highs.19 While corporate leadership routinely claims opportunistic capital deployment, few operational track records demonstrate consistent execution. The objective test requires overlaying a company's repurchase history against its long-term share price chart: if repurchases concentrate near market highs, stated capital discipline remains rhetorical.
Lesson 5: Rigorously audit reported competitive moats. Evaluating Rush Enterprises requires inspecting public disclosures rather than relying on industry narratives. Reviewing the company's 10-K reveals that OEM franchise agreements are nonexclusive and subject to periodic expiration, Class A shares carry one-twentieth of a vote per share rather than one-tenth, and executive compensation is determined subjectively without fixed quantitative formulas.13 Rush's competitive moat is operational and physical—rooted in strategic highway real estate, technician capacity, and manufacturer consent requirements—rather than a legally guaranteed territorial monopoly. Dissecting structural realities replaces conventional assumptions with verifiable operational facts.
XIII. Epilogue & Future Outlook
In August 2026, Rush Enterprises stands at a pivotal transition point: emerging from what its chief executive called the longest freight recession of his career, carrying its largest order backlog in years, preparing for a three-for-two stock split at the end of the month, and reflecting a market recovery from a fourth-quarter 2025 low of $45.67 to the high $70s.1
The company's outlook over the next eighteen months centers on three main variables.
The 2027 emissions transition, which is still being written. The EPA 2027 Low NOx rule is expected to take effect in January 2027 under proposed emissions limits, though the agency is also expected to modify related provisions—notably by reducing the required duration of manufacturers' engine warranties, which management identified as accounting for more than half of expected cost increases.1 Meanwhile, nonconformance penalties will allow manufacturers to continue selling proven technology at a premium, with regulatory comment periods extending through late July 2026.
The baseline expectation points to a two-year rolling demand cycle rather than a sudden spike and collapse. The primary risk is that Rusty Rush's historical observation proves predictive: "I have been around a long time. I have seen technology changes before. I have never seen one without a blip." He recalled 2010, when the adoption of selective catalytic reduction left "more clogged particulate filters around this country that you could shake a stick at"—a disruption that drove heavy repair volume into Rush's service bays. Ultimately, new emissions technology presents a dual dynamic: creating a headwind for truck margins while generating a tailwind for service revenue. Rush remains positioned on both sides of that economic trade.
Whether the adjacency strategy stays disciplined. The acquisition of a 50% interest in MCT Holdings is scheduled to close in the third quarter of 2026 for approximately $47.5 million, securing half of a transport refrigeration dealer network through a structured, non-consolidated joint venture.10 While management has signaled plans for additional adjacent acquisitions, future performance will depend on whether subsequent transactions preserve this conservative structure or signal a shift toward broader industrial diversification.
Whether the aftermarket franchise re-accelerates or keeps grinding. Aftermarket execution represents the central pillar of the investment thesis. As executive management noted during the fourth-quarter 2025 earnings call, "our aftermarket business is a much higher margin business than truck sales, and it acts somewhat like a recurring revenue stream since older trucks require more maintenance," which "has helped reduce earnings volatility across the truck sales cycle."4 Financial results between 2022 and 2025 supported the volatility thesis, as Rush maintained solid profitability throughout a severe freight contraction.
However, the historical record offers less support for top-line expansion: aftermarket revenue remained flat in 2025 after declining 1.8% in 2024, while the consolidated absorption ratio moderated in each consecutive year.1 The thesis for a sustained recovery requires fleet operators to clear deferred maintenance backlogs, small accounts to resume routine spending, and mobile service investments deployed in 2024 and 2025 to generate operational returns beyond their depreciation.
One more thing to watch, quietly. Rush executed a chief operating officer transition in early 2026. Jason Wilder served in the role until March 18, 2026, before being succeeded on March 23, 2026, by Jody Pollard, previously Senior Vice President of Truck and Aftermarket Sales.3 Corporate disclosures credit Wilder with directing the dwell-time reduction, parts-delivery optimization, and technician-retention initiatives that supported 2025 absorption performance, while crediting Pollard with driving medium-duty market share expansion and aftermarket customer diversification.3
Significantly, Rush maintains no formal employment agreements with any current executive officer.3 For a business whose primary supplier agreements name eight specific executives as "Dealer Principals" whose combined voting interest must remain above a contractual threshold, the absence of employment contracts represents a notable structural detail—leaving key franchise relationships dependent on leadership that is, formally, at-will.1
Sixty-one years after Marvin Rush opened a single GMC dealership in Houston, the company's competitive position rests on something physical and concrete: highway-adjacent real estate, stocked parts warehouses, and skilled technicians capable of repairing complex commercial powertrains. That physical infrastructure is costly to maintain and difficult for competitors to duplicate.
At the same time, Rush operates within structural boundaries: top-line revenue is governed by broader domestic freight movement, while inventory supply and governance terms are set by two major manufacturing partners. Marvin Rush's founding insight—that long-term profitability lies in keeping the truck running rather than selling it—has proven durable across six decades and multiple technology shifts. The central question for the next decade is whether that model survives a fundamental transition in the commercial vehicle itself.
References
-
Rush Enterprises, Inc. Annual Report on Form 10-K for the year ended December 31, 2025 — SEC EDGAR, 2026-02-25 ↩↩↩↩↩↩↩↩↩↩↩↩↩↩↩↩↩↩↩↩↩↩↩↩↩↩↩↩↩↩↩↩↩↩↩↩↩↩↩↩↩↩↩↩↩↩↩↩↩↩↩↩↩↩↩↩↩↩↩↩↩↩↩↩↩↩↩↩↩↩↩↩↩↩↩↩↩↩↩↩↩↩↩↩↩↩↩↩↩↩↩↩↩↩↩↩↩↩↩↩↩↩↩↩↩↩↩↩↩↩↩↩↩↩↩↩↩
-
Rush Enterprises, Inc. Reports Fourth Quarter and Year-End 2022 Results (Exhibit 99.1 to Form 8-K) — SEC EDGAR, 2023-02-15 ↩↩↩↩↩
-
Rush Enterprises, Inc. Definitive Proxy Statement (Schedule 14A) — SEC EDGAR, 2026-04-07 ↩↩↩↩↩↩↩↩↩↩↩↩↩↩↩
-
Rush Enterprises, Inc. Reports Fourth Quarter and Year-End 2025 Results (Exhibit 99.1 to Form 8-K) — SEC EDGAR, 2026-02-17 ↩↩↩↩↩↩↩
-
Rush Enterprises Founder W. Marvin Rush Has Died — Heavy Duty Trucking, 2018-05-18 ↩
-
Rush Enterprises, Inc. Form 8-K: Completion of Acquisition of Summit Truck Group Assets — SEC EDGAR, 2021-12-14 ↩↩↩↩↩↩
-
Cummins Completes 50 Percent Acquisition of Momentum Fuel Technologies from Rush Enterprises — GlobeNewswire, 2022-01-18 ↩↩
-
Rush Enterprises, Inc. Reports Second Quarter 2026 Results, Announces Three-for-Two Stock Split and $0.14 Per Share Dividend (Exhibit 99.1 to Form 8-K) — SEC EDGAR, 2026-07-28 ↩↩↩↩↩↩↩↩↩↩↩↩↩↩↩↩↩
-
Rush Enterprises, Inc. Form 8-K: Joint Venture Agreement with MCT Companies — SEC EDGAR, 2026-07-23 ↩↩↩↩
-
Family feud continues over estate left by the founder of Rush Enterprises — FreightWaves, 2019 ↩
 LinkedIn
 WhatsApp
 Reddit
 Hacker News
 Email
Email Kindle
 RSS Feed
 Spotify
 Apple Podcasts
 Amazon Music
 Audible
 YouTube