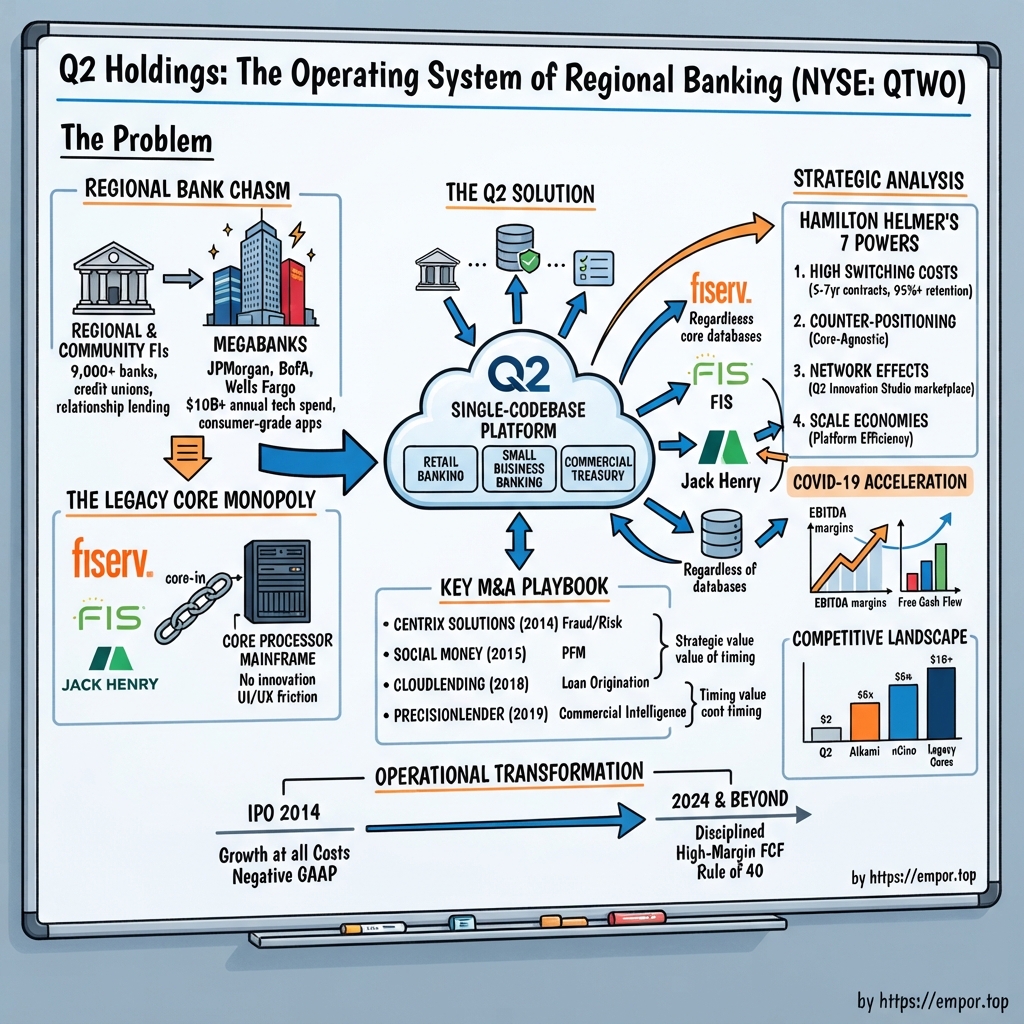
Q2 Holdings: The Operating System of Regional Banking
I. Introduction & Episode Roadmap
There is a particular kind of American business that nobody notices until it disappears: the community bank on the square in a Texas county seat, the credit union founded as a teachers' cooperative in 1953 that now serves forty thousand members, or the $8 billion regional lender that knows which local family runs the trucking fleet. These institutions do not air Super Bowl commercials or fund quantum computing labs. Yet for roughly fifteen years, they have fought an asymmetric war—because customers no longer judge financial institutions by their branch lobbies or loan officers, but by their mobile apps.
In an office park in northwest Austin, Texas, Q2 Holdings has spent two decades building the software that keeps those institutions competitive. As of December 31, 2025, Q2 served more than 1,200 financial institution customers, including more than half of the top 100 U.S. banks and more than half of the top 100 U.S. credit unions by assets.1 Its digital banking platform was installed at 457 institutions, supporting roughly 27.3 million registered account holders. During 2025, end users moved more than $4.0 trillion across the platform.1
That volume underlines the company's strategic position. Four trillion dollars of money movement—spanning deposits, wires, ACH batches, payroll runs, and commercial sweeps—flows through interfaces built and maintained by a firm with a market capitalization of roughly $4 billion.2 Q2 does not hold deposits or manage the core ledger; it owns the end-user experience and the analytical intelligence layered on top of it.
The central thesis of this case study is that Q2 provides an unusually clear lens on three core debates in enterprise software. First, whether "core-agnostic middleware"—software designed strictly to bridge modern interfaces with legacy backend infrastructure—is a durable business model or a temporary market gap. Second, how a growth-oriented SaaS company transitions under higher capital costs into a cash-generating enterprise, and whether its expanding margins reflect genuine operating leverage or temporary cost harvesting. Third, whether high switching costs in mission-critical banking software can withstand generative AI, or whether AI will lower the barrier to building custom solutions in-house.
Q2's financial reporting provides evidence for each side of these arguments. Full-year 2025 revenue reached $794.8 million, up 14.1%, while GAAP net income landed at $52.0 million—marking its first profitable year as a public entity following eleven consecutive years of net losses.13 Adjusted EBITDA expanded 49% to $186.5 million, and free cash flow reached $173 million.4 By the second quarter of 2026, the company had retired its final convertible note to operate debt-free while expanding its share repurchase authorization.4
At the same time, disclosures reveal lingering execution friction. Total annualized recurring revenue grew more slowly than subscription ARR as portions of the non-subscription business contracted. Annualized revenue churn rose to 5.2% in 2025 from 4.4% in 2024.4 Furthermore, executive compensation disclosures show that 2025 bookings reached 93.2% of internal targets, even as management publicly characterized the period as its strongest operational year.5
The narrative begins with the structural gap that created the opportunity—why the digital divide between tier-one banks and regional lenders became existential. It examines the founding by Texas banker-turned-entrepreneur R.H. "Hank" Seale III and the foundational architectural decisions that followed. The discussion then moves through the IPO era, the product expansion strategy, and an audit of the $510 million PrecisionLender acquisition executed near the 2019 valuation peak. It evaluates the impact of the March 2023 regional banking turmoil, leadership restructuring, cloud infrastructure completion, balance sheet deleveraging, and the commercial traction of Q2's AI product suite. Finally, the analysis stress-tests bull and bear cases against historical execution metrics to highlight the key operational indicators that will dictate future performance.
Everything begins with the operational reality of regional banking: a structural problem that community lenders were forced to navigate every day.
 Subscribe on LinkedIn
II. The Problem: The Regional Bank Technology Chasm
Consider a typical board meeting over the past decade at a regional institution in Ohio or Oregon. The chief executive of a $2 billion bank presents the quarterly deposit report, pointing to a persistent problem: the rising average age of new checking account holders. The bank is not losing existing clients, but it is failing to attract their children, who open accounts with money-center banks on their smartphones during a lunch break and never return.
Eventually, someone in the room states the obvious: "Our mobile app is bad." The board nods in agreement, aware of the flaw but unsure how to address it.
That gap defined the market Q2 set out to serve, driven by the stark arithmetic of technology spending in American banking. JPMorgan Chase, for example, allocated roughly $18 billion to firmwide technology expenses in 2025, setting aside about $8.0 billion specifically for new products, platforms, and features rather than routine maintenance.6 By contrast, a community bank with $2 billion in assets generates around $25 million in total annual revenue in a favorable year. The megabank's discretionary product budget alone is several hundred times the entire top line of a healthy community institution, making in-house software development financially impossible for smaller lenders.
This asymmetric competition became dangerous because consumer software sets user expectations across the entire market. Once a customer experiences a polished mobile banking application, all other banking interfaces are judged against that benchmark. A community bank does not need to match a money-center bank across every capability, but its primary digital touchpoints cannot lag behind. Technical friction in mobile deposit capture or bill pay gradually erodes the relationship-lending advantage that community institutions spent decades establishing.
The core problem, in plain language
Understanding why this gap proved so difficult to bridge requires examining the role of a bank's core processing system. The core is the central ledger—the database of record tracking account balances, transaction times, and interest accruals. Most American financial institutions license their core ledgers from one of three major vendors: Fiserv, FIS, or Jack Henry & Associates. Many of these legacy systems trace their architectures back to mainframes designed when user interfaces consisted primarily of green-screen teller terminals.
Historically, the digital banking front end—the website and mobile app—came bundled directly from the core provider. While convenient, this arrangement created a structural disincentive for incumbents to innovate. Because replacing a core ledger requires a complex, multi-year migration that carries substantial operational risk, financial institutions rarely switched providers over user-interface flaws alone. Consequently, core vendors faced little commercial pressure to invest heavily in modern mobile software compared to specialized software firms.
These dynamics created a classic counter-positioning opportunity for independent vendors. Core providers operated on business models that prioritized core ledger retention over user experience. In its regulatory filings, Q2 highlights the operational friction this caused for financial institutions, noting that integrating applications across multiple legacy vendors increases complexity while aging infrastructure presents a "multitude of challenges."1
Why nobody could simply build it
Three main structural barriers prevented software competitors from addressing this gap sooner.
First, regulatory compliance creates a high entry threshold. Digital banking software must operate within a strict regulatory framework governing consumer protection, data privacy, third-party risk management, and ongoing state and federal examinations. As Q2 notes in its business disclosures, compliance requirements depend on software functionality, design, provider classification, and end-user deployment—making regulatory adherence a continuous operational requirement rather than a static checklist.1 Early-stage startups lacking regulatory experience and examination history struggled to gain credibility with bank boards.
Second, security obligations compound vendor risk. Digital fraud has expanded alongside online adoption, with attack vectors evolving continuously—a risk factor Q2 explicitly highlights, including the growing deployment of artificial intelligence by malicious actors.1 Because adopting a third-party digital front end effectively delegates a portion of a bank's security boundary, institutions mandate stringent operational track records before inviting vendors to bid.
Third, technical integration serves as the primary operational moat. Developing a modern interface is insufficient unless it connects seamlessly to legacy core ledgers, payment card processors, bill-pay networks, wire transfer systems, and loan origination platforms. As of recent disclosures, Q2 maintains more than 1,000 integrations across more than 60 product offerings.1 Building and maintaining this complex integration matrix creates significant defensibility, preventing competitors from winning market share on user interface design alone.
These dynamics created a specific market need: mid-market financial institutions required a cloud-based, multi-tenant digital banking platform designed for banking compliance that could integrate across any back-end ledger without forcing a core replacement. Building this layer required deep domain expertise in community banking operations and legacy infrastructure.
III. Founding & Core-Agnostic Breakthrough (2004–2013)
R.H. "Hank" Seale III founded Q2 after building two prior companies focused on the same core problem: providing community financial institutions with scaled technology solutions. Seale holds a B.S. in Agricultural Economics from Texas Tech University.7 In February 1991, he co-founded Regency Voice Systems, which provided automated voice-banking software to community lenders until Transaction Systems Architects acquired the company in May 1997.7 Voice banking served as an early digital channel, allowing smaller institutions to offer automated account balances over the telephone without building custom infrastructure.
In 1997, Seale founded Q-Up Systems, serving as chairman and chief executive officer to deliver web-based online banking software to community banks and credit unions. Atlanta-based S1 Corporation acquired Q-Up Systems in April 2000, after which Seale led S1's Community and Regional Solutions Group until August 2001.7 Following a two-and-a-half-year departure from executive roles, Seale observed how software platforms performed after integration into broader financial technology conglomerates.
In 2004, Seale launched Q2 with the vision of providing a single system to address the technology needs of community-focused banks and credit unions.8 The entity incorporated in Delaware in March 2005 under the name CBG Holdings, Inc., before renaming to Q2 Holdings in March 2013.1 Seale served as chief executive officer from March 2005 until October 2013, and as president for the first three years of that tenure.7
The single bet
Q2's foundational architectural decision was to build a digital experience layer independent of the underlying core processing ledger.
While core-vendor competitors offered front-end software tightly coupled to their proprietary back-end systems, Q2 developed an abstraction layer. This integration matrix acts as an intermediary layer, keeping the user interface uniform across client institutions while connecting seamlessly to back-end ledgers from providers such as Jack Henry, Fiserv, or FIS.
This core-agnostic design yields significant strategic positioning for customer institutions. On the company's first quarter 2026 earnings call, Chief Executive Officer Matt Flake noted that institutions select Q2 partly because "they have the freedom to go with whatever core they want because we have all the integrations," adding that maintaining an independent front end gives clients "some leverage in the negotiations on the back end with the core providers."9 By insulating the digital interface from the core ledger, Q2 enables banks to evaluate or replace back-end providers without disrupting the customer-facing application.
A second architectural decision involved constructing retail banking, small business banking, and commercial treasury management on a single codebase. Commercial treasury services—such as Automated Clearing House (ACH) origination, wire templates, positive pay fraud mitigation, and multi-tiered approval workflows—require complex permission logic distinct from consumer banking. Developing a unified architecture required higher upfront investment than building single-purpose point solutions.
During the first quarter 2023 earnings call, Flake recalled that Q2's initial 2004 codebase included ACH, wire transfers, tax payments, and entitlements, followed by substantial further investments in treasury capabilities roughly twelve years prior.10 Flake emphasized that competitive defensibility in commercial banking relies heavily on operational execution: "you can write the software and you can deliver the code, but the experience around delivering the software, converting from legacy systems, providing a support infrastructure around those customers and integrating into the systems that are different than retail — it takes a long time."10
The crisis that helped
During the 2008–2009 financial crisis, Q2 operated as a small private vendor selling to regional and community lenders seeking cost efficiencies amid severe sector stress. Because digital channels provided lower transaction costs relative to physical branch operations, economic headwinds accelerated interest in self-service software.
The period also saw key executive leadership take shape. Matt Flake joined Q2 in June 2005 as Vice President of Sales.5 Flake had previously served as Regional Sales Manager at Q-Up Systems from 1999 to 2002 and as Regional Sales Director at S1 Corporation from 2002 until joining Q2.5
Flake was appointed President in March 2008, Chief Executive Officer of the operating subsidiary in December 2011, and CEO of Q2 Holdings and a board member in October 2013.5 Managing the company with an emphasis on sales execution, Flake commented on sales capacity during the second quarter 2026 earnings call when questioned about expanding the sales force: "more sales reps doesn't always solve the problem. It shrinks commission rates, the amounts of wins. And so I want to make sure as a salesperson myself, I want to make sure they can make as much money as they possibly can."11 This focus on individual quota productivity and rep compensation reflects management's cautious approach to scaling distribution capacity relative to market demand.
By year-end 2013, Q2 served over 330 financial institution customers supporting 3.1 million registered end users, with annual transaction volume surpassing $200 billion.12 Although the company remained unprofitable on both a GAAP and cash-flow basis, its expansion metrics and high-retention enterprise SaaS profile positioned it for an initial public offering in 2014.
IV. Going Public & The Mid-Tier Consolidation Playbook (2014–2018)
Q2's common stock began trading on the New York Stock Exchange under the symbol QTWO on March 20, 2014, priced at $13.00 per share.12 The offering closed on March 25, with 7,760,870 shares sold, and the underwriters exercised their over-allotment for an additional 1,164,131 shares on April 2. Net proceeds to the company were $86.3 million after $10.1 million of underwriting discounts.12 The stock traded as high as $17.38 in its first partial quarter as a public company — and as low as $9.62 in the second.12 Whatever else the IPO was, it was not a coronation.
What Q2 actually looked like at the moment of listing is worth stating precisely, because it frames everything that followed. At year-end 2014 the company had over 360 customers with more than 4.3 million registered retail and commercial users, who executed over $265 billion of financial transactions during the year.12 Revenue was $79.1 million. The net loss was $19.6 million.3 Customers were spread across 47 states and included names like Camden National Bank, Rockland Trust, and Umpqua Bank.12
The economics underneath were the classic land-and-expand SaaS structure, but with an unusually long fuse. Contracts ran multi-year — the initial term of digital banking platform agreements has consistently averaged over five years.1 Pricing was tied to registered users and to how many solutions the institution bought. Implementation was slow, expensive, and painful for both sides. Flake has a line he uses about this: it takes nine months to make a baby and twelve months to deliver digital banking.9
That implementation friction is the single most misunderstood feature of the business. It suppresses growth — revenue from a signed deal may not appear for a year. It also creates the switching cost. An institution that has just spent a year of internal project management, retrained its branch staff, and migrated its account holders is not going to repeat that exercise casually. The company's own long-run data quantifies the payoff: digital banking platform customers have historically grown contracted revenue by approximately 61% within 48 months of implementation.1 That figure is the entire land-and-expand thesis in one number — the initial contract is roughly two-thirds of what the relationship becomes within four years.
Buying the gaps
Between 2015 and 2018 Q2 ran an acquisition program with a consistent logic: buy the adjacent capability that a commercial banking customer will ask about in the RFP, rather than build it and lose two years.
In 2015 came Centrix Solutions, adding treasury management, compliance, risk management and bank operations tooling — the unglamorous machinery that makes a vendor credible to a commercial banking department rather than just a retail one.8 Later that year Q2 acquired Social Money, the Des Moines company behind the SmartyPig goal-based savings product, bringing cloud-native deposit components into the portfolio.13
In August 2018 the company announced an agreement to acquire San Mateo-based Cloud Lending, a SaaS provider of an end-to-end lending and leasing platform, closing in October.1415 Flake's framing at announcement was strategically revealing: lending is the "fundamental income-generating activity" of a community or regional institution.14 Until that point Q2 had been, in balance-sheet terms, a deposit-side vendor. Cloud Lending was the first serious move to the asset side. In November 2018 Q2 added Gro Solutions, a digital account opening and cross-sell platform.15
Look at the pattern rather than the individual deals. Q2 was systematically buying its way from "the app your retail customers use" toward "the software layer a bank runs its customer-facing business on." Each acquisition also widened the cross-sell surface inside an installed base that was, by construction, hard to leave.
The tier ladder
By this period Q2 had settled into the segmentation language it still uses. Institutions are grouped by asset size — Tier 1 and enterprise at the top, running to the largest banks in the country, down through Tier 2 and Tier 3, which Flake has described as "the bread and butter of this business, banks and credit unions between $500 million and $10 billion."9
Moving up that ladder was the defining strategic project of the late 2010s, and it was not obvious it would work. Selling to a $700 million credit union and selling to a $40 billion bank are different businesses: different procurement, different security review, different tolerance for failure. Flake's argument, made repeatedly, is that the ladder is one-directional — a vendor who has converted a $15 billion bank can credibly bid for the next one, and a vendor who never has cannot. "They're not going to take their chance with their crown jewels to go to somebody who's never done it before."10
Revenue over this stretch compounded from $79.1 million in 2014 to $241.1 million in 2018, roughly tripling in four years.3 Losses widened rather than narrowed — the 2018 GAAP net loss was $35.4 million.3 This was, unambiguously, the growth-at-any-cost playbook, and in the capital markets of 2018 it was rewarded.
Which set up the moment where a management team with a rising stock, cheap convertible debt available, and a strategic gap in its commercial portfolio decided to write the largest check in company history.
V. The PrecisionLender Bet & The M&A Capital Allocation Audit (2019–2021)
In June 2019, Q2 issued $316.3 million of 0.75% convertible senior notes due June 2026, with an initial conversion price of approximately $88.61 per share.1 With its stock trading in the seventies, the company secured low-cost capital backed by strong public market sentiment.
Four months later, on October 1, 2019, Q2 announced an agreement to acquire PrecisionLender.16[^17] The transaction closed at the end of that month for approximately $510 million in cash.17[^17]
What $510 million bought
PrecisionLender, based in Charlotte, North Carolina, targeted a specific operational friction point in commercial banking. When a commercial banker negotiates a $4 million loan, the pricing decision historically relied on static spreadsheets, internal pricing desks, and subjective judgment. PrecisionLender delivered real-time, data-driven pricing intelligence directly to bankers during negotiations, using an AI assistant called Andi to surface dynamic recommendations. At closing, the platform served approximately 150 financial institutions with assets ranging from under $1 billion to over $1 trillion, supporting more than 13,000 active bankers.17
That customer base carried significant strategic value. PrecisionLender served institutions well above Q2's core target market, making the transaction both a product expansion and a major distribution key. It provided immediate entry into tier-one relationships that Q2 had spent a decade attempting to reach.
The overpayment audit
The acquisition came at a high cost that warrants rigorous inspection.
Q2 paid approximately $510 million for a company that contemporary industry reports indicated generated modest revenue relative to its price tag.[^17] Executed in October 2019 at the height of pre-pandemic software valuations, when high-growth enterprise SaaS companies traded above fifteen times forward revenue, the deal made Q2 a buyer in an expensive seller's market.
Three main operational and financial criticisms emerge from the evidence.
First, the funding structure created hidden leverage. While corporate disclosures framed the transaction as a cash purchase funded from balance sheet reserves, that cash stemmed primarily from the June convertible bond issuance.17 Q2 effectively leveraged its balance sheet ahead of the purchase and subsequently added another $350.0 million in convertible notes in November 2020.1 By year-end 2021, the company carried substantial debt, posted a GAAP net loss of $112.7 million, and generated $33.1 million in annual interest expenses.3 Consequently, Q2 entered both the COVID-19 pandemic and the 2022 interest rate reset with uncharacteristic leverage.
Second, integration drag weighed on financial performance over multiple years. Amortization of acquired intangibles, deal integration expenses, and purchase-accounting deferred revenue haircuts depressed operating results, causing net losses to widen in 2020 and 2021.3
Third, management shifted away from aggressive M&A. On the second quarter 2026 earnings call, Chief Financial Officer Jonathan Price observed that "we haven't done deals and it's been over 5 years since we've done anything," framing future dealmaking as opportunistic rather than programmatic.11 While a multi-year acquisition pause does not automatically signal failure, it underscores the capital discipline required after absorbing a major deal.
The verdict, on the evidence available in 2026
Evaluating the long-term impact reveals how the asset evolved within Q2's broader product portfolio.
Relationship pricing became one of Q2's three core product pillars alongside digital banking and risk management. On the second quarter 2026 earnings call, CEO Matt Flake noted that Q2 served 9 of the 14 largest banks in North America—and separately 9 of the top 15—with relationship pricing software.11 Price added that relationship pricing deal sizes frequently matched or exceeded large Tier 1 digital banking contracts.11 During the same quarter, a top 25 U.S. bank expanded its relationship pricing contract after initially adopting Q2's digital banking platform in 2023 and risk solutions in 2025.11
The strategic rationale also proved durable across rate cycles. On the first quarter 2023 earnings call, then-President Kirk Coleman explained that PrecisionLender was expanding to price "both sides of the balance sheet," adding deposit and treasury management capabilities alongside commercial loans. Coleman noted that "on the deposit side of the balance sheet the real money is made when you can charge for treasury services"—a capability that gained relevance during the regional banking deposit competition later that year.10
Ultimately, Q2 paid a premium valuation that constrained its balance sheet during a volatile macroeconomic period, but acquired a strategic asset that permanently elevated its enterprise footprint. The high purchase multiple and extended integration timeline presented real operational friction, yet the strategic repositioning remained intact.
The pandemic and a smaller bolt-on
The pandemic accelerated digital channel adoption as physical branch closures forced reluctant account holders online. Registered user counts and transaction volumes expanded rapidly, reinforcing the operational necessity of digital banking software.
In 2021, Q2 acquired ClickSWITCH to address friction in account onboarding by automating direct deposit transfers and recurring payment migrations.8 The specialized tool targeted a key retention barrier, helping institutions convert newly opened accounts into active primary relationships.
That same year, Q2 launched Innovation Studio, establishing a partner marketplace and developer ecosystem designed to expand platform functionality.8
VI. SVB Shockwaves, Embedded Banking (Helix), & Innovation Studio (2022–2024)
On Friday, March 10, 2023, regulators closed Silicon Valley Bank. Over the following weeks, Signature Bank failed, and First Republic Bank was seized and sold. For a software provider whose customer list is almost by definition American regional and community financial institutions, this was a difficult operational environment.
The market reaction to Q2's stock was swift and severe. Investors reasoned that if regional banks were failing, Q2's core customers were failing; if surviving banks grew cautious, IT budgets would freeze; and if bank charters consolidated, the addressable customer count would shrink.
What unfolded inside the business over the following eight weeks proved far more nuanced, as management provided specific operational data rather than broad assurances.
The number that mattered
On the first-quarter 2023 earnings call in May, analyst Alex Sklar asked what share of the quarter's bookings closed after March 10.
CEO Matt Flake answered that 35% of the quarter's bookings closed after the SVB collapse.10
That disclosure was revealing because software bookings are typically back-half weighted, meaning a collapse in late March would have registered immediately in that metric. Instead, Q2 reported its strongest digital banking bookings quarter to date and record win rates, with request-for-proposal (RFP) activity rising 40%.10
Flake explained the underlying commercial mechanism. During the deposit-insurance scare, customers of regional institutions opened accounts at money-center banks. When those depositors experienced megabank digital interfaces, they returned to their local institutions demanding comparable capabilities. "It really is driving a lot of demand in the pipeline for us," Flake noted.10 Rather than freezing technology budgets, the crisis highlighted the digital gap.
Management also disclosed where the fallout did inflict damage. Larger client institutions curtailed discretionary professional services spending, such as staff augmentation and efficiency projects that require upfront expenditure before yielding savings. Consequently, Q2 lowered its full-year revenue guidance to reflect reduced professional services while simultaneously raising its adjusted EBITDA forecast, as the lost services revenue carried thin profit margins.10 Separately, the company disclosed that First Republic Bank had accounted for 2.5% of 2022 revenue, primarily in professional services.10
The analytical takeaway was clear: Q2's subscription core remained resilient during systemic banking stress, while its professional services segment proved vulnerable. That distinction persisted, explaining why total ARR continued to grow more slowly than subscription ARR into 2026.
Industry consolidation also demonstrated an asymmetric impact. First Citizens, which acquired Silicon Valley Bank, was already a Q2 client.10 By 2025, in 93% of M&A transactions involving a Q2 customer, the combined institution selected Q2 as the go-forward platform.4 While bank consolidation reduces total industry charters, it has historically increased the asset size of Q2's retained client base.
Innovation Studio: the two-sided platform
Q2 Innovation Studio operates much like an enterprise smartphone app store for financial institutions.
A community bank rarely maintains the engineering staff to build custom credit-score monitoring tools, small business accounting integrations, or generative AI chatbots. Historically, adding third-party features required custom integration projects spanning multiple quarters. Innovation Studio alters that dynamic: fintech partners integrate once using Q2's software development kit (SDK), making their solutions available for institutions to deploy across Q2's installed base in a fraction of the traditional implementation timeline.18
This framework generates two-sided network effects. A larger pool of bank end users makes the platform more attractive to fintech developers, while a broader catalog of partner solutions enhances platform appeal to prospective financial institutions. Q2 earns a revenue share on partner integrations, which generates high margins due to minimal incremental delivery costs.
Adoption metrics demonstrate steady traction. By early 2023, more than 300 digital banking customers representing roughly 16 million end users utilized Innovation Studio, alongside more than 120 integrated technology partners. Management noted that Innovation Studio was cited as a key factor in approximately 75% of digital banking contract wins that quarter.10 By 2025, Flake stated that nearly every net new digital banking contract included Innovation Studio, and by mid-2026 the partner ecosystem surpassed 200 providers.411
CFO Jonathan Price illustrated the financial impact during the 2023 call, citing a $500 million asset bank in Tennessee that added six partner solutions within twelve months—including credit scoring, mortgage origination, and an AI chatbot. The institution projected over $1 million in combined revenue gains and cost savings in 2023 alone from software it did not build in-house.10
However, Q2 does not separately disclose Innovation Studio revenue. While management emphasizes its strategic importance and favorable margin profile, Price acknowledged in 2026 that customers remain "very early in their adoption cycle of how many products are they consuming."9 Consequently, the platform is best evaluated as a key driver of contract win rates with undisclosed direct standalone economics.
Helix: the optionality that got repositioned
Helix represents Q2's cloud-native core processing and banking-as-a-service (BaaS) platform, providing the core ledger itself rather than the front-end digital interface.[^20] Its initial go-to-market strategy targeted fintechs and consumer brands seeking to offer branded deposit accounts by partnering with chartered sponsor banks.1
Helix's commercial model differs from Q2's core SaaS platform. Agreements generally carry lower minimum contract commitments and rely on usage-based revenue recognized as services are delivered.1 This creates higher growth potential when partner volume expands, alongside greater revenue variability when usage fluctuates.
During the March 2023 banking turmoil, Helix demonstrated operational flexibility. Price noted that Q2 helped a client transition to an alternative partner bank within 24 hours of SVB's failure, onboarding approximately 300,000 end users in the process.10 At the time, Helix supported over 14 million total end users.10
Subsequent market dynamics led management to reposition the platform. Heightened regulatory scrutiny of BaaS partnerships created industry headwinds—a risk factor Q2 explicitly outlined in its regulatory filings.1 On the first-quarter 2026 earnings call, Price addressed the strategic pivot, stating that Helix "was largely built around the fintech and brands when the BaaS space was more in vogue and was growing faster." Price noted that Q2 is refocusing Helix toward traditional financial institutions for retail banking applications.9
This shift marks a clear strategic adjustment. Q2 estimates the addressable market for Helix, including open platform and BaaS solutions, at approximately $3.0 billion out of an estimated $23.0 billion total market opportunity.1 Sized against Q2's broader portfolio, Helix provides incremental optionality rather than serving as the primary corporate growth driver.
VII. Current Management & Operational Transformation (2024–Present)
On May 10, 2024, Q2 announced that Chairman R.H. "Hank" Seale III would not stand for re-election when his term expired on June 11, 2024. The board appointed Seale chairman emeritus, and Chief Executive Officer Matt Flake succeeded him as chairman effective that date.19
Seale's departure statement focused on the core mission behind the firm's founding: "Two decades ago, we built this company with a mission to help community banks and credit unions thrive."19 Flake thanked him for "nearly 20 years of remarkable service."19
Combining the chairman and CEO roles represents a consolidation of authority that governance-focused investors often scrutinize. The primary institutional counterweight at Q2 is a board composed mostly of independent directors, backed by equity ownership guidelines requiring non-employee directors to hold stock worth at least four times their annual cash retainer—a threshold every non-employee director met as of December 31, 2025.5
The revolving President's chair
While management messaging often emphasizes long-term stability, executive roles below the chief executive have undergone recurring shifts.
Kirk Coleman—a former Accenture partner, Texas Capital Bank executive vice president, and Q2 customer—joined the company as Chief Banking Officer in December 2021 before stepping up to President in May 2023.5 At the time, Flake described the appointment as a way to deepen the executive bench, giving Coleman operational oversight while Flake focused on strategy, culture, and key customer relationships.10
In November 2025, Coleman shifted to Chief Business Officer, and Flake reassumed the role of President.5 The move marked the second time Q2 created and subsequently reabsorbed the presidency: Flake previously held the title from March 2008 to August 2016 and again from March 2019 to May 2023.5
Finance leadership saw a parallel transition. David Mehok, who managed financial operations through the 2023 banking crisis and early margin expansion, was succeeded as Chief Financial Officer by Jonathan Price in November 2024.5 Price had joined Q2 in February 2018 from BMO Capital Markets, spending six years heading corporate development and emerging businesses before becoming CFO.5 Appointing a corporate finance executive with a background in technology investment banking and acquisitions aligned with Q2's evolving capital strategy, which increasingly emphasized share buybacks alongside targeted dealmaking.
Ultimately, the governance profile reflects a constant chief executive leading a corporate bench that has been reshuffled multiple times across three years.
What the compensation plan actually rewards
Evaluating executive compensation disclosures provides a clearer window into corporate performance than public commentary, contrasting internal benchmarks against year-end results.
For fiscal 2025, the board's compensation committee set two equal metrics for executive cash bonuses: bookings, measured as monthly recurring revenue, and adjusted EBITDA.5 The committee selected bookings over non-GAAP revenue to directly incentivize new contract wins.5
Performance against those internal targets diverged. Adjusted EBITDA reached $186.5 million, exceeding the $170.0 million target at 119.4% achievement. By contrast, new bookings reached $9.18 million in monthly recurring revenue against a $9.71 million target—landing at 93.2% of plan. The resulting combined bonus payout reached 106.3% of target.5
This divergence highlights the contrast between absolute performance and internal expectations. During 2025 earnings calls, leadership emphasized record third-quarter bookings, strong fourth-quarter performance, and "our strongest year as a company across bookings, revenue and profitability."4 While those historical milestones were accurate in absolute terms, full-year commercial bookings still finished nearly 7% below internal budget targets.
Comparing results against internal targets shows that margin expansion proved easier to deliver than raw top-line expansion during 2025.
The compensation committee adjusted its framework for 2026 to prioritize top-line expansion, reweighting cash bonuses to 60% bookings and 40% adjusted EBITDA for most named executives, and 75% bookings for Coleman, to place "a higher weighting on top-line growth."5 Long-term equity incentives remain split between performance stock units and restricted stock units. Half of the performance units depend on achieving adjusted EBITDA margin targets for the twelve months ending December 31, 2026, while the remaining half is tied to three-year total shareholder return relative to the S&P Software & Services Select Index.5 Under this structure, approximately 95% of the chief executive's target compensation remains at risk.5
Tying equity rewards to relative shareholder returns and multi-year operating margins establishes a rigorous standard for executive payout.
The financial pivot, measured against prior promises
In February 2024, management outlined a three-year financial target: average annual subscription revenue growth of approximately 14%, annual adjusted EBITDA margin expansion of 300 to 400 basis points, and free cash flow conversion above 70% of adjusted EBITDA.4
By the close of 2025, Q2 surpassed each metric in that multi-year framework. Price reported revised multi-year expectations of approximately 16% subscription revenue growth, annual margin expansion of at least 450 basis points, and cash flow conversion exceeding 90%.4
Full-year 2025 financial disclosures reflected this operational shift. Total revenue reached $794.8 million, up 14.1%—its fastest pace since 2021—as subscription revenue grew 17% to account for 82% of total sales.14 Gross margin expanded roughly 200 basis points to 58%, while operating expenses fell from 42.3% of revenue to 38.6%. Adjusted EBITDA margin expanded by 547 basis points. Cash flow from operations rose from $135.8 million to $201.5 million, supporting $173 million in free cash flow, representing a 93% conversion rate.45 Total ARR reached $921 million while subscription ARR grew 14% to $780 million, and contract backlog expanded 21% to close at $2.7 billion.4
At the same time, underlying metrics revealed ongoing operational headwinds. Trailing twelve-month total net revenue retention rose to 113% from 109%, with subscription net retention reaching roughly 115%. However, annualized revenue churn rose from 4.4% to 5.2%, a shift Price attributed to client consolidation and bank mergers.4 Furthermore, total ARR growth of 12% continued to lag subscription ARR expansion of 14% due to ongoing contraction in non-subscription revenue streams.4
2026: the balance sheet cleared
The financial restructuring reached completion during the first half of 2026.
Q2 completed its infrastructure transition to Amazon Web Services in January 2026, fully exiting its owned data centers. The shift delivered an immediate structural impact: first-quarter gross margin rose to 62.1% from 57.9% in the prior-year period, an improvement Price highlighted as permanent rather than transient.9 First-quarter revenue reached $216.5 million, up 14%, generating $60 million in adjusted EBITDA at a 27.7% margin.9
Second-quarter results maintained that momentum, with revenue reaching $219.8 million—up 13%—and adjusted EBITDA of $62.8 million at a 28.6% margin, along with $51 million in free cash flow.11 Total ARR reached $971 million, subscription ARR grew 15% to $826 million, and contract backlog stood at $2.8 billion.11
In June 2026, Q2 repaid the remaining $304 million of its 2026 convertible notes at maturity, eliminating all outstanding debt and concluding the borrowing cycle initiated in June 2019.11 The company had previously lowered its debt load during the March 2023 banking disruption by repurchasing $171 million of convertible notes at a discount to face value, reducing total face-value debt by approximately 26%.10 That opportunistic repurchase reduced interest costs and eased eventual retirement of the balance.
With balance sheet leverage cleared, capital allocation turned toward share repurchases. Following a $150 million buyback program authorized in November 2025, Q2 repurchased approximately $125 million in shares through the second quarter of 2026. The board subsequently authorized an additional $350 million, bringing total remaining buyback capacity to roughly $375 million.11
Management raised full-year 2026 guidance to total revenue between $881 million and $886 million—representing roughly 11% growth—with subscription revenue expected to grow approximately 14.5% and adjusted EBITDA projected at $244 million to $248 million, or about 28% of revenue.11 Looking further ahead, management established 2027 targets calling for 12.5% to 13% subscription revenue growth alongside 150 to 200 basis points of annual adjusted EBITDA margin expansion. By 2030, the company targets non-GAAP gross margin of at least 65% and adjusted EBITDA margin of at least 35%.4
These targets point to two critical operational shifts. First, 2027 subscription revenue guidance reflects a modest slowdown from the 14.5% growth projected for 2026—a moderation management attributes to scale. As Price noted, "the baseline is going up, the law of large numbers is present, and so we got to execute at a higher and higher level as time goes on."11 Second, the projected pace of margin expansion slows relative to the 2023–2025 trajectory. Price explained that narrower margin gains reflect planned operational reinvestment, describing it as "an example of us reinvesting back in the business to elongate this growth curve."4 Whether this reinvestment maintains top-line expansion or signals rising competitive costs will depend on future commercial bookings.
The AI question, as management frames it
Q2's strategy in artificial intelligence centers on four core advantages: proprietary data, existing distribution, customer incumbency, and regulatory trust. Flake positions Q2 as the "system of context" in digital banking—distinguishing it from core ledgers that serve as systems of record. In this view, Q2 captures the full stream of user interactions, including login patterns, interface navigation, workflow approvals, and commercial payment flows.9
The company has introduced three primary AI applications. Q2 Assistant integrates natural-language processing into banking workflows, allowing staff to navigate software using conversational prompts. Q2 Code provides AI-assisted development tools that enable institutions and partners to build custom features through text instructions. Separately, an AI-based account takeover solution monitors behavioral indicators in real time to detect and intercept fraud.11
Early commercial adoption remains limited but concentrated. Q2 has signed double-digit client commitments for its account takeover solution and single-digit commitments for Q2 Code and Q2 Assistant, targeting general availability across the portfolio for the fourth quarter of 2026.11 Price noted that Q2 Code will operate as a standalone, monetizable product module rather than a standard feature inclusion.9
The financial risk in this rollout lies in product economics. Management plans to structure AI pricing through a hybrid model, combining base subscription fees with capped token usage, usage overages, and consumption throttles to protect unit margins.11 Price candidly acknowledged the margin pressure, stating that "it's safe to assume that until we see this at scale, it's hard to imagine like traditional SaaS margins are going to look like that on these early AI products."9 He also noted that corporate infrastructure spending on AI has grown at an "exponential" rate compared to prior years.11
This cost structure introduces variable hosting and compute expenses to a software model whose main valuation thesis relies on fixed-cost operating leverage. While common across enterprise software vendors adopting generative AI, managing these variable costs will determine whether Q2 can achieve its target of 35% adjusted EBITDA margins by 2030.
VIII. Industry Structure, Competition, & The 7 Powers
Every request for proposal in digital banking is effectively a four-way competitive contest. Understanding which rivals Q2 defeats, where it loses, and why determines whether the company commands a compounding enterprise franchise or operates a commoditizing software business.
Alkami: the faster horse
Alkami Technology represents the closest pure-play peer, and on headline top-line expansion it is growing faster. Alkami reported full-year 2025 revenue of $443.6 million, up 32.9%, with adjusted EBITDA of $59.1 million—more than double its 2024 results. The company closed 2025 with 22.4 million registered digital banking users, annual recurring revenue of $480.3 million (up 35%), and 39 new client contracts, including 11 banks. Management guided full-year 2026 revenue to between $525.5 million and $530.5 million.20
At first glance, that performance suggests Q2 is losing market share. However, evaluating the comparison requires three critical adjustments.
First, acquisitions distort the headline rate. In February 2025, Alkami agreed to acquire MANTL for an enterprise value of $400 million, funded largely with cash, closing near the end of the first quarter.21 A material portion of Alkami's 2025 growth was therefore inorganic.
Second, base effect matters. Alkami generates roughly half of Q2's total revenue. Faster percentage growth off a smaller denominator reflects standard SaaS scaling dynamics rather than inherent product superiority.
Third, product mix differs significantly. Alkami has historically concentrated on retail digital banking for credit unions. By contrast, Q2's primary moat lies in commercial treasury management—including complex entitlement engines, wire templates, relationship pricing, and a transaction processing layer that handled $4 trillion in 2025 volume, grew 21%, and surpassed $400 billion in a single month for the first time in December.4 These capabilities target different enterprise buyers and distinct bank budget lines.
The competitive reality is nuanced: Alkami is expanding rapidly and remains a formidable peer that Q2 has not displaced. Q2's counter-position relies on depth in commercial banking rather than retail volume alone. Investors tracking potential market share shifts should evaluate net new logo wins in Tier 2 and Tier 3 institutions, where the two platforms compete directly.
nCino: overlapping but stalling
nCino, built on the Salesforce platform, competes primarily in commercial loan origination and customer onboarding. Its recent financial trajectory highlights slowing momentum: fiscal 2026 revenue reached $585 million to $589 million, representing roughly 9% growth, while fourth-quarter subscription revenue expanded by just 7%.22
This deceleration carries dual implications for Q2. While Q2's relationship pricing suite coexists with nCino in some client tech stacks and competes in others, nCino's slowdown to single-digit subscription growth signals broader caution across commercial banking software. It raises the question of whether commercial IT modernization budgets are experiencing structural saturation or temporary digestion.
The core providers: the perpetual threat
Legacy core processing vendors—Fiserv, FIS, and Jack Henry & Associates—maintain the ability to bundle digital banking front ends with their underlying back-end ledgers. Among these, Jack Henry's Banno platform presents the most direct challenge, serving over 15 million users.23
However, comparing average customer profiles reveals distinct target markets. Q2 supports 27.3 million registered account holders across 457 installed digital banking platform institutions—averaging roughly 60,000 users per client.1 Banno serves a larger quantity of financial institutions with a smaller average user base, reflecting Jack Henry's concentration among smaller community banks.
This structural divide defines the competitive boundary. Banno is an attractive option for a $400 million asset community bank using Jack Henry's core ledger, where front-end bundling simplifies administration and commercial needs are straightforward. Conversely, it is less compelling for a $12 billion regional institution requiring sophisticated commercial treasury tools and independence from its core vendor. Q2's core market remains upper-middle institutions, while the long-term risk stems from core providers gradually pushing upstream with aggressive bundled pricing.
NCR Voyix, which inherited the legacy Digital Insight franchise, represents a fourth player and acts primarily as a source of account replacements. Its market capitalization of approximately $1.1 billion, compared to Q2's $4.0 billion, illustrates the market's view of their relative trajectories.2
Hamilton Helmer's 7 Powers, tested
Switching Costs — the primary operational moat. Digital banking platform contracts average over five years in initial term.1 Replacing a platform requires migrating millions of account holders, re-engineering integrations across core ledgers and third-party systems, retraining staff, and managing operational risk during cutover. Empirical evidence appears in subscription net revenue retention of approximately 115% alongside annual revenue churn of 5.2%—demonstrating that roughly 95% of revenue dollars persist while existing clients expand.4 Furthermore, clients expand contracted revenue by 61% within 48 months of implementation.1
Counter-Positioning — durable, but facing pressure. Q2's core-agnostic model creates a structural dilemma for core vendors, as selling a front end that simplifies core migration undermines their primary ledger business. However, counter-positioning depends on incumbent hesitation. Jack Henry's investment in cloud-native tools indicates at least one core provider is willing to navigate that conflict.
Network Effects — directionally clear, unquantified financial impact. Innovation Studio exhibits classic two-sided platform dynamics, featuring over 200 integration partners, near-universal attachment on net new digital banking contracts, and frequent citation as a primary driver in major wins.11410 However, because Q2 does not separately break out Innovation Studio revenue, take rates, or partner unit economics, the asset functions as a strong sales differentiator with an unverified standalone profit pool.
Scale Economies — newly evident following cloud migration. Q2 historically lacked operating leverage, contributing to eleven consecutive years of public GAAP net losses. Completing its cloud migration altered unit economics, raising gross margins above 62%, with management projecting further efficiency gains in 2027 and 2028 through infrastructure automation.9 Spreading ongoing R&D across 27 million end users provides a clear cost advantage over institutions considering in-house development.
Process Power — an underrated conversion capability. Executing complex core migrations and post-merger technology consolidations creates an operational barrier that competitors cannot easily duplicate. Q2's 93% customer retention rate during client M&A transactions validates this execution strength.4 For example, in the second quarter of 2026, a $2 billion Q2 customer was acquired by a $9 billion institution; following a competitive evaluation against the acquirer's incumbent vendor, the combined bank selected Q2 across the combined enterprise.11
Branding and Cornered Resource — minimal presence. While Q2 holds a solid reputation among regional financial institutions, it lacks brand-driven pricing power or exclusive proprietary inputs that competitors cannot replicate.
Porter's Five Forces, briefly
Threat of new entrants: very low. Rigorous regulatory oversight, stringent security requirements, and a matrix of over 1,000 pre-built integrations create a decade-long barrier to entry.1
Threat of substitutes: low, but rising with artificial intelligence. Financial institutions must provide digital channels; the primary alternative is in-house development. Q2's regulatory filings explicitly identify custom internal builds as an ongoing competitive challenge.1 Generative AI capabilities reduce the technical cost of developing internal software, gradually raising substitute risk.
Bargaining power of buyers: moderate and expanding through consolidation. Industry consolidation concentrates buying power, as larger merged institutions exercise greater leverage than smaller independent banks. Offsetting this trend, management noted that average contract terms for expansion deals have lengthened relative to historical averages.9
Bargaining power of suppliers: newly relevant. Transitioning to cloud infrastructure and deploying generative AI increases dependence on cloud providers like AWS and frontier AI model vendors, exposing Q2 to potential hosting and compute cost inflation.
Rivalry: high. Head-to-head competition against Alkami, bundled core offerings, and point solutions remains intense across a consolidating pool of financial institution charters.
IX. Bear vs. Bull Case & Skeptical Investor Stress Test
Evaluating Q2 Holdings from an institutional perspective highlights a fundamental debate: whether expanding operating margins signal a high-moat enterprise software franchise or mask structural top-line deceleration.
The stress test
Exhibit A: the growth is decelerating, and management has said so. Subscription revenue growth is projected to slow from roughly 17% in 2025 to 14.5% in 2026, before settling into a targeted 12.5% to 13% range for 2027.411 With total revenue growth guided to approximately 11% for 2026, the company's financial roadmap reflects a business transitioning into low-teens expansion while maintaining a growth-software valuation multiple.
Exhibit B: the bookings plan was missed while the narrative celebrated records. Despite public messaging highlighting record operational achievements in 2025, commercial bookings reached 93.2% of management's internal compensation target.5 A rigorous audit underscores the gap between public commentary and internal performance benchmarks.
Exhibit C: churn is rising and total ARR lags subscription ARR. Annualized revenue churn increased from 4.4% to 5.2%.4 Total ARR growth also lagged subscription ARR expansion, rising 12% compared to 14% for subscription ARR in 2025, and 13% versus 15% in the second quarter of 2026.411 While management attributes these trends to bank M&A consolidation and shrinking low-margin professional services, a multi-year contraction in non-subscription revenue continually dampens total corporate growth.
Exhibit D: charter consolidation shrinks the pond. The steady decline in total U.S. bank and credit union charters contracts the addressable customer base over time. Although Q2 retains 93% of client relationships in M&A events involving its customers and skews toward acquiring institutions,4 expanding market share within a shrinking universe faces natural structural limits.
Exhibit E: the AI cost line is unmodeled. Chief Financial Officer Jonathan Price acknowledged that internal AI expenditure is growing rapidly, that early AI products will not carry traditional software margins, and that gross margin effects may vary significantly by product.119 However, the long-term equity story relies on achieving 35% or higher adjusted EBITDA margins by 2030,4 creating an unhedged tension between variable compute expenses and target operating leverage.
Exhibit F: capital allocation is now dominated by buybacks at a moment of strategic uncertainty. Maintaining roughly $375 million in share repurchase authority against a $4.0 billion market capitalization represents a major capital allocation choice.112 While buybacks represent a reasonable use of cash for a debt-free company generating $173 million in annual free cash flow, prioritizing share repurchases over acquisitions during a major technological shift risks prioritizing short-term capital deployment over expanded platform capabilities.
The bull case, stated properly
The switching costs are not a theory — they are a measured fact. High customer switching costs are validated by a subscription net revenue retention rate of roughly 115%, annualized revenue churn below 6%, initial contract terms exceeding five years, and 61% contracted revenue expansion within 48 months of implementation.41 Coupled with a $2.8 billion contract backlog against under $900 million in annual revenue,11 these operational metrics offer more than three years of revenue visibility and protect the installed base against temporary bookings volatility.
The commercial franchise is genuinely differentiated and is where the money is. Q2's commercial banking suite serves 9 of the 14 largest banks in North America through its relationship pricing software,11 supporting $4.0 trillion in annual transaction volume that grew 21% in 2025.4 Its single-platform architecture allows financial institutions to run retail, small business, and commercial banking on a single system—illustrated when a regional client's commercial users pressed management to replace its legacy retail front end with Q2.11 This unified footprint establishes a defensive cross-sell advantage over retail-focused rivals.
The cross-sell runway is quantified and large. Substantial expansion room remains within contracted accounts, where only about 10% of Tier 1 clients license retail banking, commercial pricing, and fraud mitigation tools simultaneously.4 Furthermore, fraud solution penetration within the digital banking customer base sits at just 25% to 35%,49 offering an immediate upsell path within an existing client base.
Fraud may be the best growth vector in the portfolio, and it is not priced as one. Management expects the fraud software portfolio to maintain its growth premium over the broader business for years to come.11 In the first quarter of 2026, Q2 signed its largest fraud contract to date with a new enterprise customer, generating an average selling price comparable to a Tier 1 digital banking deal.9 Because fraud detection efficacy improves with transaction volume and data breadth, a unified banking architecture captures richer behavioral telemetry than single-purpose point solutions.11 As Chief Executive Officer Matt Flake noted regarding evolving security threats, financial institutions must "continue to compete with the weapon and bring a shield and then they bring a new weapon," turning an ongoing threat environment into a durable subscription revenue stream.11
The operating model is proven, not promised. Management demonstrated disciplined execution by beating all three targets of the three-year financial framework established in February 2024.4 With debt fully retired and free cash flow conversion exceeding 90% of adjusted EBITDA, the operating model has transitioned into a proven cash generator.
The bear case, stated properly
Alkami keeps compounding faster and eventually arrives upmarket. If Alkami leverages its acquisition of MANTL alongside its retail strength to move into Tier 2 and lower Tier 1 institutions, Q2's growth premium and pricing power in upper-mid-market banking could come under pressure.
The cores get good enough. Core processing vendors remain an ongoing structural threat by refining front-end interfaces and bundling products. Jack Henry's cloud-native Banno platform presents a compelling option for community institutions with simpler commercial needs, threatening to compress Q2's renewal pricing even without direct customer defections.
AI cuts against the buyer, not just the vendor. Generative AI tools lower the software development barrier for regional banks, potentially reducing demand for vendor add-on modules and dampening the expansion revenue that drives net retention rates. While Q2 introduced Q2 Code to channel client development onto its platform, the strategy carries trade-offs. Flake acknowledged that AI tooling will likely result in "less services work from us,"9 shifting lower-margin professional services into software delivery, which may benefit operating margins while constraining total revenue growth.
The macro that helps can reverse. Current commercial demand remains tied to the overall financial health of regional lenders. As Flake noted in early 2026, sales momentum was supported because client banks were performing well and seeing strong equity valuations.9 Any macroeconomic deterioration, credit stress, or commercial real estate losses across regional banks could quickly freeze the discretionary software budgets that fund Q2's bookings.
Second-layer items worth a line each
Regulatory filings highlight increased agency scrutiny of banking-as-a-service partnerships, presenting direct operational considerations for the Helix platform.1 International operations account for 884 of 2,549 global employees, offering cost structure advantages alongside geographic concentration risks.1 In 2026, Q2 added a secondary dual listing on NYSE Texas alongside its primary NYSE listing.1 Finally, non-GAAP adjusted EBITDA excludes stock-based compensation—a material cost given that 95% of chief executive target pay is equity-based—explaining much of the gap between $186.5 million in 2025 adjusted EBITDA and $52.0 million in GAAP net income.41
X. Playbook & Key Takeaways
Four broader strategic lessons emerge from Q2's operational trajectory.
1. Solving integration friction creates a more durable business than building attractive user interfaces. While developing a modern user interface is straightforward, creating and maintaining over 1,000 integrations into legacy back-end ledgers, navigating continuous regulatory examinations, and maintaining operational track records over two decades presents a formidable barrier to entry. Q2's primary moat stems from accumulated connective tissue rather than design aesthetics. When evaluating enterprise middleware providers, the fundamental question is how much time and capital a competitor would require to replicate that integration matrix.
2. Premium acquisitions require multi-year evaluation windows. The $510 million acquisition of PrecisionLender was expensive, funded through debt that constrained the balance sheet during a volatile macroeconomic period, and created years of margin drag and accounting noise. However, the transaction secured entry into tier-one institutions that Q2 had struggled to reach independently, establishing a core relationship pricing product line. The primary takeaway is not that high-premium deals inevitably succeed, but that the true strategic return on enterprise software acquisitions unfolds over four to five years rather than initial quarterly reporting cycles.
3. Shifted capital costs demand fundamental operational restructuring. Q2's revenue growth in 2025 remained comparable to its historical trajectory. The critical transformation occurred below the top line: completing its cloud migration, leveraging offshore delivery, consolidating vendors, scaling back facilities, and imposing headcount discipline. This operational discipline transitioned the firm from eleven consecutive years of public GAAP net losses to profitability without introducing a new flagship product line. However, because these operational efficiency gains have largely been realized, future financial performance depends primarily on top-line expansion at a time when growth is projected to moderate.
4. Mission-critical utility software provides structural downside protection during sector stress. During the 2023 regional banking crisis, as client institutions faced insolvency and sector capital costs escalated, Q2 achieved record digital banking bookings and peak contract win rates even as discretionary professional services revenue contracted.10 This operational divergence illustrates the profile of core utility software: subscription platforms persist while discretionary projects are curtailed. Investors evaluating enterprise software holdings should explicitly analyze this downside asymmetry.
The three metrics that matter from here
Future corporate performance depends primarily on three operational indicators.
1. Subscription ARR growth rate. Subscription ARR provides the clearest forward-looking indicator of core business momentum, leading reported revenue by several quarters due to multi-year implementation timelines. For 2027, management targets subscription revenue growth of 12.5% to 13%.4 Whether subscription ARR stabilizes within that range or experiences ongoing deceleration represents the primary test for the equity.
2. Adjusted EBITDA margin expansion, evaluated alongside free cash flow conversion and stock-based compensation. By 2030, management targets non-GAAP gross margins of at least 65% and adjusted EBITDA margins of at least 35%.4 Achieving these targets relies on planned infrastructure automation gains scheduled for 2027 and 2028, offset by expanding AI compute and infrastructure expenses that management characterizes as growing exponentially.911 Investors should monitor whether annual margin expansion meets the targeted 150 to 200 basis points while inspecting GAAP net income, as adjusted EBITDA excludes substantial stock-based compensation costs.
3. Net revenue retention alongside revenue churn. A subscription net revenue retention rate of approximately 115% combined with an annualized revenue churn rate of 5.2% reflects the core switching-cost thesis in two metrics.4 If net retention remains stable while churn normalizes, Q2's competitive moat and cross-sell expansion remain intact. Conversely, if net retention declines toward 105% or churn exceeds 6%, the structural switching costs protecting the customer base are diminishing—an operational shift that would outweigh short-term bookings fluctuations.
The company Hank Seale founded in 2004 to help community banks compete against money-center institutions now supports more than 1,200 financial institutions and 27 million registered account holders. Whether Q2 can sustain its market position as software development costs decline and bank charters continue to consolidate remains the central question governing its next phase of growth.
References
-
Q2 Holdings, Inc. Form 10-K for the fiscal year ended December 31, 2025 — SEC EDGAR, 2026-02-11 ↩↩↩↩↩↩↩↩↩↩↩↩↩↩↩↩↩↩↩↩↩↩↩↩↩↩↩
-
Q2 Holdings 2023 Form 10-K Annual Report — SEC EDGAR, 2024-02-20 ↩↩↩↩↩↩
-
Q2 Holdings Fourth Quarter and Full Year 2025 Earnings Conference Call, February 11, 2026 — Q2 Holdings Events & Webcasts Archive ↩↩↩↩↩↩↩↩↩↩↩↩↩↩↩↩↩↩↩↩↩↩↩↩↩↩↩↩↩↩↩↩↩
-
Q2 Holdings, Inc. Definitive Proxy Statement (DEF 14A) for the 2026 Annual Meeting — SEC EDGAR, 2026-04-28 ↩↩↩↩↩↩↩↩↩↩↩↩↩↩↩↩↩↩
-
JPMorgan Chase & Co. 2025 Investor Day Presentation — SEC EDGAR Form 8-K, 2025 ↩
-
Q2 Holdings, Inc. Definitive Proxy Statement (DEF 14A) for the 2024 Annual Meeting — SEC EDGAR, 2024-04-29 ↩↩↩↩
-
Q2 Holdings First Quarter 2026 Earnings Conference Call, April 29, 2026 — Q2 Holdings Events & Webcasts Archive ↩↩↩↩↩↩↩↩↩↩↩↩↩↩↩↩↩↩
-
Q2 Holdings First Quarter 2023 Earnings Conference Call, May 9, 2023 — Q2 Holdings Events & Webcasts Archive ↩↩↩↩↩↩↩↩↩↩↩↩↩↩↩↩↩↩
-
Q2 Holdings Second Quarter 2026 Earnings Conference Call, July 29, 2026 — Q2 Holdings Events & Webcasts Archive ↩↩↩↩↩↩↩↩↩↩↩↩↩↩↩↩↩↩↩↩↩↩↩↩↩↩↩↩↩
-
Q2 Holdings, Inc. Form 10-K for the fiscal year ended December 31, 2014 — SEC EDGAR, 2015-02-12 ↩↩↩↩↩↩
-
Q2 Holdings Form S-1 Registration Statement (IPO Prospectus) — SEC EDGAR, 2014-02-12 ↩
-
Q2 Holdings, Inc. Enters Agreement to Acquire Cloud Lending, Inc. — SEC EDGAR Form 8-K Exhibit 99.1, 2018-08-08 ↩↩
-
Q2 Holdings, Inc. Form 10-K for the fiscal year ended December 31, 2018 — SEC EDGAR, 2019-02-19 ↩↩
-
Q2 Holdings to Acquire PrecisionLender Press Release — BusinessWire, 2019-10-01 ↩
-
Q2 Holdings Completes Acquisition of PrecisionLender — Q2 Holdings, 2019-11-01 ↩↩↩
-
Q2 Innovation Studio Ecosystem & Partner Marketplace — Q2 Holdings ↩
-
R.H. Seale to Transition to Chairman Emeritus — SEC EDGAR Form 8-K Exhibit 99.1, 2024-05-10 ↩↩↩
-
Alkami Announces Fourth Quarter 2025 Financial Results — PR Newswire, 2026-02-25 ↩
-
Alkami to Acquire MANTL to Expand Account Opening Capabilities — SEC EDGAR Form 8-K Exhibit 99.3, 2025-02-27 ↩
-
nCino Reports Fourth Quarter and Fiscal Year 2026 Financial Results — nCino Investor Relations ↩
 LinkedIn
 WhatsApp
 Reddit
 Hacker News
 Email
Email Kindle
 RSS Feed
 Spotify
 Apple Podcasts
 Amazon Music
 Audible
 YouTube