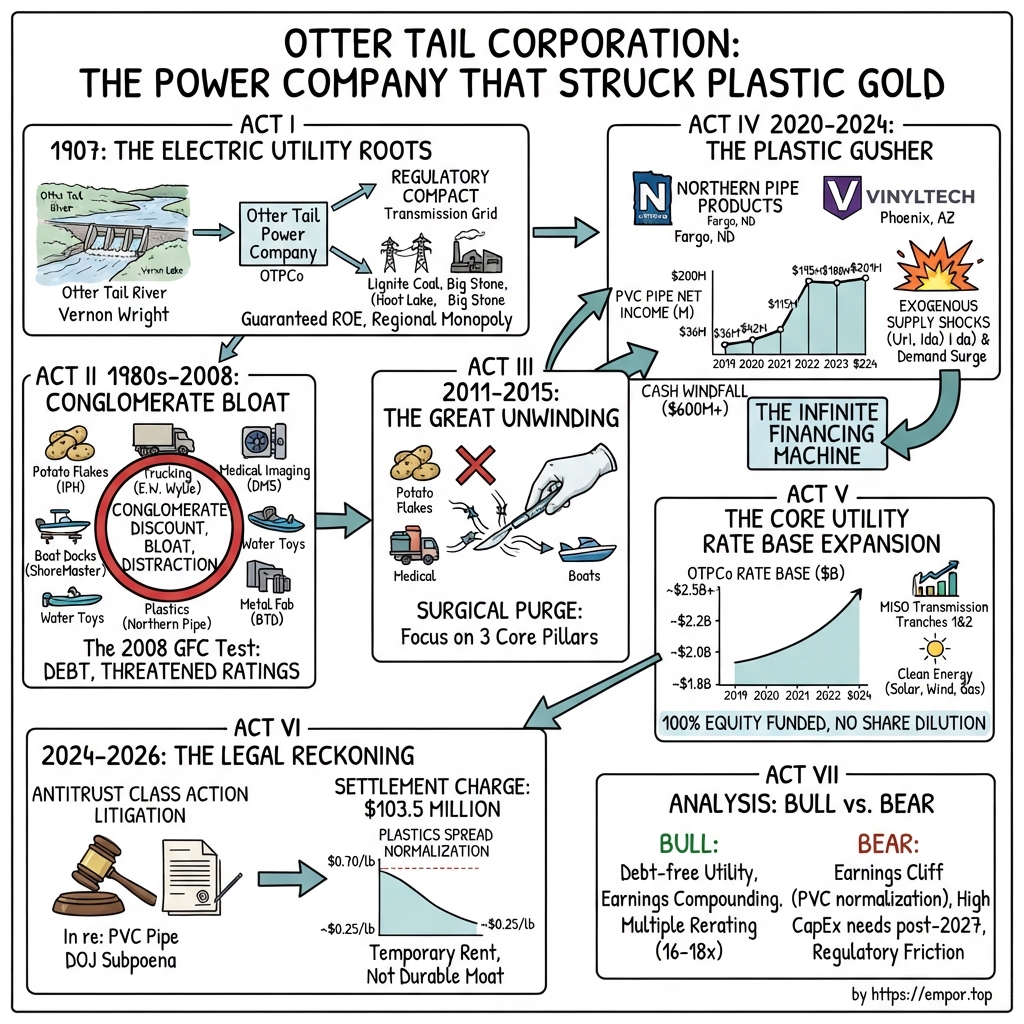
Otter Tail Corporation: The Power Company That Struck Plastic Gold
I. Introduction, The Central Paradox & Episode Roadmap
Fergus Falls, Minnesota, is a town of roughly fourteen thousand people set on a river that drains a chain of prairie lakes in the west-central part of the state. It has a grain elevator, a hospital, a county courthouse, and a hydroelectric dam completed in 1909 that still generates power. It is not the sort of place from which one expects an extraordinary financial story to emerge, and for most of the past century, none did. Otter Tail Power Company sold electricity to farmers and small-town merchants, earned an allowed return set by three state utility commissions, raised its dividend, and went about its business.
Then something unusual happened. Between 2020 and 2024, the company's consolidated net income surged from $95.9 million to $301.7 million.12 Diluted earnings per share jumped from $2.34 to $7.17.12 Return on equity in 2024 reached 19.3 percent on a 62.2 percent equity layer, meaning the company generated returns comparable to private equity while maintaining an exceptionally conservative balance sheet.2 For a regulated electric utility, whose underlying regulatory compact targets an equity return near ten percent, this was not simply an unusually strong period; it was a category error.
Yet the stock price told a more restrained story. Otter Tail's 10-K performance graph shows that $100 invested in the company on December 31, 2019, was worth $166.48 on December 31, 2024 — a cumulative five-year total return of about 66 percent.2 Over that identical span, the Edison Electric Institute index of utilities returned 27.3 percent, while the Nasdaq Composite returned 92.9 percent.2 Otter Tail roughly doubled the utility sector's return while trailing the broader market, even as its earnings more than tripled. That divergence is revealing: equity markets declined to capitalize the windfall at a utility multiple because investors recognized the temporary nature of the earnings source.
The explanation lies in the corporate structure. Otter Tail Corporation is not, strictly speaking, an operating utility; it is a holding company that owns one. Alongside Otter Tail Power Company — which serves roughly 134,000 electric customers across more than 400 communities over 70,000 square miles of rural Minnesota, North Dakota, and South Dakota — the parent company owns a contract metal fabricator named BTD Manufacturing and two polyvinyl chloride pipe extruders: Northern Pipe Products in Fargo, North Dakota, and Vinyltech Corporation in Phoenix, Arizona.3 In 2024, those two pipe extrusion plants, employing roughly 200 people, generated $200.7 million in net income — more than double the profit of the entire regulated electric utility that year.2
The paradox worth unpacking
This windfall addressed a fundamental financial dilemma facing electric utilities. A regulated utility expands earnings by growing its rate base — the net capital invested in poles, wires, substations, and generation plants on which regulators permit a return. Expanding that rate base requires capital expenditures well beyond the cash generated from utility operations. Because regulators also require a balanced capital structure, roughly half of every incremental dollar in rate base must be funded with equity. Consequently, the industry typically operates on an equity-issuance treadmill: expand the asset base, issue new common shares, absorb dilution, and repeat.
Between 2021 and 2025, Otter Tail accelerated its rate base expansion without stepping onto that dilution treadmill. Management stated it could execute a $2.05 billion capital plan through 2030 — with $1.921 billion dedicated to the electric utility — while requiring "no external equity needs through at least 2030," supported by an equity layer near 63 percent at year-end 2025 and $386 million in cash.45 That balance-sheet liquidity came directly from pipe manufacturing profits.
This is the bull thesis in its cleanest formulation: management captured an extraordinary windfall in an unregulated commodity business and, rather than pursuing dilutive acquisitions, directed that capital into permanent, rate-regulated assets designed to compound for decades. It is an appealing narrative, and it is the version management highlights.
The skeptical version
Testing that thesis requires scrutinizing three foundational assumptions, each subject to specific disconfirming evidence.
The first premise is that Otter Tail's diversified conglomerate model confers a durable operational advantage. The company's record between 1989 and 2014 offers a cautionary counterweight: during that era, the same holding company structure applied across disparate operating businesses led to severe capital destruction and threatened the utility's credit profile.
The second premise is that elevated plastics margins reflect an enduring competitive moat rather than an extraordinary cyclical dislocation. In August 2024, the U.S. Department of Justice Antitrust Division served Otter Tail with a grand jury subpoena regarding the manufacturing, marketing, and pricing of PVC pipe.6 In the second quarter of 2026, the company recorded a $103.5 million pre-tax charge to settle civil antitrust claims across three plaintiff classes, without admitting liability.789 While the settlement resolves the litigation without establishing guilt, it underscores that the cash flow funding the utility's capital budget was linked to pricing dynamics under federal scrutiny.
The third premise is that elevated plastics profitability represents a permanent shift in baseline earnings power. Management has directly refuted this expectation in public disclosures. During the fourth-quarter 2025 earnings call, executives projected 2028 as "the first full year of earnings within our $45,000,000 to $50,000,000 range" for the Plastics segment.4 Compared to the 2024 peak of $200.7 million, this guidance indicates an anticipated decline of roughly three-quarters in segment net income. The investment debate is not over whether profits will decline from their peak, but where the normalized trough will settle.
The roadmap
The chapters ahead trace this corporate evolution: a regional utility founded on hydroelectric dam sites and local lignite; a diversification campaign that ended in write-downs and divestitures; a corporate restructuring and strategic refocus; a plastics commodity boom that financed a utility rate base expansion; the regulated utility as it operates today; the antitrust litigation and margin normalization; the role of BTD Manufacturing; an analysis of where structural economic moats exist across the portfolio; and an assessment of the bull and bear arguments, along with the core financial metrics that will determine the outcome.
The story begins at the dam.
 Subscribe on LinkedIn
II. Act I: Founding & Frontier Electrification (1907–1970s)
In 1870, a promoter named George Wright built a dam, a sawmill, and a gristmill on the Otter Tail River, essentially founding the town of Fergus Falls.10 Nearly four decades later, in 1907, Vernon Ames Wright and an investor named Frederick G. Barrows raised $100,000 to construct a downstream hydroelectric station at Dayton Hollow, incorporating Otter Tail Power Company to own it.10 Wright ran operations while Barrows handled the financing. When the plant came online in 1909, its initial customer was not in Minnesota at all: it was the Northern Light Electric Company in Wahpeton, North Dakota, twenty-five miles across the state line, connected via a dedicated transmission line built for the purpose.10
That initial sale captured the underlying business model in miniature. A generating asset on the prairie has no economic value without a route to demand, and rural demand was dispersed across vast distances. The business, therefore, was never primarily about power generation; it was about the wires.
Consolidation, one town at a time
What followed over the next several decades was the Samuel Insull consolidation playbook adapted to a region without large cities. Isolated municipal operations — each running a small diesel or steam generator that was costly to maintain and vulnerable to outages — were acquired, linked together, and supplied by central stations. In 1913 alone, the company connected ten Minnesota towns to its system and acquired Northern Light Electric outright.10 After a 1909 municipal dam failure damaged a competing local facility, Otter Tail negotiated a long-term service contract with Fergus Falls and absorbed the wrecked Central Dam.10 By 1944, the utility's network spanned roughly 500 communities across 50,000 square miles.10
This dynamic is worth examining, because it explains why the company's regulated utility returns remain structurally stable today. Otter Tail did not capture its footprint by outcompeting rivals in an open market. It assembled that territory during an era when the decentralized alternative — isolated towns operating fragile generators — was manifestly inefficient, and state regulation subsequently locked that advantage in place. Minnesota, North Dakota, and South Dakota each granted exclusive franchise territories in exchange for an obligation to serve every customer at commission-approved rates. Once that regulatory compact was established, competitive entry was effectively foreclosed: no rational utility would string a duplicate set of distribution lines down a gravel road in Grant County to compete for eleven customers.
The Wright family directed executive leadership for decades, with Thomas C. Wright serving as president from 1933 to 1961, succeeded by Cyrus G. Wright as chairman.10 The utility's first non-family president, Albert V. Hartl, led the company from 1961 to 1975 and expanded revenues from roughly $21 million to $71 million, driven largely by postwar rural electrification and steady demand growth.10
Lignite, and the low-cost position that still matters
The generation portfolio turned on coal. Early Hoot Lake steam units in the 1920s burned eastern bituminous coal hauled by rail from Duluth — an expensive fuel shipped over long distances.10 Beginning in 1926, Otter Tail became an early pioneer in burning North Dakota lignite at commercial scale, extending its transmission footprint westward toward the Missouri River to reach the deposits.10 Lignite is a low-rank, high-moisture coal that is uneconomic to rail over significant distances; the practical solution was to build generating stations directly adjacent to the surface mines and transmit the electricity instead. The Big Stone Plant near Milbank, South Dakota, was built to meet the surging demand of the late 1960s and early 1970s, followed by the jointly owned Coyote Plant in 1981 — an asset capital-intensive enough to require substantial rate increases to absorb.10
That legacy resource strategy continues to pay dividends. In 2025, Otter Tail Power's residential electricity rates ran roughly 34 percent below the national average and 19 percent below regional utility peers.4 For a rural utility, low baseline rates provide critical regulatory headroom: they make rate cases politically easier for commissions to approve when capital projects require funding, and they limit customer backlash against incremental tariff increases.
A second structural feature from this era directly shapes current operations. Because Otter Tail's service territory spans three states, every major corporate initiative requires three distinct regulatory approvals across three statutory frameworks, overseen by three separate commissions with divergent political priorities. Most utilities of comparable scale operate within a single state. While this tri-state footprint is often framed as a diversification benefit — insulating the utility if one jurisdiction proves unfavorable — it also functions as an ongoing administrative tax. Every major asset decision demands three rate cases, three integrated resource plans, three rosters of intervenors, and three sets of administrative hearings. Over decades, Otter Tail has institutionalized this multi-jurisdictional compliance process into a core operational capability that would be difficult for any newcomer to replicate.
One instructive scar
There is a notable footnote from the frontier era that foreshadowed the company's complex history with antitrust oversight. When the town of Elbow Lake, Minnesota, established a municipal electric utility in the early 1960s, Otter Tail refused to wheel federally generated power across its transmission lines to supply the town. The Justice Department filed an antitrust suit in 1969. Otter Tail lost in federal district court and again before the U.S. Supreme Court in 1973, which affirmed that regulated utilities were not immune from antitrust scrutiny when using transmission monopolies to block competition. The company agreed to wheel power and ultimately settled out of court in 1981 for $1.3 million payable over fourteen years.10
The lesson is not that an operational dispute from sixty years ago directly explains modern events. Rather, it demonstrates that businesses whose economics depend on controlling sole-source infrastructure have long invited federal antitrust scrutiny — and that antitrust defense is woven deep into Otter Tail's corporate history. By the 1980s, however, a more immediate challenge loomed: rural population and electricity demand across the Upper Midwest had plateaued.
III. Act II: The Diversification Trap — Conglomerate Bloat (1980s–2008)
Consider the arithmetic facing utility executives in Fergus Falls in the mid-1980s. A regulated electric utility earns an authorized return on invested capital, but the capital required to expand that rate base depends fundamentally on growing customer demand. In western Minnesota and eastern North Dakota, customer counts were stagnant: family farms were consolidating, and rural towns were losing population. Utility commissions do not grant rate-base expansion absent new capital investment to serve additional load.
This dynamic imposed a structural ceiling on utility earnings, leaving management with two basic paths: distribute surplus cash flow to shareholders as a slow-growing annuity, or deploy that capital beyond the regulated fence in search of higher returns.
Otter Tail chose the second path, pursuing an aggressive diversification strategy initiated by John C. MacFarlane after he became president in 1982.10 In 1989, the company established Mid-States Development to house its unregulated operating ventures.10 The federal legal architecture facilitated the move: while the Public Utility Holding Company Act of 1935 strictly limited multi-state electric systems, regional operators like Otter Tail sat outside its most restrictive provisions, leaving the corporate perimeter open to non-utility acquisitions.
What was actually in the box
The portfolio assembled over the next fifteen years was notable less for any individual business than for the absence of an organizing strategic logic. Northern Pipe Products, the Fargo-based PVC extruder, was acquired in the mid-1990s, followed by Vinyltech in Phoenix. BTD Manufacturing, a contract metal stamping and tool-and-die shop in Detroit Lakes, Minnesota, joined the holding company during the same period.
From there, the acquisitions expanded across unrelated industries. Idaho Pacific Holdings processed potatoes into dehydrated flakes and granules for commercial food producers. DMS Health Technologies mounted MRI machines and CT scanners inside trailers, dispatching mobile imaging services to rural hospitals. E.W. Wylie operated flatbed freight trucking fleets. ShoreMaster manufactured aluminum boat docks and boat lifts, while Aviva Sports produced inflatable water trampolines. Foley Company operated as an industrial and mechanical contractor. DMI Industries fabricated heavy steel wind-turbine towers at plants that included a facility in Fort Erie, Ontario. The parent company also acquired regional radio stations, a local telephone utility, and an 85 percent stake in the Fargo-Moorhead RedHawks of the independent Northern League, purchased in 1995 for about $1.2 million.10 By 1995, non-utility operating subsidiaries generated roughly 38 percent of total consolidated revenues.10
The synergy story, and what it was actually made of
Management defended the conglomerate model as a portfolio hedge: cyclical industrial businesses were meant to bolster earnings when utility demand softened, while the regulated electric utility provided a dependable cash flow floor during industrial downturns. In corporate finance, this logic frequently proves illusory.
In liquid public markets, equity investors can diversify across sectors independently and without friction. A corporate holding company that attempts to diversify on their behalf provides no portfolio advantage shareholders cannot replicate on their own. Instead, the conglomerate structure incurs administrative overhead, creates corporate tax inefficiencies, and divides senior executive attention across disparate operating models. For a conglomerate structure to generate genuine economic value, the parent corporation must operate as a superior owner compared to focused standalone rivals or private equity sponsors—allocating capital more astutely, operating facilities more efficiently, or generating measurable commercial synergies across business lines.
In Otter Tail's portfolio, those advantages were absent. Dehydrating potato flakes shared no operating synergies with building waterfront boat docks. Corporate managers in Fergus Falls possessed no specialized operational expertise that could optimize mobile radiology routes across rural clinics. The counter-cyclical smoothing thesis collapsed during the 2008 financial crisis, when industrial manufacturing, commercial construction, freight trucking, recreational marine products, and medical equipment leasing deteriorated simultaneously.
The downstream financial damage threatened the parent company's core asset. When a holding company borrows at the corporate level to finance volatile, unregulated businesses, credit rating agencies evaluate leverage across the consolidated enterprise. That financing structure placed Otter Tail Power Company's investment-grade credit rating directly at risk. A downgraded utility faces elevated debt issuance costs to fund its transmission and distribution assets, an expense that ultimately flows into utility rate cases and raises customer electricity rates. Rather than insulating the core franchise, the diversification strategy functioned as an uncompensated contingent claim written against the regulated utility.
When the financial crisis struck in 2008, that claim came due.
IV. Act III: The 2008 Meltdown & The "Back to the Basics" Surgical Purge
The 2008 financial crisis dealt with Otter Tail's non-utility portfolio precisely as market downturns typically treat a collection of late-cycle industrial and consumer-discretionary businesses assembled without a unifying strategy. Freight rates plummeted. Commercial construction ground to a halt. Hospital capital budgets froze, pulling mobile imaging equipment leases down with them. Meanwhile, demand for wind turbine towers—critically reliant on a federal production tax credit that Congress repeatedly allowed to lapse—swung wildly.
The operational results from the subsequent cleanup years documented the severity of the dislocation. In 2010, the company wrote off $9.4 million of ShoreMaster's goodwill, while DMI Industries recorded a $3.1 million asset impairment on its Fort Erie plant based on independent market appraisals.11 In 2011, consolidated revenues expanded 20.8 percent to $1.1 billion, yet the company posted a net loss of $13.2 million.12 The wind energy segment alone lost $21.9 million on $201.9 million of revenue, reflecting a commodity manufacturer operating without pricing power or competitive barriers to entry.11 The single largest drag was a $39.1 million after-tax impairment charge recorded in the fourth quarter of 2011 in connection with the agreement to sell DMS Health Technologies.12
The verdict on claim one
This downturn provided an empirical test for the holding company model's central premise: that Otter Tail possesses an operational edge in managing unregulated commercial businesses alongside an electric utility. Testing that claim against the company's historical record reveals the structural flaw that undermined it—namely, the recurring destruction of capital across non-utility investments.
Over roughly two decades, Otter Tail deployed shareholder capital into food processing, flatbed trucking, water sports gear, medical imaging, mechanical contracting, marine hardware, wind towers, commercial radio stations, local telephony, and minor-league baseball. The tangible outcome across that portfolio was goodwill written down, assets impaired, and a succession of exits negotiated under financial pressure. Idaho Pacific was sold in May 2011 for approximately $87.0 million in cash, with proceeds directed toward paying down credit facility borrowings—a purchase price subsequently reduced by $1.2 million following post-closing adjustments.11 E.W. Wylie and Aviva were divested in that same year. DMS Health Technologies went to Platinum Equity, closing on February 29, 2012, after the fourth-quarter write-down cleared the path for the transaction.13 DMI Industries was liquidated in 2012 after the company announced a signed letter of intent for its assets. ShoreMaster was divested in 2013, and the construction contracting operations followed soon after.
The long-term record is unambiguous. Across the full cycle, the diversification campaign destroyed economic value, and the subsidiary sales were forced rather than opportunistic: an enterprise that impairs an asset by $39.1 million in the precise quarter it agrees to sell it is liquidating under duress, not timing the market. While that history does not automatically condemn the current three-segment structure—which features a far simpler footprint and a stronger utility balance sheet—it does establish that holding-company synergies across unrelated operating assets remain unproven, leaving the burden of proof squarely on management.
The purge, and the man who ran it
Edward J. "Jim" McIntyre, who was named permanent president and chief executive officer at the start of 2012 after serving in an interim capacity, was direct about the strategic retreat.14 Reviewing 2011, McIntyre framed the period as the year in which the corporation "began to put the strategies behind this vision in motion"—that vision being a streamlined enterprise anchored by the regulated utility, executed through the divestitures of Idaho Pacific, E.W. Wylie, and Aviva, alongside the agreement to sell DMS Health Technologies.12
The maneuver was an orderly capitulation. Rather than attempting to defend the conglomerate structure, management dismantled it, absorbed the write-downs, and applied the divestiture proceeds to repair the balance sheet. Earnings guidance for 2012 was reset to $1.00 to $1.40 in diluted earnings per share, paired with planned capital expenditures of $125 million to $135 million concentrated almost entirely on the electric utility—a modest sum compared to the company's later capital budgets, but an unvarnished operational reset.12
The non-core subsidiaries were dismantled or sold, leaving three surviving reporting segments: Electric, Plastics, and Manufacturing. Whether those specific three businesses were preserved through prescient corporate strategy or simply because they were the assets salable at acceptable valuations between 2011 and 2013 remains an open question in the historical record. The plastics extrusion plants and BTD Manufacturing were consistently profitable and therefore viable to retain, whereas the chronic underperformers were liquidated. That was a pragmatic and disciplined corporate cleanup, even if it lacked grand strategic design.
The handoff
Charles S. "Chuck" MacFarlane, then president of Otter Tail Power Company, was appointed president and chief operating officer of the parent holding company effective April 14, 2014, with the expectation that he would succeed McIntyre at the 2015 annual shareholder meeting.15 That succession took place as scheduled on April 13, 2015, when MacFarlane assumed the chief executive role he continues to hold today.15
The operating posture he inherited and preserved was straightforward: the regulated utility represents the core franchise; the manufacturing and plastics businesses exist to throw off surplus cash flow to fund rate base expansion; and the long-term target is to migrate consolidated earnings toward a mix of roughly 70 percent electric.3 For six years, that capital allocation plan advanced quietly and without drama.
Then a winter storm hit Texas.
V. Act IV: The Plastic Gusher & The Non-Dilutive Compounding Machine (2020–2024)
Understanding what followed requires examining how a PVC pipe plant actually operates, because the common assumption about industrial manufacturing obscures the underlying economics.
Polyvinyl chloride resin is produced by combining chlorine—manufactured by running electricity through saltwater in a chlor-alkali facility—with ethylene, a petrochemical derived from natural gas liquids. The resulting intermediate, vinyl chloride monomer, is polymerized into a fine white powder. Nearly all North American production capacity is concentrated along the Gulf Coast, positioned adjacent to low-cost natural gas and salt deposits.
A pipe extruder purchases that resin powder, blends it with chemical additives, melts the compound, forces it through an extrusion die, cools the formed pipe, and cuts it into twenty-foot lengths. The extrusion process itself is not technologically complex, and its capital requirements are modest compared to the chemical complexes that manufacture resin. Because raw resin represents the dominant input cost, the economics of the business boil down to a single variable: the spread between the price realized per pound of finished pipe and the cost per pound of resin. Everything else is secondary.
Two physical realities define the competitive landscape. First, municipal water pipe is manufactured to rigid, standardized industry specifications—such as the AWWA C900 standard—meaning one certified manufacturer's twelve-inch pipe is functionally identical to a competitor's. Second, and more decisively, hollow pipe is primarily empty space, making long-distance freight prohibitively expensive. Because shipping pipe effectively means shipping air, freight economics enforce a strict geographic radius around each manufacturing facility. That distribution boundary explains why Northern Pipe's Fargo plant supplies the Northern Plains while Vinyltech's Phoenix facility serves the Desert Southwest, with neither plant meaningfully competing against the other.
The shock
In February 2021, Winter Storm Uri swept across the Texas and Louisiana Gulf Coast. Petrochemical complexes are not built to withstand sustained freezing conditions; sensitive instrumentation froze, and major manufacturing units tripped offline, taking weeks or months to resume normal operations. A substantial portion of North American chlor-alkali and PVC resin production vanished overnight. Later that year, Hurricane Ida battered Louisiana, prompting major feedstock producers to declare force majeure on raw material deliveries. Otter Tail's annual report highlighted these disruptions, noting that "PVC resin supply constraints, which limited PVC pipe manufacturing output and led to extremely low inventory levels," were compounded by the February freeze and the hurricane.1
Downstream, demand was accelerating simultaneously. Low interest rates fueled a pandemic-era homebuilding surge, municipal water districts expanded infrastructure budgets, and wholesale distributors found their inventory depleted.
The clash of supply disruption and elevated demand created an acute shortage where buyers became largely price-insensitive: a civil contractor facing idle work crews and contractual delay penalties loses far more money waiting for materials than by paying a premium for pipe. Consequently, finished pipe prices climbed rapidly—and outpaced raw material inflation. In 2021, Otter Tail's average PVC pipe sales price jumped 82.1 percent year over year, while its material costs increased 65.5 percent.1 In 2022, pipe prices rose an additional 66 percent even as sales volumes fell 19 percent, restricted by raw material shortages and softening demand.16
That pricing dynamic explains the windfall. In commodity conversion, profit margins are defined by the spread between input costs and output prices. When raw resin was rationed and finished pipe was urgently needed, that spread expanded far beyond the underlying economic value of the extrusion process itself.
What it did to the financials
The impact on Otter Tail's income statement was immediate and dramatic. The Plastics segment earned $27.6 million in 2020.1 Segment earnings climbed to $97.8 million in 2021,1 reached $195.4 million in 2022,16 and remained near historic highs with $187.7 million in 2023 and $200.7 million in 2024.2 In 2025, the segment earned roughly $170 million.17
The resilience of the 2023 results caught market observers off guard. Prevailing consensus assumed profit margins would normalize as Gulf Coast chemical complexes restored resin output. Instead, segment profit held above $187 million—barely four percent below the 2022 record—because pipe prices proved far stickier on the way down than resin prices did.216 That asymmetry, where input costs fell faster than finished product prices, formed the core allegation in subsequent antitrust complaints, though it can also characterize a persistently tight regional physical market. The public record does not adjudicate between those explanations, and both provide context for evaluating the period.
Viewed as an operational multiple rather than a line-item sequence, an industrial subsidiary that historically generated less than $30 million annually began producing seven times that volume of profit from a plant footprint employing about 200 people.3 Consolidated return on equity reached 25.6 percent in 2022.16 Cash flow from operations, which stood at $231.2 million in 2021, hit $389.3 million in 2022 and reached a record $452.7 million in 2024.162
This earnings surge clarifies the underlying nature of the windfall. A consolidated return on equity exceeding 25 percent at an enterprise dominated by a regulated electric utility would typically suggest an impenetrable competitive moat—or, alternatively, an unsustainable cyclical anomaly within a single division. Otter Tail's operating metrics confirmed the latter: sales volumes did not drive the expansion. In 2022, sales volumes fell 19 percent while segment earnings doubled.16 Growth stemmed entirely from realized pricing power, and that pricing power was born of an exogenous supply shock that the company neither engineered nor could indefinitely maintain.
The financing machine
Management's subsequent capital allocation strategy forms the more consequential half of the story, demanding critical evaluation rather than uncritical praise.
Rather than pursuing debt-fueled conglomerate acquisitions or large-scale share repurchases, executive leadership paid down corporate debt, raised the dividend, funded an expanding electric utility capital program entirely with internal cash flows, and directed modest capital toward brownfield plant expansions. Otter Tail completed the initial phase of a Vinyltech expansion in the fourth quarter of 2024, adding a large-diameter line that expanded segment capacity by roughly seven percent, with a second phase completed in early 2026 and a further roughly twenty-million-pound increase planned at Northern Pipe by about 2028.217
The dividend trajectory reflected this influx of liquidity while extending one of the company's defining historical distinctions: Otter Tail has paid a dividend without interruption for 88 consecutive years—a streak that survived the Great Depression, the 2011 loss year, and every downturn in between.4 The 2026 indicated annual rate of $2.31 represented a 10 percent increase, reflecting an acceleration beyond the company's historical growth rate that was directly enabled by the manufacturing cash windfall.45
As a consequence, equity funding for the utility's rate base arrived directly from parent-company retained earnings rather than public equity offerings. By the end of 2025, the equity layer stood at 63 percent with $386 million in cash, and management has consistently stated that the company faces no external common equity needs through at least 2030.45
This capital self-sufficiency warrants an important factual qualification. Market commentary occasionally asserts that Otter Tail issued no common equity during this entire cycle; in reality, in 2020 the company issued $52.4 million of common stock to fund capital expenditures at the utility.1 The more accurate and instructive finding is that starting in 2021, common share issuance was restricted to routine employee benefit and dividend reinvestment programs, with common shares outstanding rising only from 41.91 million to 41.99 million through the first half of 2026.17 That distinction is critical: the pipe windfall did not eliminate the utility's fundamental need for equity capital, but instead substituted retained earnings for issued equity for about five years.
Assessing this capital allocation requires balancing restraint against circumstance. Management avoided using the windfall to pursue speculative corporate acquisitions—a notable demonstration of discipline given the company's prior history of conglomerate expansion. Yet capturing the margin surge did not stem from strategic prescience; Otter Tail did not engineer the PVC spread, but simply inherited the benefits of an unprecedented market dislocation. Confronted with temporary excess cash, management's primary achievement lay in avoiding value-destroying diversions and funneling that liquidity into the regulated core.
The question that follows is whether the asset it funded is worth having.
VI. Act V: The Core Utility — Rate Base, MISO Tranches, and the Tri-State Compact
Driving west out of Fergus Falls on a winter morning, the operating realities of this utility become immediately apparent. The prairie stretches flat to the horizon, the wind is persistent, and the farmsteads sit a mile or more apart. This geography makes the Upper Midwest one of the most productive onshore wind corridors on the continent, yet simultaneously one of the most capital-intensive environments in which to deliver a kilowatt-hour to a residential meter: abundant generation potential paired with minimal customer density to absorb the cost.
Otter Tail Power Company’s operational response to that terrain has remained consistent for more than a century: own the transmission and distribution wires, maintain low baseline fuel costs, and navigate the competing policy mandates of three separate state utility commissions.
The rate base engine
In the regulated utility business, rate base is the primary engine of earnings. Otter Tail's rate base stood at approximately $2.11 billion at the end of 2025 and is projected to reach $3.42 billion by 2030—a compound annual growth rate of about 10 percent, backed by a $2.05 billion capital expenditure plan that allocates $1.921 billion directly to the electric utility.5 Within that electric allocation, transmission accounts for $855 million, renewable generation and battery storage take $645 million, distribution upgrades require $268 million, and other electric investments claim $153 million.5 Management raised its five-year rate base growth target from 7.7 percent to 9.0 percent in February 2025 and subsequently increased it to 10 percent, targeting long-term diluted earnings per share growth of 7 to 9 percent measured off a 2028 base year.25
Selecting 2028 as the baseline is telling. Using 2028 as the reference point implicitly acknowledges that consolidated earnings over the intervening years will contract rather than expand, and that baseline growth calculations only function once the normalization of plastics margins is complete. Management has disclosed this multi-year glide path openly rather than obscuring it.
Generation transition, and the politics of straddling three states
The utility's generation fleet has undergone a substantial physical transformation. The 150-megawatt Merricourt Wind Energy Center in southeastern North Dakota came online in December 2020.18 Astoria Station, a 245-megawatt simple-cycle natural gas combustion turbine in east-central South Dakota, was completed in 2021 to provide dispatchable peaking capacity backing intermittent wind generation.19 The 140-megawatt Hoot Lake coal plant in Fergus Falls was retired on May 27, 2021, after nearly a century of generation on that site, replaced by Hoot Lake Solar—a 49-megawatt facility across the former coal grounds requiring roughly $62 million in capital and nearly 130,000 panels, which joined the MISO market on August 8, 2023.2021 More recently, the utility completed a wind repowering project designed to expand output by 20 percent, secured regulatory approval for a roughly $120 million, 75-megawatt four-hour battery storage system at Hoot Lake scheduled for 2028 operation, and advanced solar developments at Solway and Abercrombie.4 In its 2025 integrated resource plan filings, the company proposed adding a 50-megawatt natural gas peaking facility in 2031 or 2032, alongside 100 megawatts of wind between 2035 and 2040.17
The central executive challenge is political as much as operational. Minnesota has legislated a mandate for 100 percent carbon-free electricity by 2040. North Dakota’s political economy is deeply tied to lignite mining and vigorously defends thermal baseload generation. Otter Tail must submit integrated resource plans to both commissions, alongside South Dakota regulators, navigating statutory mandates that are in direct tension. In practice, the utility has managed this divide by deploying low-cost renewables where wind resources are strongest while preserving thermal generation to protect grid reliability—a pragmatic posture that satisfies neither ideological camp, but one that state regulators have consistently approved.
Recent rate case outcomes reflect this balanced regulatory posture. In South Dakota, the company reached a settlement in March 2026 that implemented a 7.7 percent base rate increase effective April 1, 2026, paired with a rate moratorium running through December 2029—a structure that limits immediate revenue adjustments in exchange for multi-year regulatory certainty.7 In Minnesota, interim rates representing an 11.3 percent increase took effect on January 1, 2026, and the utility revised its requested permanent annual revenue increase down to $42.3 million in July 2026 based on updated test-year filings.717
Transmission, and why it is the best asset in the portfolio
MISO's Long Range Transmission Planning process represents the single largest driver of the capital budget. Otter Tail holds ownership stakes in MISO Tranche 1 projects, including the Jamestown-to-Ellendale 345-kilovolt transmission line in North Dakota, developed jointly with Montana-Dakota Utilities—a project MISO estimated at roughly $439 million in total cost.2223 By the second quarter of 2026, the company had secured route permits for two Tranche 1 345-kilovolt projects covering nearly 200 miles, which executive leadership described as "important milestones in the development of these reliability-driven investments."17 Otter Tail also owns an interest in the 163-mile, $215 million Big Stone South–Ellendale 345-kilovolt line, one of MISO's earlier multi-value projects.24
The economic appeal of transmission capital lies in its regulatory structure. Unlike local generation or distribution assets regulated by state commissions using historical test years, interstate transmission lines fall under the jurisdiction of the Federal Energy Regulatory Commission, which establishes formula rates. Formula rates update annually and recover invested capital largely as it is spent, significantly compressing regulatory lag—the delay between spending capital and earning a return on it. While a state test-year proceeding can defer cost recovery for twelve to thirty-six months, depressing realized returns below authorized levels, formula rates reduce that gap near zero. From a corporate finance perspective, an incremental dollar of capital deployed in a FERC-jurisdictional transmission project yields higher cash-flow certainty than the same dollar invested in a state-regulated distribution substation.
The planning framework itself provides structural insulation. As the regional transmission organization coordinating the grid across fifteen states and parts of Canada, MISO identifies regional high-voltage corridors necessary to export remote wind and solar generation from rural production zones like North Dakota to distant urban load centers. When MISO designates these lines as regional reliability projects, construction costs are shared across ratepayers throughout its multi-state footprint rather than loaded entirely onto local customers, while incumbent utilities retain the franchise right to construct and own the infrastructure within their service territories. For a small utility operating amid exceptional wind resources, this mechanism enables substantial capital deployment without placing an unbearable rate burden on a sparse local customer base.
Yet this regulatory advantage carries distinct risks that management highlighted on the fourth-quarter 2025 earnings call: large transmission lines face contentious right-of-way permitting disputes, while broader industry complaints pending before FERC continue to challenge authorized transmission return levels.4 Because formula-rate returns are established administratively by federal regulators, they remain vulnerable to downward adjustment through litigation—a material risk to the highest-margin segment of the utility's capital expenditure plan.
The load question
Alongside grid investments, Otter Tail faces potential demand-side acceleration for the first time in its modern corporate history. Management has disclosed a large-load interconnection pipeline totaling approximately 1,400 megawatts under preliminary letters of intent, with roughly 35 percent tied to prospective data centers and the remainder spanning clean fuel, agricultural processing, and industrial thermal storage—a pipeline expanded by 350 megawatts during the second quarter of 2026.517
At this stage, prudent financial analysis requires discounting these figures. Letters of intent represent non-binding exploratory agreements rather than definitive power service contracts, and commercial inquiries do not guarantee an energized customer. Executive leadership struck a similarly cautious tone on the fourth-quarter 2025 earnings call, expressing optimism regarding the 430-megawatt data center opportunity while emphasizing that management is "being prudent" and confirming that no speculative large-load capital expenditures are incorporated into the five-year plan.4 Nevertheless, the shift in commercial interest is notable: after more than a century in which utility growth was constrained by rural depopulation and stagnant electricity demand across the Upper Midwest, the primary operational challenge could eventually shift toward infrastructure buildout velocity.
Yet none of this utility expansion resolves the earnings challenge developing on the other side of the corporate ledger.
VII. Act VI: The Historical Falsification Layer — The Antitrust Reckoning & Spread Normalization
Every commodity processor that generates extraordinary returns eventually faces a fundamental question: did the outsized profits stem from superior operating execution, or simply from an unprecedented market dislocation?
Management’s affirmative case for the Plastics segment has centered on measurable operational strengths. The geographic freight radius provides natural insulation. Municipal water utilities place real commercial value on dependable delivery timelines and local supplier relationships. Otter Tail's plants maintained high utilization during widespread industry outages. Management has pointed to capital investments expanding capacity at Vinyltech and Northern Pipe as proof that it is reinforcing a defensible market position rather than merely harvesting a windfall.
That narrative encountered direct scrutiny on August 27, 2024, when the Department of Justice's Antitrust Division served the corporation with a federal grand jury subpoena issued by the U.S. District Court for the Northern District of California, compelling documents concerning the manufacturing, distribution, and pricing of PVC pipe.6 The company stated that it was cooperating with the inquiry and intended to satisfy its legal obligations.6 Competitors across the industry, including Atkore and Westlake, disclosed receiving grand jury subpoenas in the same investigation.
The civil case
Civil antitrust litigation had materialized days earlier. A consolidated class action filed in the Northern District of Illinois in late August 2024 named a broad roster of defendants: Atkore, Westlake, the commodity price-reporting service OPIS, and pipe extruders including Cantex, Diamond Plastics, IPEX USA, JM Eagle, National Pipe & Plastics, Prime Conduit, Southern Pipe, and Otter Tail Corporation.[^25] The proceeding was consolidated under the caption In re: PVC Pipe Antitrust Litigation, Case No. 1:24-cv-07639.8
The plaintiffs' underlying theory directly challenged how investors should interpret the extraordinary profit margins realized between 2021 and 2023. The complaint alleged that the extruder defendants utilized OPIS price reporting as an industry-wide coordination channel—submitting forward-looking price increases that functioned less as objective reporting and more as signaling mechanisms to rivals, enabling independent extruders to implement and maintain elevated prices during a period of genuine supply disruption. The lawsuits asserted claims under Section 1 of the Sherman Act, exposing defendants to potential joint and several treble damages.[^25]
In October 2025, the Justice Department moved to intervene in the civil action to secure a partial six-month stay of document discovery, which the federal court granted—a procedural intervention that typically indicates an active criminal grand jury investigation proceeding in parallel.6
The settlements
Rather than taking the claims before a jury, Otter Tail resolved the civil lawsuits. On May 28, 2026, the company announced that Northern Pipe Products and Vinyltech had agreed to pay $39.5 million to resolve claims brought by direct purchasers and $34.0 million to settle claims from non-converter seller purchasers.8 On June 17, 2026, the subsidiaries agreed to a further $30.0 million settlement with the end-user purchaser class.9 In the second quarter of 2026, Otter Tail recognized a pre-tax litigation charge of $103.5 million, representing $1.84 per diluted share after tax, charged entirely to the Plastics segment.717 That charge pushed the segment into a quarterly GAAP net loss of $30.1 million, compared to net income of $53.1 million in the prior-year period, while $73.5 million in settlement payments were deposited into restricted escrow accounts at June 30 awaiting final judicial approval.7
The accounting mechanics carry practical implications for reading the company's financial statements over subsequent quarters. Recognizing the entire $103.5 million charge in the second quarter of 2026 reduced GAAP earnings, and shifting $73.5 million into restricted escrow removed that capital from unrestricted corporate liquidity even before the settlements secured final court approval.7 Consequently, quarterly financial comparisons through mid-2027 will reflect a wide dispersion between GAAP results and the adjusted figures management presents, which exclude the settlement expenses.17 Both metrics serve distinct analytical functions: adjusted figures illustrate ongoing segment operating performance, while GAAP figures account for the actual cash outflow borne by shareholders.
The settlement agreements explicitly state that the accords do not constitute "an admission by the Company of any wrongdoing, fault, or liability."8 Such clauses represent standard commercial litigation terms that provide neither formal culpability nor factual vindication. Management stated that resolving the litigation mitigated prolonged legal expenses, management distraction, and severe financial exposure.9 Addressing the resolution during the second-quarter 2026 earnings call, Chief Executive Chuck MacFarlane stated that the settlement "does not change any pricing or relationship with the customers."17
Weighing it
These legal outcomes significantly clarify whether elevated plastics margins reflected a durable, proprietary competitive moat.
The evidence does not dismantle the operational business, but it sharply limits the moat thesis. Physical realities continue to support the baseline franchise: high freight costs on hollow pipe enforce geographic insulation, and a regional extruder that delivers inventory within days commands a genuine commercial advantage over distant Gulf Coast competitors. Volume trends during the subsequent price normalization further substantiate that underlying franchise: sales volumes rose 8 percent in 2025, advanced 7 percent in the first quarter of 2026, and climbed 15 percent in the second quarter—performance consistent with a regional manufacturer maintaining market share rather than surrendering territory.42517
What the record refutes is the expansive claim that the peak profitability of 2021 through 2024 demonstrated company-specific pricing power. Three separate factors dismantle that interpretation: the margin expansion was an industry-wide windfall triggered by severe petrochemical freeze events; the pricing mechanisms generated a federal criminal grand jury investigation; and the parent company paid $103.5 million to settle civil claims tied to those exact pricing years rather than defending its practices in open court.
The balanced conclusion is that Otter Tail’s extrusion subsidiaries possess a stable regional position capable of delivering sound mid-cycle returns, on top of which the company captured several hundred million dollars of temporary scarcity rents that carried substantial legal friction and cannot be treated as recurring. Capitalizing that modest operational baseline is defensible; treating the peak earnings spread as a permanent corporate capability has proven unsupportable.
The third claim, dismantled by management
This reality directly refutes the premise that elevated plastics earnings represent a permanent structural shift. In an unusual dynamic for public equity analysis, management's own multi-year guidance provides the most explicit confirmation that earnings are resetting.
Corporate leadership has communicated that trajectory without ambiguity. During the fourth-quarter 2025 earnings call, executives identified 2028 as "the first full year of earnings within our $45,000,000 to $50,000,000 range" for the Plastics segment, projecting ongoing margin compression through 2027 alongside an estimated 20 percent decline in average 2026 PVC pipe prices relative to 2025.4 Detailed disclosures released with the second-quarter 2026 financial results outlined this glide path systematically: segment earnings dropping from approximately $170 million in 2025 to roughly $130 million in 2026, ultimately settling into the $45 million to $50 million normalized band by 2028.5
That represents an anticipated earnings contraction of roughly 75 percent from the 2024 high of $200.7 million. Management has consistently guided toward this normalization rather than portraying the windfall as enduring, having alerted investors as early as the 2021 annual report to anticipate "a gradual return to more normal business conditions."1 That transparency across five consecutive years reinforces management credibility, providing solid justification for relying on the company's financial targets elsewhere.
Recent quarterly results have modestly outpaced that conservative glide path. Second-quarter 2026 extrusion volumes expanded 15 percent, exceeding internal projections, while realized prices declined 14 percent—a milder drop than budgeted—prompting the company to raise its full-year 2026 adjusted diluted EPS guidance to a range of $5.68 to $6.08, up from $5.22 to $5.62, excluding the antitrust charge.17 However, executive leadership attributed that volume acceleration primarily to wholesale distributors purchasing ahead of announced resin feedstock increases, with the chief financial officer noting directly that the company expects "sales volumes to be softer in the second half of the year."17 Customer pull-forward merely advances shipment timing across quarters; it does not expand total end-market demand.
The trajectory of the pipe extrusion business is therefore well defined: profit margins will continue descending toward historical baselines. The central question for investors is what the remaining corporate portfolio delivers once that normalization is complete.
VIII. Act VII: The Third Leg — BTD Manufacturing & Cyclical Realities
BTD Manufacturing is the least discussed and most conventionally industrial component of Otter Tail. It cuts, stamps, welds, and paints metal to customer specifications at production facilities in Detroit Lakes and Lakeville, Minnesota; Dawsonville, Georgia; and Washington, Illinois. Alongside BTD sits T.O. Plastics, which thermoforms plastic parts — including horticultural growing trays, specialty packaging, and components for medical and industrial customers. Together, the Manufacturing segment employed 1,235 people at the end of 2025, roughly six times the headcount of the Plastics segment that earns several times as much.3
The customer base explains the operating dynamics. BTD serves as a tier-one contract supplier to agricultural equipment manufacturers, recreational vehicle and powersports makers, lawn and turf equipment companies, and industrial original equipment manufacturers. Otter Tail's disclosures highlight significant customer concentration, noting that two key accounts represent meaningful revenue percentages in certain product lines.3
Testing the counter-cyclicality claim
The original conglomerate thesis held that non-utility manufacturing would provide ballast during periods of utility weakness. The historical record fails to support that hypothesis, and the economic mechanism behind that breakdown is straightforward: BTD's primary end markets are among the most interest-rate-sensitive and cycle-exposed sectors in the industrial economy.
When interest rates climbed, dealer floorplan financing costs escalated alongside them, prompting equipment dealers who had over-inventoried during the pandemic boom to halt new orders. Consumer purchases of discretionary recreation equipment like snowmobiles and all-terrain vehicles fell sharply. Meanwhile, capital spending on farm equipment retrenched as agricultural commodity prices softened. Those headwinds flowed directly through the income statement: Manufacturing net income dropped from $21.5 million in 2023 to $13.7 million in 2024 — a decline of roughly 36 percent — and fell a further 16 percent in 2025.24 Initial segment earnings guidance for 2025 had anticipated an even steeper 27 percent decline.2
The resulting earnings correlation is revealing. Manufacturing profits contracted during the exact multi-year stretch when utility net income was expanding steadily and plastics margins were sitting at record highs. Rather than functioning as a counter-cyclical hedge, the business simply amplified cyclical volatility during an industrial downshift. The claim that contract manufacturing provides defensive portfolio ballast fails against that empirical record.
During the second-quarter 2026 earnings call, Chief Executive Chuck MacFarlane acknowledged that agricultural exposure directly, describing market conditions as "difficult due to the weak farm economy with elevated costs, lower relative commodity prices and ongoing trade disruption."17
The structural problem, and the recent turn
Contract metal fabrication is structurally constrained by limited pricing power. The purchasing customer owns the product design and frequently the dedicated tooling. While switching costs do exist — re-qualifying an alternative supplier and moving tooling typically requires several months — those barriers are measured in quarters rather than years. Moreover, large industrial OEMs routinely enforce procurement programs that mandate annual price concessions from their supply base. When order volumes contract, a fabricator with fixed plant overhead absorbs the operational deleverage directly; it cannot pass unabsorbed costs along to customers who can easily solicit competing bids.
The operational counterweight is that contract fabrication rewards tight floor-level execution, where disciplined cost controls define the boundary between modest profitability and operating losses. In the first half of 2026, operating results rebounded: Manufacturing net income rose to $4.3 million in the first quarter from $1.5 million a year earlier, and reached $4.6 million in the second quarter compared to $3.5 million — a 31 percent year-over-year improvement driven by a favorable product mix, higher shipment volumes across construction and horticultural end markets, and improved utilization at the expanded Georgia plant.25717 Encouraged by that demand recovery, management raised full-year segment guidance.17 Even so, executives acknowledged on the second-quarter call that the division operated at roughly a 5 percent net profit margin across the first six months of the year, emphasizing that further margin expansion remains strictly dependent on sustaining volume leverage.17
For investors, Manufacturing is best understood as a modest, competently operated, low-margin cyclical business that generates dependable incremental cash flow but cannot alter the parent company's long-term trajectory in either direction. Corporate capital allocation reflects this reality: of the $2.05 billion five-year capital plan through 2030, only roughly $129 million — approximately six percent — is allocated to Manufacturing and Plastics combined.5 That restrained budget confirms where executive leadership places its strategic priorities, and the underlying returns validate that choice.
With all three operating segments established across the corporate ledger, the central analytical question comes into clear focus: where, precisely, does Otter Tail possess a durable economic moat that competitors cannot easily copy?
IX. Act VIII: Playbook, 7 Powers & Porter's 5 Forces
Strip away the corporate narrative, and Otter Tail Corporation is effectively three distinct businesses with sharply divergent competitive characteristics bound to a single balance sheet. Evaluating those operations through Hamilton Helmer's 7 Powers framework produces an unusually clean division—primarily because durable economic advantages are concentrated almost entirely in a single segment.
Cornered resource — strong, and present only in Electric. Exclusive franchised service territories across Minnesota, North Dakota, and South Dakota, established by statute and administered by state utility commissions, represent as close to an uncontestable asset as public equity markets offer. No competing utility will construct a parallel distribution grid across Fergus Falls. Layered atop that physical distribution network are incumbency advantages within the Midcontinent Independent System Operator (MISO) transmission planning framework, where regional grid footprints confer rights of first refusal on high-voltage transmission lines in states that permit them. This regulatory apparatus generates virtually all of Otter Tail's durable economic rent.
Scale economies — moderate, and geographically bounded, in Plastics. Freight logistics impose a real operational barrier, but it is strictly local. Shipping hollow conduit across long distances is economically unviable, which shields Northern Pipe in the Northern Plains and Vinyltech in the Desert Southwest from remote Gulf Coast manufacturers. That dynamic does not, however, prevent a rival from constructing an extrusion line within the same shipping radius, nor does it confer pricing advantages outside those regional corridors. It functions as a freight-enforced regional cost buffer rather than proprietary scale power.
Process power — modest, in Manufacturing. Custom tool-and-die capabilities, automated robotic welding cells, and rapid engineering turnarounds introduce friction for original equipment manufacturers considering a change in supplier. Yet that friction is temporary: contracts can be re-bid and tooling relocated within two to four quarters.
Switching costs — low across both unregulated businesses. Certified pipe conforming to AWWA standards is chemically and functionally interchangeable, while contract sheet-metal components can be transitioned to competing job shops. This commoditization represents the central structural reality of the non-utility divisions: their profitability is governed by cyclical spreads rather than predictable annuities.
Network effects, branding, and counter-positioning — absent. A municipal utility derives no added benefit from Otter Tail's pipe simply because neighboring water districts install it. Municipal infrastructure procurement offers no brand premium, and the company operates no novel business architecture that incumbents cannot replicate.
This strategic audit yields a conclusion at odds with the traditional conglomerate pitch: nearly all of Otter Tail's structural economic power resides in the regulated utility segment that, as recently as 2024, contributed less than a third of consolidated corporate net income.
Porter, applied
Supplier power is severe in Plastics. Polyvinyl chloride resin is manufactured by a highly consolidated oligopoly of integrated chemical producers, including Westlake, Shintech, Formosa Plastics, and OxyChem. When raw material supply tightens, resin producers extract the economic rent. The dislocation of 2021 and 2022 proved extraordinary only because finished pipe supplies were even tighter than raw chemical feeds—a rare, transient supply imbalance that could not permanently reverse the bargaining dynamic.
Buyer power is pronounced in Manufacturing and negligible in Electric. Industrial original equipment manufacturers wield considerable bargaining leverage over tier-one fabrication suppliers, routinely demanding contractual price reductions. Retail electric customers, conversely, possess no alternative power provider. That customer dependency is countered by state utility commissions and public advocacy staff who act as institutional buyers, scrutinizing utility capital budgets and rejecting unmerited cost recovery.
Threat of substitution is low in Electric and moderate in Plastics. Ductile iron, high-density polyethylene, and reinforced concrete compete directly against PVC in water infrastructure, even though PVC maintains an edge in four- to twelve-inch municipal distribution mains. Material substitution progresses deliberately through municipal engineering specifications rather than overnight shifts, yet that substitution threat imposes an economic ceiling on how far PVC pipe prices can climb before civil engineers specify alternative conduits.
Rivalry is intense across the industrial operations and structurally suppressed in Electric. Suppressing destructive utility rivalry in exchange for universal service and rate oversight is the core rationale of the state regulatory compact.
Threat of new entry is non-existent in Electric and persistent in Plastics. Entering regulated electric transmission and distribution is foreclosed by state utility statutes. In pipe extrusion, the technology is standardized, production machinery is commercially available, and the primary hurdle to new capacity is capital investment—an incentive that multi-year margin windfalls inevitably create across an industry.
The transferable lesson
The enduring insight from Otter Tail's trajectory extends well beyond municipal pipe or prairie transmission lines. For equity investors, a regulated utility’s most valuable feature is not its commission-authorized rate of return—which is legally capped—but its capacity to absorb substantial, recurring increments of capital at that approved return for decades, with negligible risk of asset obsolescence. What Otter Tail demonstrated between 2021 and 2025 is that when an operator can fund that expanding capital program using internally generated cash from an unregulated subsidiary rather than recurrent common share offerings, the enterprise compounds shareholder value with exceptional efficiency.
The historical corollary, which the corporation’s restructuring from 1989 through 2013 documented through repeated impairments, is that an unregulated business retained to generate that growth capital must be evaluated strictly on whether it reliably delivers it. Diversification for its own sake provides no structural defense. Dehydrated potato flakes and wind tower fabrication drained capital rather than supplying it. Polyvinyl chloride pipe delivered an unprecedented cash windfall across four extraordinary years, but management's own glide path confirms it will not sustain that pace.
That reset brings the ultimate investment assessment into sharp focus.
X. Act IX: Analysis, Bull vs. Bear & Epilogue
Management, assessed on behavior
Chuck MacFarlane has led the corporation since April 2015, rising through the electric utility rather than the non-utility holding company.15 Evaluating his tenure against standard governance benchmarks—matching public commitments against operational results, narrative consistency over time, and candor regarding setbacks—reveals a disciplined operating record bounded by clear structural limits.
On the positive side of the ledger, strategic direction has remained remarkably stable. In 2015, management established an explicit goal of transforming Otter Tail into a utility-centric enterprise generating roughly 70 percent of consolidated earnings from regulated operations—a milestone now targeted for 2028.35 When hundreds of millions of dollars in unexpected cash arrived, leadership avoided speculative acquisition sprees, resisting the conglomerate impulses that crippled previous administrations. Financial guidance has been reliable; 2025 diluted earnings per share reached $6.55, finishing at the upper boundary of the range established twelve months earlier.25 Furthermore, executives communicated the temporary nature of elevated plastics margins as early as the 2021 financial report rather than presenting the normalization late in the cycle.14
The limiting factors, however, are equally substantive. The primary catalyst behind the company's five-year earnings surge was an exogenous supply shock rather than operational brilliance. Capital allocation that consists largely of avoiding self-inflicted wounds represents basic fiduciary hygiene rather than superior strategic vision. Moreover, the $103.5 million civil antitrust settlement represents a serious governance and risk-oversight failure that occurred directly on this leadership team's watch—within a division whose outsized margins management regularly highlighted to equity analysts.
Executive succession has advanced with deliberate continuity. Kevin Moug retired as chief financial officer on December 31, 2025, concluding a 27-year tenure.26 Todd Wahlund succeeded him briefly before transitioning on April 13, 2026, to become senior vice president and president of Otter Tail Power Company—placing an executive with 34 years at the firm and two decades inside the regulated utility directly in charge of executing the multi-state transmission buildout.26 Tim Rogelstad, a utility veteran since 1989 and its operating president since 2014, stepped up to become president of Otter Tail Corporation, overseeing both the electric and manufacturing platforms.26 Tyler Nelson, who arrived in 2020 from Titan Machinery following senior roles at Grant Thornton, took over as vice president and chief financial officer.26 MacFarlane described the appointments as the culmination of "long-standing succession planning."26 At the board level, directors Thomas J. Webb and Kathryn O. Johnson announced in late August 2026 that they will retire at the 2027 annual shareholder meeting pursuant to mandatory retirement policies, with regulatory filings confirming no policy disagreements with corporate leadership.27
Executive compensation remains tied to consolidated earnings per share growth, utility return on equity, and relative total shareholder return measured against a peer utility index. That formula created an obvious governance anomaly: between 2021 and 2024, executive incentive pools paid out heavily on commodity pipe spreads that corporate leadership itself conceded were wholly unsustainable. While common across diversified holding companies, that compensation asymmetry provides ready ammunition for activist critique.
The activist stress test
What vulnerabilities would an activist investor target across this portfolio?
Conglomerate structure remains the most conspicuous target. When an enterprise's entire economic moat resides in a regulated electric utility, while its second-largest segment faces an anticipated earnings contraction of roughly 75 percent, the strategic rationale for retaining non-utility businesses becomes difficult to defend. The traditional counter-argument—that the pipe division finances utility capital expenditure without equity dilution—carries substantial weight through 2030 but weakens rapidly thereafter, because an industrial unit earning $45 million to $50 million annually cannot meaningfully subsidize a utility budget exceeding $400 million a year. An activist's playbook would call for divesting Plastics and Manufacturing at normalized market multiples, using after-tax proceeds to recapitalize the utility or distribute capital to shareholders. Management has shown zero appetite for divestitures, and there is a compelling operational defense: liquidating a cyclical business at the trough of its spread cycle, immediately following a nine-figure antitrust settlement, guarantees poor valuation realization.
The second vulnerability centers on earnings quality. From 2021 through 2025, consolidated results blended a stable rate-regulated utility earning roughly 10 percent on equity with an unregulated commodity converter earning extraordinary scarcity returns. Market participants who capitalized that composite income stream at a blended utility multiple effectively priced a transient spread as if it were a perpetual rate base.
The third vulnerability is the unresolved legal overhang. While civil purchaser classes agreed to settle subject to final judicial confirmation, the Department of Justice's criminal antitrust investigation proceeds independently. Otter Tail has explicitly disclosed that an unfavorable antitrust determination could exert a material adverse effect on corporate financial condition, operating results, and liquidity.6 That systemic liability remains open.
The bull case
One: the utility emerging from the glide path will be exceptionally well-capitalized. Most regulated electric utilities finance aggressive rate base expansion through constant equity dilution. Otter Tail funded five consecutive years of accelerated utility investment entirely out of internally generated cash flow, maintained investment-grade credit ratings with stable outlooks across all three major rating agencies, and scheduled the retirement of $80 million in parent-level debt maturing in the fourth quarter of 2026 without refinancing—leaving corporate debt concentrated almost entirely at the operating utility.517 If management delivers its projected 10 percent rate base compound annual growth rate to $3.42 billion by 2030 without issuing public equity, per-share value compounding will significantly outpace peers whose expansion requires 3 to 5 percent annual share dilution.5
Two: the normalized plastics earnings floor could settle above historical guidance. Vinyltech's brownfield facility expansion is fully operational and Northern Pipe's plant project remains on schedule, introducing production capacity that never existed during prior cycle troughs into a market buttressed by long-term federal funding for municipal water infrastructure.17 Shipment volumes have consistently outrun corporate budgets throughout the price descent. If the extrusion segment normalizes at $55 million to $60 million in baseline net income rather than the guided $45 million to $50 million band, terminal cash flow assumptions improve substantially.
Three: portfolio mix shift will materially enhance earnings quality. As regulated electric earnings migrate back toward 70 percent of consolidated net income by 2028, cash flow visibility and predictability will rise in tandem.5 Whether equity markets reward that stability with a premium multiple remains an open market question, but the underlying cash flows will undeniably become more defensive.
Four: the large-load pipeline provides unpriced commercial optionality. Management has excluded speculative large-load capital expenditures from its baseline five-year budget.4 If even a modest fraction of the 1,400-megawatt interconnection pipeline converts into executed commercial tariffs, it represents pure incremental upside to current earnings guidance.
The bear case
One: a multi-year earnings decline is locked in by arithmetic. Net income within the Plastics segment is guided downward from approximately $170 million in 2025 to a normalized band of $45 million to $50 million by 2028.5 A regulated utility expanding its rate base at 10 percent per year cannot quickly offset a $120 million contraction on the industrial ledger. Consolidated earnings per share must decline across several consecutive reporting periods before sustained expansion resumes, which explains why executive leadership reset long-term growth targets against a 2028 baseline. Public equity markets and quantitative fund strategies rarely treat protracted earnings contractions kindly.
Two: the balance-sheet financing advantage carries a firm expiration date. Management's pledge of zero external common equity needs through at least 2030 is strictly time-bounded.5 Once that window closes, an electric utility operating a $3.4 billion rate base compounding at high single digits, supported by an industrial affiliate throwing off less than $50 million in annual profit, will face the same equity-dilution treadmill as every other regional power provider. The pipe windfall built an enviable bridge, but not an eternal funding engine, and executives have never claimed otherwise.
Three: regulatory and criminal litigation risks remain unresolved. The federal grand jury investigation conducted by the Justice Department remains open. Concurrently, the $103.5 million civil class action settlements await final judicial approval, with $73.5 million in settlement funds sequestered in restricted escrow accounts.7 On the utility side, pending FERC complaint proceedings challenging transmission return allowances, paired with regional right-of-way permitting friction, threaten the highest-margin component of the utility's capital budget.4
Four: regional political tensions could compress realized utility returns. Otter Tail must execute Minnesota’s statutory mandate for 100 percent carbon-free electricity by 2040 across an economically sensitive rural customer base with finite appetite for utility rate inflation. While management targets customer bill increases of 3 to 4 percent compounded annually over five years and highlights baseline tariffs well below national averages as adequate regulatory headroom, that cushion has limits.4 If organized consumer resistance mounts, state commissions can disallow capital recovery, lengthen amortization horizons, or shave authorized returns—any of which erodes projected compounding.
Five: the historical track record on conglomerate capital allocation remains negative. Over a multi-decade horizon, the parent company's attempts to create shareholder value through non-utility diversification destroyed substantial equity capital. That historical precedent represents the single most critical lens through which any long-term claim about Otter Tail's non-utility operations must be judged.
The three KPIs
The realized PVC pipe spread. Otter Tail reports average sales prices and resin feedstock cost adjustments every quarter. The dollar gap between those two numbers represents virtually the entire profit engine of the Plastics segment, and it constitutes the most volatile variable across the consolidated model. Tracking whether the margin descent toward the $45 million to $50 million annual run-rate runs ahead of or behind management's 2028 schedule is the single most informative exercise for investors.
Rate base expansion versus realized utility ROE. Expanding rate base by 10 percent annually compounds economic value only if the operating utility actually earns its authorized return on that capital. The realized spread against authorized ROE across Minnesota, North Dakota, and South Dakota—governed by test-year regulatory lag, cost disallowances, and the precise revenue mix between FERC formula-rate transmission lines and state-jurisdictional distribution assets—determines whether the five-year capital budget translates into per-share earnings growth.
Parent-level liquidity versus utility capital deployment. This is the decisive crossover indicator. The non-dilutive compounding thesis depends on combined non-utility cash generation and utility operating cash flow fully covering utility capital outlays. The moment that relationship breaks down is the moment common equity dilution returns to the forecast, and the strain will surface in unrestricted cash balances and short-term credit facility draws long before it appears in a quarterly earnings presentation.
Epilogue
One interpretation of Otter Tail's recent history frames it as a masterclass in opportunistic capital allocation. An alternative interpretation dismisses it as a mundane utility that encountered extraordinary luck, harvested a windfall, and is now returning to its modest historical mean. Neither narrative captures the nuanced reality.
The actual history is far more specific. A regional utility holding company burdened by a demonstrably poor record of non-utility diversification happened to operate two pipe extrusion plants when an unprecedented petrochemical freeze paralyzed North American resin supply. It received hundreds of millions of dollars in windfall profits that it neither engineered nor could permanently sustain. Yet unlike its corporate predecessors, and unlike countless other enterprises blessed with sudden liquidity, management did not squander the capital on speculative acquisitions or vanity projects. It plowed the proceeds into the single asset it genuinely understands and that compounds capital over decades: rate-regulated poles and wires across the Upper Midwest.
Whether that strategy ultimately rewards long-term shareholders depends on concrete operational milestones: whether the utility can execute a two-billion-dollar infrastructure program on schedule and within budget; whether three distinct state utility commissions allow the company to earn authorized returns on those assets; whether the plastics business establishes an earnings floor near the upper end of its historical range; whether the federal criminal inquiry concludes without structural damage; and whether, once the plastics windfall is fully absorbed beyond 2030, leadership maintains its capital discipline or reverts to financial engineering.
Out on the Otter Tail River, the Dayton Hollow hydroelectric station still generates electricity, more than a century after Wright and Barrows gathered $100,000 to construct it. The dam has outlasted dehydrated potato plants, regional radio stations, flatbed trucking fleets, inflatable water trampolines, and wind turbine towers. That regulated durability is the company's only enduring asset. Everything else has been an experiment.
References
-
Otter Tail Corporation Q4 and Full-Year 2021 Earnings Release (Form 8-K, Exhibit 99.1) — U.S. Securities and Exchange Commission, 2022-02 ↩↩↩↩↩↩↩↩↩↩
-
Otter Tail Corporation Announces Record Annual Earnings and Increases Long-Term Financial Targets — Otter Tail Corporation, 2025-02-17 ↩↩↩↩↩↩↩↩↩↩↩↩↩
-
Otter Tail Corporation Form 10-K Annual Report for the Fiscal Year Ended December 31, 2025 — U.S. Securities and Exchange Commission, 2026-02 ↩↩↩↩↩↩
-
Otter Tail (OTTR) Q4 2025 Earnings Call Transcript — The Motley Fool, 2026-02-17 ↩↩↩↩↩↩↩↩↩↩↩↩↩↩↩↩
-
Otter Tail Q2 2026 slides: $2B utility buildout, plastics reset — Investing.com, 2026-08 ↩↩↩↩↩↩↩↩↩↩↩↩↩↩↩
-
Otter Tail Corporation Form 10-Q for the Quarterly Period Ended September 30, 2025 — U.S. Securities and Exchange Commission, 2025-11 ↩↩↩↩↩
-
Otter Tail Corporation Form 10-Q for the Quarterly Period Ended June 30, 2026 — U.S. Securities and Exchange Commission, 2026-08 ↩↩↩↩↩↩↩↩↩
-
Otter Tail Corporation Form 8-K: PVC Pipe Antitrust Settlement Agreements with Direct Purchaser and Non-Converter Seller Purchaser Classes — U.S. Securities and Exchange Commission, 2026-05-28 ↩↩↩↩
-
Otter Tail Corporation Form 8-K: End-User Purchaser Class Settlement Agreement — U.S. Securities and Exchange Commission, 2026-06-17 ↩↩↩
-
Otter Tail Power Company — International Directory of Company Histories, via Encyclopedia.com ↩↩↩↩↩↩↩↩↩↩↩↩↩↩↩↩
-
Otter Tail Corporation Form 10-K Annual Report for the Fiscal Year Ended December 31, 2011 — U.S. Securities and Exchange Commission, 2012-02 ↩↩↩
-
Otter Tail Corporation Reports 2011 Financial Results and Issues 2012 Earnings Guidance, Declares Quarterly Dividend — Otter Tail Corporation, 2012-02 ↩↩↩↩
-
Otter Tail Corporation Announces First Quarter Earnings; Completes Sale of DMS Health Technologies, Inc. and Updates Earnings Guidance — Otter Tail Corporation, 2012-05 ↩
-
Otter Tail Corporation Selects Edward J. McIntyre as Permanent President and Chief Executive Officer — GlobeNewswire, 2012-01-03 ↩
-
Otter Tail Corporation Appoints Charles S. MacFarlane President and Chief Operating Officer — GlobeNewswire, 2014-02-06 ↩↩↩
-
Otter Tail Corporation 2022 Year-End Earnings Release (Form 8-K, Exhibit 99.1) — U.S. Securities and Exchange Commission, 2023-02 ↩↩↩↩↩↩
-
Otter Tail (OTTR) Q2 2026 Earnings Call Transcript — The Motley Fool, 2026-08-03 ↩↩↩↩↩↩↩↩↩↩↩↩↩↩↩↩↩↩
-
We're Advancing Plans To Add Electricity Generation From Natural Gas In South Dakota And Wind In North Dakota — Otter Tail Power Company ↩
-
We've completed Astoria Station! — Otter Tail Power Company ↩
-
Otter Tail Power Company connects Hoot Lake Solar to energy market for distribution across country — Lakes Area Radio, 2023-08-11 ↩
-
Jamestown to Ellendale Transmission Project — Otter Tail Power Company and Montana-Dakota Utilities ↩
-
MISO Long Range Transmission Planning (LRTP) — Midcontinent Independent System Operator ↩
-
163-mile Big Stone South To Ellendale Transmission Line Energized — Otter Tail Power Company ↩
-
Otter Tail Corporation Q1 2026 Earnings Release (Form 8-K, Exhibit 99.1) — U.S. Securities and Exchange Commission, 2026-05-05 ↩↩↩
-
Otter Tail Corporation Announces President and CFO Transitions — Otter Tail Corporation, 2026-04-14 ↩↩↩↩↩
-
Otter Tail Corporation Form 8-K: Director Retirement Notifications — U.S. Securities and Exchange Commission, 2026-09-01 ↩
 LinkedIn
 WhatsApp
 Reddit
 Hacker News
 Email
Email Kindle
 RSS Feed
 Spotify
 Apple Podcasts
 Amazon Music
 Audible
 YouTube