MasterBrand, Inc.: The Cabinet Maker’s Billion-Dollar Bet on Scale
I. A Bigger Company, a Smaller Margin
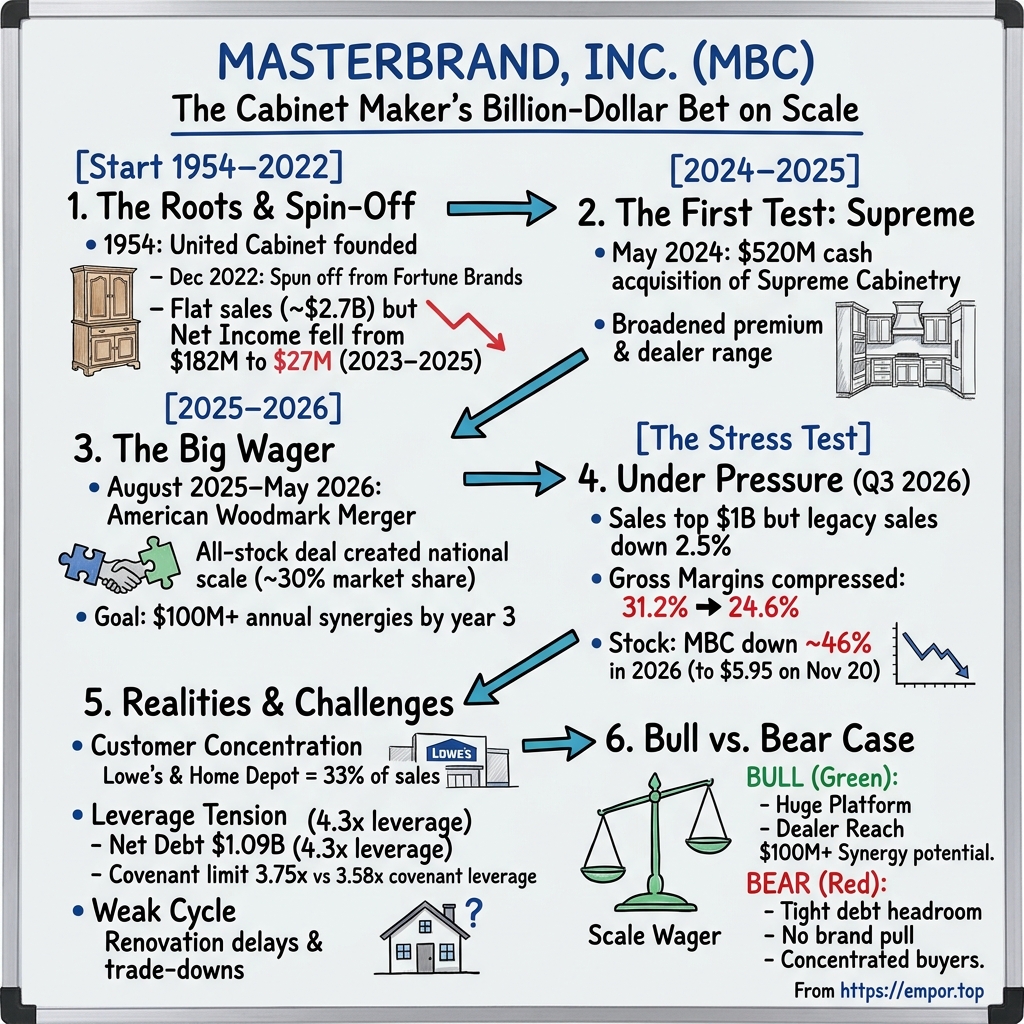
On May 28, 2026, two of the biggest names in American kitchen cabinets became one. MasterBrand, the cabinet maker spun out of Fortune Brands, closed its all-stock merger with American Woodmark, the Virginia-based supplier whose cabinets fill new subdivisions and home-center aisles across the country.1 The press release had the confident cadence such releases always have: a broader portfolio, a bigger footprint, a larger platform from which to serve dealers, retailers and builders. For a company that had spent its first three and a half years as a public company selling roughly the same dollar volume of cabinets every year, it was a dramatic change of size. The combined business would be the largest residential cabinet manufacturer on the continent by a wide margin.
Five months later, on November 5, the first full quarter of the combined company arrived, and it looked, at first glance, like a triumph of scale. Sales for the three months to late September came to about $1.04 billion, the first time the listed MasterBrand had crossed the billion-dollar line in a single quarter.2 Then the details started to arrive, and each one pulled in the opposite direction from the headline.
About $356 million of that quarter’s sales came from American Woodmark, which had not been part of the company a year earlier.2 Strip it out, and the business that MasterBrand had owned all along sold about $681 million of cabinets, down 2.5% from the same quarter of 2025.2 The company had grown by roughly half, and its original core had shrunk. Gross margin, the share of every sales dollar left after paying for wood, labor, plants and freight, fell to 24.6% from 31.2% a year earlier, a drop of 660 basis points.2 Put in plainer terms, a year earlier MasterBrand kept about 31 cents from each dollar of cabinets after making them; now it kept less than 25. That lower figure even included about $11 million of refunds on duties paid under emergency tariffs that the Supreme Court had struck down earlier in the year, a one-time benefit that flattered the quarter.2 And where the company had earned about $18 million in the third quarter of 2025, it lost about $9 million in the third quarter of 2026.2
Investors had already started voting with their feet before the quarter was reported, and they kept going afterward. On November 20, MBC shares closed at $5.95, roughly 46% below where they began the year and close to their 52-week low.3 A company that had just doubled its claim on the North American kitchen was being valued as if the claim might not be worth very much.
That is the apparent contradiction at the heart of this story. MasterBrand is bigger than it has ever been. It is also less profitable per dollar of sales than at any point in its short public life, and the business it brought into the merger is still contracting. The tempting reading is that the merger simply arrived at a bad moment, in the trough of a housing slowdown, and that the size will pay off once mortgage rates fall and homeowners start renovating again. The skeptical reading is that the merger enlarged a business whose earnings were already eroding, and that revenue growth from an acquisition is now covering for a core that has not found its footing.
Both readings can be tested, and that is the job of this episode. Four questions run through it. The first is whether growth is becoming organic, or whether acquisition scale is masking softness underneath. The second is whether a larger footprint can create a genuine advantage in a business where customers are price-sensitive and where a handful of powerful retailers and dealers decide which cabinets get ordered. The third is whether management can deliver the promised merger savings without weakening the plants, service levels and product investment on which the business depends. The fourth is whether cash generation can bring down debt that now sits uncomfortably close to the limit set by its lenders.
One boundary needs to be drawn before the story begins. The company with the ticker MBC is a young listed entity. It began trading in December 2022, when Fortune Brands handed its shares to Fortune’s own shareholders.4 The factories, brands and dealer relationships are much older, and their earlier results belong to the cabinets business as it was run inside Fortune Brands. Those results are useful as history and as a benchmark, but they are not the record of the independent company, which has had its own balance sheet, its own board and its own capital allocation decisions only since the spin. When this story compares the two eras, it does so deliberately, because the gap between them turns out to be one of the most revealing clues about what kind of business MasterBrand actually is.
So the first thing to understand is where this cabinet company came from, and what changed, and what did not, when it finally stood on its own.
 Subscribe on LinkedIn
II. The Business That Was Older Than Its Stock
Long before there was a stock ticker, there was a cabinet shop. The business that became MasterBrand traces its origins to United Cabinet, founded in 1954, and for decades its home was in Jasper, Indiana, a small town in the southwest of the state with a long tradition of woodworking.5 Over the following decades it grew into a collection of cabinet brands, among them Diamond, Aristokraft, Kemper and Omega, spread across price points and sold through home centers, independent kitchen dealers and homebuilders.6 By the time it was being prepared for independence, it described itself as the largest manufacturer of residential cabinets in North America by sales, founded nearly seventy years earlier.5
For most of the modern era, the business lived inside Fortune Brands, the consumer and home-products conglomerate that also owned faucets, doors and locks. Inside a conglomerate, a cabinet division is one line in a portfolio. It borrows the parent’s balance sheet, its treasury, its legal and finance departments, and its patience. The parent allocated those shared services to the cabinets business, charging it about $62 million in 2021, a little over 2% of sales.5 Those carve-out charges were estimates, not invoices from a standalone company, and they came with a warning that a separate business might cost more or less to run.5
The leadership that would take the company public arrived shortly before the pandemic. Dave Banyard became president of Fortune Brands’ cabinets business in December 2019.7 He was an operator by training and by temperament. After an economics degree at Princeton and an MBA from the University of Virginia’s Darden School, he spent his early career at Danaher, the industrial group famous for its relentless lean-manufacturing system, running a vehicle-systems business at its Kollmorgen unit.7 He then rose to group president of the fluid-handling businesses at Roper Technologies, another serial acquirer of industrial companies, before becoming chief executive of Myers Industries, a maker of plastic containers and tire-repair products, from 2015 to 2019.7 Danaher, Roper and Myers share a culture: buy businesses, squeeze out waste, measure everything, and let cash flow be the scorecard. Today the board is chaired by David Petratis, the former chief executive of the security-products company Allegion, another industrial operator rather than a financier.7 That background matters for this story because the playbook Banyard would later run at MasterBrand—plant consolidation, procurement savings, and growth by acquisition—is recognisably the one he learned at those companies.
His timing was extraordinary. Within months of his arrival, the pandemic sent Americans home and turned the kitchen into an office, a classroom and a restaurant. Housing turnover surged, remodeling budgets swelled, and cabinet makers could raise prices as material costs climbed. The cabinets business reported sales of about $2.39 billion in 2019 and $2.86 billion in 2021, roughly 9% compound annual growth over two years.5 Net income rose from about $146 million in 2020 to about $183 million in 2021.5 On paper, Banyard had taken over a growth business.
The record shows something more nuanced. That surge coincided with unusual demand and unusually strong pricing across the whole industry, and it would be a mistake to treat it as the company’s natural speed. A forecast built on 2019 to 2021 would have assumed that a cabinet business can grow near double digits. The years that followed tested that assumption and largely rejected it.
In December 2022, Fortune Brands completed the separation. Holders received one MasterBrand share for every Fortune Brands share they owned, about 128 million shares in total, and MBC began regular-way trading on the New York Stock Exchange on December 15.45 It is worth being precise about what this was. It was a spin-off, not an initial public offering. MasterBrand did not sell new shares to raise money for its plants or its growth; Fortune simply distributed ownership of an existing business to its own investors and walked away. Fortune Brands no longer owns any of the company.4 The business started its independent life carrying its own debt, which it later refinanced, rather than a cushion of fresh equity.6
Then came the independent record, and it is a sobering one. Sales were about $2.73 billion in 2023 and 2025, essentially flat for three years even though the 2024 and 2025 numbers included an acquired business.6 Net income fell from about $182 million in 2023 to about $27 million in 2025.6 Adjusted EBITDA, the measure management prefers, slid from about $364 million in 2024 to about $298 million in 2025.7 The company employed more than 15,000 people at the time of the spin and about 12,600 by the end of 2025, though the perimeters and dates are not perfectly comparable.56
Read together, those numbers tell a clear story. Independence gave MasterBrand focus, its own currency and its own board. It did not make the business less exposed to housing, and it did not restore the growth of the pandemic years. By 2025, the company was selling about the same dollar volume of cabinets as in its first year as a public company and keeping a small fraction of the profit.
And here is the problem that will follow MasterBrand through the rest of this story. Over those flat years, the company bought a premium cabinet maker, and then agreed to merge with its largest rival. Acquisitions can lift reported revenue even when the legacy business underneath is shrinking. In the first nine months of 2026, reported sales rose about 18% to roughly $2.47 billion, but about $481 million of that came from American Woodmark; excluding it, sales fell by about $101 million.8 The acquisitions changed the size of the company. Whether they changed its economics depends on understanding how a cabinet actually gets sold, and who really chooses it.
III. The Cabinet Is Chosen by the Channel
Picture a homeowner standing in a kitchen showroom with a binder of door samples. She runs a finger along a shaker-style door in painted white, compares it to a darker stained maple, asks about soft-close hinges and drawer organizers. It feels like her choice, and in one sense it is. But the set of options in front of her was decided long before she walked in. The dealer chose which manufacturers to carry. The home center chose which brands get aisle space and display kitchens. The homebuilder, if she is buying a new house, chose a cabinet line for the entire subdivision and offered her three finishes within it. The cabinet is chosen by the homeowner, but it is chosen from a menu written by the channel.
That simple fact shapes almost everything about MasterBrand’s economics.
Start with where demand comes from. About two-thirds of U.S. residential cabinet demand comes from repair and remodeling, and about one-third from new construction.5 Remodeling demand follows housing turnover and homeowners’ appetite for spending, which is why existing-home sales and home equity matter so much; people tend to redo kitchens when they buy a house or when they feel wealthy enough to stay in one. New-construction demand follows housing starts, and builders buy in volume and negotiate hard. Neither stream is contractual. Most of MasterBrand’s customer arrangements do not require minimum purchases: customers order particular products when they need them.6 There is no subscription here, no backlog of multi-year contracts, and the company does not disclose any recurring-revenue share. Volume simply rises and falls with the housing market and with how much inventory dealers and retailers decide to hold.
Then consider the product ladder. Cabinets come in roughly three tiers. Stock cabinets are made in standard sizes and finishes, often sold off the shelf or quickly through home centers, and they compete heavily on price. Semi-custom cabinets offer more sizes, finishes and options, typically sold through dealers and home centers’ kitchen design desks. Premium or custom-oriented lines offer the widest range of finishes, construction and design flexibility, and they are sold mostly through independent dealers and designers.6 MasterBrand plays across all three, which sounds like diversification. In practice it means the same manufacturing network must absorb shifts in mix. When a homeowner decides to trade down from semi-custom to stock, the company may keep the sale but lose much of the profit.
The economics of the factory turn that mix shift into a margin problem. A cabinet plant is a large fixed investment: buildings, finishing lines, dust collection, CNC routers, skilled labor, quality inspection and a fleet of trucks that deliver assembled boxes, which are bulky and expensive to ship relative to their value. When orders fall, those costs do not fall at the same pace. The shift still has to be staffed, the building heated, the trucks dispatched. Each cabinet absorbs a larger share of the fixed cost. That is why a cabinet maker can lose profit much faster than it loses revenue, and why the industry’s profit pool swings so violently through the housing cycle.
A stylized example makes the point. Imagine a plant that sells $100 of cabinets, spends $70 on materials, labor and freight that rise and fall with volume, and another $20 on costs that stay put whatever it produces, leaving $10 of profit. Now let volume fall by a tenth. Sales drop to $90 and variable costs to $63, but the $20 of fixed cost is still there, so profit shrinks to $7. A 10% fall in sales has produced a 30% fall in profit. Add a price increase that arrives a quarter after the cost increase, and a customer who trades down from a $100 cabinet to an $80 one, and it is easy to see how a business can watch most of its earnings disappear while its revenue line looks only mildly bruised. The numbers in that illustration are invented; the mechanism is exactly the one MasterBrand describes in its own results.
Now map the battlefield. Third-party estimates published in 2026 put MasterBrand at about 19% of the U.S. market, American Woodmark at about 11%, and Cabinetworks, a privately owned rival, at about 14%, with importers and a long tail of regional and local shops making up the rest.9 Those are external estimates, not company-reported figures, and they should be held loosely. But the shape is clear enough: three large domestic players, a fragmented remainder, and a meaningful import presence that has been squeezed by tariffs. In October 2025, new U.S. tariffs on imported kitchen cabinets and vanities took effect, aimed squarely at lower-cost imports and drawing sharp debate over who would ultimately pay.10
The buyers are the strongest force in this industry, and MasterBrand’s own disclosures make the case. Lowe’s generated about 20% of the company’s 2025 sales and Home Depot about 13%; together, the two home-improvement giants accounted for one dollar in every three.6 The top ten customers accounted for half of sales.6 That concentration had actually eased a little; at the time of the spin, Home Depot and Lowe’s together accounted for well over a third of sales, and the top ten had reached 55%.56 Home centers control shelf space, display kitchens, promotional calendars and the online listing. They can multi-source, and they can steer a homeowner toward a private label or a rival line with a change in a planogram. Builders, the other big buyers, are price-driven and consolidated. Independent dealers are fragmented, but they choose which brands to show, and they are the gatekeepers for the higher-margin premium business. MasterBrand had relationships with more than 4,000 dealers in the United States and Canada at the time of the spin, a network that is genuinely hard for a newcomer to replicate.5
Rivalry is real but not ruinous. Cabinetworks, regional manufacturers and imports all compete, and the fact that no one competitor dominates means that price competition is constant, especially in stock cabinets. The threat of substitution is low in the direct sense: there is no app that replaces a kitchen cabinet, and digital tools mostly help the incumbents design, quote and order more efficiently. But consumers have a powerful indirect substitute, which is simply to wait. A renovation can be postponed for years. A homeowner who does go ahead can trade down to a cheaper tier, or choose a simpler refacing job. Suppliers, meanwhile, are not a dominant force in disclosures; the company says it depends on a limited number of suppliers for some materials but does not quantify that concentration.6 And new entrants face a moderate barrier: building a national manufacturing and logistics network is expensive, but a regional shop or an importer can enter a local market without one, which is why Fitch described barriers to entry in the industry as low.[^11]
So what makes MasterBrand hard to replace? The plausible answers are scale, distribution breadth, and the range of products that lets a home center or a dealer buy many price points from one supplier. Those are real advantages. A retailer that sources stock and semi-custom cabinets from a single national supplier gets consistent fill rates, simpler logistics and one account team. A dealer that carries several MasterBrand lines can serve different budgets without adding vendors.
The evidence for something stronger, a moat that lets the company raise prices without losing customers, is thin. The company does not disclose customer retention rates, contract tenure, or price realization relative to competitors, and its own explanations of recent margin pressure keep returning to pricing that lagged inflation and customers who traded down. Brand pull, the willingness of homeowners to insist on a specific cabinet brand by name, is rarely visible in this category, and nothing in the company’s disclosures demonstrates it. The verdict here is that MasterBrand’s advantages are advantages of reach and cost, not of pricing power, and that powerful, concentrated buyers are well placed to bargain away much of whatever reach creates.
One more structural detail matters for following the story. MasterBrand reports a single operating segment.6 There are no separate profit lines for stock, premium, retail or dealer businesses. In 2026, the useful dividing line is the one the company itself draws in its results: legacy MasterBrand on one side, and the acquired American Woodmark sales on the other.2 That split is the closest thing an outsider has to an organic growth measure, and it is the line where the cycle has been doing its damage.
IV. The Cycle Shows Up in the Factory
Walk into a cabinet plant in a slow quarter and the problem is visible before anyone opens a spreadsheet. Lines run shorter shifts. Finished boxes wait longer on the dock. The building, machines, supervisors and maintenance crews are still there, even as fewer cabinets move through the plant. Accountants call the resulting fixed-cost shortfall under-absorption. Everyone else calls it a bad quarter.
That is the mechanism behind one of the most striking patterns in MasterBrand’s record. Between 2023 and 2025, sales stayed close to $2.7 billion each year, yet net income fell by about 85%, from about $182 million to about $27 million.6 Sales were flat in dollars, but flat dollars can hide weaker volumes offset by price, an acquisition, or both. In 2025, gross margin fell by about 220 basis points.6 A company whose revenue barely moved lost most of its earnings, because the costs that sit between revenue and profit rose while the units flowing through the plants did not.
By the third quarter of 2026, management’s explanation of the margin collapse had a familiar list of ingredients. Volumes were lower. Plants were under-absorbed. Inflation in materials, freight and fuel outpaced the price increases the company could push through. And homeowners kept trading down to cheaper products.1112 Each of those is a cyclical force, and each of them is also, in part, a statement about the company’s bargaining position. A business with strong pricing power raises prices ahead of inflation, not behind it. A business with strong brand pull sees fewer trade-downs. The list tells you that MasterBrand is fighting the cycle with the tools of a cost competitor.
There was also a mix effect from the merger itself. American Woodmark arrived with a business weighted toward builders and home centers and, as its own results deteriorated, a weaker margin profile; consolidating it mechanically pulls down the combined company’s margin percentages even before any operational change.213 That makes the 660-basis-point gross margin decline harder to read. Some of it is the cycle hitting legacy MasterBrand; some of it is the arithmetic of adding a lower-margin business. The company’s reported adjusted EBITDA margin told the same story, falling to about 8.3% from 13.0% a year earlier.2
Then there were tariffs. New duties on imported cabinets, vanities and components, along with tariffs on materials, landed on an industry that sources hardware and some components from overseas. Management estimated gross tariff costs at about 5% to 6% of full-year 2026 sales and said it expected to offset them dollar for dollar on a run-rate basis by year-end, through pricing, sourcing changes and cost actions.2 That expectation is a test of pricing power in miniature. If MasterBrand can pass through a cost of that size in a weak market without losing more volume, the bull case gains real evidence. If the offset slips, the margin story gets worse just as the merger savings are supposed to be arriving.
Management’s strongest counter-argument is relative performance. Legacy MasterBrand sales fell 2.5% in the third quarter, while the company estimated that its addressable market was declining by mid- to high-single digits.211 Losing less than the market means gaining share, and management leaned on that comparison. It is a fair point, and worth taking seriously. A company that is outgrowing a shrinking market is doing something right with its dealers, retailers or builders.
But outperformance against a shrinking market is not the same as growth, and it is not the same as profitability. A business can win share and still lose money if the share is bought with price concessions, promotional support or richer service that the customer will not pay for. The test is whether the share gains show up in margins, and so far they have not. Legacy sales are falling, consolidated margins are down, and the company lost money in the quarter. The filings support both explanations at once: there is a genuine cyclical downturn, and there is a company-specific margin problem that the downturn has exposed rather than created.
The pandemic years provide the cleanest way to test any claim that history proves durable demand. If a reader wanted to argue that MasterBrand’s 9% growth from 2019 to 2021 showed a structurally growing business, the following three years are the falsification. When the unusual demand and pricing of that period faded, sales went flat and earnings fell steeply. The fair reading is that the pandemic boom was a cycle, not a trend, and that the current trough is also a cycle. Neither tells an investor what normal looks like, but together they show the amplitude of the swings, and that amplitude is what the balance sheet has to survive.
This puts management in front of a classic industrial dilemma. One option is to cut capacity now, close plants, lower fixed costs and protect cash, which helps immediately but may leave the company short of capacity and skilled workers when housing turns. The other is to preserve the footprint, accept weak margins through the trough and be ready to capture volume in a recovery, which keeps the upside but drains cash and stretches the balance sheet. Real companies split the difference, and MasterBrand is no exception. Its first big test of that judgment, though, came not from the cycle but from an acquisition, made in 2024 when the downturn was already under way.
V. Supreme: The First Test of the Acquisition Playbook
In May 2024, MasterBrand made its first big move as an independent company. On May 21, it announced an agreement to buy Supreme Cabinetry Brands, a premium-focused cabinet maker with plants in Minnesota, Iowa and North Carolina and a following among independent kitchen dealers.14 The deal was for cash, and the headline price was about $520 million.14
The strategic logic was easy to explain. MasterBrand’s portfolio was strongest in stock and semi-custom cabinets sold through home centers and dealers; Supreme was weighted toward the premium end, where designers and dealers sell to homeowners willing to spend more for finishes, construction quality and flexibility. Premium cabinets tend to carry better margins and to be less exposed to the most price-driven parts of the market. Supreme’s dealer relationships would broaden MasterBrand’s reach in the very channel where brand and service matter most, and its plants would add capacity and capabilities in higher-end products. In operational terms, the deal promised three things: a broader premium range, more dealer doors, and a footprint that complemented rather than duplicated MasterBrand’s own.
The price is where the investor lens comes in. MasterBrand told investors that $520 million represented about 8.9 times Supreme’s adjusted EBITDA before any expected savings, and about 5.9 times once roughly $28 million of planned annual run-rate synergies were included.14 Those two multiples tell different stories. At 8.9 times, MasterBrand was paying a full price for a cyclical manufacturer, more than the combined multiple it later presented for American Woodmark. At 5.9 times, the deal looked much cheaper, but only if the synergies arrived in full. The gap between the two numbers, about $28 million a year of savings, was essentially a promise that management would earn back a third of the price through procurement, manufacturing and overhead efficiencies.
To pay for it, MasterBrand went to the bond market. In June 2024 it refinanced its original debt with $700 million of 7% senior notes and a revolving credit facility, and then completed the Supreme acquisition in July for a cash outflow of about $515 million.6 A 7% coupon on $700 million is roughly $49 million of interest a year, a substantial fixed charge for a company whose net income would fall to $27 million in the following year. The acquisition was paid for with borrowed money at a time when the cabinet market was already softening.
The early results were modest, as early results usually are. In the first 11 weeks after the acquisition closed, Supreme contributed about $61 million of sales and about $4 million of net income.15 That contribution is a sliver of a year, distorted by acquisition accounting and integration costs, and it is not a measure of return on the $520 million invested. It tells an investor that Supreme was a real business with real sales and that it was profitable in its first weeks. It does not say whether the deal earned its cost of capital.
That question has not been answered publicly. Once Supreme’s first year passed, its sales became part of the legacy MasterBrand base, which reports as one segment, and the company does not publish a separate scorecard of Supreme’s sales, margins or realized synergies against the original plan. What can be observed is the combined result: in the year after Supreme joined, legacy MasterBrand’s total sales were roughly flat and its net income fell sharply.6 Some of that decline is the cycle, and some is the interest and amortization the deal itself created. The deal neither obviously failed nor visibly succeeded. It disappeared into the totals.
Was it a good price? Benchmarked against MasterBrand’s own later deal, Supreme’s pre-synergy multiple was higher than the combined multiple the company would present for American Woodmark even after including synergies. Against the wider market for cabinet acquisitions, there is no clean, contemporaneous set of peer transactions that would establish whether 8.9 times was cheap or rich. The fair verdict is that Supreme fit the strategy and the price was not obviously excessive once the planned savings were counted, but a synergy-adjusted multiple is a valuation that depends on a promise. Until the savings show up in cash flow, it remains a forecast.
The deeper question is what Supreme demonstrated about the playbook. The optimistic interpretation is that MasterBrand used a mid-sized, complementary acquisition to build an integration capability, learning how to bring a new business into its procurement, manufacturing and dealer systems before attempting something much bigger. The skeptical interpretation is that Supreme added debt, complexity and a full purchase price in a softening market, and that its success had not yet been demonstrated when management committed to a transaction several times its size. Both interpretations fit the evidence; neither is settled by it. What is certain is that barely a year after Supreme closed, MasterBrand announced the deal that would redefine the company.
VI. The American Woodmark Deal Changed the Denominator
On August 6, 2025, MasterBrand and American Woodmark announced that they would combine. The terms were simple and all in stock: each American Woodmark share would be exchanged for 5.15 MasterBrand shares.16 No cash would change hands for the equity. MasterBrand would issue new shares, American Woodmark’s owners would become MasterBrand owners, and the two companies’ balance sheets and debt would be combined.
The industrial logic was the logic of scale, stretched across every dimension of the business. American Woodmark brought a large presence in home centers and with national and regional homebuilders, its own brands and price points, and a manufacturing and assembly network in the United States and Mexico.16 MasterBrand brought its dealer network, its premium business via Supreme and its own home-center relationships. Together they would offer more brands and price points, reach more dealers and builders, and run a much larger manufacturing footprint that could, in theory, be rationalized: fewer, fuller plants, combined purchasing of lumber, board, hardware and finishes, a single set of corporate functions and shared logistics. Using the pre-merger third-party estimates, the combined company would hold roughly 30% of the U.S. cabinet market, about twice the size of its nearest rival.9
At announcement, the companies presented the combination as having roughly $2.4 billion in combined equity value and $3.6 billion in enterprise value, with about $639 million of trailing adjusted EBITDA including $90 million of planned annual synergies by the end of year three.16 On that synergy-inclusive basis, the combined business was valued at about 5.6 times earnings before interest, taxes, depreciation and amortization. Former MasterBrand shareholders would own about 63% of the combined company and American Woodmark holders about 37%.161 When the deal closed in May 2026, MasterBrand issued about 77 million new shares.1 Three American Woodmark designees joined the board.7
The financing logic deserves its own moment, because it is where the deal was cleverest and where it was most expensive. By paying in stock, MasterBrand avoided borrowing a purchase price it could not have afforded. A cash deal on this scale would have pushed its leverage to levels that lenders and rating agencies would almost certainly have rejected. The cost of avoiding debt was ownership. MasterBrand’s existing shareholders gave up roughly 37% of their company in exchange for a share of American Woodmark’s plants, customers and future savings. Paying in shares is not free; it is paying with a slice of all future cash flows rather than with a fixed sum today. And the exchange ratio was fixed. When MasterBrand’s own shares fell, the deal looked cheaper in dollars, but the proportion of the company handed over did not change.
Compare the deal with the company’s own precedent. Supreme cost $520 million in cash at 8.9 times its pre-synergy earnings. American Woodmark implied about 5.6 times combined earnings, but only after adding $90 million of savings that did not yet exist. On the surface, the merger looked like a better price. Underneath, the comparison was not apples to apples: one multiple described a single acquisition before savings, the other described an entire combined company after them. No clean peer set of contemporaneous cabinet transactions establishes that either price was cheap.
The more important issue is the quality of the earnings in that denominator. American Woodmark’s trailing adjusted EBITDA, as the combined company later presented it, included the add-back of a roughly $213 million goodwill impairment.11 An impairment is an accounting admission that a business is worth less than the value carried on the books, usually because its expected future earnings have fallen. Adding it back to EBITDA is standard practice, because the impairment is a noncash charge, and it does not by itself inflate the operating earnings figure. But the impairment itself is evidence that American Woodmark’s outlook had deteriorated. The company MasterBrand was buying was in the middle of a downturn of its own, and its contribution to the combined company in 2026 was weak.2 On the Q2 call, analysts asked about American Woodmark’s struggles, including trade-down pressure in its builder business, and Banyard said he was confident the combined company could earn back the share American Woodmark had ceded in that channel before the merger.13 That is a revealing admission. MasterBrand had bought a market-share leader that was losing share.
Market share, then, is a starting position, not a proof of anything. Holding roughly 30% of a market gives a company more volume to spread across plants, more purchasing leverage with suppliers, and more relevance to the largest customers. It does not, on its own, give pricing power, especially when the largest customers are themselves consolidated giants that can switch suppliers on some product lines and that might view a single dominant supplier as a risk to manage. Lowe’s and Home Depot did not become weaker negotiators because their two cabinet suppliers merged.
Then there is the cost of the savings. In August 2026, management raised its synergy target, saying it now expected more than $100 million of annual run-rate cost synergies by the end of year three, above the original goal.13 That is encouraging. But the company also estimated in its third-quarter materials that one-time cash costs to achieve those synergies would run at roughly one dollar for every dollar of run-rate savings.11 In other words, to earn $100 million a year of savings, the company expects to spend something like $100 million up front, on severance, plant closures, equipment moves and systems integration. Synergies are a return on that investment, not a gift. In a year of breakeven free cash flow, that spending competes directly with debt reduction.
The verdict on the deal at this stage is cautious. The announced multiple does not look extreme, and the industrial logic is coherent. But the comparison depends on adjusted earnings and promised savings, the acquired business was deteriorating, and the combined company’s margins in its first full quarter were weak. Execution and the true earnings base now matter far more than the headline multiple. Which raises the obvious next question: what has management actually done since the deal closed?
VII. The Integration Plan Meets a Weak Market
Integration plans are written on whiteboards in the months before a deal closes. They are executed on factory floors, in procurement meetings and in IT migrations, usually while the business is still trying to serve its customers. MasterBrand’s plan met reality in a market that kept getting worse.
The company moved quickly where it could. By the Q2 call in early August, barely two months after the merger closed, Banyard said the company had initiated two plant closures since the merger and would apply the same network optimization it had used before in its legacy footprint.13 Management also said it had executed about $30 million of annualized cost-savings actions by the end of July, and expected roughly $15 million of savings to be realized in the second half of 2026.13 Separately, American Woodmark had already been closing a plant in Monterrey, Mexico.13 And management raised the synergy target to more than $100 million by year three.13
By November, the company said it had realized about $11 million of merger synergies through the end of September, that second-half savings would exceed the roughly $15 million it had previously communicated, and that it had initiated or completed actions expected to drive more than $50 million of run-rate synergies exiting the first year after close.2 Banyard described the quarter as showing real momentum on integration, with synergies ahead of schedule, and said management was confident in steps designed to improve profitability independent of a market recovery.2
Those are concrete achievements, and they deserve credit. Closing plants, cutting overhead, combining purchasing and starting systems integration within months is not trivial, especially in a company whose finance chief was about to leave. The levers are the ones Banyard learned at Danaher and Roper: headcount and overhead reductions, procurement savings from combined buying of board, lumber and hardware, consolidation of underused plants, systems integration that removes duplicated back-office work, and cross-selling, where MasterBrand dealer products move into American Woodmark’s builder and retail relationships and vice versa.
The scale of the achievement, though, needs to be held against the scale of the problem. Eleven million dollars of realized synergies in a quarter in which gross margin fell by 660 basis points on more than a billion dollars of sales is a small offset. The more-than-$100 million target is a year-three number. And synergies are being captured in a market that is shrinking, which means some of the savings may simply be keeping margins from falling further rather than lifting them.
The market outlook itself has been moving the wrong way. On the Q2 call, Banyard said the company’s view that its 2026 addressable market would be down mid-single digits was directionally unchanged, and that the outlook assumed no improvement in demand conditions for the rest of the year.13 By the Q3 release, the company expected its market to decline by high-single digits, and the new outlook formally superseded the second-half guidance given in August.2 That is a meaningful shift, and it shows up in the numbers. In August, management had guided second-half adjusted EBITDA to about $129 million to $149 million.13 Third-quarter adjusted EBITDA came in at about $86 million, and fourth-quarter guidance called for about $38 million to $48 million.2 Added together, the implied second half lands at about $124 million to $134 million, below or at the very bottom of the range management gave three months earlier. Fourth-quarter guidance implied an adjusted EBITDA margin of just 4.0% to 4.9% on sales of about $958 million to $988 million, and an adjusted loss per share.2
To management’s credit, the change in outlook was explained rather than hidden: the company attributed it to a weaker market, not to a failure of integration, and the savings target was raised rather than lowered. But it is a pattern worth noting. The Q2 call promised a stable view of the market; within a quarter, that view had worsened. On the November 5 call, analysts pressed management on whether legacy MasterBrand was really gaining share, how dealer expansion was progressing, and where exactly the cost savings were coming from.12 Those questions go to the core of the bull case. If the savings are coming mainly from closing plants in response to lower demand, then the company is shrinking its cost base in line with the market, which protects margins but does not create a structural advantage. If they are coming from combined purchasing, better plant loading and the elimination of duplicated overhead, then integration is genuinely lowering the company’s cost position relative to rivals. The honest answer is that it is some of both, and outsiders cannot yet measure the split.
One small number captures the tension between protecting cash and protecting competitiveness. Management deferred about $15 million of planned capital spending in 2026.11 First-three-quarter capex came to about $37 million, well below the roughly $78 million to $81 million annual pace of 2024 and 2025.86 Deferring capex is sensible in a downturn, and $15 million is not enormous. But cabinet makers compete on finishes, product breadth, lead times and quality, and all of those depend on equipment and plant investment. Capital spending that is deferred is not cancelled. It comes back, usually when cash is needed for other things. A company that underinvests through a downturn risks entering the recovery with older equipment and narrower capabilities than its rivals.
So the next test is not whether synergies are announced, but whether they appear in cash and in sustainable margins after the one-time costs of achieving them. And that test is being run on a balance sheet that has much less room for error than it did a year ago.
VIII. The Balance Sheet Has Less Room for Error
Every loan agreement contains a tripwire. In MasterBrand’s case, its lenders require that net debt stay below 3.75 times its covenant measure of earnings, and that earnings cover interest at least three times over.8 At the end of September 2026, the company passed both tests. Its covenant leverage was 3.58 times, and interest coverage was 3.9 times.118 It was compliant. It was also standing very close to the line.
The gap between those numbers deserves a plain-English translation. If covenant earnings fell by roughly 5% with debt unchanged, leverage would hit the ceiling. The covenant itself had been amended ahead of the merger to give the company more room during a period of acquisition relief.8 Lenders can be accommodating when a borrower is executing a credible plan, but every amendment has a price, whether in fees, margins or restrictions, and every amendment shifts negotiating power toward the lender.
On a simpler basis, the company’s net debt was about $1.09 billion against trailing adjusted EBITDA of about $254 million, or about 4.3 times.2 At the end of 2025, before the merger, net leverage had been about 2.7 times.7 The jump reflects American Woodmark’s debt and the collapse in combined trailing earnings. The 4.3-times figure also includes American Woodmark’s goodwill-impairment add-back, a point that complicates comparison with GAAP results.11
The debt stack itself is straightforward. At the end of September, borrowings totaled about $1.23 billion: the $700 million of 7% senior notes due 2032, a $375 million term loan, and about $155 million drawn on a $750 million revolving credit facility that matures in June 2029.8 Cash was about $140 million, and with revolver availability, liquidity was about $694 million.811 Operating leases add another layer of fixed obligations but are not borrowings.8 Fourth-quarter interest expense was expected to be about $24 million, which means interest is running near $100 million a year.2 There is no near-term maturity wall, and liquidity is adequate. This is not a crisis. It is a narrowing of options.
Set that interest bill against earnings and the narrowing becomes vivid. Roughly $100 million a year of interest against roughly $254 million of trailing adjusted EBITDA means that about 40 cents of every dollar of operating earnings, before a single dollar of capital spending, taxes or integration cost, goes to lenders. In the year of the spin, when the business earned far more and carried far less debt, that share was dramatically smaller. Every dollar of synergy that management delivers now has a competing claim on it: debt reduction, deferred capital spending, and eventually shareholders, roughly in that order.
Cash flow has historically been better than reported profit, and that has been one of MasterBrand’s genuine strengths. Over 2023 to 2025, net income totaled about $335 million while operating cash flow totaled about $893 million.6 The gap is real, but it needs to be understood. Depreciation, amortization of acquired intangibles and stock compensation are noncash charges that reduce net income without reducing cash, and in a capital-intensive business with acquisitions, those charges are large. Working capital also helped; in 2025, falling receivables and inventory and rising payables all released cash.6 That pattern continued in 2026. In the first nine months, the company recorded a net loss of about $82 million but still generated about $80 million of operating cash flow, helped by about $103 million of depreciation and amortization and a large increase in payables.8 Free cash flow for the nine months was about $44 million, down from about $65 million a year earlier.2 Working capital can be squeezed once; it cannot be squeezed forever. When payables have been stretched and receivables collected, the next dollar of cash has to come from earnings.
And full-year 2026 free cash flow was expected to be only approximately breakeven.2 In August, management had set a goal of reducing net leverage below 2 times by the end of 2028.13 Getting from 4.3 times to below 2 times in a little over two years requires a combination of debt reduction and earnings recovery that a breakeven cash year does not deliver. The 2027 free cash flow, after necessary capital spending, restructuring and integration costs, becomes the key test.
There is also a warning in the receivables. In 2025, MasterBrand recorded a provision of about $17 million against amounts owed by a single customer, based on that customer’s financial outlook and liquidity, which lifted the allowance for doubtful accounts from about $3 million to about $17 million.6 The company did not name the customer and did not say it had entered bankruptcy.6 In the first nine months of 2026, it recorded only about $1 million of additional bad-debt provision.8 That suggests the problem was specific rather than spreading, but it is a reminder that cabinet makers extend credit to dealers, builders and distributors whose own finances deteriorate in a housing slowdown. Combine that with the concentration of sales at Lowe’s, Home Depot and the top ten customers, and the company’s credit exposure is less diversified than its thousands of dealer relationships might suggest.
The rating agencies have noticed. In July 2026, Fitch affirmed MasterBrand’s BB+ rating but changed the outlook to negative.[^11] Fitch credited the leading scale created by the merger but flagged cyclical demand, temporarily elevated leverage, a narrow product focus, customer concentration and low barriers to entry, and it expected leverage to remain above its downgrade thresholds through at least the end of 2027.[^11] That is an important external view, because it comes from an analyst whose job is to judge whether a company can repay its debt, not whether its stock will rise. It also replaced a much rosier picture: as late as May 2025, the company’s investor presentation still showed stable ratings from all three agencies, dated to mid-2024.17
The main operating risks remain housing softness, tariffs and inflation, customer concentration, and thin covenant headroom. Other exposures, by contrast, are modest. The company hedges its Canadian-dollar and Mexican-peso exposure with forward contracts, about $76 million in notional value at the end of 2025, and says potential losses on them would not be material.6 Litigation is routine, the auditor gave clean opinions on the financial statements and internal controls for 2025, and there are no material environmental accruals.6 About $2.8 million of potential tariff refunds had not been recognized at the end of the third quarter because their realization was uncertain.8 None of these moves the investment case. Demand, margins and debt do.
So the balance sheet is not in crisis, but it has less room for error just as the company needs room to integrate and invest. That brings the story to the question investors are actually trying to answer with a share price of $5.95.
IX. Analysis & Bear vs. Bull Case
On November 20, MBC closed at $5.95, near the bottom of its 52-week range.3 At that price, the company’s market capitalization was about $1.2 billion. Add net debt of about $1.09 billion, and the enterprise value comes to roughly $2.3 billion, or about nine times trailing adjusted EBITDA of $254 million.32 That multiple sounds unremarkable for an industrial manufacturer, until one remembers that the earnings in the denominator include the American Woodmark impairment add-back and come from a trough year, and that the company’s trailing GAAP results were loss-making.118 A price-to-earnings ratio is meaningless when earnings are negative, and the adjusted EBITDA multiple is highly sensitive to what is added back and to where the cycle is. The market is not telling investors that MasterBrand is cheap or expensive. It is telling them that it does not trust the denominator.
A simple piece of arithmetic shows how far that distrust runs. When the merger was announced, the companies presented about $639 million of combined adjusted EBITDA, including the planned savings.16 Had the market believed that figure was a fair picture of normal earnings, today’s enterprise value of about $2.3 billion would amount to less than four times it. The gap between roughly $254 million of trailing earnings and roughly $639 million of announced earnings is, in effect, the market’s estimate of how much of the merger thesis remains unproven. Investors are paying for something close to the trough, and very little for the recovery or the full synergies. That can be read as an opportunity or as a warning, depending on whether one thinks the trough is temporary.
So what would have to be true for the bull case to work, and what would break it?
The bull case starts with the platform. No other cabinet company in North America has MasterBrand’s combination of national reach, price-tier breadth, dealer access and retail relationships. It can sell a homeowner a stock cabinet off the shelf at a home center, a semi-custom kitchen through a dealer, or a premium kitchen through a designer, and it can supply a national builder from multiple plants. With roughly 30% of the U.S. market on pre-merger estimates, its purchasing scale for lumber, board, hardware and finishes is unmatched.9 Its larger footprint offers room to consolidate plants, load the remaining ones more fully and lower fixed cost per cabinet, which is the most powerful margin lever in this industry. Legacy MasterBrand has been shrinking less than the market, which suggests it is gaining share.2 And management has a real track record of operational execution, with savings arriving ahead of schedule and a raised synergy target.213 If housing recovers, all of those cost reductions would meet rising volume, and earnings could rebound sharply.
The bear case starts with the same facts read differently. MasterBrand is a cyclical business whose earnings fell by about 85% over three flat-sales years before the merger. Its legacy sales are still declining. Its observed pricing power is weak, as shown by repeated explanations of price lagging inflation and customers trading down. A third of its sales go to two retailers that can push back on price. Its trailing adjusted earnings include a large impairment add-back, its covenant headroom is narrow, its free cash flow for 2026 is expected to be about breakeven, and Fitch has a negative outlook on its rating. The merger made it bigger, but it also made it more levered and more exposed to the same housing cycle, with a newly acquired business that was losing share and margin before the deal closed.
The way to adjudicate is to ask which competitive advantages are real, using a framework like Hamilton Helmer’s seven powers. Scale economies are the most credible: a larger manufacturing and procurement base should lower unit costs, and the merger is explicitly designed to deliver that. But scale economies only become a moat if rivals cannot match the cost position, and Cabinetworks, regional players and imports have survived alongside MasterBrand for years. Switching costs are weak. Customers are not bound by minimum purchases, and large retailers routinely multi-source. Branding, in the sense of homeowners paying more for a name, has little visible evidence in this category. There is no network effect, no cornered resource such as a unique raw material or patent, and no counter-positioning that rivals cannot copy. Process power, a hard-to-replicate operational system, is possible, since Banyard’s lean-manufacturing playbook could become a durable cost advantage, but it has not yet been demonstrated in sustained margins. On the evidence, MasterBrand has one plausible power, scale, and that power is still being tested.
Porter’s five forces tell the same story from the industry’s side. Buyer power is high, concentrated in home centers, builders and dealer gatekeepers. Rivalry is meaningful, with private competitors and imports fighting for share. The threat of substitution is low in the direct sense but high in the indirect sense, because consumers can postpone renovation or trade down. Supplier power is moderate and not quantified. Entry barriers are low to moderate, as Fitch noted.[^11] That is not the profile of an industry with high structural returns; it is the profile of one where the scale leader can earn decent returns if it runs its plants well and the cycle cooperates.
Then there is management, which is where an activist or skeptical investor would push hardest. Banyard’s total compensation was about $7.1 million in 2023, $6.5 million in 2024 and $7.4 million in 2025, while net income fell by about 85%.7 He reported ownership of about 1.6% of the company before the merger dilution, which gives him meaningful exposure to the share price.7 The annual cash incentive gave equal weight to adjusted earnings per share and free cash flow as a percentage of sales. In 2025, earnings came in below the threshold, but free cash flow exceeded the plan maximum, so the award still paid out at 100% of target with no discretionary adjustment.7 Long-term performance shares for 2023 to 2025, based on cumulative EBITDA and adjusted return on invested capital, paid out at 170% of target.7 Those results are not evidence of wrongdoing. They are evidence that the incentive system rewarded cash discipline and multi-year operating metrics during a period when shareholders lost money and earnings collapsed. An activist would ask whether the plan measures what shareholders actually need: per-share earnings growth, returns on the acquisitions, and debt reduction. Shareholders do not seem troubled; the say-on-pay vote in June 2026 passed with about 98% support.18
The ownership register adds context for that pressure. Before the merger issuance, BlackRock held about 15%, Coliseum Capital about 9%, Gates Capital about 8%, Vanguard about 8%, Boston Partners about 6% and Dimensional about 5%.7 Coliseum and Gates are concentrated, fundamentally driven investors, the kind that can press a board when a strategy disappoints. Those stakes predate the 77 million merger shares, and no post-merger stake should be inferred from them.
The CFO transition adds a credibility and execution question rather than an accounting one. Andrea Simon left the CFO role in October 2026; Mark Young became interim CFO, Simon will advise the company through March 2027, and a permanent search is under way.19 The company said the transition was unrelated to the integrity of its financial statements or accounting practices.19 There is no reason to doubt that statement. But a CFO departure five months into the largest integration in the company’s history, with covenant headroom narrow and guidance just cut, removes an experienced hand at the moment the finance function matters most.
The thesis can be kept testable with three numbers. The first is organic sales versus the market: legacy MasterBrand and American Woodmark sales, measured separately, against the cabinet market. The latest reading is a 2.5% decline in legacy sales against a high-single-digit market decline.2 The second is margin after integration: gross margin and adjusted EBITDA margin, net of the one-time costs of achieving synergies. The latest gross margin was 24.6%, down 660 basis points, with fourth-quarter adjusted EBITDA margin guided to 4.0% to 4.9%.2 The third is free cash flow alongside net leverage and covenant headroom, with net leverage at 4.3 times, covenant leverage at 3.58 times against 3.75 times, and 2026 free cash flow guided near breakeven.211
The verdict at today’s price is that the bull case rests on a real platform and real operational execution, and the bear case rests on real cyclicality, weak pricing power and a thin balance-sheet cushion. The market appears to be discounting a meaningful chance that the trough lasts longer than the balance sheet would like. The investment case turns on cash and margins, not headline sales growth, and the next few quarters will reveal which of those narratives the numbers support.
X. Playbook: Business & Investing Lessons
MasterBrand’s rapid transformation did little to change its legacy sales. That contrast holds the lessons.
The first lesson comes from the spin. Independence gave MasterBrand a clearer story, but the pandemic boom and the years that followed showed it remained a cyclical manufacturer. A listing can create focus, but it cannot make a cyclical business less cyclical.
The second lesson comes from Supreme. The deal may yet prove sensible, but its value depended on promised savings that the company has not reported separately.
The third lesson comes from American Woodmark. The merger gave MasterBrand a much larger share of the U.S. market, but scale did not make the acquired business stronger or its largest customers easier to negotiate with. Bigger market share is a starting position, not proof of a moat.
The fourth lesson comes from the factory floor. MasterBrand closed plants, cut overhead and deferred capital spending to protect cash. But capacity and equipment cuts can weaken the company’s ability to benefit when housing recovers.
The fifth lesson is about management credibility, and it is the one that will be graded in public over the next two years. The company has set targets for synergies, leverage and tariff costs, and changed its market view within a quarter, explaining why. Credibility now depends on delivering against those targets, explaining guidance changes transparently, and showing that savings exceed the costs of achieving them. Management will be judged not by the size of the company it built, but by the cash that company produces.
XI. Epilogue
Tonight, MasterBrand is approaching its first full year as a combined company. Factories are being consolidated, an interim CFO is running the finance function while the search for a permanent one continues, and management expects synergies to build through 2027 toward a target of more than $100 million a year by the end of year three.219 The housing market remains weak, and the company’s own outlook assumes no improvement in demand through the end of 2026.2
The next moments that will decide the story are already on the calendar. The full-year 2026 results, due early in 2027, will show whether the fourth quarter landed within its narrow guidance and whether free cash flow was truly breakeven. The first quarters of 2027 will be the first in which the year-ago comparison already includes American Woodmark, and that will strip away the flattering effect of acquired growth. From that point, reported sales growth and organic growth will start to converge, and investors will finally see whether the combined company is growing, holding, or shrinking.
Watch whether legacy MasterBrand and American Woodmark sales stabilize separately, instead of relying on combined growth. Track realized synergies, the one-time cash costs of achieving them, and whether gross margin improves without a housing recovery. Follow free cash flow after capital spending, restructuring and integration costs, and test whether covenant headroom widens from its current narrow gap. Revisit the receivable reserve and customer concentration for signs that the single-customer problem of 2025 is spreading to others.
Each outcome has a clear meaning. If organic sales stabilize, margins rise as savings arrive, and leverage falls in 2027, the merger will look like a well-timed consolidation that bought a cyclical bottom with stock and emerged with a lower-cost position in its industry. If sales keep shrinking, margins stay depressed, and integration costs absorb the savings, the merger will look like a decision that doubled the company’s exposure to a housing downturn while narrowing its financial options. The truth may sit in between: a stronger cost position that only shows its value when the cycle turns.
The central question remains whether MasterBrand can turn operating scale into bargaining power and cash, or whether it has mostly bought more exposure to the same housing cycle.
XII. Outro
Go back to the homeowner in the showroom, running her finger along a painted shaker door. The cabinets she chooses will hang in her kitchen for twenty years, opened and closed thousands of times, part of the most used room in the house. She may never know the name of the company that made them. What she sees is the dealer’s catalog, the retailer’s display kitchen, the builder’s finish options.
That is MasterBrand’s wager in a single image. It has built the biggest cabinet platform in North America. Its next task is to make that platform matter in the places where the decision is really made, in the dealer’s catalog, the retailer’s aisle and the builder’s order book. MasterBrand bought scale. Now it has to make scale pay.
References
-
Merger completion announcement — MasterBrand, 2026-05-28 ↩↩↩
-
Q3 2026 earnings release — MasterBrand, 2026-11-05 ↩↩↩↩↩↩↩↩↩↩↩↩↩↩↩↩↩↩↩↩↩↩↩↩↩↩↩↩↩
-
MBC market quote and history — Yahoo Finance, 2026-11-20 ↩↩↩
-
Spin-off completion announcement — MasterBrand, 2022-12-15 ↩↩↩
-
MasterBrand Information Statement — Fortune Brands, 2022-12-01 ↩↩↩↩↩↩↩↩↩↩↩
-
MasterBrand 2025 Form 10-K — SEC, 2026-02-13 ↩↩↩↩↩↩↩↩↩↩↩↩↩↩↩↩↩↩↩↩↩↩↩
-
MasterBrand 2026 Proxy Statement — SEC, 2026-04-22 ↩↩↩↩↩↩↩↩↩↩↩↩
-
MasterBrand Q3 2026 Form 10-Q — SEC, 2026-11-06 ↩↩↩↩↩↩↩↩↩↩↩↩
-
U.S. cabinet market structure and estimated shares, Q1 2026 newsletter — Pzena Investment Management, 2026-04 ↩↩↩
-
Kitchen cabinet tariffs and industry effects — Associated Press, 2025-10-14 ↩
-
Q3 2026 Investor Presentation — MasterBrand, 2026-11-05 ↩↩↩↩↩↩↩↩↩↩
-
MasterBrand Q3 2026 earnings call transcript — Benzinga, 2026-11-05 ↩↩
-
MasterBrand Q2 2026 earnings call transcript — The Motley Fool, 2026-08-11 ↩↩↩↩↩↩↩↩↩↩↩
-
MasterBrand to Acquire Supreme Cabinetry Brands, investor presentation — MasterBrand, 2024-05-21 ↩↩↩
-
MasterBrand and American Woodmark merger announcement and transaction terms — SEC, 2025-08-06 ↩↩↩↩↩
-
2026 annual meeting voting results, Form 8-K — SEC, 2026-06-04 ↩
 LinkedIn
 WhatsApp
 Reddit
 Hacker News
 Email
 Kindle
 RSS Feed
 Spotify
 Apple Podcasts
 Amazon Music
 Audible
 YouTube