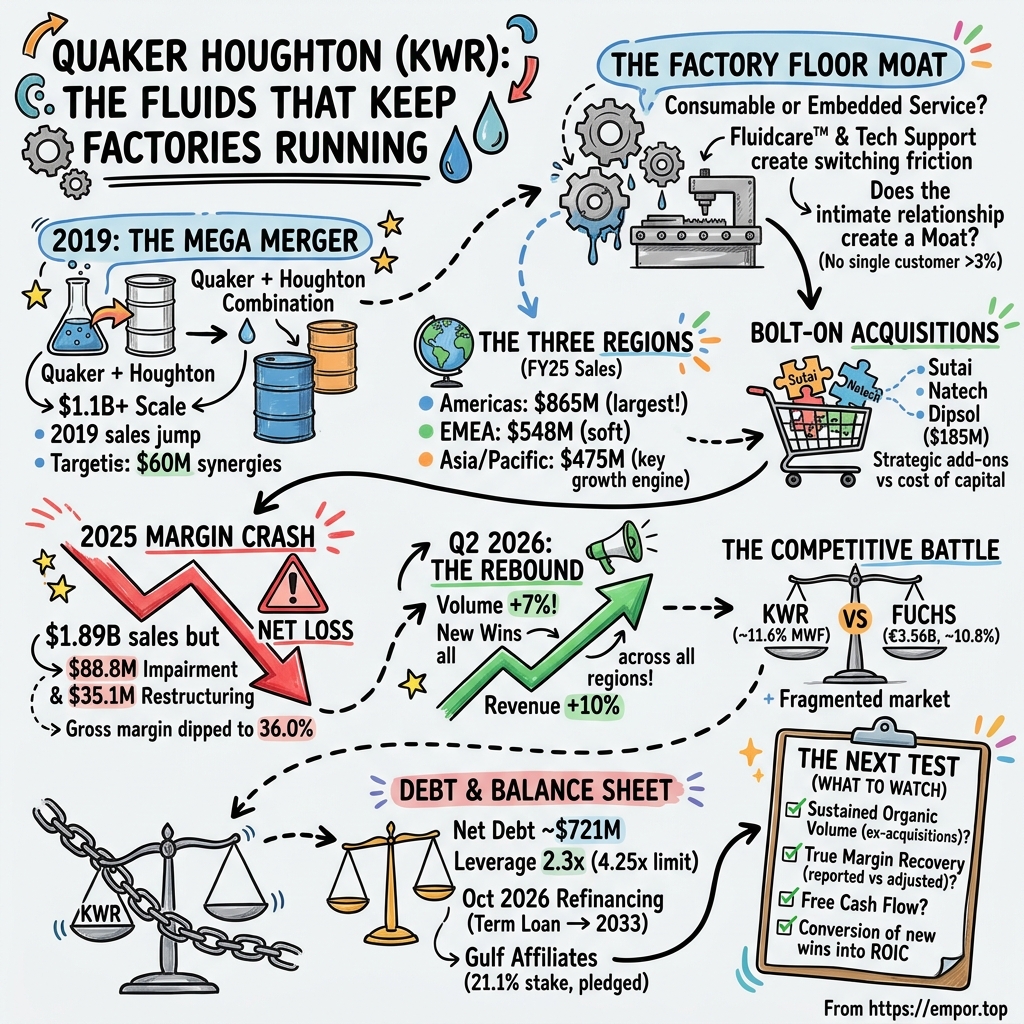
Quaker Houghton: The Fluids That Keep Factories Running
I. The Factory Line That Never Stopped
Picture a cold-rolling mill. A strip of steel, thinner with every pass, races between polished rolls under thousands of tonnes of pressure. If the metal touched the rolls dry, friction would tear the surface, overheat the machinery and send the coil to scrap.
What stops that from happening is a thin film of fluid, sprayed and recirculated, cooling the rolls, carrying away heat and leaving the steel clean enough to paint, coat or stamp into a car door. Nobody who buys the car will ever think about that fluid. The mill manager thinks about it constantly, because when it goes wrong, the line stops.
That film of fluid is the business of Quaker Houghton. It makes rolling oils, cutting fluids, coolants, hydraulic fluids, cleaners, corrosion preventatives and surface treatments, and it often sends its own chemists into customers' plants to keep them working.1 It calls itself the global leader in industrial process fluids, a category most investors could not define.1 It is the kind of supplier that factories depend on and almost nobody outside them notices.
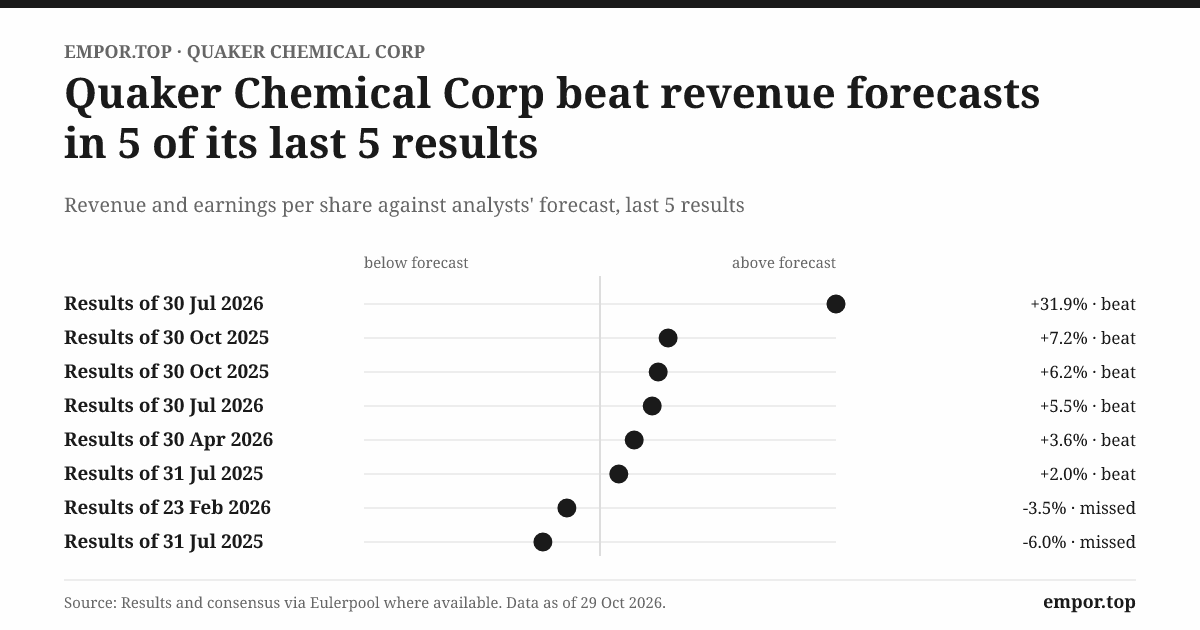
On July 30, 2026, that invisible company had a visible good day. Second-quarter sales rose about 10% to roughly $533 million, and the volume of product it shipped rose 7% from a year earlier.2 Adjusted EBITDA, the company's preferred measure of operating cash earnings, reached a record of about $85 million.2 Chief executive Joe Berquist told analysts it was the fourth quarter in a row of year-over-year profit growth, and he credited the volume to new business wins across every region.[^3]
The relief in that message makes sense only against what came before. In 2025 the company sold about $1.89 billion of product and still reported a small net loss, after writing off goodwill and paying to restructure.1 Organic volume, the amount shipped to the same businesses it already owned, was flat for the year. Sales grew about 3%, but acquisitions supplied about four points of that growth and currency about one, while lower price and product mix took away about two.1 Strip out the deals and the exchange rates, and the business had run hard to stand still.
So the Q2 rebound raises the puzzle at the centre of this story. Quaker Houghton sells something customers consume. Every coil rolled and every engine block machined uses up some fluid, which has to be replaced.
That sounds like a wonderful business: recurring purchases, embedded in production, too small a cost for the customer to fuss over. But consumption also ties the company to how much its customers make. When steel mills and car plants slow down, they buy less fluid, however indispensable it is. How much of Quaker Houghton's fortune is its own doing, and how much is the factory cycle?
Three questions follow from that puzzle, and they run through everything that follows. The first is whether customer intimacy, the company's favourite phrase for its on-site technical work, is a genuine moat or a description of good service. The second is whether an acquisition strategy that has defined the company since 2019 has earned its cost. The third is whether margins can recover on reported terms, rather than only after management's adjustments add back the charges.
First, the corporate basics, because the ownership can confuse. The listed company is Quaker Chemical Corporation, which does business as Quaker Houghton and trades on the New York Stock Exchange under the ticker KWR.1 It is the operating parent of its subsidiaries, not a subsidiary of anyone. Its largest shareholder is a group of Gulf affiliates linked to the Hinduja family, which owns about 21.1% of the stock.[^4] That is enough to matter in every vote and enough to put a family member on the board, but it is not control.3
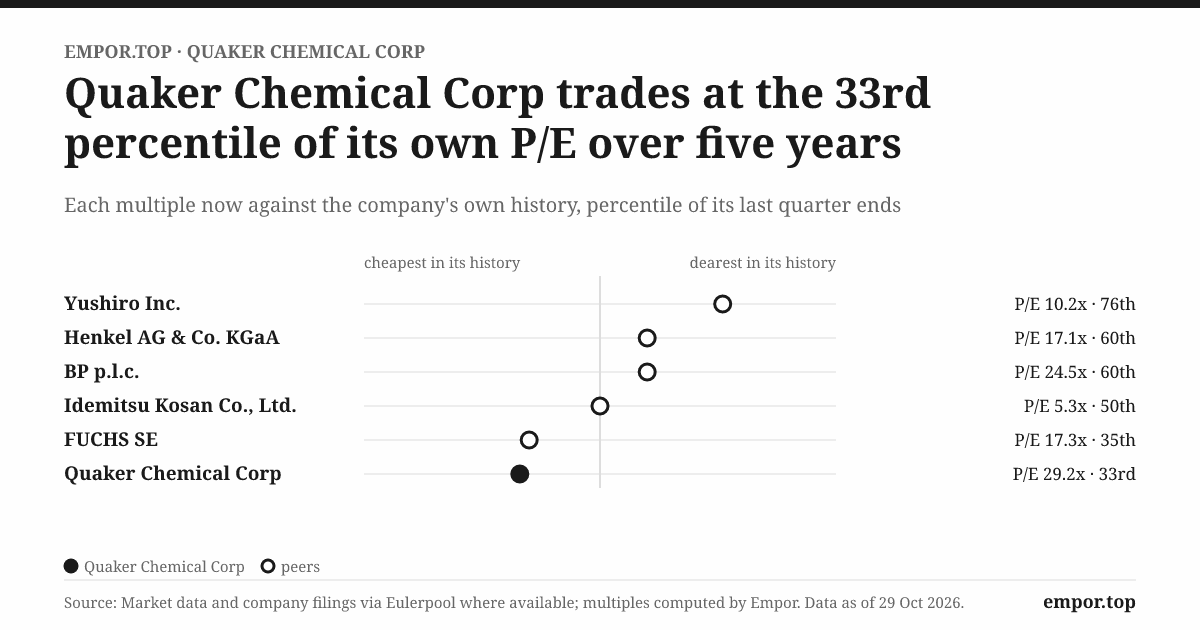
On October 29, 2026, the market valued the company at about $2.8 billion, or roughly 29 times its trailing earnings per share.[^6] That multiple is high for a chemical supplier whose reported profit fell to nothing a year earlier. It implies investors are looking through 2025 to a recovered earnings base. Whether that recovery is real is the investment question.
The story that answers it starts with a merger that doubled the company in a day. That deal explains why Quaker Houghton is the size it is, why it carries the debt it does, and why the record of its organic growth is harder to read than it looks. After the merger come the factory floor, the regions, the acquisitions, the year the margin vanished and the people trying to bring it back. The test throughout is simple: when a customer can choose another supplier, does it keep choosing this one, and does that choice earn a return?
 Subscribe on LinkedIn
II. From Quaker Chemical to a Global Fluids Supplier
For most of its century, Quaker Chemical was a respectable mid-sized specialist. Organized in 1918 and incorporated in Pennsylvania in 1930, it built a business selling formulated fluids to steel mills, metalworkers and other heavy industrial customers.4 By 2018 it had sales of about $868 million, near the top of a range it had sat in for five years.5
It had almost no debt and returned roughly 15% a year on the capital it used.5 It was a good small business. It was not a big one.
Across Philadelphia sat a much older rival. Houghton International traced its roots to 1865 and had become one of the largest makers of metalworking fluids in the world.6 It had passed through private-equity hands, and in November 2012 Gulf Oil, part of the Hinduja group, agreed to buy it from AEA Investors for about $1.05 billion.6 At the time Houghton was generating about $858 million of annual revenue, roughly the same as Quaker.6 Two companies of similar size, selling similar fluids to similar customers, were owned by very different people.
The deal that joined them was signed on April 4, 2017.4 Then it waited more than two years. Combining the two largest specialists in a niche industrial market drew antitrust scrutiny on several continents.
China and Australia cleared it in 2017, but the European Commission did not approve until the second quarter of 2019 and the U.S. Federal Trade Commission until July 2019.4 The price of approval was a divestiture: certain Houghton product lines serving steel and aluminium customers were sold for about $37 million, representing roughly 3% of the combined company's sales.4 The fact that regulators forced a sale is itself evidence. In some steel and aluminium fluid niches, these two companies were each other's closest competition.
On August 1, 2019, the deal finally closed.4 Michael Barry, Quaker's chairman and chief executive, called it "a historic day for our businesses."7 The structure made Gulf a partner rather than a seller walking away.
Quaker paid about $171 million in cash, issued about 4.3 million new shares that gave Houghton's former owners about 24.5% of the enlarged company, and refinanced about $703 million of Houghton's debt.4 The combined company had about $1.6 billion of trailing revenue, roughly 4,000 employees and operations in more than 25 countries.7 Barry's argument was that size itself was a strategic asset: "The near-doubling of the size of the company today gives us greater scale to invest in new technologies."7
Two months later, it bought Norman Hay, a British surface-treatment and industrial-process business, for £80 million.4
The financing reshaped the balance sheet overnight. Borrowings went from about $37 million at the end of 2018 to about $963 million a year later.4 Net debt was about 3.5 times adjusted EBITDA at the end of 2019, and management said it expected to get to about 3.0 times by the end of 2020.8 Quaker Chemical had been a lightly geared company. Quaker Houghton was a leveraged one, betting that the merged business would earn enough to pay down debt and still grow.
The promises were concrete. On closing day the company raised its cost-synergy target to $60 million from $45 million, to come mostly from operational efficiencies, logistics and procurement.7 Barry said the combined company would be generating over $300 million of adjusted EBITDA two years after the deal.7 And it said it expected to return to growth 2% to 4% above its end markets from year two, as Quaker said it had done before.7 That last promise matters most for this story, because it is the one about customers rather than costs.
The first set of results showed why the promises needed time. Reported 2019 sales rose 31% to about $1.13 billion.8 That headline was entirely the acquisitions.
Excluding Houghton and Norman Hay, sales fell 6%, split evenly between lower volumes and weaker currencies.8 On a pro forma basis, as if the two companies had been together all year, adjusted EBITDA was about $234 million, down slightly from the year before.8 The new Quaker Houghton was far bigger than the old Quaker Chemical, but in its first months it was not growing.
Look at the long-run growth record with that in mind. Over ten years, revenue grew about 10% a year.1 Over the last three it shrank about 1% a year.1 The difference is mostly the merger. Revenue growth bought in a single transaction is real, and the customers it brought are real, but it says little about whether a company can win more business from the plants it already serves.
Returns tell the same story in another language. Return on invested capital, a measure of operating profit against the money tied up in the business, was above 16% in 2018 and fell to about 2% in 2019, as a large balance sheet arrived with only five months of acquired earnings and heavy integration costs.4 Asset turnover dropped from about 1.2 times to 0.4 times.4
The company then needed to earn a return on a much larger pile of capital, much of it goodwill and intangibles. In 2025, return on invested capital was about 4%, and in the twelve months to June 2026 it was about 6.5%.9 Those are low numbers for a business that claims durable customer advantages.
The merger answered the question of scale. It left open whether the enlarged company could earn more from the same customer relationships, or whether it would need to keep buying growth. To answer that, the story has to go inside the plant, where the fluid does its work.
III. The Fluid in the Middle of the Production Line
Think of metalworking fluid as blood in a machine. In a grinding shop it floods the point where a wheel meets steel, carrying away heat that would otherwise warp the part and flushing away chips that would scratch it. In an aluminium rolling mill it keeps the strip from welding itself to the rolls. In a car plant's machining line, a central sump of thousands of litres feeds dozens of machines, and the condition of that fluid decides tool life, surface finish and how often the line pauses. When the fluid degrades, grows bacteria or picks up contaminants, the customer notices in rejected parts and downtime long before it notices the invoice.
That is why Quaker Houghton sells more than drums of liquid. It formulates products for particular processes, sells them through its own sales force and distributors, and in many plants runs a chemical-management programme it brands Fluidcare, under which its technicians monitor, adjust and manage the fluids on the customer's site.1 The accounting follows the work. Product sales are generally recognised when control passes to the customer on delivery, consigned products when the customer consumes them, and services over time as they are performed.1
The customer's incentive explains why this can be a good business. A machining plant may spend far more on tools, energy, scrap and downtime than it spends on fluid. If a better fluid, properly managed, cuts those costs, the per-litre price matters less than the result.
A supplier whose people know the plant, its machines and its history becomes part of how the plant runs. Switching suppliers then means retesting, requalifying and accepting the risk that the new fluid behaves badly on a line that cannot afford to stop. That is the theory of the moat.
Management has started to put numbers on it, though only on earnings calls. On the second-quarter 2026 call, Berquist said customer churn had fallen to the low single digits.[^3] Asked about the company's Fluid Intelligence monitoring equipment, executives estimated that fluid sales tied to it made up something like 10% to 20% of revenue, and said the margins on that business were not necessarily higher than the company average.[^3]
In Asia, they described the monitoring kit as a way into new customers.[^3] These are useful clues. They are also management estimates offered in conversation, not audited disclosures.
The annual report is more reserved. The company does not disclose the length of its contracts, minimum purchase commitments, renewal rates, the share of revenue under multi-year Fluidcare agreements or a recurring-revenue figure.1 The last time it broke out services as a separate revenue line, in 2019, service revenue was about $28 million, a small fraction of sales.4 So the claim that technical service locks in customers is plausible and consistent with how the product works, but the company publishes no number that would let an outsider check it.
The customer list cuts both ways. In 2025 the five largest customers bought about 11% of sales and the largest about 3%.1 No single steel mill or carmaker can dictate terms to the company. But the 10-K also says a significant share of revenue comes from steel and automotive customers, which means the customer base is diversified by name and concentrated by cycle.1 When automakers cut production or steel output falls, many customers buy less at once, whatever their loyalty.
The company's own description of competition is notably modest. It says competition turns on meeting customer needs with products and technical services at an appropriate price and value.1 Notice the word price. A supplier with impregnable switching costs does not usually list price among its competitive factors. The 10-K sounds like a company that wins through service and performance, but that must still justify its price, which is the more realistic picture.
There is a second way to test intimacy, and it runs through the receivables ledger. A supplier that customers rely on should get paid on time. Debtor days, the number of days of sales sitting unpaid on the balance sheet, rose to about 121 in 2019 as the merged company consolidated Houghton's receivables mid-year, and then fell to about 81 by 2025.1
That is a real improvement in the discipline of collecting cash. At the end of 2025, net receivables were about $417 million after an allowance for bad debts of about $15 million, and actual write-offs in the year were well under $1 million.1 Customers, in other words, mostly pay.
The longer history supports that. A decade ago, customer bankruptcies cost the company well under $1 million a year, at about $0.8 million in 2014 and $0.3 million in 2015.10 Selling to steel mills and car-parts makers has not, on the record, been a story of large credit losses.
They do not always pay quickly, and that shows up in cash. In the first half of 2026, rising receivables absorbed about $48 million of cash, which management attributed to the timing of collections on higher sales.9 The company says its credit-loss estimates consider aging and customer-specific information, but it does not publish an aging schedule or an overdue balance.1 Investors are left with a trend that looks good and a half-year that shows how much cash can be tied up when sales jump.
Put the moat on trial, then, and the verdict is mixed rather than damning. The evidence for switching friction is the nature of the product, the on-site service model, low single-customer concentration and management's statement that churn is now in the low single digits. The evidence against complacency is the company's own emphasis on price, the absence of disclosed retention or contract data, and a year, 2025, in which organic volume was flat.
Price and mix also fell about two points that year, partly because many contracts are linked to raw-material indices that pass lower costs back to customers.1 A supplier with strong pricing power usually keeps more of the gain when inputs fall. Quaker Houghton's contracts are designed to hand much of it back.
The fair reading is that the moat is real at the level of the individual plant but narrower than the phrase "customer intimacy" implies. It protects existing business from casual switching. It has not, on the published evidence, given the company the ability to raise prices at will or to grow faster than its customers' output without winning new plants one by one. Whether those new wins are coming, and from where, is a question best answered region by region.
IV. Three Regions, One Uneven Recovery
In December 2025, while investors were still digesting the year's losses, three things went wrong in North America at once. A large customer had an outage at its facility. Winter weather disrupted the company's own operations.
And tariff uncertainty kept factories in Mexico cautious about production.[^14] Management put the combined revenue hit from weather, the outage and the operational problems at somewhere between $5 million and $10 million for the quarter.[^14] Meanwhile, half a world away, the Asia/Pacific business was recording its tenth consecutive quarter of organic volume growth.[^14]
The quarter's numbers made the contrast plain. Asia/Pacific sales rose about 15% in the fourth quarter, with organic volume up about 4%. EMEA sales rose about 7% even though its organic volume fell about 2%, because acquisitions and currency did the work. The Americas was flat, and management estimated that underlying volume there had slipped about 1%.[^14] When an analyst asked where share gains were coming from, management said they were broad across all three regions but running in Asia/Pacific at roughly twice the rate of the others.[^14]
That contrast is the geography of Quaker Houghton today. The company reports three segments, and they tell different stories. In 2025 the Americas sold about $865 million, EMEA about $548 million and Asia/Pacific about $475 million.1
Segment operating earnings were about $228 million, $97 million and $124 million.1 Those segment figures are management's measure of each region's earnings before corporate costs, impairment, restructuring and some depreciation and amortisation, so they add up to far more than the company's consolidated operating profit.1 They are best used to compare regions with each other, not to judge the company as a whole.
Read that way, the comparison is striking. The Americas and Asia/Pacific each turned roughly 26 cents of every sales dollar into segment earnings. EMEA turned about 18 cents.
The Americas is the largest pool of profit and the core of the business, built on North American steel, aluminium and automotive plants. Asia/Pacific is smaller but just as profitable and growing fastest. EMEA is the laggard, and that will matter when the story reaches the year's largest write-off.
The trends in 2025 sharpened the picture. Asia/Pacific sales rose about 13%, helped by acquisitions and organic growth, though its segment earnings rose only about 1%.1 The Americas went the other way: sales fell about 2% and segment earnings about 7%.1 EMEA sales grew about 2% as acquisitions offset weak markets, while segment earnings slipped about 3%.1 Put simply, the region that grew fastest did not earn proportionally more, and the region that earned the most shrank.
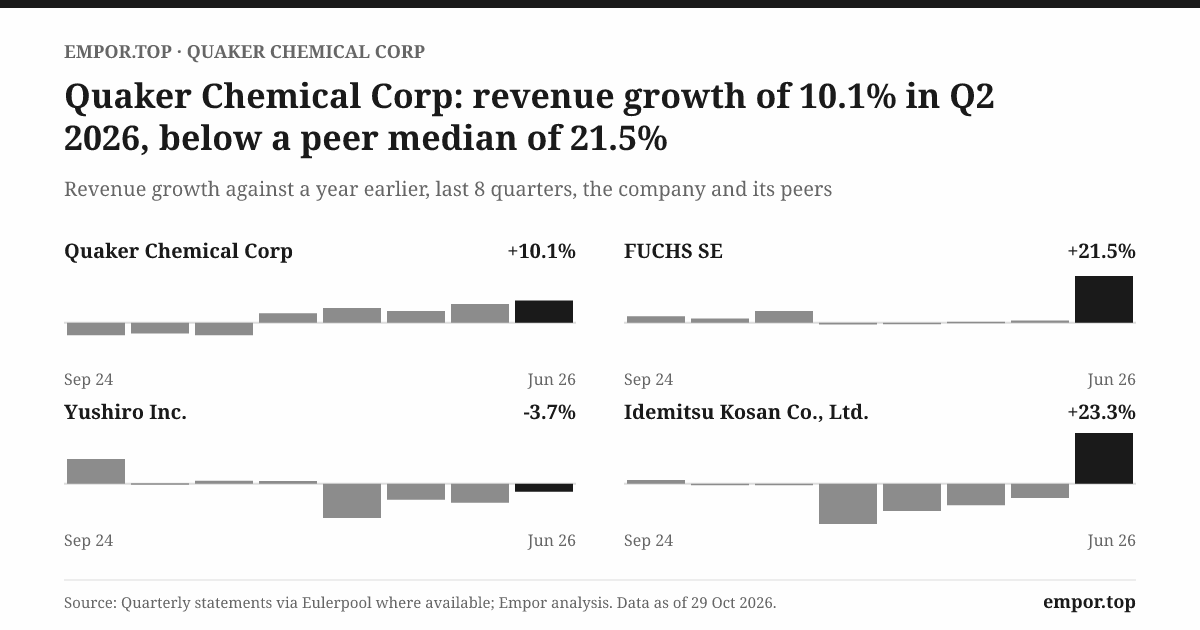
The first quarter of 2026 looked like the beginning of a turn. Sales rose about 8%. Organic volume rose about 3%, acquisitions added about 4%, currency added about 4%, and price and mix subtracted about 3%.[^15]
Management said net share gains contributed about 4 points while end markets fell about 1 point, which, if accurate, meant the company was growing despite its customers rather than because of them.[^15] Asia/Pacific was again the engine, with sales up about 25% and organic volume up about 10%. The Americas was flat.[^15]
The second quarter was broader. Volume rose 7% year on year, attributed primarily to new business wins across all segments.2 EMEA sales rose about 13% and segment earnings jumped from about $25 million to about $33 million, helped by savings from closing a plant in Dortmund, Germany.2[^3] Asia/Pacific sales rose about 12%, with organic volume growing around 10% for the second straight quarter, and segment earnings rose from about $29 million to about $37 million.2[^3]
The Americas was the exception, and the exception was revealing. Its sales rose about 7% and its volume about 4%, yet its segment earnings fell from about $59 million to about $57 million.2[^3] Management blamed higher manufacturing and operating costs, including the cost of disposing of inventory and running a key plant around the clock to keep up with demand.[^3] Executives expected those margins to recover. Still, the company's largest and most profitable region grew volume and earned less, which is the wrong combination for a business whose case rests on operating leverage.
Two caveats temper the volume numbers. The first is what counts as organic. The comparable volume trend excludes volumes from acquired Sutai, Natech and Dipsol businesses, so the 7% figure is meant to show the existing business.2 That is the right adjustment, and it makes the quarter more impressive.
The second caveat is timing. When an analyst pressed on EMEA, management estimated that about half to two-thirds of the region's growth came from share gains, with the rest from customers buying ahead.[^3] Pre-buying borrows from future quarters. And executives suggested that Asia's double-digit organic growth might settle toward the mid-single digits.[^3]
Geography also shapes risk. When conflict around the Strait of Hormuz disrupted energy markets in the spring of 2026, management said sales to the Middle East and North Africa had been under 2% of the company's 2025 total, and that it had seen no supply problems.[^15] The exposure to that conflict ran through raw-material prices rather than through customers, which is a reminder that a company can be geographically diversified in its sales and still concentrated in its inputs.
So where is the business actually growing? The cleanest evidence points to Asia/Pacific. Management describes the wins there as broad-based across China, India and Southeast Asia and mostly made up of smaller contracts, with India a growth driver and China still growing but slowing.[^3] That is the profile of a company taking share plant by plant in markets where industrial capacity is still being built. It is also a region whose sales were roughly half the size of the Americas' in 2025, so it cannot carry the company alone.
The investor takeaway is that the recovery is real in volume but uneven in profit. Asia/Pacific is doing what the moat story predicts: winning new plants and earning well on them. EMEA's improvement owes as much to cost cutting as to customers. The Americas, the heart of the business, has yet to convert volume into higher earnings. Much of the company's recent expansion, meanwhile, has come through the acquisitions that the slides carefully exclude, and those deals deserve their own scrutiny.
V. What Did the Houghton Deal Buy?
In April 2025 Quaker Houghton bought a Japanese company that most of its shareholders had never heard of. ディップソール (Dipsol Chemicals) made surface-treatment and plating solutions, the chemistry that protects metal parts from corrosion and gives fasteners, brackets and engine components their finish, mainly for automotive and industrial customers.1 It was the largest deal the company had done since Houghton, and it said something about where management wanted to take the business: beyond the fluids that flow through the production line toward chemistry that stays on the finished part.
The price was meaningful. Dipsol cost about $186 million gross, or about $156 million after the cash that came with it.1 That net price equalled roughly 8% of the company's annual sales and nearly a fifth of its year-end borrowings.1 It was paid for with the credit facility, which is a large part of why total borrowings climbed during 2025 to about $871 million, even as the company was trying to cut costs.1 The company reports Dipsol's results across all three segments, which reflects a customer base spread across Japan and beyond.1
Dipsol did not arrive alone. In February 2024 the company bought I.K.V. Tribologie, a maker of first-fill greases, the lubricants factories put into new equipment.1 In July 2024 it bought the Sutai Group, a Japanese provider of impregnation products that seal porous metal castings.1
In 2025 it added Chemical Solutions & Innovations, a South African metalworking-fluid supplier, and Natech, a British maker of surface-treatment chemicals.1 Payments for CSI, Dipsol and Natech together came to about $164 million net of cash acquired.1 The stated rationale for all of them was the same: more specialty products, more technology and more customers to cross-sell to.1
That rationale deserves a hard look, because it is the same rationale that justified Houghton. Each deal adds a product line that the sales force can, in theory, carry into existing plants. Each also adds integration work, purchase-accounting charges and goodwill. The returns on such deals depend less on the strategic logic, which almost always sounds right at announcement, and more on whether the acquired sales actually grow under new ownership.
Dipsol's first year offered few clues. After the acquisition, it contributed about $63 million of sales to 2025 results and a pre-tax loss of about $5 million.1 That loss included purchase-accounting costs such as the amortisation of the inventory markup booked at acquisition and depreciation and amortisation of acquired assets, so it overstates Dipsol's underlying weakness.1
But the company does not disclose Dipsol's standalone EBITDA or its full-year revenue before the deal. Without an earnings base, any attempt to compute what multiple Quaker Houghton paid, or to compare it with industry deal multiples, would be guesswork. Nine months of sales and a purchase-accounting loss are not a valuation.
What the record does show is the fate of earlier acquisition capital. In the second quarter of 2025, the company recorded an $88.8 million non-cash impairment that wrote the goodwill of its EMEA reporting unit down to zero.1 It said the trigger was lower-than-projected EMEA earnings amid soft end markets, combined with a higher cost of capital driven by tariff uncertainty.1
Goodwill is the premium paid in acquisitions over the fair value of identifiable assets. The company does not allocate the write-off to a particular deal, and EMEA's goodwill had been built up over many years and many acquisitions. But the impairment is an admission that the European business, as it stood in 2025, was not expected to earn enough to justify the premiums once paid for it.
That is the clearest disconfirming evidence in the company's own history for the claim that acquisitions create value automatically. It does not prove the Houghton deal destroyed value. The combined company is larger, broader and, in places such as Asia, growing. It does prove that at least one region's acquired value has been marked down to nothing, and that the people running the company today have to earn a return on capital that previous deals did not fully justify.
The Houghton promises can now be checked against six years of results. Barry said in 2019 that the combined business would generate over $300 million of adjusted EBITDA two years after closing.7 In 2024 adjusted EBITDA was about $311 million, and in 2025 it was about $299 million.1
So the company reached roughly the promised level, but years later than promised, and only after adding IKV, Sutai, Dipsol, Natech, CSI and other acquisitions along the way. The 2-4% above-market organic growth promised from year two cannot be cleanly tested over the whole period, because the company does not report a consistent organic series back to 2019. The best recent readings, flat organic volume in 2025 and 3% to 7% in the first half of 2026, show a business that has sometimes met that ambition and sometimes not.
Has management learned the lesson? On the fourth-quarter 2025 call, it disclosed about $7 million of costs tied to assessing acquisitions and said the opportunities it was looking at were larger and multi-regional, though "nothing's imminent."[^14] By mid-2026, the emphasis had shifted to filling portfolio gaps and buying small regional players at attractive multiples, while keeping capacity for larger deals.[^3] A skeptic would note that the company wrote off a region's goodwill in one quarter and was studying bigger deals within months.
The test for Berquist's team is not how many product lines it adds. It is whether acquired sales grow, whether cross-selling shows up in organic volume, and whether return on invested capital, about 6.5% over the twelve months to June 2026, climbs toward the double digits it reached as a smaller company.9 Until it does, each acquisition is a promise that the next one will work better. The year 2025 showed what happens when promises and markets collide.
VI. The Margin Vanished in 2025
Imagine the finance team closing the books on 2025. The company had sold nearly $1.9 billion of products, more than in any year except the inflation-swollen peaks of 2022 and 2023.1 Its customers were still running.
Its fluids were still flowing. And yet, when every charge was counted, it had lost about $2.5 million.1 A business with stable customers and almost $1.9 billion of sales had made no money at all.
The headline loss came from two lines. An EMEA goodwill impairment was the largest.1 The second was restructuring, which cost about $35 million in 2025 against about $7 million in 2024, as the company closed the Dortmund plant, consolidated offices and cut complexity.1 Together they turned an operating profit of about $195 million in 2024 into about $53 million in 2025.1 The second quarter took the worst of it, with an operating loss of about $52.5 million as the impairment landed.1
It would be convenient to stop there and call 2025 an accounting trough. Management's adjusted figures invite that reading, because they add back the impairment, the restructuring and other items. But the adjusted figures themselves deteriorated.
Adjusted EBITDA fell about 4% to $299 million.1 Adjusted operating margin fell from about 11.6% to about 10.6%.1 Adjusted earnings per share fell from $7.44 to $7.02.1 Something real happened beneath the charges.
The bridge from sales to profit shows where. Gross margin, the share of each sales dollar left after the cost of raw materials and manufacturing, fell from about 37.3% to about 36.0%.1 On almost $1.9 billion of sales, 1.3 points is about $25 million of gross profit.
Management attributed the decline to product, service and geographic mix and to index-based contracts, which pass raw-material movements to customers with a lag.1 Segment earnings in the Americas and EMEA fell on lower margins.1 Then central costs, restructuring, impairment and the amortisation of acquired intangibles drove consolidated operating income far lower.
The mix explanation has substance. Asia/Pacific grew fastest, and its newer, smaller contracts carry different economics from long-established American steel accounts. Acquired businesses brought their own margins.
But the index-based contract explanation is a double-edged admission: it is a reasonable arrangement for a supplier seeking long relationships, but it limits how much of falling input costs the company can capture.
Below operating income, the numbers became small enough that small items mattered. Pre-tax income was only about $7 million.1 Foreign-exchange transaction losses of about $8 million alone exceeded it.1
With so little pre-tax profit, the tax charge, inflated by items such as the largely non-deductible goodwill write-off, was enough to push the year into a loss.1 The net loss was therefore partly an artefact of where the charges fell. The adjusted decline was not.
Cash flow tells a more reassuring but more complicated story. Over the twelve years from 2014 to 2025, the company generated about $1.3 billion of operating cash flow against about $649 million of cumulative net profit, roughly twice as much.15 That gap is what you would expect from a business with heavy non-cash charges such as amortisation, impairment and stock compensation. But the annual pattern is uneven. Operating cash flow was about $279 million in 2023, about $204 million in 2024 and about $136 million in 2025.1
The 2025 cash flow contains its own warning. The impairment and restructuring charges were added back because they were largely non-cash or paid later, while about $27 million of restructuring cash actually went out the door.1 Payables and accrued liabilities absorbed about $30 million.1
On the fourth-quarter call, Tom Coler, the chief financial officer, also pointed to higher inventory, tied to North American operating problems and the Dortmund closure.[^14] Free cash flow, operating cash less capital spending, came to about $81 million, the lowest since 2022.1 Restructuring is supposed to pay for itself, and management says the one-time cash cost of its programmes is typically 1 to 1.5 times the annual savings.[^15] In 2025 the costs came first.
The trajectory inside the year was better than the annual total. By the fourth quarter of 2025, sales were up about 6% from a year earlier, adjusted EBITDA was up about 11% to about $72 million and adjusted earnings per share were up about 24%.[^16][^14] The trough, in other words, was the middle of the year. In the first quarter of 2026, adjusted EBITDA rose about 5% to about $73 million, but the margin slipped to about 15% because selling and administrative costs rose faster than sales.[^15] Coler had warned of exactly that, telling analysts in February that SG&A would rise with variable compensation and inflation.[^14]
How did management explain all this, and did it offer milestones that could be checked? On the fourth-quarter call in February 2026, Berquist blamed persistent tariff uncertainty, saying it "continues to disrupt global trade flows and negatively influence our customers' operations."[^14]
But he also gave numbers. He said gross margin would return to the targeted range of 36% to 37% for 2026, that the company would deliver net share gains of 2% to 4%, and that the 2025 cost programme had produced about $25 million of run-rate savings.[^14] He reiterated a long-term goal of EBITDA margins above 18%, adding that "volume will help us get to 18%, but there's still some self-help."[^14]
Then the world tested those milestones. In the spring of 2026, hostilities around the Strait of Hormuz pushed up crude-linked costs for base oils, additives and oleochemicals, the raw materials of the company's products.[^15] On the first-quarter call, management said gross margin had reached 36.8% but would fall 200 to 300 basis points in the second quarter before recovering, because about a quarter of pricing was index-linked and adjusted with a lag.[^15] It pushed through price increases in April and May.[^15] When the second quarter arrived, gross margin was 35.5%, down about 130 basis points, a smaller drop than management had warned of.2[^3]
That sequence is the most useful evidence about management in this section. It set a measurable target, warned in advance of a specific shortfall with a specific cause, and then did better than its own warning. That is not proof of a durable margin recovery. Base-oil-linked inputs, about two-thirds of raw materials, remained volatile at elevated levels in mid-2026.[^3] But it is the behaviour of a team that knows its cost structure.
So was 2025 a one-off trough or evidence of fragility? The honest answer is both, in proportions that can be measured. The impairment and restructuring explain most of the reported collapse. A decline of about 4% in adjusted EBITDA and a lower gross margin explain the rest, and they reveal a business that can lose margin when its largest regions soften and when contracts pass costs through. The company's recovery depends on the people charged with fixing it.
VII. The Wins Behind the New Volume
Joe Berquist did not arrive as an outsider with a turnaround plan. He became chief executive and president on November 18, 2024, after a long climb through the company.3 From 2010 to 2019 he ran North America as vice president and managing director, the job that put him closest to the steel and automotive customers at the core of the business.3 After the Houghton merger he became chief strategy officer and ran the global specialty businesses, then took over as interim head of EMEA in late 2022, and from January 2023 served as chief commercial officer.3 He was 54 when the 2026 proxy was written.3
That résumé shapes his priorities. Berquist is a commercial executive, a seller of products into plants, and his language on calls is about wins, share gains and customers. He replaced Andrew Tometich, who left in November 2024.3 Tom Coler joined as chief financial officer in 2024.3 So the team that delivered the 2025 loss and the 2026 rebound is new to its jobs, with a chief executive who knows the company deeply and a chief financial officer who arrived from outside.
The leadership bench has not been entirely stable since. Jeewat Bijlani, executive vice president and chief growth officer, left effective September 30, 2026, in what the company described as a termination without cause unrelated to any disagreement.11 The board changed too. Michael Barry, who had led the Houghton deal and chaired the board since 2009, retired in May 2026. Mark Douglas, an independent director since 2013, became chairman, and the lead-director role was eliminated.12
How Berquist is paid reveals what the board wants from him. In 2025 his total compensation was about $3.71 million, of which about $2.42 million was stock awards and about $0.46 million an annual incentive.3 The headline that the new-business metric paid out at 200% of target, in a year of GAAP loss, sounds like a board rewarding sales while shareholders lost money. The details are more nuanced.
Adjusted EBITDA carried 65% of the annual bonus, and the company's result, about $290.6 million on the plan's basis, missed the $291 million threshold, so that portion paid nothing.3 Net new business wins carried 25%, came in at 4.6% and paid 200%.3 Safety metrics made up the rest. Overall, Berquist's annual incentive paid about 58% of target.3
The design is defensible. Paying for new business rewards exactly the behaviour the moat thesis requires. But the 4.6% figure raises a sharp question.
If the company won net new business equal to about 4.6% of sales in 2025, why was organic volume flat? The arithmetic implies that markets, lost business or both subtracted roughly as much as the wins added. The metric measures effort that worked; organic volume measures what was left after the cycle. Shareholders are paid by the second.
The long-term plan leans on returns. Sixty percent of Berquist's long-term award comes as performance shares measured half on relative total shareholder return and half on adjusted return on invested capital over 2025 to 2027.3 The board also introduced stock-ownership guidelines effective January 1, 2026, requiring the chief executive to hold shares worth five times his base salary, about $4 million at his 2025 salary.3 That alignment mechanism is new, and its effect will take years to judge.
The money being reinvested in the business is rising. Research and development spending grew from about $50 million in 2023 to about $61 million in 2025, from about 2.6% to about 3.2% of sales.1 Capital spending rose from about $39 million to about $56 million, or about 3% of sales.113 Headcount rose to about 4,700 at the end of 2025 from about 4,400 a year earlier, but that increase came mostly with Dipsol and other acquisitions.1 The company does not publish an organic headcount trend.
Berquist is cutting at the same time as he is investing. In 2026 the company launched a programme affecting about 100 positions.9 On the first-quarter call, he described a transformation aimed at adjusted EBITDA margins of at least 18%, and possibly eventually 20%, with about $10 million of new run-rate savings by the end of 2026 and $20 million to $30 million of structural savings over three years.[^15] He insisted that "this is not a reaction to what's happening in the Middle East."[^15] The company is also closing its plant in Songjiang, China, as a new facility at Zhangjiagang starts up.[^15]
Shareholders have heard restructuring promises before. A 2022 programme removed about 440 positions and, by the company's account, delivered at least $20 million of annualised savings.141 Programmes approved in 2025 were expected to add about $40 million more by the end of 2026.1
Then came the 2026 programme. Each was presented as a step toward a leaner company, and each produced real savings. But three programmes in five years also mean restructuring charges have become a near-permanent feature of the income statement, which is why the adjusted figures that exclude them deserve some skepticism.
Cutting while promising more customer service carries a risk. The service model depends on people in plants. Asked in July 2026 whether the workforce could handle more growth, Berquist said the company had spent too much time on internal work and was simplifying systems to free up customer-facing staff.[^3] That is the right diagnosis for a company built from many acquisitions with many systems. It is also the kind of promise that is easy to make and hard to measure from outside.
Berquist has also shown a degree of guidance discipline that his predecessors' merger-era promises lacked. In February 2026, when an analyst noted that consensus expected roughly 10% EBITDA growth, he declined to endorse a number. Instead he described an algorithm of mid-single-digit revenue growth and high-single-digit EBITDA growth over time.[^14] In April, asked whether a demand collapse was coming, he said he was "not seeing that sort of catastrophic demand disruption on the horizon," and added that most share gains were coming from selling more to existing customers.[^15] The answers were measured rather than promotional.
The second-quarter call offered the strongest evidence for Berquist's case. Sales rose about 10%, adjusted EBITDA rose about 13% to about $85 million, and adjusted EBITDA margin reached about 16%.2 Management said share gains in the quarter exceeded the top of its 2% to 4% target range, with Asia/Pacific leading.[^3] Executives said they had pushed through two rounds of price increases to offset raw materials, and that most of that pricing had now flowed through.[^3] For the full year they guided to mid-to-high single-digit growth in adjusted EBITDA, with the third quarter expected to resemble the second.[^3]
Compare those promises with the 2019 promises and the gap is narrower than it was a year ago. The Houghton-era plan promised $60 million of synergies and growth of 2% to 4% above market from year two.7 The synergy promise was largely about costs, and the company's adjusted EBITDA eventually reached the promised $300 million level. The growth promise met a pandemic, an inflation shock, a destocking cycle and a flat 2025. Berquist's team has made the same 2% to 4% share-gain promise and, in the first half of 2026, has delivered it.
The verdict is that management has a credible near-term case and a provisional long-term one. The volume is real and the margin warning on the first-quarter call was honest. But the 2025 baseline was weak, the Americas still lags, and the 18% margin target remains about two points above the best quarter of the recovery. The question is whether Quaker Houghton's position among its rivals is strong enough to hold the gains.
VIII. A Global Leader in a Fragmented Aisle
Walk into the maintenance store of a large automotive plant and you might see drums from several suppliers side by side. One line might run a Quaker Houghton coolant, another a fluid from FUCHS, the German lubricants group. The hydraulic systems might be filled with oil from Shell or ExxonMobil, and a specialist shop might use a Swiss coolant from Blaser Swisslube.
Each supplier claims expertise. The plant's purchasing team, under pressure to cut costs, knows it can qualify more than one. That aisle of drums is the competitive market in miniature.
Quaker Houghton's own 10-K says it holds the leading global position in industrial process fluids and a leading position in fluids for sheet steel and aluminium.1 It also admits it cannot readily determine its precise competitive position in every market it serves, and that competitors range from broad lubricant companies to narrow specialists offering different product ranges and service levels.1 Leadership in a fragmented market is a meaningful claim, but it is not dominance.
Outside estimates support the leadership claim, with caveats. Global Market Insights estimates the metalworking-fluids market at about $13.6 billion in 2025, with Quaker Houghton holding about 11.6% and FUCHS about 10.8%, followed by ExxonMobil, Shell and BP Castrol.15 By that estimate the five largest players together held about 48% of the market, leaving more than half to regional blenders and specialists.15 Treat those numbers as directional. They come from secondary research, the firm does not publish a rigorous definition of the category, and the company's revenue includes products and services that may not fall within it.
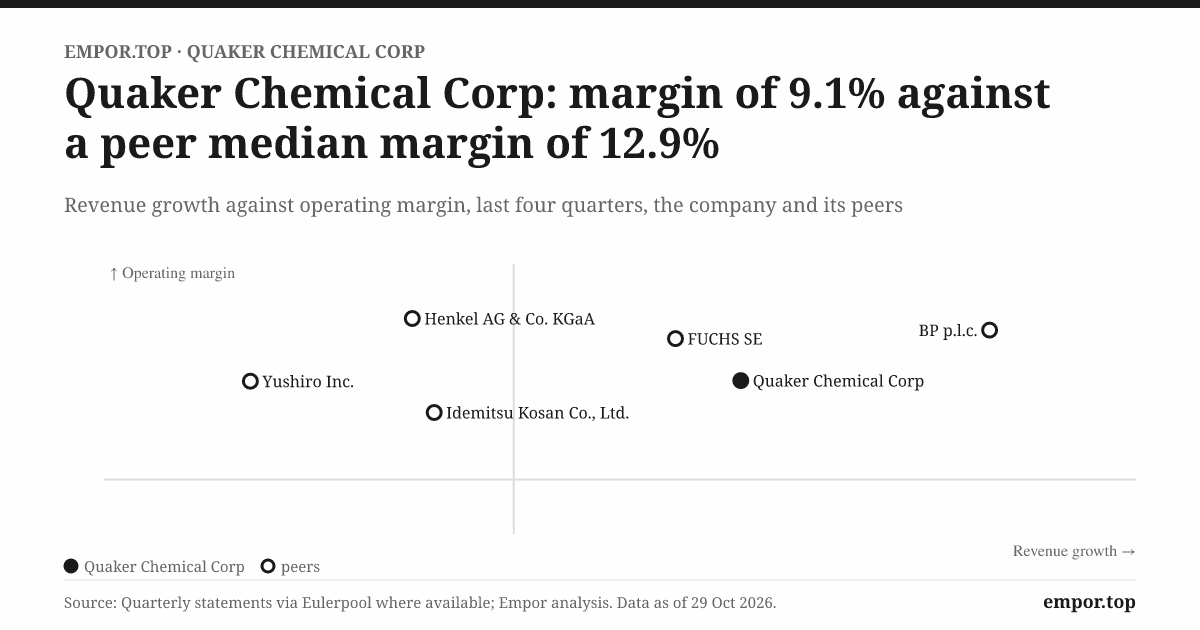
FUCHS is the most useful comparison. It is a larger listed lubricants group whose 2025 sales were about €3.56 billion and whose earnings before interest and tax were about €435 million, a margin of roughly 12%.16 Quaker Houghton's 2025 reported operating margin was about 3%, and its adjusted operating margin about 10.6%.1 The comparison is imperfect, because FUCHS sells a broader portfolio that includes automotive aftermarket lubricants, and because Quaker Houghton's amortisation of acquired intangibles depresses its reported margin. But it shows that a larger, less acquisition-heavy rival earns a steadier margin in overlapping markets.
The structure of the industry explains why leadership translates only partly into pricing power. Rivalry is real, because the market is fragmented and oil majors can compete on base products. Buyer power is moderate: no single customer dominates Quaker Houghton's sales, but large steel and automotive buyers run formal procurement and can qualify multiple suppliers.
Supplier power is significant in a different way. Base oils and other crude-linked feedstocks make up about two-thirds of raw materials, and the company does not control their price.[^3] The threat of substitutes is low for the fluid itself, since factories cannot run without it, but moderate for any particular supplier's fluid. The threat of new entrants is modest, because qualification and service networks take years to build.
In Hamilton Helmer's language of durable advantages, the company's strongest power is switching costs, consistent with the plant-level friction and low-single-digit churn claim described earlier.[^3] The company also has modest scale economies, since a global network lets it serve multinational customers in many countries and spread research costs. It has some process power in its formulation and application know-how, though that is hard to prove from outside.
The other powers are mostly absent. There is no network effect, because one customer's use of a fluid does not make it more valuable to another. Brand matters to procurement teams less than test results. There is no counter-positioning, since rivals can and do offer similar services. And there is no cornered resource, since raw materials are commodities and the company's formulations, while proprietary, face competing formulations.
The previously noted price pass-through and flat organic volume weigh against a strong moat.1[^15]3 Management also says most share gains come from selling more to existing customers, suggesting the incumbent advantage works best inside plants it already serves.[^15]
Valuation shows what the market believes about all this. At about 29 times trailing earnings, Quaker Houghton trades a little below its own five-year median of about 31 times.[^6] On the same day, FUCHS traded at about 17 times trailing earnings and H.B. Fuller, an adhesives maker, at about 14 times, while Element Solutions, a specialty chemicals group, traded at about 42 times.171819 Those peers differ in mix and accounting, and Quaker Houghton's trailing earnings still include restructuring costs. But the premium to FUCHS suggests investors are paying for a recovery in margins that has not yet happened.
The verdict on the moat is that it is intact but unproven at the scale the multiple implies. Switching costs at the plant level are plausible and supported by management's churn claim. Scale and breadth matter in a fragmented market.
But the company publishes no retention figure, its pricing has repeatedly been subject to index-linked pass-through, and its margins trail a larger rival's. The moat would be confirmed by sustained organic growth above end markets alongside rising gross margins. It would be falsified by share gains that come only with price concessions. Either way, the company must finance its strategy through the cycle, and that brings the story to its balance sheet.
IX. Debt, Pledges, and the Price of Patience
On October 1, 2026, while factories were running through the autumn, Quaker Houghton quietly rewrote the biggest piece of its debt. It took out a new $550 million senior secured term loan, arranged with JPMorgan Chase as administrative agent, and used it to repay its existing U.S. term loan in full.20 The new loan runs seven years, to October 2033, at the Secured Overnight Financing Rate plus 1.75 percentage points, and amortises by just 0.25% of the original principal each quarter.20 It was a routine transaction for a leveraged industrial company. It also showed how much the merger of 2019 still shapes the company's finances.
That debt began with Houghton. The deal turned a company with almost no borrowings into one with nearly $1 billion of them, and later acquisitions added more.41 Since then, the company has paid down debt when cash was strong and borrowed again when it bought businesses.
At June 30, 2026, total debt was about $876 million and cash about $155 million, leaving net debt of about $721 million.2 That was about 2.3 times trailing adjusted EBITDA, and about 2.1 times on the banks' definition, against a covenant maximum of 4.25 times.2 The headroom is substantial: adjusted EBITDA would have to fall by roughly half before the covenant came into play.
The refinancing pushed out maturities rather than reducing leverage. In April 2026, the company had already extended its euro term loan and revolving credit facility from June 2027 to April 2031 and enlarged the revolver by about $300 million.[^15]9 At June 2026 it reported about $728 million of revolver availability.9
The October loan then moved the biggest single tranche out to 2033. Nothing about these steps reduced the debt. They bought time and options, including the option to finance more acquisitions.
The cost of that debt is mostly floating. At the end of 2025, interest rate swaps with a notional value of $300 million fixed part of the borrowing at about 5% all-in, while the rest floated.1 The company put its credit-facility cost of debt at about 4% in mid-2026.2 If rates rise or earnings fall, interest costs will absorb a larger share of operating profit, and in 2025 operating profit was already too thin to cover the charges below it.
The rating agencies see a company that is solid but not pristine. In April 2025, S&P Global Ratings affirmed its BB- rating with a negative outlook, a warning that a downgrade was possible.1 In September 2026 it rated the company BB- with a stable outlook, removing that threat.21 BB- is three notches below investment grade. It signals a company with predictable business but meaningful leverage and limited cushion for mistakes.
Against that debt, the company has kept paying shareholders. Dividends and buybacks totalled about $76 million in 2025, a year in which free cash flow was about $81 million and the company spent about $164 million on acquisitions.1 In other words, distributions consumed almost all of the year's free cash flow, and the acquisitions were funded with new borrowing. In July 2026, the company announced a new $250 million share-buyback authorisation, repurchased about $24 million of stock in the second quarter and raised its quarterly dividend about 4%.[^3]
Coler framed the priorities clearly. "First and foremost, we want to deploy capital to help the business grow," he said, and he described buybacks as opportunistic: "I wouldn't characterize it as programmatic."[^3] That is a sensible ordering.
A skeptical investor would still ask why a company with net leverage above 2 times, a BB- rating and a return on invested capital of about 6.5% is buying back stock at about 29 times earnings and a free-cash-flow yield of about 3.3%.[^6]9 At that price, each dollar of repurchase buys relatively little current cash flow, while each dollar of debt repaid would reduce interest and risk. The case for buybacks rests on management's belief that earnings will recover sharply.
The largest shareholder adds a different kind of sensitivity. Gulf affiliates own about 3.6 million shares, roughly 21.1% of the company.[^4] That stake has drifted down from about 24.5% at the close of the Houghton deal, so the affiliates' share of the company has fallen over seven years even as they remain by far the largest holder.4[^4] Sanjay Hinduja sits on the board.3
Institutional investors such as BlackRock and Vanguard also hold large positions, about 11.5% and 8.9% respectively on the proxy's most recent reported figures, but they are index-heavy holders rather than a counterweight with a strategic agenda.3 Most of the Gulf stake is encumbered: about 2.1 million shares support a margin loan, and about 1.5 million are linked to prepaid variable share forward contracts, financial arrangements that let a holder raise cash against shares while retaining some exposure.[^4]
The latest Schedule 13D amendment reports no enforcement event.[^4] But if the share price fell sharply, a margin loan could, in principle, force a sale or change of control over a block large enough to swing votes. The signal to watch is any 13D amendment that changes those holdings, pledges or voting arrangements.
Governance votes so far show little shareholder revolt. At the May 2026 annual meeting, about 15.6 million votes supported say-on-pay and about 0.7 million opposed it.12 Director Charlotte Henry received the most opposition, about 0.8 million votes against versus 15.5 million for.12 Those are dissent levels worth noting, not failed proposals. The board has also kept options open: in July 2026, the company filed an automatic shelf registration allowing it to issue securities quickly, though it has not announced an offering.[^28]
There is a small store of value on the other side of the ledger. About $107 million of the balance sheet at the end of 2025 sat in investments, and most of that was not cash but stakes in equity-accounted associated companies, including Houghton Korea, Primex, Nippon and Kelko Panama, inherited partly through the merger.1 These minority holdings employ hundreds of people the company does not consolidate and give it a presence in markets it does not fully own.1 They are worth noting as non-core assets, but they are too small to change the leverage picture.
The contingent liabilities are smaller than their descriptions suggest. In California, the company's AC Products subsidiary has been remediating groundwater contaminated with perchloroethylene under a settlement with the Orange County Water District, and the company believes it has met the conditions to close the remaining treatment system while it continues discussions with regulators.1
In São Paulo, a site is under remediation overseen by the state environmental agency, CETESB, with the company expecting to meet its objectives by June 2027.1 Total accrued environmental obligations were about $3.4 million at the end of 2025.1 These matters are open-ended in timing, but they are small relative to a company with about $1.9 billion of sales.
The balance sheet, then, is financeable but not comfortable. The refinancing removed near-term maturity risk, covenant headroom is wide, and S&P's outlook has improved. But leverage remains meaningful, the debt mostly floats, distributions and acquisitions compete for limited free cash flow, and a large shareholder has pledged most of its stake. Patience is affordable as long as the recovery continues. It would become expensive if the factory cycle turned.
X. Business & Investing Lessons
The first lesson begins with a Fluidcare technician's daily rounds through a customer's plant, testing concentration, checking for bacteria and adjusting the mix before the line notices a problem. That work is the best argument for Quaker Houghton's moat, and the company's silence about how many customers renew is the best argument for caution. A factory consumable becomes a moat only when the service around it is hard to replace. The lesson for investors is to ask for the retention number before paying for the relationship. Management's claim of low-single-digit churn is encouraging; a disclosed, audited retention rate would be proof.
The second lesson comes from the merger's first results, which showed the difference between acquired and organic growth. For founders, the lesson is that scale is a tool, not a result. For investors, it is a reminder to separate acquired growth from organic growth every single time, because acquired growth always arrives on schedule and organic growth never does.
The third lesson is in the year the company lost money despite generating substantial operating cash. That cash generation is a genuine sign of a sturdy underlying business. But EMEA's goodwill write-off recorded the failure of premiums paid years earlier to pay back. Cash can tell a better story than earnings, but it cannot make an impairment disappear.
The fourth lesson belongs to Dipsol. Its first results offered little evidence of its returns. The acquisition price is only the start of the return calculation. The rest of the calculation is written in organic volume, cross-selling and return on invested capital, which is why the most important deal metric is the one reported three years later.
The fifth lesson is about incentives. In 2025, the incentive outcome rewarded new business wins while EBITDA missed its threshold, and shareholders received a GAAP loss. Pay for wins, and you will get wins; pay for returns, and you might get returns. The board's move to weight long-term awards toward return on invested capital is the right direction, because a company that sells to factories must ultimately be judged on what it earns from them.
XI. Epilogue: The Next Four Quarters
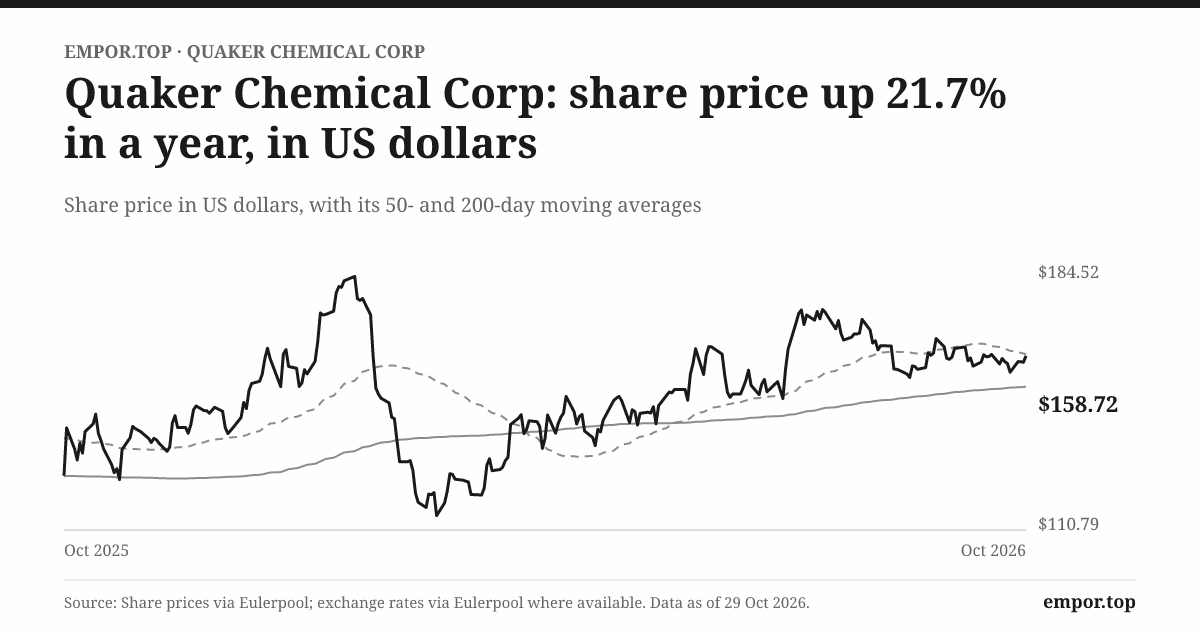
Tonight, October 29, 2026, Quaker Houghton's shares closed at about $159, about 12% below their 52-week high of about $181.[^6] Tomorrow the company reports its third-quarter results.[^6] On December 10 it will hold an Investor Day, where management is expected to lay out its longer-term plan.[^6] Those two events will begin to answer whether the 2026 recovery is a cycle bounce or a turning point.
Three measures will decide it. The first is organic volume excluding acquisitions. It was flat in 2025, rose about 3% in the first quarter of 2026 and about 7% in the second.1[^15]2
Management guided the third quarter to look similar to the second, but it also warned that part of EMEA's growth came from pre-buying and that Asia's double-digit pace might slow.[^3] If organic volume keeps growing 2% to 4% faster than end markets once the comparisons get harder, the share-gain story will be confirmed. If it falls back to flat, the 2025 pattern of wins offset by losses will look like the norm.
The second measure is GAAP operating margin alongside adjusted margin. In the second quarter of 2026, reported operating margin was about 9%, while adjusted EBITDA margin was about 16%.2 The gap between those two numbers is the cost of restructuring, amortisation and other charges that management excludes.
A real recovery will narrow it. Management's target is adjusted EBITDA margin above 18%, and gross margin back above 36% by the end of the year.[^3] If restructuring charges keep recurring, investors should treat them as part of the cost of doing business rather than one-offs.
The third measure is net leverage alongside free cash flow after distributions. June net leverage was about 2.3 times.2 Free cash flow barely covered dividends and buybacks in 2025.
With the new buyback authorisation, the acquisition pipeline management has described and capital spending guided at 2.5% to 3% of sales, the company will need much stronger cash generation to do everything at once.[^3] If leverage drifts higher while buybacks continue, the balance sheet will be carrying the recovery. If leverage falls while the company grows, the recovery is paying for itself.
The share price sets the stakes for all three. At about $3.5 billion, the enterprise value, equity plus net debt, was about 13.5 times trailing EBITDA on October 29.[^6] Measured against the roughly $312 million of adjusted EBITDA the company reported for the twelve months to June, the multiple is closer to 11 times.2 Either way, the price assumes that adjusted earnings are the right base and that the 2025 charges were not the start of a pattern. That is a confident assumption for a stock that, within the past five years, has fallen as much as 64% from a peak.[^6]
Behind those numbers are the strategic questions. Will Dipsol and the smaller acquisitions show up in segment profitability, or will they remain sources of sales without disclosed returns? Will the Americas, the company's largest profit pool, finally convert volume into earnings? And will the Gulf affiliate's pledged stake stay quiet, or will a falling share price turn a financing arrangement into a governance event?
The thesis turns on conversion. New wins must become sustained organic volume. Sales must become restored margins and cash. Acquired technology must earn returns above the cost of financing it. The results tomorrow and the plan in December will show whether management can make all three happen at once, or whether the company will again need to explain why a good quarter did not become a good year.
XII. Outro: The Fluid You Never See
Back on the factory floor, the steel strip is still racing through the rolls, the coolant is still flooding the grinding wheel, and a technician is still checking the sump at the end of the line. None of it is glamorous, and almost all of it is invisible. That is the strange beauty of Quaker Houghton: it sells something that matters most when no one notices it.
Being inside the process can create an advantage, but only customers' repeated choices and the company's returns can prove it. The fluid keeps factories running. Whether it keeps Quaker Houghton's economics running depends on the same thing every factory manager watches: what comes out at the end of the line.
References
-
2025 Annual Report and Form 10-K — Quaker Chemical Corporation, 2026-02-24 ↩↩↩↩↩↩↩↩↩↩↩↩↩↩↩↩↩↩↩↩↩↩↩↩↩↩↩↩↩↩↩↩↩↩↩↩↩↩↩↩↩↩↩↩↩↩↩↩↩↩↩↩↩↩↩↩↩↩↩↩↩↩↩↩↩↩↩↩↩↩↩↩↩↩↩↩↩
-
Q2 2026 Earnings Conference Call Slides — Quaker Houghton, 2026-07-30 ↩↩↩↩↩↩↩↩↩↩↩↩↩↩↩↩
-
2026 Proxy Statement — Quaker Chemical Corporation, 2026-03-31 ↩↩↩↩↩↩↩↩↩↩↩↩↩↩↩↩
-
2019 Form 10-K — Quaker Chemical Corporation, 2020 ↩↩↩↩↩↩↩↩↩↩↩↩↩
-
India's Gulf Oil to buy specialty chemicals company Houghton International — Hydrocarbon Processing, 2012-11-07 ↩↩↩
-
Quaker Houghton combination closing press release (Form 8-K Exhibit 99.1) — Quaker Chemical Corporation, 2019-08-01 ↩↩↩↩↩↩↩↩
-
2019 Fourth Quarter and Full Year Earnings Call Slides — Quaker Houghton, 2020-02-27 ↩↩↩↩
-
Q2 2026 Form 10-Q — Quaker Chemical Corporation, 2026-07-30 ↩↩↩↩↩↩↩
-
Form 8-K: Jeewat Bijlani departure — Quaker Chemical Corporation, 2026-09-04 ↩
-
2026 Annual Meeting Results and Board Changes — Quaker Chemical Corporation, 2026-05-12 ↩↩↩
-
Metalworking Fluids Market Size and Share — Global Market Insights ↩↩
-
FUCHS concludes financial year 2025 with solid results — FUCHS SE, 2026-03-20 ↩
-
October 1, 2026 Term Loan B Refinancing (Form 8-K) — Quaker Chemical Corporation, 2026-10-01 ↩↩
-
Quaker Chemical Corp. Rated BB- With Stable Outlook — S&P Global Ratings, 2026-09-14 ↩
 LinkedIn
 WhatsApp
 Reddit
 Hacker News
 Email
 Kindle
 RSS Feed
 Spotify
 Apple Podcasts
 Amazon Music
 Audible
 YouTube