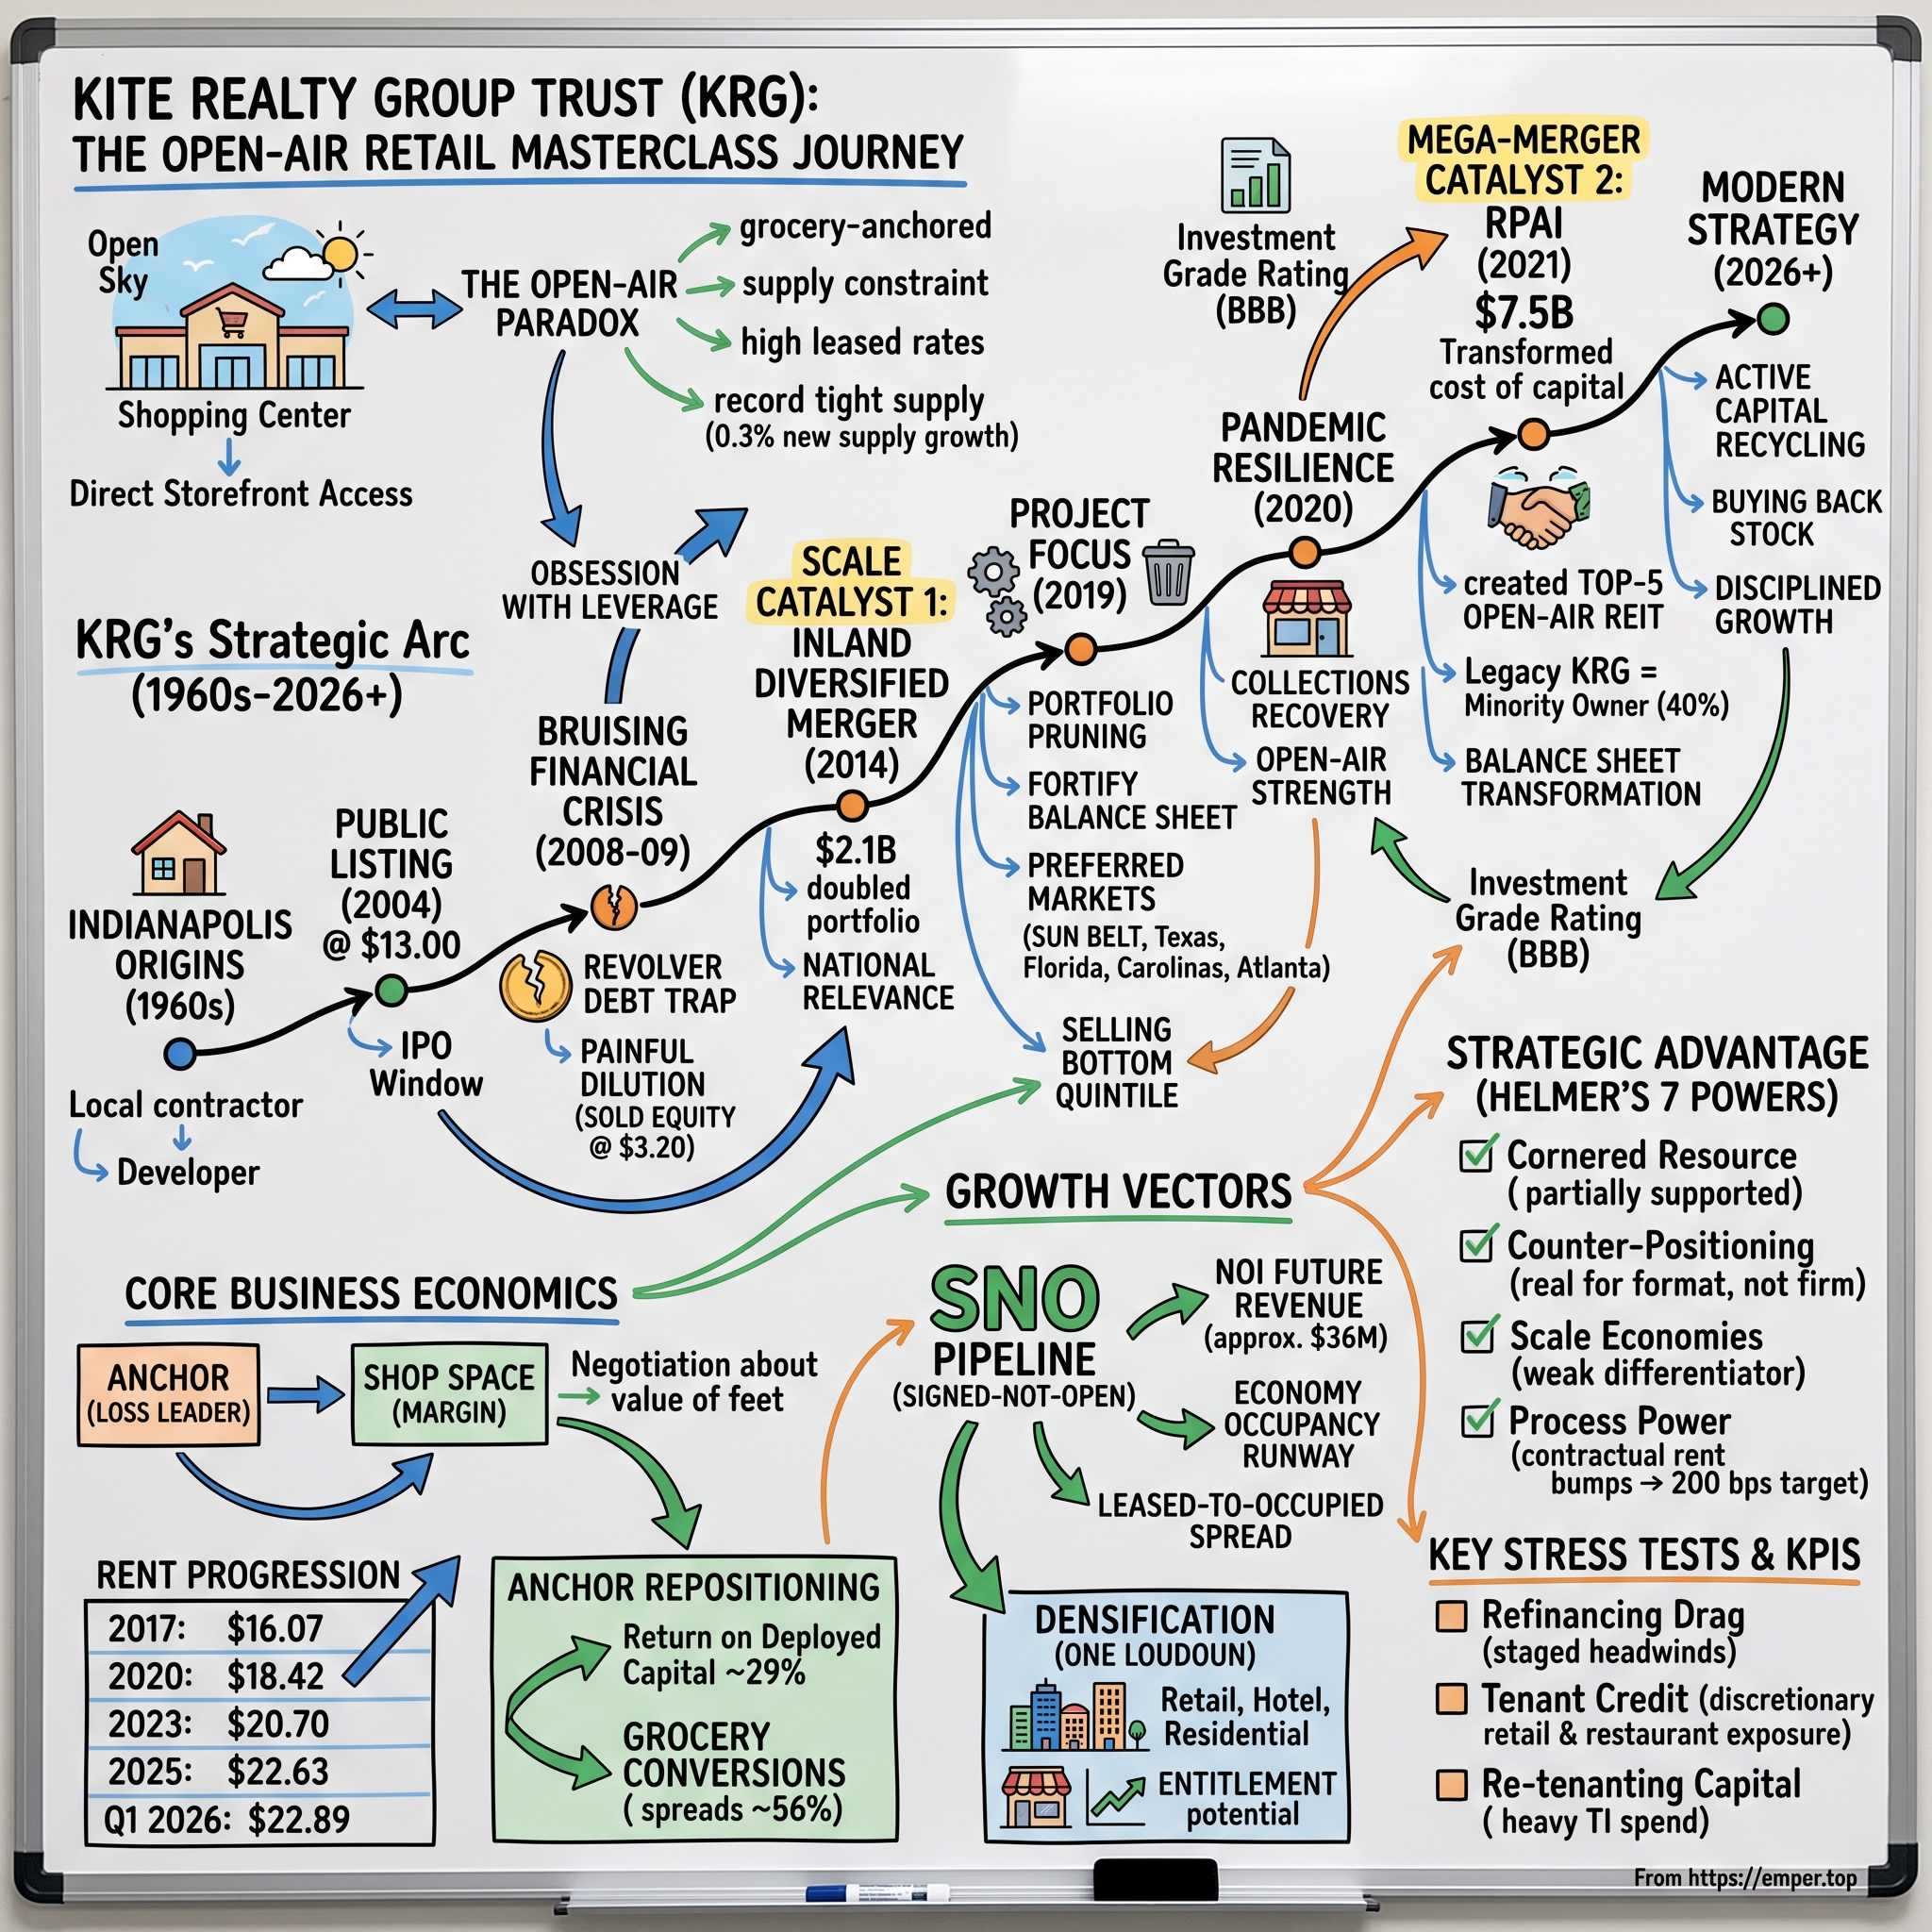
Kite Realty Group Trust: The Open-Air Shopping Center Masterclass
I. Introduction & The Open-Air Retail Paradox
On a Saturday morning at a suburban intersection in Plano, Texas, the parking lot behaves like a piece of infrastructure. A driver pulls into a numbered stall outside a Trader Joe's, walks eleven paces to the door, and is back in the car in fourteen minutes. Two doors down, a contractor collects six sealed bags from a curbside rack. Across the drive aisle, a woman returns a pair of shoes she bought online at a store that never sold them to her in the first place.
Nobody in this parking lot is having an experience. They are executing errands with the efficiency of a well-run distribution node — which, functionally, is exactly what the asphalt rectangle around them has become.
For most of the 2010s, the consensus view held that this asset class was terminal. Enclosed malls were dying, e-commerce was compounding, and every retail landlord was priced as a melting ice cube. What actually happened was stranger. The enclosed mall did suffer. The open-air shopping center — the grocery-anchored corner with surface parking and direct storefront access — quietly became one of the tightest supply-constrained property types in the United States.
According to data compiled by Green Street and open-air REIT filings, new supply growth in the sector ran near 3% annually in the mid-2000s and has been stuck around 0.3% a year since 2022, while sector-wide leased rates climbed to roughly 96% — record highs.1 Retailers spent a decade closing stores. Then they discovered that stores were the cheapest fulfillment, returns, and customer-acquisition assets they owned, and started competing for space that nobody had built in fifteen years.
The company, at a glance
Kite Realty Group Trust is one of the companies sitting on the other side of that trade. As of March 31, 2026, KRG owned 169 operating properties totaling approximately 27 million square feet of owned gross leasable area, with a retail portfolio 94.7% leased at an annualized base rent of $22.89 per square foot.1 Its equity market capitalization was roughly $5.4 billion against an enterprise value of about $8.7 billion in late April 2026, and the shares traded near $29 by late July, putting the market value in the high-$5 billion range.14
It carries investment-grade ratings from all three major agencies — BBB from S&P, Baa2 from Moody's, and BBB from Fitch — and net debt to adjusted EBITDA of 5.2x.1 Sixty-seven percent of its weighted annualized base rent comes from Sun Belt markets, with another 22% drawn from what the company calls strategic gateway markets in Washington D.C., Seattle, and New York.1 That is the shape of the company today. It is emphatically not the shape of the company that went public.
The arc
The core of this story is a two-decade escape act, in which a family-founded Indianapolis developer — a business that began in 1960 and listed on the NYSE in 2004 — used two enormous mergers to avoid the fate of the subscale, over-levered small-cap REIT.1 The first, the $2.1 billion combination with Inland Diversified Real Estate Trust in 2014, roughly doubled the portfolio and bought national relevance.7 The second, the $7.5 billion all-stock merger with Retail Properties of America in 2021, was the transaction that actually changed the company's cost of capital — and, notably, left the pre-merger KRG shareholder base as the minority owner of the combined entity.11
What makes KRG interesting as an investment case in 2026 is not that the open-air thesis is contested. It largely isn't. Institutional capital has re-rated the asset class in the private market, and management has been explicit that it is easier to sell buildings today than to buy them.3 What is contested is whether KRG specifically converts a strong asset class into per-share earnings growth.
The company generated 2.9% same-property NOI growth in 2025 and 3.6% in the first quarter of 2026, yet its 2026 Core FFO guidance midpoint of $2.09 per share implies only modest growth over the $2.06 it earned in 2025.12 Management's own chairman describes the company's public valuation as a persistent discount to both consensus net asset value and to higher-multiple peers, and calls the situation "odd."3 Those two facts — a very good asset class and a stubbornly ordinary earnings trajectory — frame everything that follows.
This piece traces the arc: from the Indianapolis construction business and a bruising financial crisis, through two mergers and a portfolio pruning program that never quite finished, to the current strategy of selling buildings into a hot private market and buying back stock. Then it stress-tests the case — what has to go right, what the numbers reveal about pricing power and capital discipline, and where the story could break.
 Subscribe on LinkedIn
II. Indianapolis Origins & Family Legacy: From Local Developer to Public REIT (1968–2004)
The company that eventually put "Kite" on the New York Stock Exchange did not begin as a landlord. It began as a contractor. Al Kite founded the business in Indianapolis in 1960 as an interior construction operation, and over the following decades it grew into a vertically integrated development, construction, and property management company.51
That lineage matters more than it might appear. A construction company thinks in projects: entitle the land, build the box, lease it, book the fee, move on. A REIT thinks in perpetual cash flow: what does this asset yield in year twelve, and who pays the rent when the anchor goes bankrupt in year nine? Kite Realty spent the better part of its first public decade discovering that these are not the same business, and that the habits of the first are expensive in the second.
The environment Al Kite built into was close to ideal for the contractor-developer model. Suburbanization pushed households outward from city cores through the 1970s and 1980s. Strip centers followed the rooftops. Regional grocers anchored them. A well-connected local developer with a construction arm could compound capital by simply building the next one — and the one after that. By the time the second generation had taken over, the family business was contractor, developer, and owner all at once, operating across commercial, residential, and healthcare property in and around Indiana. The generational handoff and the shift in emphasis from contracting toward long-term ownership belong to the private history of the firm, and the details are not documented in the public record with enough precision to state here.
August 2004: the listing
The public market entry came at the tail end of a REIT IPO window. Kite Realty Group Trust completed its initial public offering in August 2004, selling 16.3 million common shares to the public at $13.00 per share. Underwriters exercised an over-allotment option for an additional two million shares the following month, and net proceeds to the company were approximately $191.3 million.5 The stated purpose was familiar for the era: retire private debt, provide permanent capital, and fund a regional expansion pipeline.
The portfolio it carried onto the exchange was a genuinely mixed bag — a regional footprint weighted toward Indiana and Florida, containing solid grocery-anchored centers alongside unanchored strips, single-tenant assets, and, critically, an active ground-up development pipeline that consumed cash and carried lease-up risk. That last characteristic is what nearly ended the story.
The leverage trap
A REIT with ongoing speculative development is running two businesses at once, and the development business is financed almost entirely with short-term construction debt and a revolving credit facility. When credit markets froze in late 2008, the model inverted. The projects still needed funding. The tenants who had signed letters of intent stopped signing leases. And the revolver became the only source of liquidity precisely when lenders wanted it repaid.
In October 2008, the company issued 4.75 million common shares to pay down borrowings under its revolving line of credit.5 Seven months later, in May 2009, it came back to the market with a far larger and far more painful transaction: 25 million common shares priced at $3.20 apiece, generating roughly $76.6 million of net proceeds, again earmarked for repaying the revolver and other indebtedness.6
Read those two offerings together and you have the entire lesson of KRG's first cycle in a single comparison. The company sold equity twice in seven months, the second time at a fraction of the first price, to service a balance sheet built for a world in which construction loans always roll. The dilution was permanent. The crisis was not. Every strategic decision KRG has made since — the obsession with leverage targets, the willingness to hold liquidity that earns nothing, the refusal to run a large speculative development pipeline — traces back to the arithmetic of raising capital at $3.20 a share.
The change that followed was as much cultural as financial. Management shifted from opportunistic ground-up development toward operating discipline: tenant retention, renewal economics, and balance sheet preservation. That was the right instinct. It was also, on the evidence, insufficient. Even by 2017 — eight years into the recovery, with retail fundamentals stabilized and capital markets wide open — KRG's net debt to adjusted EBITDA still sat at 6.9x.1 The company had stopped digging. It had not climbed out. Getting out would require something it could not generate organically. It would require scale, and scale would have to be bought.
III. The First Scale Catalyst: The Inland Diversified $2.1B Merger (2014)
By 2013, the small-cap REIT was becoming a structurally disadvantaged animal, and the reasons were unglamorous but decisive. A REIT with a $1.5 billion enterprise value pays more for unsecured debt than one with a $6 billion enterprise value, because bond investors price liquidity and index inclusion as much as they price credit. It runs the same corporate overhead — a CFO, a general counsel, an audit fee, an investor relations function — across a much smaller NOI base, so general and administrative expense eats a larger share of cash flow.
And when a national retailer's real estate committee decides where to open forty stores, it takes the call from the landlord who can offer forty sites, not the one who can offer four. Scale in this business is not vanity. It is a direct input into the cost of capital and into the leasing conversation.
The deal
Kite Realty's answer arrived on July 1, 2014, when it completed a merger with Inland Diversified Real Estate Trust valued at approximately $2.1 billion, with each Inland Diversified share converting into 1.707 newly issued KRG common shares.7 The combination produced a portfolio of 133 operating, development, and redevelopment properties totaling roughly 21 million owned square feet across 26 states.7
John Kite's framing at the time was blunt about what he was buying: "This transaction creates a $4 billion company and provides a number of significant financial and operational benefits" — among them increased cash flow and liquidity, a lower cost of capital, a strengthened balance sheet, and deeper tenant relationships.7 Governance moved with the assets. The board expanded to nine members, with three Inland Diversified designees added and two long-serving trustees retiring.78
Strip away the press release language and the deal was a straightforward exchange of ownership for relevance. KRG paid in its own equity — which is to say, existing shareholders accepted a smaller slice of a much larger pie — in exchange for a national footprint, a bigger unsecured debt platform, and the ability to be a counterparty that mattered to TJX or Ross Stores. The implied capitalization rate on the transaction was not disclosed in the closing announcement, and it would be inventing precision to assign one here.
The integration playbook that followed was the one every acquirer describes and few execute at pace: identify the non-core tail immediately, sell it, and use the proceeds to retire the most expensive debt. KRG did pursue that path, exiting slow-growth secondary markets and single-tenant assets over the following years. But the pace was the problem. A merged portfolio of 133 properties across 26 states contains a great deal of tail, and each disposition had to clear an internal hurdle that gets harder as the obvious sales are completed first.
The honest verdict
What can be assessed is the aftermath, and the verdict is mixed. The strategic logic was sound and the operational benefits were real. The company genuinely did move from a Midwest regional owner to a national platform with institutional visibility, and the tenant relationships it acquired became the raw material for the leasing machine that operates today.
But the transaction did not fix the balance sheet, which was the more urgent problem. Three years after closing, leverage still sat near 6.9x, and annualized base rent was $16.07 per square foot in 2017 — respectable for a portfolio of that vintage, but well below the rent levels of the premium open-air owners.1 Nor did the merger produce a re-rating in the equity. KRG had acquired scale. It had acquired scale in a portfolio that still contained a long tail of assets it should not have owned.
This is the recurring pattern in real estate M&A that investors should internalize. Acquiring square footage changes the size of a company immediately. It changes the quality of a company only if management then does the unglamorous second half of the job. Buying is a single decision made in a boardroom. Selling the bottom quintile of a merged portfolio is a hundred separate decisions, each one dilutive to reported earnings in the year it happens, each one requiring management to admit that an asset it once wanted is an asset it no longer wants.
KRG got the first half right in 2014. The second half took the better part of the following decade — and it is arguably still underway.
IV. Portfolio Curation & The Pre-COVID Strategy Shift (2015–2020)
There is a specific moment when a REIT management team stops describing its portfolio in aggregate and starts describing it in tiers. It is usually the moment they have concluded that the aggregate story no longer sells. For Kite Realty, that moment was formalized on February 19, 2019, when the company reported its 2018 results and simultaneously announced a plan to fortify its balance sheet, improve asset quality, and focus on preferred markets — the program that came to be known as Project Focus.9
The plan was specific in a way that made it falsifiable, which is to management's credit. KRG committed to selling $350 million to $500 million of non-core assets and targeted net debt to EBITDA of 5.9x to 6.2x following those dispositions.9 The 2018 baseline against which to judge it was equally clear: full-year FFO of $2.00 per diluted share, same-property NOI growth of 1.4%, a leased rate of 94.6% against an occupied rate of 92.4%, annualized base rent of $16.84 per square foot, and leverage that had ground down from 6.9x to 6.65x over the year.9 The quarterly dividend at that point was $0.3175 per share.9
The disposition list expressed a recognition of structural divergence inside the asset class. Not all open-air retail is the same asset. A dominant grocery-anchored center at a first-ring suburban intersection — 110,000 people inside three miles, household incomes well above the national average — is a scarce and effectively irreplaceable piece of real estate. An unanchored strip on a secondary road in a stagnant market is a wasting one. For most of the prior decade, the public market had valued the two as though they belonged to the same category. Project Focus was the decision to stop owning the second kind, and to tilt capital toward the high-growth migration corridors of Texas, Florida, the Carolinas, and Atlanta.
Myth versus reality: the retail apocalypse
The consensus narrative of 2017 through 2019 held that Amazon's acquisition of Whole Foods had marked physical retail for death, and that landlords were collecting rent from tenants living on borrowed time. The reality that emerged was more specific and more useful. E-commerce did not kill the store. It killed the undifferentiated store and the oversupplied market.
What actually protected open-air centers was not a clever counter-thesis about buy-online-pickup-in-store, and it was not landlord ingenuity. It was the supply side. Development of new open-air retail effectively stopped after the financial crisis and never restarted, running below 1% annual supply growth every year from 2010 onward and below 0.5% for most of the last decade.1
A landlord does not need a brilliant narrative when nobody is building competing product. The correct read on the "retail apocalypse" era, in hindsight, is that the market conflated a demand story with a supply story, and mispriced an entire asset class for roughly five years as a result. That is a useful pattern to carry into other industries: when a consensus collapse fails to materialize, check whether the rescue came from demand recovering or from supply having quietly stopped.
What Project Focus did not accomplish
The more instructive fact about this period is what the plan failed to deliver. The company entered 2020 with net debt to adjusted EBITDA of 6.8x on a pro forma basis — essentially where it had been in 2017, and well outside the 5.9x to 6.2x post-disposition target the plan had contemplated.101
The arithmetic explains why. Selling assets and paying down debt reduces both the numerator and the denominator of a leverage ratio. If the disposed assets carry NOI, the ratio barely moves. This is the trap in every "sell assets to deleverage" plan, and it is worth holding in mind when evaluating the disposition program KRG is running today.
Then came the pandemic, which tested every claim the sector had made about resilience. KRG's 2020 was ugly by any measure. Same-property NOI declined 6.6%. FFO fell to $1.26 per diluted share. The retail leased rate dropped 490 basis points to 91.2%, with the Stein Mart bankruptcy alone accounting for 250 basis points of that decline.10
The dividend told the story most plainly. Declared at $0.3175 per quarter in early 2019, distributions totaled just $0.4495 across all of 2020 — a reduction of roughly two-thirds versus the prior run rate — before being reset at $0.17 per share for the first quarter of 2021.910 Management's own consolation was that KRG "was one of the few open-air peers to continuously pay a dividend."10 That is a modest claim, and an honest one. By the fourth quarter, collections had recovered to approximately 95% of base rent and recoveries, with less than 1% deferred.10
The tenant mix upgrade that management had been pursuing since 2015 was, in a sense, validated and accelerated by the failures. Vulnerable apparel and department-store formats vacated space; high-frequency grocers and off-price operators took it. That churn was painful in the reported numbers and beneficial in the underlying portfolio — a distinction that recurs throughout KRG's history, and one that makes any single year's occupancy figure a poor guide to the direction of the business.
That recovery in collections was the single most important data point the sector produced in 2020, and it set up everything that followed. Open-air centers turned out to be operationally survivable in a pandemic in a way enclosed malls were not: tenants had their own doors, their own HVAC, and their own curb. Capital noticed. And a company with a battered balance sheet, a recovering portfolio, and an equity currency that had begun to heal was about to be handed the most consequential opportunity in its history.
V. The Transformational $7.5B RPAI Mega-Merger (2021)
The summer of 2021 was a peculiar window in commercial real estate. Vaccination had restarted foot traffic. Open-air rent collections had normalized. Public REIT equity had recovered enough to be usable as currency. But private transaction markets had not yet fully repriced, and cap rates on open-air assets still carried a discount born of the apocalypse narrative. For an acquirer who believed the discount was wrong, it was a narrow and closing window.
Retail Properties of America was the logical partner. RPAI owned a complementary set of premier Sun Belt and gateway open-air and mixed-use assets, including several large lifestyle properties, but had never achieved the balance sheet scale that would let it finance them cheaply.
On July 19, 2021, the two companies announced a $7.5 billion strategic merger. It closed on October 22, 2021, with each RPAI common share converting into 0.623 newly issued KRG common shares plus cash in lieu of fractional shares — a ratio representing a 13% premium to RPAI's closing price on July 16, 2021.1112 The combined operating portfolio comprised 185 open-air shopping centers and mixed-use assets with over 30 million square feet of owned gross leasable area, positioned as a top-five open-air, grocery-anchored shopping center REIT by enterprise value.11
The detail most investors skip
On closing, legacy KRG shareholders were expected to own approximately 40% of the combined company's equity, with former RPAI stockholders holding roughly 60%.12 Read that again. In substance, the smaller company's management team took operating control of a larger asset base. John Kite remained chairman and chief executive of the combined entity.11
That is an unusual outcome and a meaningful governance fact. It says the RPAI board concluded the KRG platform was worth more than the KRG portfolio. It also means that the operating record since 2021 is the record of a management team running assets it did not originate — which cuts both ways in any assessment of execution.
What the merger delivered
The closing announcement did not put a headline synergy figure on the table. It emphasized structural benefits instead: immediate FFO and NAV accretion, optimized NOI margins, leasing of pandemic-related vacancy, a lower cost of capital, and completion of select developments.11 Those are softer claims than a dollar synergy number, and they are harder to audit. But the cost-of-capital claim, at least, has since been validated by third parties.
Moody's upgraded KRG to Baa2 from Baa3 in February 2024, citing the diversified open-air portfolio, resilient cash flows from grocery-anchored centers, moderate leverage, strong fixed charge coverage, and sound liquidity, and describing the company's capital strategy as prudent with modest total leverage and low secured leverage.15 The company now carries BBB-equivalent ratings from all three agencies.1 Leverage followed the same path. It had been 6.0x in 2020. It fell to 5.2x in 2022, 5.1x in 2023, and reached 4.7x by 2024.1 That is the balance sheet transformation the 2014 deal failed to produce, and it is the clearest evidence that this merger worked on the dimension management said it would.
What the merger cost, and why it took five years to see
The cost was subtler, and it hid inside the accounting. Merger accounting requires an acquirer to mark the target's leases and debt to market. Those marks then amortize through the income statement as non-cash items — straight-line rent adjustments, lease intangible amortization, debt mark amortization. As they burn off, reported earnings absorb a mechanical drag that has nothing to do with operations.
On the fourth-quarter 2025 call, CFO Heath Fear quantified it directly: the burn-off of non-cash items stemming from the 2021 merger amounted to roughly $0.135 per share cumulatively over the preceding three years. He pointed to a telling piece of evidence that the process is finally complete — 2026 is the first year in which the company's NAREIT FFO and Core FFO guidance ranges sit exactly on top of each other, at $2.06 to $2.12.131
In plain English: for three years, a meaningful slice of KRG's reported earnings growth was consumed by an accounting artifact of the deal that created the company. Investors comparing KRG's FFO growth to peers over 2022 to 2025 without adjusting for that headwind were reading a distorted number — and the distortion cuts both ways. Reported results understated the underlying operating trajectory. But the disappearance of that drag is not operating improvement either, and 2026 earnings that benefit from its absence should not be credited to the leasing team.
The post-merger discipline was real but slower than a triumphant integration narrative would suggest. Capital recycling out of overlapping and lower-growth legacy assets continued for years rather than months. By management's own framing, the heavy lifting of portfolio composition did not happen until 2025 — four years after closing.
The clearest illustration is the property count itself. The combined company opened its life with 185 operating centers and over 30 million square feet.11 Today it holds 169 properties and roughly 27 million square feet.1 Four and a half years of ownership produced a company measurably smaller than the one the merger created, with materially higher rents. That is the deliberate trade at the heart of the modern KRG: fewer buildings, better buildings, and a bet that the market eventually pays for quality rather than square footage.
Which brings the story to the machine itself: what a Kite Realty shopping center actually earns, and why.
VI. Core Business Deep Dive: Economics, Operations & Footprint
Walk a Kite Realty center with a leasing director and you will hear the portfolio described in a vocabulary that has nothing to do with square footage. There is the anchor — the grocer or the discounter that fills the parking lot. And there are the shops: the small suites flanking the entrance where a nail salon, a chicken concept, an orthodontist, and a boutique fitness studio pay two to three times as much rent per foot for the privilege of standing next to the traffic the anchor generates. The anchor is the loss leader. The shops are the margin. Everything in this business is a negotiation about who captures the value of the footsteps.
The comparison group is short: Kimco Realty, Regency Centers, Federal Realty, Brixmor Property Group, Phillips Edison, and Acadia Realty.1 KRG is the smallest of the large open-air platforms by enterprise value, at roughly $8.7 billion.1 That ranking matters for the "scale economies" claim that appears in every sector deck. KRG has enough scale to be a serious counterparty to national retailers. It is not the scale leader, and any argument that its platform confers a structural cost advantage over Kimco or Regency runs into an inconvenient size comparison.
The rent progression, and what it actually proves
Annualized base rent per square foot is the cleanest single measure of portfolio quality in this sector, and KRG's has compounded steadily. It was $16.07 in 2017, $18.42 in 2020, $19.36 in 2021, $20.70 in 2023, $22.63 in 2025, and $22.89 as of March 31, 2026 — a 6.5% year-over-year gain in the most recent quarter.1
Here is the analytical caution. Roughly half that improvement is genuine mark-to-market on existing space. The other half is composition: KRG has been selling low-rent assets and buying or building high-rent ones. Both are legitimate value creation, but only the first is evidence of pricing power.
The distinction is visible in rent by format. Power centers in the portfolio carry ABR of $16.87 per square foot. Regional community centers carry $19.15. Neighborhood centers carry $22.34. Lifestyle and mixed-use assets carry $41.26.1 Shifting the mix mechanically raises the portfolio average without a single tenant paying a dollar more.
And the mix has shifted substantially. Between the fourth quarter of 2022 and the first quarter of 2026, power centers fell from 19% to 14% of weighted ABR, lifestyle and mixed-use rose from 22% to 27%, neighborhood centers rose from 36% to 39%, and regional community centers slipped from 21% to 19%.1 On the first-quarter 2026 call, John Kite said the company would like to push power-center exposure lower still, into the low teens, while emphasizing that the target is not a fixed allocation but a higher embedded growth rate and better real estate.3
Leasing spreads, and where landlord power stops
In the first quarter of 2026, KRG executed 151 new and renewal leases covering over 700,000 square feet at blended cash leasing spreads of 13.5%, including 31.3% on new leases and 12.3% on non-option renewals.3 Full-year 2025 blended spreads were 13.8%.2 Those are strong numbers, and they are the most direct evidence available that the supply scarcity thesis is real at the asset level. A landlord who can re-lease space at a 31% premium to the departing tenant's rent is not competing with new construction.
But the fourth-quarter 2025 disclosure contains the number that tells the other half of the story. Option renewals — leases where the tenant holds a contractual right to extend at a pre-agreed rent — were signed at spreads of just 6.2%, against 21.8% on new leases and 14.5% on non-option renewals.2
Tenant options are the ceiling on a landlord's pricing power, and a substantial share of comparable lease activity runs through them. This is why management has been explicit about trying to reduce the number of fixed options in new anchor leases. The negotiating leverage of the last three years is only worth what gets written into the documents, and documents signed a decade ago cannot be renegotiated now.13
The single best activity in the business
Between 2024 and the first quarter of 2026, KRG executed 54 anchor leases covering 1,259,000 square feet. It spent $85 per square foot on tenant improvements, landlord work, and lease commissions — $108 million of capital in total. Previous tenants at those spaces paid ABR of $15.01. New tenants pay $19.33, a 29% cash lease spread, at an estimated 29% return on the capital deployed, generating roughly $32 million of new NOI. Ninety-one percent of the incoming tenants were national credits, spread across 30 brands.1
A 29% return on deployed capital is exceptional for any real estate activity. It is the strongest single piece of evidence in favor of the KRG story, and it explains why management keeps steering conversations back to anchor repositioning.
It also explains something about the shape of the opportunity. Twenty-two anchor spaces representing roughly 622,000 square feet remained available to lease as of the first quarter of 2026.1 That inventory is simultaneously the vacancy that depresses KRG's occupancy statistics relative to peers and the raw material for the highest-return activity the company performs. Whether it reads as a problem or an asset depends entirely on whether the 29% returns hold as the remaining boxes get harder — and the remaining boxes are, almost by definition, the ones that were harder to lease in the first place.
The grocery conversions are the same trade in concentrated form. From 2022 through the first quarter of 2026, the company added 212,000 square feet of grocer space at average new leasing spreads of 56% and average gross returns on capital of 20%.1 The specific swaps read like a map of the last retail cycle: Lidl into a former Michaels; Grocery Outlet into a former Bed Bath & Beyond; Trader Joe's into a former Rite Aid and a former buybuy Baby; Whole Foods into a former Big Lots and a former Stein Mart.1 Every one of those transactions converted a discretionary or distressed tenant into a weekly-frequency traffic generator.
As COO Tom McGowan explained on the first-quarter call, the second-order effect matters as much as the rent. A new Trader Joe's or Whole Foods materially improves what the leasing team can sign in adjacent shop space, drives sales for existing tenants, and compresses the capitalization rate a buyer will apply to the whole center — an effect he estimated could be worth two to three times the direct return on the box itself.3 That claim is management's, not an audited figure. But the direction is corroborated by the merchandising outcome: the average rent on newly signed leases now runs well above the portfolio average, which is what you would expect if the anchor upgrades are working.
Read the footnote on "grocery-anchored"
KRG discloses that 79% of retail weighted ABR comes from assets with a grocery component. The disclosure's own definition includes centers anchored by a big-box wine and spirits store, not only by a supermarket.1 That is a defensible definition. It is not the definition most investors assume when they hear "grocery-anchored," and it is worth holding in mind when comparing KRG's grocery exposure to peers using stricter criteria. Sector marketing language is not a standardized accounting term.
Tenant and category concentration
KRG's top 15 tenants account for 18.8% of weighted ABR. TJX Companies leads at 2.6% across 49 stores, followed by Ross Stores at 1.9%, PetSmart at 1.6%, Best Buy at 1.5%, Dick's Sporting Goods at 1.4%, and Publix at 1.3%. Gap, Michaels, Kroger, Lowe's, and BJ's Wholesale Club each sit at roughly 1.0%.1
That is a genuinely diversified rent roll. No single bankruptcy is existential — a useful contrast with the mall REITs of the 2010s, where one department store failure could impair a dozen centers at once. But the category breakdown complicates the "necessity-based" framing that pervades sector marketing.
Discretionary retail accounts for 46% of total weighted ABR — discount retailers at 11%, beauty and cosmetics at 8%, full-line apparel at 6%, home furnishings at 5%, fitness at 4%. Necessity-based categories account for 27%. Restaurants account for 19%. Office accounts for the remaining 8%.1
Nearly half the rent roll depends on discretionary consumer spending, and a fifth depends on people eating out. That is not a defect. Discretionary and food are where the rent growth is, and where the small-shop economics live. It is simply a materially different risk profile than the grocery-anchored label implies, and it is the reason a consumer recession would be felt here.
Geography is a Texas story
Texas alone represents 28% of total weighted ABR, with Dallas/Fort Worth accounting for 21% of the portfolio on its own. Florida is 11%. Indiana and Virginia are 7% each, Maryland 6%. Washington D.C./Baltimore contributes 11% of ABR, New York 6%, and Seattle and Las Vegas 5% each. Seventy-two percent of ABR sits in the fifteen fastest-growing states by population, and the average three-mile trade area contains 110,000 people with average household income of $153,000.1
The demographics are excellent, and they are the substantive content behind the Sun Belt label. The Dallas concentration is a real single-market exposure that the Sun Belt framing tends to obscure. One in five rent dollars comes from a single metropolitan area — one that has been an extraordinary beneficiary of corporate relocation, but that is nonetheless one regional economy.
The company's own risk disclosures flag both the geographic concentration in Texas, Florida, and North Carolina and the specific problem of insurance costs and coverage in Florida and Texas coastal areas.1 That second item is not a boilerplate risk factor. It is a live operating cost issue for every Sun Belt landlord.
Occupancy, and the number management would rather you look past
The retail portfolio was 94.7% leased at March 31, 2026 — 96.2% for anchors and 91.9% for shops, up 110 and 60 basis points year over year respectively.1 But leased is not the same as paying. Economic occupancy in the same-property pool was 91.1% at quarter end, versus 91.8% a year earlier.1 That is a decline, and it appears in the reconciliation tables rather than the highlights page.
The gap between leased and occupied — 350 basis points — is simultaneously the largest embedded opportunity in the portfolio and the clearest evidence that KRG's operating recovery has lagged its peers. On the first-quarter call, a Wells Fargo analyst noted that KRG's economic occupancy sits roughly 260 basis points below its own historical highs while many peers are at or above theirs. Fear's response was candid about the framing: "we've got the most occupancy run left."3 That is a bull argument and a bear argument in the same sentence, and which one it turns out to be depends entirely on the mechanism described next.
VII. Future Growth Vectors & Hidden Value: SNO Pipeline & Mixed-Use Densification
There is a line item in every shopping center REIT's supplemental disclosure that functions like a receipt for future earnings. It is called the signed-not-open pipeline, and it captures leases where the tenant has signed a binding contract but has not yet opened for business or started paying rent. The space is dark. The lease is executed. The rent is contractual. Somewhere in between sits a construction crew, a permit application, and a municipal plan reviewer.
How big, and how real
KRG's SNO pipeline stood at approximately $36.0 million of NOI as of March 31, 2026, corresponding to the 350 basis point leased-to-occupied spread. Fifty-one percent comes from anchor tenants and 49% from shop tenants. Eighty-four percent sits inside the same-property NOI pool. Roughly 59% is expected to come online during 2026.1
The commencement schedule shows cumulative commenced-plus-projected NOI reaching about $15.8 million by the fourth quarter of 2026, $21.1 million by the first quarter of 2027, and $34.9 million by the first half of 2028.1 Against annualized adjusted EBITDA of roughly $566 million, that pipeline represents something in the range of 6% of run-rate earnings power, arriving over roughly two years.1
The quality signal inside the pipeline is arguably better than the quantity. The average annualized base rent on SNO leases is $28 per square foot, against a portfolio average of $22.89.31 Tenants signing today are paying materially more than the portfolio average — exactly what you would expect if both the mark-to-market opportunity and the merchandising upgrade are genuine.
The offsets nobody puts on the highlight slide
Signed-not-open NOI is not free money, and management has been unusually direct about why. First, timing is largely outside their control. Asked on the first-quarter call whether the schedule could be accelerated, John Kite explained that much of the space was former anchor box, where the gap between lease signing and rent commencement typically runs 15 to 18 months. He added that municipalities in multiple markets continue to slow permitting "despite the narrative that that's changed."3
McGowan described the countermeasures — permit expediters, starting architectural drawings straight out of real estate committee, consolidating multiple permits to avoid sequential delays. That is a candid admission that the constraint is real and that the company is managing it rather than solving it.313
Second, and more materially, the pipeline is being purchased. KRG is spending "a little over $100 million a year" on internal lease-up capital, a level Kite expects to persist for roughly another two and a half years before moderating.3 The $85 per square foot of anchor capital is that same money viewed at the deal level.1 An investor modeling $36 million of incremental NOI without modeling the capital that produces it is modeling half the transaction.
Densification: real optionality, honestly sized
The most tangible expression of the land-value story is One Loudoun in Ashburn, Virginia, in the Washington D.C. metro. The current expansion adds 86,000 square feet of retail, 33,000 square feet of amenitized office, 169 full-service hotel rooms, and 429 luxury multifamily units to an existing mixed-use asset. As of the fourth-quarter 2025 call, the retail portion was 65% leased to Arhaus, Williams-Sonoma, Pottery Barn, Tatte, and Alo Yoga.13
As it stands today, One Loudoun generates 4.0% of annualized portfolio NOI from 1.3% of total retail square footage, at retail ABR of $38.53 per square foot, and drew 4.7 million visitors in 2025.1 Beyond the current expansion, the site carries another 35 acres, roughly 1,100 additional multifamily units, and 1.7 million square feet of commercial entitlement potential.3
The proportionality check matters, and the company's own numbers support a sober reading. KRG's three "needle-mover" lifestyle assets — Southlake Town Square, One Loudoun, and Legacy West — together produce 14.3% of annualized portfolio NOI from just 5.3% of retail square footage, at a blended retail ABR of $50.07 and embedded escalators of 240 basis points against 182 for the portfolio.1
They are disproportionately valuable. They are also a minority of the business, and the residential and hotel components that make densification interesting are years from meaningful cash flow. The two large land parcels the company has been trying to monetize illustrate the timeline problem precisely: the Ontario, California entitlement process will run into 2027 by management's own account, and the Carillon land sale remains pending. Neither generates NOI in the meantime, and Kite's own framing was that the company would rather maximize value than rush.13 Densification is real optionality. It is not a near-term earnings driver, and any model that treats it as one is front-running a decade.
Inflation protection, written into the leases
This is where KRG's operating story is most concrete and most measurable. In the first quarter of 2026, 86% of new and non-option renewal leases by count carried fixed rent bumps of 3% or greater, up from 68% in 2022. On small shop leases specifically, 90% carried bumps of at least 3%, 70% at least 3.5%, and 63% at least 4% — against just 3% of small-shop leases at the 4% level in 2022.1 Average ABR growth written into new leases and non-option renewals reached 3.2% overall in the quarter, with shops at 3.4% and anchors at 2.1%.1
That transformation in four years is the clearest evidence in the entire disclosure package that the leasing organization is converting market conditions into contractual terms rather than just into headline spreads.
Ninety-six percent of leases now carry fixed CAM.1 The term deserves unpacking, because it cuts both ways and is usually presented as an unambiguous positive. Under a traditional lease, tenants reimburse the landlord for their pro-rata share of actual common area maintenance costs — snow removal, parking lot repairs, landscaping, insurance. The landlord is fully protected against cost inflation, but spends enormous administrative energy on reconciliations and tenant audits. Under fixed CAM, the tenant instead pays a set fee that escalates on a schedule. The landlord captures any surplus if costs run below the escalator, and eats the difference if they run above.
Given where insurance costs have gone in Florida and Texas, that is a genuine risk transfer to the landlord, not a pure win. It buys margin predictability and administrative simplicity at the price of absorbing cost shocks. It is also one reason net recoveries can swing quarterly results, as they did in the first quarter of 2026, when a real estate tax reserve reversal contributed to the same-property NOI beat alongside lower bad debt and higher overage rent.3
VIII. Management, Capital Allocation & Financial Health
Every management team says it is disciplined about capital allocation. The useful question is what they did when the market handed them an obvious and uncomfortable trade. In 2025, Kite Realty was handed one.
The people
John A. Kite has been chairman and chief executive through both transformational mergers — running the company in 2014 and running it today.73 Thomas K. McGowan has been president and chief operating officer across the same span, and remains the operational voice on earnings calls, fielding the granular questions on permitting, rent commencement dates, and merchandising strategy.73
Heath R. Fear joined the company in 2018 and was promoted from executive vice president and chief financial officer to president and chief financial officer on March 20, 2026, adding responsibility for investment strategy and joint venture relationships alongside finance. Kite's stated rationale was that Fear "has played a critical role in shaping our strategy, strengthening our balance sheet, and driving disciplined capital allocation." McGowan continues in his role.16
The resulting structure — two executives titled president, both reporting to the chairman-CEO — is unusual, and it is the kind of thing a governance-minded investor should notice rather than wave through. It can be read benignly, as the broadening of a valued executive's remit and a reward for a decade of balance sheet work. It can also be read as an ambiguous succession signal at a company where the founder's family name is on the door and the CEO has held the seat for the entire public history of the business. Nothing in the disclosure resolves the question.
On compensation, proxy disclosures filed with the SEC show Kite's total compensation at approximately $7.9 million in 2025 against $6.9 million in 2024, with Fear at roughly $3.0 million and McGowan at $3.1 million in 2025.5 That is not an outlier for a REIT of this size. The gap between the CEO and the next tier is wide but not extreme, and the year-over-year increase tracked a year in which the company executed a large transaction program.
The 2025 trade
Here is what management actually did. Over the course of 2025, KRG sold 13 properties and two land parcels for approximately $621.7 million. The pool was composed primarily of larger-format assets with embedded rent escalators significantly below the portfolio average, and the sales allowed the company to shed 21 watch-list anchor boxes totaling roughly 578,000 square feet.213
It entered two joint ventures with the Singaporean sovereign wealth fund GIC totaling approximately $1.0 billion of gross asset value.2 The first acquired Legacy West in the Dallas/Fort Worth market for $785 million — $408 million at KRG's share — assuming a $304 million mortgage at a 3.8% coupon, with KRG holding a 52% interest and serving as operating member.14 The second was seeded by contributing three larger-format centers totaling roughly 921,000 square feet in Port St. Lucie, Denton, and Frisco, generating $112.1 million of gross proceeds while retaining a 52% interest.14
And it used a portion of the proceeds to repurchase $300 million of stock — 13.0 million shares at an average price of $23.00 — with cumulative repurchases reaching 16.9 million shares for $400 million at an average of $23.67 by the end of the first quarter of 2026.23
The joint venture structure deserves its own scrutiny, because it introduces complexity that a simpler company would not carry. Holding 52% of an asset while operating 100% of it earns KRG fees and control with less capital at risk, and it brings a sophisticated institutional partner into the underwriting. It also means the reported portfolio now contains assets in which shareholders own barely half the economics, and $203.3 million of unconsolidated joint venture debt sits outside the consolidated balance sheet while still counting toward the company's stated leverage calculation.1 That last detail is to KRG's credit — many REITs would exclude it. But joint venture accounting is the classic place where real estate complexity accumulates quietly, and an investor should expect the disclosure burden to grow if the GIC partnership expands.
The logic, and the critique
The logic is a straightforward yield arbitrage, and management describes it as such. KRG has been selling lower-growth assets in the private market at yields around 7%, buying its own stock at a Core FFO yield of roughly 9% at the time of purchase, and targeting replacement acquisitions at 8% to 9% unlevered internal rates of return.133 Kite's framing on the fourth-quarter call was pointed: "a lot of people talk about things that they might do or want to do, and they complain about where their stock price is and where assets trade, but yet they don't really act on it."13 The result is visible in the share count, with weighted average diluted shares falling from 219.8 million in the first quarter of 2025 to 205.8 million a year later — a reduction of roughly 6%.1
An activist would make the counter-argument in one line: this is shrink-to-grow. Selling income-producing assets to retire equity raises per-share metrics while making the company smaller, and it works only while the discount to private-market value persists.
Citi's Craig Mailman put a version of this to management on the fourth-quarter call, arguing that KRG runs too little leverage relative to private competitors, that buybacks show diminishing returns, and that the company might be better served by driving earnings growth than by setting up net asset value for the long run. Kite's answer was a defense of the low-leverage posture on cycle grounds — "we've been around a long time. We've seen a lot of different cycles and running a business lower leverage is a smart thing to do."13
Fear offered the more analytically useful response: the reason KRG underperformed on growth was credit losses and watch-list exposure, so the current exercise is addressing "the fundamental building blocks of growth" by de-risking cash flow and improving embedded bumps.13 That is a coherent answer. It is also, by construction, an answer that defers the payoff by several years — and it asks shareholders to accept a smaller company today in exchange for a better one later.
The balance sheet, honestly read
Net debt plus preferred to adjusted EBITDA was 5.2x at March 31, 2026 — inside management's stated long-term target range of low-to-mid 5x, and near the middle of a peer group running from about 5.1x at Phillips Edison and Regency to 5.8x at Federal Realty.1 Worth noting: leverage has risen from the 4.7x low point in 2024 and the 4.9x at year-end 2025, precisely because the company has been buying back stock.1 That is a deliberate choice, not a deterioration, but it does mean the "fortress balance sheet" is being spent down toward the target rather than held below it.
The debt itself is well constructed: a 4.33% weighted average interest rate, 84% fixed-rate, 89% of NOI unencumbered, a 4.1x debt service coverage ratio, and $1.1 billion of available liquidity.1
The maturity ladder contains the single most important number in the bear case. KRG has roughly $400 million maturing in 2026 at a 4.02% weighted average rate, and approximately $282 million in 2027 at a weighted average rate of 2.25%.1 That 2027 tranche is a relic of the zero-rate era. Refinancing it at prevailing investment-grade REIT spreads implies a coupon step-up of several hundred basis points on that slice of the capital stack, and the incremental interest expense has to be absorbed before a single dollar of NOI growth reaches FFO.
Management has guided to net interest expense of $121.2 million at the 2026 midpoint.1 The 2028 through 2030 maturities carry rates between 3.95% and 4.61%, so the refinancing drag is a multi-year, staged headwind rather than a cliff.1 It is nonetheless a headwind that runs directly against the SNO tailwind, and the two should be modeled together rather than separately.
The dividend, and the special-dividend mechanic
KRG declared a first-quarter 2026 dividend of $0.29 per share, a 7.4% year-over-year increase, and paid a special dividend of $0.145 per share in January 2026.2 Against a Core FFO guidance midpoint of $2.09, the regular payout ratio sits comfortably below 60%, leaving substantial retained cash flow to fund redevelopment without issuing equity.1 For a REIT, that retained cash is genuine strategic capacity — the difference between funding a lease-up program internally and going to the market for it.
But investors should understand what the special dividend actually was. It was not a signal of surplus prosperity. It was a REIT tax mechanic. Selling appreciated assets creates taxable gains that must be distributed unless sheltered, which is why the company pairs dispositions with 1031 exchange acquisitions and harvests losses on other sales to offset gains. Fear stated plainly on the first-quarter call that if the planned $170 million of 1031 acquisitions or the $145 million of non-core sales do not complete, the result could be another special dividend in 2026.3
Capital allocation at KRG is, at this moment, as much a tax-management exercise as a real estate one. Fear called the acquisitions and dispositions "different sides of the same coin" — buying to shelter gains, selling to harvest losses, and improving portfolio quality as a by-product of both.13 That is sophisticated. It also means some transaction activity is being driven by tax timing rather than by underwriting conviction, which is a distinction worth tracking.
Guidance behavior and narrative consistency
This is where the management assessment turns genuinely favorable. KRG's full-year 2025 same-property NOI result of 2.9% came in 115 basis points above its original guidance, and over the four years through 2025 same-property NOI growth averaged 4%.13 The stated philosophy — "we only put into guidance things that we have visibility on" — is borne out by the pattern.13
More tellingly, when the first quarter of 2026 beat expectations and management raised the same-property NOI range by 25 basis points at the midpoint, it declined to raise FFO guidance. Fear explained that the same-store upside of half a cent was offset by a corresponding reduction in "recurring but unpredictable" items pushed into 2027, and that the company was holding its bad debt assumption at 100 basis points for the remaining three quarters despite a 75 basis point actual result in the first.31 Bank of America's Samir Khanal pushed on exactly that gap, and the answer was specific rather than evasive.
Two caveats keep this from being an unqualified endorsement. First, consistently guiding conservatively and beating is a defensible practice, but it makes the guidance itself a weaker signal of management's true expectations — investors are effectively asked to apply their own upward adjustment. Second, the promises have not always landed: the 2019 commitment to reach 5.9x to 6.2x leverage after dispositions was not met before the pandemic intervened, and it took a transformational merger rather than the disposition plan itself to fix the balance sheet.910
One accounting note belongs here. KRG recorded $5.9 million of impairment charges in the first quarter of 2026, and its 2026 guidance embeds $0.03 per share of impairments.1 Impairments are a judgment call, and a company running an active disposition program will generate them as carrying values meet market bids. They are not a red flag in isolation. They are a line item to watch as the recycling program continues, because a rising impairment run-rate would suggest the assets being sold are worth less than the balance sheet implied — which would complicate the "selling inside our implied cap rate" narrative.
IX. Strategic Position: Helmer's 7 Powers & Porter's 5 Forces
Strategy frameworks are only useful if you let them fail. Applied honestly, they should identify which of a company's claimed advantages survive contact with the evidence, and which are simply favorable industry conditions being mistaken for firm-specific edge. Kite Realty is a clean test case, because it operates in an unambiguously attractive industry structure while being, by market verdict, one of the less-favored operators within it.
Hamilton Helmer's 7 Powers Analysis
Cornered Resource — partially supported. The strongest version of the KRG case is that certain of its locations are irreplaceable: high-density suburban intersections in supply-constrained markets where entitlement difficulty and construction costs make competing development uneconomic. The evidence is not rhetorical. It is the 29% cash lease spread and 29% return on capital achieved across 54 anchor repositionings, the 56% average spread on grocer conversions, and the fact that lifestyle and mixed-use assets command $41.26 per square foot while power centers command $16.87.1 Landlords do not achieve those numbers on fungible real estate.
But the power is asset-specific, not portfolio-wide. Roughly a third of the portfolio by ABR sits in power and regional community formats at rents in the high teens, and management is actively trying to sell more of it.13 The cornered resource exists in the top half of the portfolio and does not obviously exist in the bottom half — which is a precise description of why the company keeps selling assets.
Scale Economies — weak as a differentiator. KRG has enough scale to run a national leasing platform and to negotiate directly with the real estate committees at TJX, Ross, and the major grocers. That is table stakes among the large open-air REITs, not an edge over them. General and administrative expense of $13.95 million in the first quarter against same-property revenue of $189.2 million is efficient but not extraordinary.1 The honest conclusion: scale got KRG into the room. It does not distinguish the company inside the room.
Counter-Positioning — real for the format, not for the firm. Open-air centers offer retailers lower occupancy costs, lower common area charges, and direct storefront parking versus enclosed malls, and enclosed mall owners genuinely cannot replicate that without abandoning their asset base. But this power belongs to the format, and every peer in the sector holds it identically. It explains why the industry has done well. It explains nothing about why an investor would choose KRG over Regency Centers.
Process Power — the most underrated candidate. The advantage KRG is most plausibly building is not locational. It is contractual. Moving fixed rent bumps of 3% or more from 68% of new and non-option renewal leases in 2022 to 86% in the first quarter of 2026 — and small-shop leases at 4% or better from 3% to 63% over the same span — is a repeatable organizational capability executed thousands of times.1 It has moved portfolio-wide embedded escalators from 156 basis points in the first quarter of 2024 to 182 basis points, toward a stated 200 basis point target.1
Twenty-six basis points sounds trivial. Compounded across a 27-million-square-foot portfolio over a decade of lease terms, it is the difference between a 2% organic grower and a 3% one — which in REIT valuation is the difference between a discount multiple and a premium one. Kite makes the point himself, noting that peers with 2%-plus escalators trade at significant multiple premiums.13 Whether this qualifies as durable power or merely as good execution in a landlord's market is the open question. It will be answered the next time tenants have leverage.
Porter's 5 Forces Analysis
Bargaining Power of Buyers (Tenants) — moderate, and improving for the landlord. No single tenant exceeds 2.6% of ABR, which caps individual tenant leverage.1 But anchors extract structurally lower rents, and the contractual mechanisms that constrain landlords — fixed renewal options, use restrictions, co-tenancy clauses — remain embedded in legacy leases. Management's stated aim is to improve these terms rather than eliminate them. Kite was explicit that "you don't eliminate all these things overnight," and McGowan described the approach as taking the conversation directly to retailers' corporate offices rather than redlining documents.13 The 6.2% spread on option renewals is the quantitative signature of that residual tenant power.2
Bargaining Power of Suppliers — moderate to high, with an ironic benefit. Elevated construction costs, labor scarcity, and a high cost of capital constrain what any owner can build. For an incumbent, that is a supplier problem that doubles as a competitive moat: the same forces that make KRG's tenant improvement dollars expensive make new competing centers uneconomic. The cost shows up in the $85 per square foot of anchor capital and the $100 million-plus annual lease-up spend.13
Threat of Substitutes — low to moderate, but not zero. E-commerce has stopped being a pure substitute and become partly a complement, with stores serving as fulfillment and returns nodes. The residual exposure is category-specific rather than channel-specific: 46% of weighted ABR sits in discretionary retail and 19% in restaurants.1 The substitute for a discretionary apparel purchase is not a website. It is not making the purchase at all.
Threat of New Entrants — very low. This is the clearest force in the analysis. Replacement cost exceeds prevailing asset values in most prime suburban markets, which is why supply growth has been pinned near 0.3% annually.1 KRG has not disclosed a specific replacement cost per square foot, and it would be inventing precision to supply one. The outcome is visible in the supply data regardless.
Competitive Rivalry — moderate among landlords, intense among buyers. Rivalry for tenants is muted, because trade areas function as effectively local monopolies. A Publix-anchored center does not compete with one six miles away for the same weekly shop. Rivalry for assets is the opposite, and it is the most consequential competitive dynamic KRG faces right now.
Fear's assessment on the first-quarter call was unusually vivid: "there isn't a pocket of historical retail capital that hasn't been reignited. So the breadth of the demand is just incredible. And frankly, it's better to be a seller right now than it is to be a buyer."3 That statement is bullish for KRG's existing asset values and bearish for its ability to reinvest disposition proceeds accretively. Which is precisely why the company has been buying its own stock instead — and why the entire strategy rests on a valuation gap that management does not control.
X. The Investment Spine: Bear vs. Bull Stress Test
Strip away the frameworks and the case reduces to a single question. Does an excellent asset class, owned by a competent operator with a strong balance sheet, translate into per-share cash flow growth for the owner of the stock? The evidence points in both directions, and the honest answer is that it has not yet.
The Bull Case
1. The supply constraint is structural, measurable, and long-lived. Fifteen years of sub-1% supply growth cannot be reversed quickly even if development economics improved tomorrow, because entitlement and construction timelines run years.1 This is the foundation under every other bull argument, and unlike most competitive advantages, it does not depend on management execution. It is a gift from the industry to every incumbent.
2. KRG has the largest occupancy runway in its peer group. Economic occupancy roughly 260 basis points below its own pre-pandemic highs, while peers sit at or above theirs, is a deficiency today and an opportunity tomorrow.3 The $36 million SNO pipeline at $28 per square foot average rent is the contractual mechanism for closing it, with roughly 59% expected to commence during 2026 and the balance running into 2028.1 Unlike speculative growth, this is signed: the tenant credit is underwritten, the rent is documented, and the primary remaining risk is timing rather than demand.
3. The escalator program compounds without further capital. Contractual rent bumps rising toward 200 basis points portfolio-wide represent growth that requires no leasing activity, no tenant improvement dollars, and no market cooperation.1 It is the highest-quality growth available to a landlord, and the piece of the story most likely to be underappreciated by a market focused on quarterly occupancy.
4. Capital allocation has been demonstrably opportunistic rather than rhetorical. Selling $621.7 million of lower-growth assets into a hot private bid, retaining operating control of high-quality assets through 52% joint venture structures with a sovereign wealth partner, and retiring 6% of the share count at a discount to net asset value is an executed program, not a stated intention.2141
5. The balance sheet is genuinely defensive. At 5.2x leverage, 84% fixed-rate debt, 89% unencumbered NOI, $1.1 billion of liquidity, and investment-grade ratings from all three agencies, KRG has the capacity to be a buyer during a dislocation rather than a forced seller.1 That optionality has value that does not appear in current earnings — and the company's own history at $3.20 a share explains why management treats it as non-negotiable.
The Bear Case
1. NOI growth is not reaching FFO, and the reasons are not all temporary. This is the crux of the entire case. Same-property NOI grew 2.9% in 2025, yet Core FFO per share grew 3.5% only with the help of a $300 million buyback. The 2026 guidance range of $2.06 to $2.12 against 2025's $2.06 implies roughly 1.5% growth at the midpoint, on a same-property NOI assumption of 2.5% to 3.5%.131
Management attributes the gap to the merger-related non-cash burn-off — now essentially complete — and to a $0.04 headwind from "recurring but unpredictable" items such as termination fees, land sale gains, and development fees, which ran roughly $21.5 million in 2025 versus under $13 million assumed for 2026.13 Two of those explanations are transitory. The third is not. A company whose reported earnings depend meaningfully on lumpy, non-recurring income is a company with a quality-of-earnings issue, and that issue does not resolve itself with time.
2. Refinancing at higher rates is a mechanical drag. The roughly $282 million maturing in 2027 at a 2.25% weighted average rate, followed by tranches in the 3.95% to 4.61% range through 2030, means interest expense grinds higher for years regardless of operating performance.1 Every basis point of that grind competes directly with the SNO tailwind for the same line on the income statement.
3. Tenant credit is the historical weak point, by management's own diagnosis. Fear identified credit watch lists and credit losses as the reason KRG underperformed peers on growth.13 The 2026 bad debt assumption of 100 basis points of total revenue was set above the company's typical 75-to-100 basis point run rate specifically because of The Container Store, and the Value City situation caused a sequential step-back in anchor occupancy during the first quarter.133 With 46% of ABR in discretionary retail and 19% in restaurants, a genuine consumer slowdown would show up here first and hardest.1
4. Re-tenanting capital is heavy and rising. Eighty-five dollars per square foot of anchor capital and $100 million-plus of annual lease-up spending are the real price of the leasing spreads.13 Strong cash spreads on a gross basis mean considerably less if net-effective economics after tenant improvements and leasing commissions compress. The reported spread is the numerator; the capital is the denominator, and only one of them appears in the headline.
5. The arbitrage strategy is self-limiting. Selling assets to buy stock works only while the public-private valuation gap persists. If KRG re-rates, the tool disappears. If it does not re-rate, the company shrinks. UBS's Michael Goldsmith asked exactly this on the first-quarter call — at what point does management pause repurchases and redeploy elsewhere — and Kite's answer acknowledged the constraint without resolving it, noting that the calculus is "a moving target."3 Meanwhile, every disposition removes NOI immediately while redeployment lags, which is why 2025's activity created a $0.02 per share timing drag into 2026 despite being accretive on an annualized basis.13
6. Concentration and insurance. Texas at 28% of ABR and Dallas/Fort Worth alone at 21% is a real single-metro exposure, and the company's own disclosures flag insurance costs and coverage in Florida and Texas coastal areas and North Carolina as a specific risk.1 Climate-driven insurance repricing is a live operating cost issue for Sun Belt landlords, and it lands harder on a portfolio that has moved 96% of its leases to fixed CAM and therefore absorbs cost overruns itself.1
The Three KPIs That Actually Matter
Most of the metrics in a shopping center supplemental are noise. Three are not, and a long-term holder tracking KRG should follow these rather than headline FFO.
First: the leased-to-occupied spread, and its conversion into economic occupancy. The 350 basis point gap is the single largest identified source of embedded earnings in the company.1 What matters is not the gap's existence but its rate of closure — whether economic occupancy actually rises quarter after quarter as signed leases commence, or whether new vacancy backfills the pipeline as fast as it converts. Watch economic occupancy in the same-property pool, not the leased rate.
Second: portfolio embedded rent escalators. At 182 basis points against a 200 basis point target, this is the purest available measure of whether KRG's negotiating leverage is being converted into durable, contractual growth rather than one-time rent spikes.1 It is also the metric management has tied its own credibility to most explicitly, which makes it a fair test of the narrative.
Third: bad debt as a percentage of total revenue. This is the variable that has historically separated KRG's growth from its peers', and it is the one most exposed to a consumer downturn.13 The company assumes 100 basis points for 2026 against a 75 basis point first-quarter actual.3 Sustained results at the low end would validate the portfolio-quality thesis. Sustained results above 100 basis points would indicate that the disposition program did not remove as much credit risk as advertised.
XI. Playbook: Key Business & Investing Lessons
1. Scale is not the same as quality, and buying is not the same as fixing. The 2014 Inland Diversified merger doubled Kite Realty's footprint and delivered exactly the national platform and tenant relationships management promised — and left leverage at 6.9x three years later, with the equity unrewarded.71 The 2021 RPAI merger was different, not because it was larger, but because it changed the company's cost of capital, evidenced by ratings upgrades and a leverage profile that reached 4.7x.151 The lesson for anyone evaluating a real estate roll-up: ask what the transaction does to the cost of capital and to the quality of the marginal asset, not what it does to the square footage.
2. In physical retail, supply is the story that demand gets credit for. The single most important number in this entire business is not e-commerce penetration or consumer confidence. It is that essentially nobody has built a new open-air shopping center at scale in fifteen years.1 Every strong operating metric in the sector — occupancy at record highs, double-digit leasing spreads, landlords rewriting co-tenancy clauses — traces back to that scarcity. When a "the narrative was wrong" thesis appears in any industry, check whether the correction is being driven by demand recovering or by supply having quietly stopped. The two produce very different durations of advantage.
3. A conservative balance sheet is an option, and options only pay if exercised. Running at 5.2x leverage with $1.1 billion of liquidity costs a company earnings growth every year that nothing goes wrong.1 KRG's answer to the analyst who challenged exactly that trade-off was that low leverage creates the capacity to act.13 Investors should hold management to the second half of that claim. Capacity that is never converted into differentiated action is simply an expensive form of caution — and the 2025 buyback program is, so far, the primary evidence that this management team will actually pull the trigger.
4. Portfolio pruning is a permanent activity, not a project. Kite Realty announced a disposition program in 2019, completed a transformational merger in 2021, and was still selling $621.7 million of lower-growth assets in 2025 — with management explicitly contemplating a second round.923 The reason is structural: any portfolio's bottom quintile regenerates as markets shift, anchors fail, and growth rates diverge. The operators who compound are the ones who treat selling as a discipline rather than an admission, and who accept near-term dilution to raise the growth rate of what remains. Whether Kite Realty has done enough of that, soon enough, to earn a different valuation than the one the market currently assigns is the question the next several years will answer.
References
-
Kite Realty Group — Investor Update Q1 2026 (data as of March 31, 2026) ↩↩↩↩↩↩↩↩↩↩↩↩↩↩↩↩↩↩↩↩↩↩↩↩↩↩↩↩↩↩↩↩↩↩↩↩↩↩↩↩↩↩↩↩↩↩↩↩↩↩↩↩↩↩↩↩↩↩↩↩↩↩↩↩↩↩↩↩↩↩↩↩↩↩↩↩↩↩↩
-
Kite Realty Group Reports Fourth Quarter and Full Year 2025 Operating Results and Provides 2026 Guidance — Kite Realty Group Trust, 2026-02-17 ↩↩↩↩↩↩↩↩↩↩
-
Kite Realty (KRG) Q1 2026 Earnings Call Transcript — The Motley Fool, 2026-04-29 ↩↩↩↩↩↩↩↩↩↩↩↩↩↩↩↩↩↩↩↩↩↩↩↩↩↩↩
-
Kite Realty Group Trust Stock Quote & Market Data — The Wall Street Journal ↩
-
Kite Realty Group Trust — SEC EDGAR Filings (CIK 0001286043) ↩↩↩↩
-
Kite Realty Group Trust Prices Offering of 25,000,000 Common Shares — Kite Realty Group Trust, 2009-05-13 ↩
-
Kite Realty Group Trust and Inland Diversified Real Estate Trust, Inc. Complete Merger Valued at $2.1 Billion — Kite Realty Group Trust, 2014-07-01 ↩↩↩↩↩↩↩↩
-
Kite Realty, Inland Diversified Complete $2.1B Merger — Commercial Search, 2014-07-02 ↩
-
Kite Realty Group Trust Reports 2018 Operating Results and Announces Plan to Fortify Its Balance Sheet, Improve Asset Quality, and Focus on Preferred Markets — GlobeNewswire, 2019-02-19 ↩↩↩↩↩↩↩
-
Kite Realty Group Trust Reports 2020 Operating Results, Provides 2021 Guidance, and Declares Dividend — Kite Realty Group Trust, 2021-02-11 ↩↩↩↩↩↩
-
Kite Realty Group Announces Closing of $7.5 Billion Merger with Retail Properties of America — Kite Realty Group Trust, 2021-10-22 ↩↩↩↩↩↩
-
Kite Realty Group Trust / Retail Properties of America Merger Proxy Statement and Prospectus, Form S-4 — SEC EDGAR, 2021-08-31 ↩↩
-
Kite Realty Group Trust Fourth Quarter 2025 Earnings Call Transcript (2026-02-17) — Seeking Alpha Transcript Archive ↩↩↩↩↩↩↩↩↩↩↩↩↩↩↩↩↩↩↩↩↩↩
-
Kite Realty Group Reports Second Quarter 2025 Operating Results — Kite Realty Group Trust, 2025-07-30 ↩↩↩
-
Kite Realty Group Trust Upgraded by Moody's to Baa2 with Stable Outlook — Kite Realty Group Trust, 2024-02-26 ↩↩
-
Kite Realty Group Promotes Heath R. Fear to President and Chief Financial Officer — Kite Realty Group Trust, 2026-03-20 ↩
 LinkedIn
 WhatsApp
 Reddit
 Hacker News
 Email
Email Kindle
 RSS Feed
 Spotify
 Apple Podcasts
 Amazon Music
 Audible
 YouTube