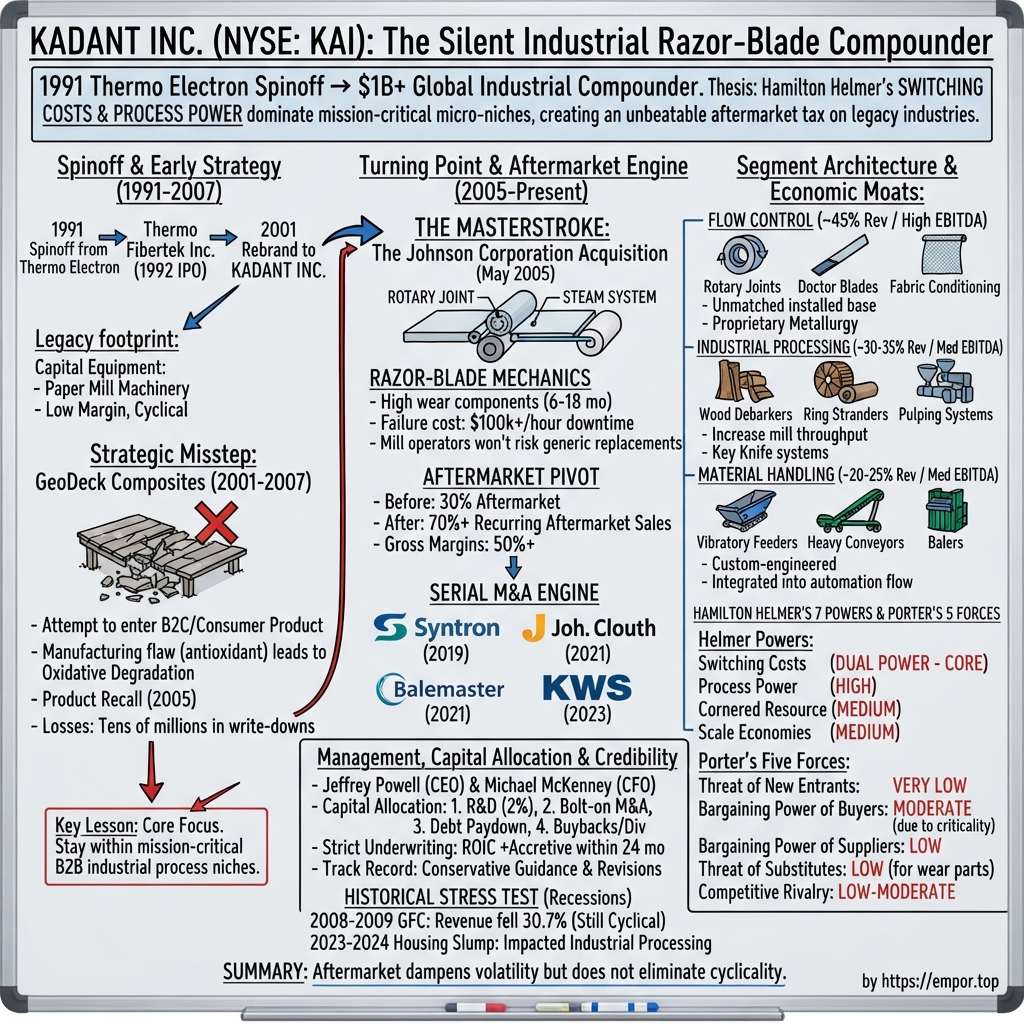
Kadant Inc. (NYSE: KAI): The Silent Industrial Razor-Blade Compounder
I. Introduction & The Micro-Monopoly Playbook
The Part That Explains the Company
Somewhere in the American Southeast, a containerboard machine runs a sheet of paper wider than a two-lane road at roughly 60 miles per hour. Pressed against one of its steam-heated dryer cylinders is a thin strip of metal or composite about the width of a ruler: a doctor blade. Its job is to scrape the roll clean so the sheet does not stick, tear, or wrap around a cylinder at highway speed. Kadant's annual report puts the working life of one of these blades between eight hours and two months, depending on the application.1
That scenario compresses the business model into a single object: a low-cost component whose failure can halt an entire production shift, prompting customers to reorder continuously.
Kadant Inc. sells thousands of variations on that principle: rotary joints that pipe pressurized steam into spinning cylinders, syphons that extract condensate, debarker tips that strip bark from logs, indexable knives that shave wood into strands, wear liners inside vibratory feeders, and blades inside horizontal balers that crush recycled corrugated boxes. In fiscal 2025, parts and consumables generated a record 71% of the company's $1.05 billion in revenue—up from 66% in 2024 and 62% in 2023.1 The stock trades near $302 per share with a market capitalization of roughly $3.6 billion, representing a valuation premium rarely assigned to suppliers serving paper mills and sawmills.2
The Paradox Worth Interrogating
The core paradox lies in Kadant's end markets, which the company describes as mature and low-growth.1 Printing and writing paper—the legacy market Kadant was founded to serve—accounted for about 4% of 2025 revenue and continues to shrink.1 Soft housing starts have weighed on the wood processing business, which represents roughly 22% of revenue.1 Mining, coal, and aggregates add further cyclicality. Yet Kadant compounded its adjusted earnings per share at a 13.5% annual rate between 2018 and 2023, while lifting its adjusted EBITDA margin by approximately 800 basis points over a decade.3
The conventional explanation points to customer switching costs, which provides only part of the answer. A more direct explanation—supported by company disclosures—is capital allocation arithmetic. At its December 2024 investor day, Kadant disclosed that it had completed 24 acquisitions since 2013 at an average multiple of 8.8 times EBITDA, and that those acquired businesses represented 56% of forecast 2024 revenue and 64% of forecast 2024 adjusted EBITDA.3 In short, roughly two-thirds of Kadant's forecast 2024 profit pool originated from acquisitions made over the preceding 11 years.
What This Story Actually Tests
The core investment thesis, therefore, is not merely that Kadant possesses a competitive moat. It is a two-part claim whose halves must be evaluated independently, as each carries distinct risks.
First, that its installed base generates sticky, high-margin aftermarket revenue that dampens cyclical downturns. The historical record largely supports this claim, though with notable qualifications during the 2009 downturn and again in 2025.
Second, that Kadant's capital allocation engine can continuously acquire niche market leaders at single-digit multiples and improve their performance before asset prices escalate. This second claim accounts for much of the stock's valuation premium and carries a more complex history—including a past venture that failed so completely that the operating subsidiary ran out of funds and defaulted on its warranties.
Both claims sit within a business largely invisible to everyday consumers. Kadant features no public consumer brand, tech platform, or software flywheel. Instead, it is a $3.6 billion enterprise with approximately 3,900 employees across 20 countries—roughly half in North America and 30% in Europe—assembling specialized parts installed inside industrial machinery.1 Kadant does not position itself as a rapid growth story; rather, it tests whether a specific industrial formula—niche dominance, intensive service, recurring consumable revenue, and disciplined serial acquisitions—can compound over decades.
The analysis ahead examines: the Thermo Electron incubator that created the company as a corporate finance experiment; the composite-decking failure that nearly derailed it; the pivotal 2005 acquisition that restructured its economics; the three-segment operating structure and its true margin drivers; the acquisition engine and its capital costs; management's execution relative to its published five-year targets; the durability of the moat through past downturns; and the key metrics that will dictate performance going forward.
The story begins where the company started—as a corporate finance structure, not an industrial operation.
 Subscribe on LinkedIn
II. Spinoff Roots & The Thermo Electron Incubator (1991–2001)
The Hatsopoulos Machine
In the 1980s and 1990s, George Hatsopoulos ran Thermo Electron less like a traditional industrial conglomerate and more like a venture capital fund. The model was distinctive: incorporate a promising internal business unit, sell a minority stake to the public, allow the entity to raise its own capital and grant stock options to its managers, and maintain voting control at the parent company. At its peak, Thermo had more than a dozen publicly traded offspring, each with its own ticker symbol, board of directors, and acquisition currency.
The intellectual rationale was straightforward: large corporations often stifle entrepreneurial units because divisional managers lack a direct claim on the equity value they generate. Issuing separate public stock restored that incentive. The financial benefit was equally decisive: a publicly traded subsidiary could fund its own expansion without parent capital injections, while commanding valuation multiples higher than those awarded to the parent company itself.
Kadant originated within this spin-off incubator. Incorporated in Delaware in November 1991 to combine several of Thermo Electron's papermaking equipment businesses, the company completed an initial public offering of a minority stake in November 1992 under the name Thermo Fibertek.4 For most of the 1990s, it operated as a mid-sized supplier of paper machine accessories, wastepaper recycling stock-preparation systems, and water-management equipment for North American and European mills.
It also executed the core mission of Thermo's offspring: pursuing serial acquisitions. Kadant AES was carved out of Albany International; Michael McKenney, who later became Kadant's long-serving chief financial officer, served as that division's controller from 1993 to 1997.4 In 1997, the company acquired fiber-processing equipment maker Kadant Black Clawson.4 Even as a corporate subsidiary, the company was developing its transactional playbook.
The underlying operations were far older than the holding company itself. Kadant's 2005 annual report noted that several operating units, or their corporate predecessors, had been in business for roughly a century, with equipment installed in most of the world's pulp and paper mills.4 That legacy installed base—built by businesses Kadant inherited rather than founded—became the company's foundational asset. Its subsequent history centers on how effectively successive management teams monetized that inheritance.
Cutting the Cord
The Thermo incubator model eventually unwound as the parent company narrowed its strategic focus. Thermo Electron reorganized around laboratory instruments and analytical equipment—ultimately morphing into Thermo Fisher Scientific—and began divesting its public offspring. On July 12, 2001, Thermo Fibertek changed its name to Kadant Inc., and in August 2001 Thermo Electron distributed its remaining equity stake to its shareholders.4 In May 2003, Kadant moved its stock listing to the New York Stock Exchange, where it has traded under the ticker KAI ever since.4
Leading the independent company was William A. Rainville, who had served as president and chief executive officer since incorporation in 1991, a director since 1992, and chairman beginning in 2001.4 Rainville brought deep operational experience in paper machinery, having served as chief operating officer of Thermo Electron's recycling and resource recovery group from 1998, following executive roles at Drott Manufacturing, Paper Industry Engineering, and Sterling Pulp and Paper.4 Rather than a financier assigned to manage a holding company, Rainville was an industry operator who thoroughly understood paper mill machinery.
A Good Franchise in a Bad Market
At independence, Rainville inherited a solid operational franchise tied to a declining end market. Kadant's primary customers produced printing paper, writing paper, and newsprint—the precise paper grades eroded by digital media. Revenues totaled $191.5 million in 2003 and $195.0 million in 2004, representing modest 2% top-line growth driven entirely by favorable foreign currency exchange.4 Operating margins stood at just 4% in 2004 after accounting for restructuring costs.4 Two years earlier, in 2002, the company absorbed a $32.8 million non-cash charge—equal to $2.49 per share—upon adopting a new goodwill accounting standard, driving the business into a net loss for that year.4
These figures highlight the strategic challenge Kadant faced at the outset: a newly independent company generating under $200 million in revenue, anchored by a legacy installed base in mills facing structural decline, and operating with single-digit margins. At the same time, executive leadership had been trained within a parent company accustomed to value creation through corporate transactions.
The strategic imperative was clear: diversify into higher-growth markets. The critical question was where to deploy capital. Management ultimately selected an expansion path that promised rapid growth, but diverged sharply from Kadant's core industrial expertise.
III. Strategic Misstep: The GeoDeck Failure & The Lesson of Core Focus (2001–2007)
The Logic That Looked Obvious
The strategic logic appeared compelling enough that numerous corporate decision-makers approved it at the time.
Papermaking generates massive quantities of cellulose fiber byproduct—a material Kadant already processed, understood, and converted into absorbent granules in one small business unit. Composite decking, meanwhile, was expanding rapidly within American building products: wood fiber blended with recycled plastic and extruded into boards that required no staining, sold at a premium to pressure-treated lumber into a 2002 housing market entering a historic expansion. Kadant possessed fiber supplies, extrusion knowledge, distribution ambitions, and a mandate to find growth outside a shrinking paper market.
Consequently, it formed Kadant Composites LLC and launched a decking and roof-tile line called GeoDeck, produced from recycled fiber, plastic, and other materials, and marketed through distributors primarily to the building industry.4
The executive running the division was Jonathan W. Painter, who served as president of the composites building products business from 2001 until its sale in 2005.5 That name would re-emerge later in the company's executive leadership.
The product failed in the field—the most damaging location for a building material to fail. Boards installed on residential properties degraded as the composite material oxidized, cracked, and crumbled. Warranty claims, the leading physical indicator of manufacturing defects, climbed sharply through 2003 and 2004 before spiking in 2005.4 In August 2005, Kadant Composites and the U.S. Consumer Product Safety Commission announced a voluntary recall of GeoDeck decking.6 On October 21, 2005, Kadant sold substantially all assets of the composites business to LDI Composites Co. for approximately $11.1 million in cash plus the assumption of $1.4 million in liabilities, recording an immaterial gain on the sale.4
What the Failure Actually Cost
At this juncture, the episode moves past a simple parable about core focus to reveal specific operational lessons.
Testing thesis claim #1: that Kadant can extend its process-engineering capability into adjacent product categories. The disconfirming evidence lies not merely in the venture's failure, but in how it failed and what persisted after the sale.
Kadant could not cleanly walk away at closing. Under the asset purchase agreement, Kadant Composites retained warranty obligations for all products manufactured prior to the sale date, placing $3.5 million of the proceeds into a buyer-administered escrow fund.4 By year-end 2005, that escrow balance had been drawn down to roughly $2.3 million against an accrued warranty reserve of $5.3 million.4 Kadant paid claims out of sale proceeds into the third quarter of 2007. On September 30, 2007, Kadant Composites LLC announced that it lacked sufficient funds to honor warranty claims, could no longer process or pay them, and ceased doing business.7
A nationwide class-action lawsuit followed. Kadant Composites LLC and its co-defendants entered into a settlement agreement on October 24, 2011, approved in Connecticut state court, covering allegedly defective decking manufactured between April 2002 and October 2003.7 The company held $2.6 million accrued for estimated claims at the end of 2011, reduced the balance by $1.6 million during 2012, paid $647,000 in approved claims that year, and carried a residual accrual at the end of 2012—seven years after exiting the business.7
The total reported financial damage was smaller than corporate folklore suggests, but lingered far longer than initial headlines indicated. After-tax losses from the discontinued composites operation totaled $2.5 million in 2001, $2.3 million in 2002, $1.3 million in 2003, $5.1 million in 2004, and $3.0 million in 2005—representing roughly $14.3 million in cumulative losses for a company that earned $9.9 million from continuing operations in 2005.4 The venture never achieved commercial scale, consuming between $7.4 million and $12.2 million in working capital across those years.4
The economic lesson outweighs the absolute dollar cost. The failure mode was structural. Kadant's core capability is engineering components to withstand severe conditions inside an industrial customer's machine, where the buyer is a professional engineer, failure is measured in factory downtime, and ongoing service forms the essence of the relationship. Consumer building products inverted each of those conditions: the buyer was a homeowner, failure surfaced years after installation, distribution relied on lumberyards rather than field engineers, and product liability followed the seller long after disposal of the asset. Materials expertise failed to transfer, and consumer business-model expertise was absent.
The Accountability Question
A significant governance detail emerges from this timeline. Painter was appointed Kadant's chief operating officer in September 2009, chief executive officer in January 2010, executive chairman in July 2019, and has served as chairman of the board since July 2020.5 One interpretation holds that the board viewed GeoDeck as an enterprise-level strategic misstep rather than an individual management failure, noting that Painter's subsequent decade as CEO delivered strong financial performance. A less favorable interpretation suggests Kadant's board did not impose visible personal accountability for the largest capital-allocation mistake in the company's independent history. Both interpretations find support in the historical record. The record offers no evidence, however, that the company enforces executive penalties for failed corporate ventures.
The broader strategic lesson endured. Kadant has attempted no consumer-facing expansion since. Every subsequent acquisition has targeted business-to-business industrial component manufacturers serving process industries. In May 2005, five months before finalizing the composites sale, the company had already acquired the business that would define its operational trajectory for the next two decades.
IV. The Turning Point: The Johnson Corporation & The Aftermarket Engine (2005–2015)
A Town of 7,000 and a Global Franchise
Three Rivers, Michigan, is a municipality of roughly 7,000 residents situated at the confluence of three rivers in the state's southwestern corner. It represents an improbable headquarters for a global industrial franchise. Yet The Johnson Corporation, founded and based there, spent decades developing the specialized hardware required to feed steam into spinning drying cylinders and extract condensate—specifically rotary joints, syphons, and steam-and-condensate control systems.
On May 11, 2005, Kadant acquired all outstanding stock of The Johnson Corporation for approximately $101.5 million in cash plus $4.7 million in transaction costs, alongside a $4.0 million letter of credit tied to tax assets and an earn-out of up to $8.0 million contingent on revenue targets through July 2006.4 Johnson was privately held, employed roughly 575 people, and generated approximately $76 million in revenue during calendar 2004.4 Rudolf Leerentveld, Johnson's president since 1998, remained to lead the renamed Kadant Johnson subsidiary and became a Kadant vice president in June 2005—establishing an acquisition playbook of retaining incumbent management and brand identity.4
Kadant paid roughly 1.3 times revenue for a business that expanded its sales base by nearly 50%, financing the deal with debt on a balance sheet that previously carried virtually none. In the transaction year, cash used to purchase Johnson stock totaled $103.6 million against $212 million in shareholders' equity.4 It represented a major balance-sheet commitment by an executive team that was simultaneously winding down its troubled composite-decking venture.
The Physics of the Moat
The strategic significance of the acquisition rested less on transaction multiples and more on operational physics.
In a paper mill's dryer section, dozens of heavy steel cylinders heated internally by pressurized steam spin continuously as a wet paper web moves across them at high speeds. Heating these rotating cylinders requires piping steam from a stationary supply line into a moving drum without leakage, while simultaneously removing accumulating condensate. The rotary joint performs this mechanical seal function, relying on carbon and steel faces pressed against a rotating shaft while operating continuously under high heat and moisture. Inside the cylinder, a syphon extracts the condensate, while stationary internal bars agitate the fluid layer to ensure uniform heat transfer through the shell.1
Because mechanical seals wear down over time, a joint failure releases steam, distorts temperature uniformity across the cylinder, degrades paper quality, and can force an unscheduled mill shutdown. Intercepting operations on a high-speed paper machine represents a costly disruption, sacrificing production volume and disturbing plant operating schedules.
This operational risk creates the economic asymmetry underpinning Kadant's aftermarket margins. The cost of a replacement component is negligible relative to the financial penalty of unplanned downtime. A mill operator evaluating a lower-cost generic seal is not simply comparing a $400 part to a $300 alternative; the operator is weighing a $100 savings against the risk of losing multiple shifts of output. Furthermore, the original equipment manufacturer possesses exact dimensional specifications from installing the initial system.
The Johnson acquisition provided Kadant with three structural advantages: a consumable product line with a physically dictated replacement cycle; an installed base generating steady aftermarket demand independent of new paper machine construction; and deep application-engineering integration within customer facilities. Executive management maintained this positioning two decades later; during the fourth-quarter 2025 earnings call, Chief Executive Officer Jeffrey Powell noted that Kadant maintains technical staff "living in the operations supporting our customers," framing total cost of ownership rather than initial unit price as the primary competitive barrier.8
What Came After
The decade following the Johnson acquisition was marked by cyclical disruption and strategic refinement. Revenue rose from $243.7 million in 2005 to $366.5 million in 2007, before the 2008 global financial crisis reduced top-line sales by roughly one-third. Between 2010 and 2015, revenue recovered gradually from $270 million to $390 million, while management focused on restoring operating margins and evaluating capital deployment priorities.
Rather than expanding internal product development—research and development expenditure totaled $15.3 million in 2025, or roughly 1.5% of revenue—management prioritized replicating the Johnson acquisition model.1 The strategy focused on acquiring privately held niche industrial leaders with established installed bases and recurring wear-parts demand, paying single-digit EBITDA multiples, retaining existing operating teams, and integrating products into Kadant's global sales network.
This shift altered Kadant's segment composition over the following decade. In 2009, the unit now known as Industrial Processing represented 58% of the company's $226 million in total revenue, while material handling accounted for 4%. By 2016, on $414 million in total revenue, Industrial Processing had declined to 47% of sales while material handling expanded to 13%.3 A key driver of this expansion was the April 2016 acquisition of PAALGROUP—a baler manufacturer operating in Germany, the United Kingdom, France, and Spain—for €49.7 million net of cash, or approximately $56.6 million.9 PAALGROUP's balers compress recyclable materials at box plants, distribution centers, and recycling facilities, marking Kadant's first substantial expansion beyond pulp and paper processing.
By 2016, Kadant had established its long-term operating identity: transitioning from a dedicated paper-machinery vendor into a disciplined aggregator of specialized industrial micro-franchises.
V. Segment Architecture, Market Structure & Micro-Monopolies
Kadant reports across three operating segments, best understood not by hardware categories, but by a simple operational question: how much of a segment's revenue arrives automatically, without requiring customer management to approve a capital expenditure budget?
Flow Control: The Profit Engine
Flow Control generated $382.9 million in 2025 revenue—about 36% of Kadant's total—at a 52.3% gross margin, making it comfortably the company's most profitable division.1 The unit combines the legacy Johnson business with subsequent acquisitions. On the fluid-handling side, it manufactures rotary joints, syphons, Turbulator bars, expansion joints that absorb thermal movement and vibration in industrial piping, and engineered steam and condensate systems that control flow from boiler to dryer cylinder and back.1 On the doctoring, cleaning, and filtration side, the segment supplies doctor systems and holders—the mechanical structures that press blades against spinning rolls at uniform pressure—alongside blades in metal, bi-metal, composite, and synthetic formulations; cleaning showers and fabric-conditioning systems that strip contaminants off machine belts; forming systems that drain water out of paper sheets; and water-filtration units that recover reusable fiber from process streams.1 In the second quarter of 2026, Flow Control's aftermarket revenue reached a record $76 million, accounting for 76% of segment sales and supporting a 27.7% adjusted EBITDA margin.10
Industrial Processing: Scale Without the Margin
Industrial Processing represents Kadant's largest division by top-line revenue, generating $409.5 million in 2025—roughly 39% of the company's total—though at a lower 43.0% gross margin.1 The segment operates across two primary industrial activities.
Wood processing produces equipment that converts raw timber into industrial inputs. Ring debarkers strip bark using a rotating multi-tool assembly around a stationary log, while rotary debarkers rely on mechanical abrasion and log-on-log contact. Stranders slice logs into thin wafers for oriented strand board manufacturing, while chippers reduce waste wood and whole logs into pulp chips. Engineered knife systems perform custom chipping, planing, and flaking across sawmills and wood-processing plants.1 Every unit contains cutting edges that wear down continuously, preserving the core razor-blade model: the primary machine is sold once, while replacement blades generate long-term recurring orders.
Fiber processing manufactures machinery that recycles paper back into pulp—including pulping, screening, cleaning, and de-inking systems that eliminate ink, adhesives, and metal contaminants before fiber enters the paper machine. The unit also builds virgin pulping hardware such as washers and evaporators, boiler-cleaning systems for power facilities, and continuous screw presses that extract liquid from sugar beet pulp, cellulose, and agricultural processing byproducts.1
Material Handling: Diversification and Its Price
Material Handling contributed $259.9 million in 2025, or roughly 25% of consolidated revenue, at a 38.1% gross margin.1 Its portfolio includes vibratory feeders and screens that sort bulk material; conveying systems designed for harsh mining environments; screw conveyors, slide gates, and bucket elevators for food, chemical, agricultural, and paper operations; horizontal and vertical balers, compactors, and bale wrappers; and a specialized granules unit that converts papermaking byproducts into agricultural carriers and oil absorbents.1 Notably, roughly 17% of the segment's 2025 sales were generated under the Link-Belt trademark, which Kadant licenses from a third party under a worldwide, exclusive, royalty-free, perpetual agreement.1
The margin spread across these three segments illustrates a key structural trade-off. Flow Control earns 14.2 percentage points more in gross margin than Material Handling because its revenue mix relies far more heavily on recurring consumables. Management disclosed on its fourth-quarter 2025 earnings call that consumables represented 73% of Flow Control sales and 76% of Industrial Processing sales, but only 53% of Material Handling revenue.8 As Kadant expands beyond paper processing equipment, its revenue mix shifts toward capital equipment sales rather than recurring parts.
This dynamic highlights the core portfolio trade-off. Strategic diversification away from graphic paper successfully dampened end-market risk: by 2023, consolidated revenue split roughly 36% in general industrial markets, 23% in paper, 21% in wood products, and 20% in packaging, with no single customer accounting for 10% or more of sales over the prior three fiscal years.31 However, that end-market diversification came at the expense of lower aftermarket intensity. While Material Handling provides reliable cash flow, it lacks Flow Control's economic profile, making it unrealistic to extrapolate Flow Control's margins across Kadant's entire operating footprint.
Who Actually Competes
Public regulatory disclosures offer limited detail regarding market competition, whereas executive management provides a clearer operational picture during investor calls. In its annual 10-K filing, Kadant notes that it acts as "a leading supplier of systems and equipment in each of our product lines" within Flow Control against global and regional suppliers; faces a constrained set of competitors in forest products and fiber processing; and encounters broad global, regional, and local competition in conveying and vibratory equipment.1 The filing acknowledges that key competitors include major multinational corporations with greater financial resources that may deploy emerging factory automation, industrial internet-of-things, and artificial intelligence technologies faster.1 European paper-machinery original equipment manufacturers—including Valmet, Voith, and Andritz—compete directly in consumable categories; Valmet, for instance, markets its own proprietary doctor blades across all paper machine positions.11
During Kadant's fourth-quarter 2025 earnings call, Chief Executive Officer Jeffrey Powell detailed how rivals attempt to capture market share. When an industrial customer remains satisfied with incumbent equipment performance and field service, Powell noted, "the only real leverage they have is to try to undercut you on price," adding that European competitors "often do make a lot less money than us because they try to undercut our price."8 He characterized smaller regional manufacturers as the more disruptive threat, observing that their lower overhead structures allow them to "create more havoc for you."8
This dynamic reflects a defensible commercial position rather than an impenetrable monopoly. Competitors can manufacture functional replacement parts. Kadant defends its pricing premium through localized technical service, installation expertise, and application engineering—though Powell acknowledged that during 2025, when competitors "did get their foot in the door, we were able to kind of turn that around as the year progressed."8 Consequently, Kadant's competitive moat functions as an annual price premium earned through field support rather than an absolute barrier to entry.
The Aftermarket Anomaly
A key operational divergence has emerged across recent operating cycles. Kadant's aftermarket revenue approached record levels for two consecutive years despite depressed operating rates among customer mills—reversing the historical correlation between mill utilization and parts demand. Management attributes this countercyclical strength to a three-year period of deferred customer capital spending, which aged the installed machine base and increased maintenance requirements. Powell highlighted this dynamic during the second-quarter 2026 call, noting that equipment age across customer facilities remained elevated: "it's old and it's taken a lot more to keep it up and running."12
For investors, this maintenance dynamic presents a dual-edged outlook. Extended capital deferrals have temporarily inflated parts intensity relative to underlying production volumes. If industrial capital spending rebounds as management anticipates, elevated aftermarket demand may normalize as operators replace legacy equipment with new machinery. Because wear-parts sales and capital equipment orders function partly as economic substitutes, a broader capital expenditure recovery may rebalance revenue without generating a net gain for Kadant's highest-margin product lines.
VI. The Serial M&A Engine: Syntron, Joh. Clouth, and KWS
The Funnel
Dara Mitchell has served as Kadant's senior vice president of corporate development since May 2019, having joined the company as director of corporate development in 2013. Her background is in private equity and dealmaking rather than machinery: she previously worked as a principal at an investment banking and strategic advisory firm and as an investment director at 3i, the global private equity firm, where she backed technology companies.1 At Kadant's December 2024 investor day, Mitchell described an M&A funnel structured much like a middle-market buyout fund: more than 500 identified tuck-in targets, active relationships with over 150 investment bankers who submit platform ideas, roughly 120 actionable opportunities in a typical year, more than 15 formal indications of interest, and about three closed acquisitions annually.3 Sourcing discipline is central to this model: 14 of the 16 acquisitions completed between 2019 and late 2024 originated through existing industry relationships rather than competitive auctions.3
That sourcing ratio encapsulates the company's competitive acquisition claim. Kadant rarely outbids private equity firms in auctions, preferring to avoid bidding wars altogether.
The Deal Tape
The acquisition record provides empirical evidence of how Kadant's transaction pattern has evolved over time.
Syntron Material Handling closed on January 2, 2019, for approximately $179 million, acquired from entities affiliated with Levine Leichtman Capital Partners. Based in Tupelo, Mississippi, Syntron employed roughly 250 people and had generated approximately $89 million in revenue over the 12 months ending October 2018.13 The acquisition established Kadant's platform in bulk material handling for mining, aggregates, and food processing—marking a decisive move beyond pulp and paper, while introducing mining cyclicality into the portfolio.
The Clouth Group followed in the third quarter of 2021 for $92.9 million net of cash acquired plus assumed debt, with most operating entities closing on July 19 and the final entity on August 10, funded through euro-denominated borrowings.14 Clouth, a German doctor blade manufacturer operating three plants in Germany and one in Poland, was acquired to expand Kadant's position in ceramic blades and broaden its European geographic footprint.14 Kadant recorded $23.2 million in revenue from Clouth in 2021 along with an operating loss of $4.1 million, reflecting $3.5 million in purchase-accounting amortization on acquired inventory and backlog plus $2.7 million in transaction costs.14 That initial earnings drag is a recurring feature of active acquisition years, illustrating why GAAP net income understates underlying operating economics during heavy M&A deployment—a distinction that becomes crucial when evaluating how the company defines adjusted earnings.
Balemaster, legally East Chicago Machine Tool Corporation, closed on August 23, 2021, for $53.7 million net of cash, adding U.S. horizontal balers used at corrugated box plants, retail distribution centers, and recycling facilities.14
The company experienced its most active transaction period in 2024. Key Knife closed on January 1, 2024, for $153.4 million net of cash, bringing 141 employees in Tualatin, Oregon, roughly $65 million in trailing revenue, and an operational profile featuring virtually 100% aftermarket parts revenue.153 Kadant positioned itself as a permanent corporate home for the previously employee-owned business, bypassing a competitive auction process.3 Three weeks later, on January 24, KWS Manufacturing closed for $79.4 million net of cash, adding 165 employees in Burleson, Texas, $45 million in trailing revenue, and a product line of screw conveyors and bucket elevators.1516 On May 31, Dynamic Sealing Technologies closed for $53.6 million net of cash, adding fluid rotary unions and electrical slip rings to the Flow Control segment.15 Total acquisition capital deployment reached $300.3 million in 2024.1
Expansion continued in 2025. Clyde Industries closed on October 7, 2025, for $175 million. Founded in 1924 and headquartered in Atlanta with operations across Brazil, China, Indonesia, Finland, and Canada, Clyde brought roughly 400 employees and $92 million in revenue for the year ending February 2025, specializing in boiler efficiency and cleaning technologies for recovery and power boilers.17 Earlier that year, on July 9, 2025, Kadant completed the acquisition of Babbini—comprising two small Italian dewatering and power-transmission equipment makers—for $16.5 million.1
Buying Its Own Supplier
On April 30, 2026, Kadant completed the acquisition of Kadant Profil—formerly voestalpine BÖHLER Profil of Bruckbach, Austria, founded in 1872—for approximately €157 million.1819 Strategically, the transaction marks a significant operational shift. Profil had supplied Kadant with raw steel profiles for more than 30 years.19 By acquiring its primary supplier of specialized rolled steel profiles and industrial knives—the near-net-shape steel that forms doctor blades—Kadant vertically integrated into the supply chain of its highest-margin consumable product line, anchoring its economics in the wear component rather than the primary machine.
The transaction also introduced a temporary accounting effect that management disclosed in advance. Because roughly 45% of Profil's revenue represented intercompany sales to Kadant, those sales eliminate upon consolidation, and internal profit cannot be recognized until Kadant's downstream businesses deliver finished products to third-party customers.20 Operating units were required to consume existing pre-acquisition inventory first. Management elected not to model intercompany profit recognition for fiscal 2026, projecting that the acquisition would be dilutive to 2026 adjusted earnings per share by approximately $0.20.20 The proactive disclosure highlights a finance organization focused on explaining structural accounting mechanics to analysts ahead of reporting dates.
Testing the Machine
Testing thesis claim #2: that Kadant can compound through serial acquisition without balance-sheet strain or operational drag.
The primary disconfirming evidence involves periodic asset write-downs and, more significantly, the structural composition of top-line revenue growth.
Impairments offer an objective standard for evaluating deal underwriting. In July 2017, Kadant acquired the forest products business of NII FPG Company for $170.8 million—at the time the largest deal in company history, featuring primary manufacturing facilities in Canada and Finland—which included a line of specialized timber-harvesting equipment.21 By 2019, that timber-harvesting line had absorbed $2.3 million in intangible asset impairments. In the fourth quarter of 2020, citing sustained demand declines, Kadant recorded an additional $1.9 million write-down, reducing the remaining intangible value to $443,000.14 Within three years of acquisition, a product line acquired inside a flagship transaction was written down near zero. Separately, in the fourth quarter of 2021, Kadant decided to exit its ceramic blade business in France—rendered redundant following the Clouth acquisition—taking a $499,000 technology impairment and closing the facility during 2022.14 In 2025, the company recorded a further $0.3 million impairment on previously acquired technology slated for retirement, alongside severance costs for two employees associated with closing a small European operation.1
These impairments remain modest in scale relative to total enterprise value. Across roughly two dozen acquisitions executed over more than a decade, Kadant has incurred no large-scale goodwill write-downs tied to its modern acquisition program. The sole major goodwill impairment in the company's history—a $40.3 million pre-tax charge ($26.7 million after tax) recorded in 2008 within the stock-preparation unit—reflected a severe cyclical downturn in legacy assets during the global financial crisis rather than a failed acquisition.22 Empirical underwriting evidence shows that Kadant buys carefully at disciplined multiples, occasionally overpaying for minor acquired product lines before winding them down. While this record reflects disciplined capital allocation, it stops short of flawless deal execution—a distinction that matters for a strategy reliant on continuous deployment.
The more significant analytical consideration is the composition of top-line growth.
Acquisitions completed since 2013 generated 64% of forecast 2024 adjusted EBITDA.3 Isolating 2025 operating performance reveals the extent of this M&A reliance. Consolidated revenue remained flat at $1.052 billion in 2025, but organic revenue declined 4%, driven by a 12% organic decline in Industrial Processing.1 Acquisition contributions of $36.7 million and favorable foreign exchange of $7.0 million offset a $44.8 million organic top-line contraction.1 In the first quarter of 2026, revenue increased 18% and Industrial Processing revenue grew 37%, propelled primarily by contributions from Clyde Industries and Babbini.20 Similarly, second-quarter 2026 revenue increased 23% to a record $312.9 million, consisting of 13 percentage points from acquisitions, 2 percentage points from currency movements, and 8 percentage points of organic growth.10
Kadant's strategic targets acknowledge this structural reliance. The company's 2024–2028 financial plan assumes 3% to 5% annual organic growth alongside 6% to 8% acquisition growth, targeting $1.5 billion to $1.8 billion in revenue by 2028.3 Achieving these targets requires identifying, negotiating, and closing unannounced acquisitions in a market where Chief Executive Officer Jeffrey Powell noted that private equity buyers often drive transaction pricing based on available leverage.23
Balance-sheet management has remained conservative across recent cycles. Kadant's credit-agreement leverage ratio dropped below 1.0x at year-end 2024, rose to 1.33x following the Clyde acquisition at year-end 2025, declined to 1.27x in the first quarter of 2026, and increased to 1.72x after borrowing $181.8 million to fund the Kadant Profil transaction.82012 Free cash flow generation enabled debt repayments of $122.2 million in 2025, roughly 42% of the prior year-end balance, following debt repayments of $124.5 million in 2024.823 In September 2025, the company expanded its revolving credit facility from $400 million to $750 million while extending maturity from November 2027 to September 2030, leaving $383.2 million in available capacity at year-end alongside an uncommitted $200 million incremental facility.1 Free cash flow reached a record $154.3 million in 2025, supported by record operating cash flow of $171.3 million.1
Capital deployment priorities favor acquisitions and debt reduction over share repurchases. Although Kadant's board authorized up to $50.0 million in share repurchases for the period from May 15, 2025, to May 15, 2026, the company repurchased no shares under that authorization—nor under the previous $50.0 million program that expired in May 2025.1 Capital was directed primarily toward acquisitions, debt reduction, and dividend payments totaling $15.8 million in 2025 against $154.3 million in free cash flow.1 Through revealed capital allocation preference, management has demonstrated that it views incremental capital as more valuable when deployed into acquisitions than when used to buy back stock.
VII. Management, Capital Allocation & Credibility
The Acquirer as Chief Executive
Jeffrey L. Powell did not arrive at Kadant as an operator. He joined in January 2008 as vice president, new ventures, with principal responsibility for acquisition-related activities.1 Before that, he had been chairman and chief executive of Castion Corporation, a manufacturer of industrial wastewater treatment systems, from 2003 to 2007, and earlier held management positions at Thermo including chief executive and president of one of its publicly traded subsidiaries.5 He rose through supervisory responsibility for fiber processing, wood processing, and fiber-based products, became co-chief operating officer in March 2018, president in April 2019, and chief executive in July 2019.1 He is 67.1
The salient fact about Powell is structural rather than personal. The executive now running a company whose growth plan depends on buying roughly three businesses a year was originally hired to buy businesses. That is either tight alignment of skill to strategy or a standing bias toward acquisition as the answer to every problem. The evidence leans toward the former—the deals have been small, priced in single-digit EBITDA multiples, concentrated in adjacent niches, and integrated without visible disruption—but investors should be clear-eyed that Kadant's leadership selection is itself an expression of its capital allocation identity.
Michael J. McKenney has been chief financial officer since June 2015 and executive vice president since March 2018, but his tenure runs far deeper: corporate controller from 1997, vice president of finance and chief accounting officer from 2002, and before that controller of the division Kadant acquired from Albany International.1 He has been inside the company, in a finance seat, for more than thirty years, and before that worked at Albany International and Coopers & Lybrand.1
On earnings calls he provides a level of financial detail uncommon among mid-cap industrial peers: reading out numbers analysts ask for, including backlog splits, current assets and current liabilities, organic bookings by category, and capital versus parts within each segment. In the second quarter of 2026, when an analyst estimated the equipment backlog at $182 million, McKenney confirmed the figure exactly and noted the analyst had been equally accurate the prior quarter.12 For a small-cap company covered by a handful of sell-side analysts, that degree of voluntary granularity is a choice.
How They Get Paid
Incentives. The annual cash incentive plan uses exactly two equally weighted metrics: growth in adjusted diluted earnings per share versus the average of the prior two fiscal years, and adjusted return on average stockholders' equity.5 Long-term equity is roughly 80% performance-based restricted stock units measured against a single year of adjusted EBITDA, followed by three-year time vesting; the company has not granted stock options to anyone since 2013.5 There is no relative total shareholder return metric, no multi-year performance period, and—contrary to a widespread assumption about the company—no return-on-invested-capital metric in the plan at all.
Two operational consequences follow.
The favorable one: the adjusted EBITDA target for the performance RSUs explicitly excludes results from acquisitions made during the year.5 Executives cannot hit their equity target by buying revenue. For a serial acquirer, that is a well-designed guardrail and precisely the sort of detail that separates disciplined compounders from empire builders.
The unfavorable one: return on average stockholders' equity is leverage-sensitive by construction. Debt-funded acquisitions add earnings without adding proportionally to the equity denominator. In fiscal 2025 the mechanism was visible. Adjusted diluted EPS came in 9.22% below the prior two-year average, producing a bonus factor of 0.52. Adjusted return on average equity was 11.82%, producing a bonus factor of 2.43. Weighted equally, executives earned 148% of target cash bonus in a year when adjusted EPS fell from $10.28 to $9.26 and adjusted EBITDA declined 6%.58 Powell's total 2025 compensation was $5,519,261, against a median employee's $59,810—a ratio of 92 to 1.5 Shareholders approved the compensation program with roughly 91% support at the 2025 annual meeting: comfortable, but below the 95%-plus threshold that signals no concern.5
A second item belongs alongside the first rather than in a distant footnote. On February 19, 2026, Kadant changed its definition of adjusted EPS to add back recurring intangible amortization. Management presented it as responsive to investor requests and as improving comparability with peers and with the company's own EBITDA and cash flow measures—all defensible arguments, and widely used by serial acquirers. The effect was arithmetically large: 2026 adjusted EPS guidance moved from $10.40–$10.75 to $12.53–$12.88, and 2025 was restated from $9.26 to $11.01.8 Weeks later, the board amended the cash incentive plan to permit the same adjustment.5
While adjusting for non-cash amortization is common practice, the sequence of events—redefining the headline metric upward, then aligning the bonus metric to the new definition—warrants analytical scrutiny. It matters more than usual here because intangible amortization was projected to grow 22% in 2026, and because goodwill of $555.6 million plus net intangible assets of $350.4 million together equal roughly 92% of Kadant's $979.8 million of shareholders' equity.81 The balance sheet is mostly purchase accounting. KPMG, the company's auditor since 2012, identified the valuation of the Clyde customer-relationships intangible as a critical audit matter for fiscal 2025.1
Promises Versus Outcomes
Promises versus outcomes. This is where Kadant becomes testable, because it publishes five-year targets and then scores itself against them in public.
The scorecard from the December 2024 investor day is refreshingly unflattering in places. For the plan running to 2017: a revenue target of $500–$550 million against $515 million actual; adjusted EBITDA target of $60–$80 million against $92 million; adjusted EPS target of $4.00–$5.00 against $4.49. For the plan to 2021: revenue target $700–$800 million against $787 million; EBITDA target $100–$125 million against $159 million; EPS target $5.00–$6.00 against $7.83. For the plan to 2023: a revenue target of $1.0–$1.2 billion against $958 million, a miss; an adjusted EBITDA target of $210–$230 million against $201 million, also a miss; but an adjusted EBITDA margin target of 20.0% against 21.0% delivered, and an adjusted EPS target of $8.00–$9.00 against $10.04.3
The pattern is consistent across three completed cycles: Kadant systematically beats its own profitability and per-share targets while missing or barely meeting its revenue targets. The company is better at making a dollar of revenue more profitable than it is at forecasting total volume. That is worth holding in mind when evaluating a 2028 plan that calls for revenue between $1.5 billion and $1.8 billion.
The shorter-horizon record is less flattering still. In February 2025, guiding the year ahead, McKenney set 2025 revenue guidance of $1.040–$1.065 billion and adjusted EPS of $9.70–$10.05, and told investors the second half "will be significantly stronger than the first half."23 Executive commentary added that historical industrial cycles indicated customer capital spending had to turn, as customers could not underinvest indefinitely. Revenue landed at $1.052 billion, inside the range. Adjusted EPS landed at $9.26—below the bottom of the original guidance—as capital equipment revenue fell 16%.81
Management addressed the shortfall directly rather than reframing it. On the fourth-quarter 2025 call Powell acknowledged being "a little bit gun-shy because we thought things were going to strengthen," noted the company had expected improvement at the end of 2024 and then again at the end of 2025, and explicitly set conservative 2026 guidance as a consequence.8 He also restated the company's self-description: "we tend to always try to underpromise and overdeliver."8
The evidence on that self-description is split by horizon, and both halves are true. At the quarterly level it holds: adjusted EPS beat the high end of guidance by $0.43 in the first quarter of 2026 and by $0.44 in the second.2010 At the annual level, 2025 was a miss against the initial guide. On the multi-year industrial capital cycle, Kadant has now been wrong about timing for three consecutive years—not uniquely so among industrial suppliers, but repeatedly and in the same direction.
That is the fair synthesis of this management team: candid, transparent on operational numbers, disciplined on price, structurally biased toward acquisition, compensated on metrics that flatter leverage, and persistently optimistic about a recovery that keeps sliding right.
VIII. Helmer's 7 Powers & Porter's 5 Forces Deep-Dive
Evaluating Kadant's strategic position requires answering a central economic question: why can the company consistently command a price premium from industrial customers? Hamilton Helmer's 7 Powers framework and Michael Porter's 5 Forces provide the analytical structure to evaluate the durability—and limitations—of that pricing power.
The Powers That Apply
Switching costs represent Kadant's primary competitive power, though they remain conditional rather than absolute. The mechanism rests on downtime asymmetry: the cost of a component failure far exceeds its purchase price inside a machine whose exact specifications Kadant knows from installing the original equipment. This position is reinforced by precise dimensional engineering, field technicians embedded in customer facilities, and a commercial reality where a plant manager's personal risk from an operational failure outweighs any savings from a lower-cost alternative.
However, this power is bounded within a price-elastic range. Chief Executive Officer Jeffrey Powell noted that in 2025, competitors aggressively targeted Kadant's customer base, occasionally securing trial installations before being displaced later in the year.8 Switching costs that demand continuous field defense reflect a sustainable price premium rather than absolute customer lock-in.
Process power forms the second major pillar of Kadant's advantage, grounded in decades of specialized engineering. This includes proprietary metallurgy in wear blades, extensive dimensional libraries covering thousands of machine configurations, and precise application data on how specific paper grades interact with roll surfaces at high speeds. To reinforce this capability, Kadant operates dedicated research and development facilities across the United States, Europe, and Canada where customers simulate operating conditions.1
Kadant's regulatory filings clarify the nature of this engineering moat. While holding numerous U.S. and foreign patents across all three segments expiring between 2026 and 2043, the company explicitly states that no single patent or group of patents is critical enough that its expiration would materially affect operations.1 The underlying protection stems not from broad legal barriers, but from accumulated, highly specific process know-how that remains economically unviable for competitors to replicate across small niche markets.
Cornered resource applies modestly, established primarily through external acquisition rather than internal innovation. Specialized technologies such as Clouth's ceramic blade manufacturing processes and Kadant Profil's patented near-net-shape steel rolling capability represent key proprietary assets.1419 Kadant acquired both technologies rather than developing them internally; in 2025, the company directed $190.0 million toward acquisitions compared to $15.3 million in research and development.1 Kadant functions primarily as an aggregator and commercializer of niche industrial technologies rather than an R&D incubator.
Scale economies exist predominantly within distribution, sales, and field service rather than centralized manufacturing. Kadant maintains a decentralized, asset-light structure that preserves acquired operating teams and brand identities.3 Scale advantages manifest in the ability to support global packaging producers across multi-facility footprints and seamlessly integrate newly acquired product lines into existing sales channels. This operational profile requires minimal manufacturing reinvestment, evidenced by 2025 capital expenditures of $17.0 million, or less than 2% of total revenue.1
Counter-positioning, network effects, and brand equity play virtually no role in Kadant's economics. The company operates without user-network dynamics or consumer brand recognition, relying instead on industrial relationships and technical execution.
The Five Forces, With Exceptions
Evaluating Kadant through Porter's Five Forces reveals an advantageous industry structure, though key structural risks remain concentrated within specific market segments.
Threat of new entrants remains low, driven primarily by market economics. Individual product niches present addressable markets that are too small to attract large industrial conglomerates, yet require too much localized technical service for low-cost overseas manufacturers to capture effectively. This structural barrier represents one of Kadant's most durable competitive protections.
Supplier power is generally low across raw materials such as steel, ductile iron, brass, bronze, aluminum, and composite polymers, which are available from multiple commercial vendors. However, Kadant notes that certain business units rely on a limited number of suppliers for critical components, where alternative sourcing could increase costs or face availability constraints.1 The acquisition of Kadant Profil directly addressed one such supply-chain vulnerability. A more concentrated risk exists in the fiber-based granules business, which depends on papermaking byproduct sourced from a small number of mills; Kadant acknowledges that mill closures would force the unit to secure alternative raw material sources.1
Buyer power is moderate overall, but customer concentration presents localized risks. At the consolidated level, no single customer accounted for more than 10% of revenue over the past three fiscal years, nor did any customer exceed 10% of sales within any individual segment.1 However, segment-level concentration is notable: Kadant's two largest oriented strand board customers collectively generated 12% of Industrial Processing revenue in 2025, 13% in 2024, and 10% in 2023 within a highly concentrated wood-processing sector.1 Furthermore, corporate filings identify ongoing consolidation among pulp and paper producers, alongside mill curtailments and shutdowns, as key headwinds in 2025.1 Continued customer consolidation increases buyers' leverage to challenge component pricing premiums over time.
Threat of substitutes represents a subtle structural risk. While direct substitutes for Kadant's wear parts are limited, the primary threat stems from technological substitution impacting its customers' end products. Company disclosures highlight several structural shifts: digital media eroding demand for printing and writing paper, composite building products replacing oriented strand board, and cleaner energy transitions reducing coal mining activity.1 Consequently, Kadant's long-term demand remains tied to the structural viability of the industrial end markets it serves.
Competitive rivalry varies across specific product lines rather than functioning as an industry-wide price war. Kadant holds leading market positions—typically ranking first or second—across most of its product categories.8 This market structure generally supports disciplined pricing, though regional competitors occasionally seek market share by accepting lower operating margins.
Overall, Kadant's competitive moat is robust, operationally grounded, and reflected in Flow Control's 52.3% gross margin. Maintaining this position requires continuous technical service and targeted capital deployment, as pricing power varies significantly across the company's three operating segments.
IX. Historical Falsification Stress Test: Bull vs. Bear Case & Risks
Myth Versus Reality
Myth versus reality. The consensus story on Kadant is that a 70%-plus aftermarket mix makes it recession-resistant — a quality industrial compounder that happens to sell into cyclical end markets. The company's own materials encourage this reading, describing "steady and predictable recurring revenue" that "reduces revenue volatility."3 That description is defensible. It is also incomplete in a way that has cost investors money before.
Testing thesis claim #3: that a high aftermarket mix insulates Kadant from downturns.
2009: The Test Case
The strongest disconfirming evidence sits in 2009, and it deserves to be walked through slowly rather than waved away as ancient history, because the mechanism has not changed.
Kadant's revenue fell from $329.2 million in 2008 to $225.6 million in 2009 — a decline of 31%. The company recorded a net loss of $5.9 million in 2009, following a net loss of $22.6 million in 2008 driven by that stock-preparation goodwill impairment plus a $15.4 million tax provision from applying a valuation allowance to certain deferred tax assets.22 Restructuring costs of $4.4 million followed in 2009, consisting primarily of severance.22
Now the part that actually tests the claim. Kadant's accessories product line — doctor blades and cleaning equipment, the archetypal consumable, the razor blade in the razor-blade model — saw revenue fall 24% in 2009, or 19% excluding currency.22 Water management revenue fell 36%; excluding currency, 33%. Stock preparation fell 32%.22 The company's own explanation was that paper producers curtailed production and maintenance projects to reduce costs in a difficult environment, cutting spending on capital equipment, spare parts and consumables alike.22
The mechanism is worth stating precisely because it is not intuitive. Consumable demand is a function of machine-hours, not of installed machines. When a mill takes capacity offline, blades stop wearing. When a mill is fighting for survival, it draws down its own spare parts inventory before reordering, deferring purchases by a quarter or two and amplifying the trough on the way down. The aftermarket is a shock absorber. It is not a shock eliminator.
The 2023–2026 evidence updates this without overturning it, and the update is genuinely favorable to the company. Organic revenue declined 4% in 2025 and Industrial Processing organic revenue fell 12%, driven by weak housing, mill closures and curtailments, and by cautious capital spending in China where trade tensions compounded sluggish conditions.1 But this time consumables held: parts and consumables revenue grew from $693.6 million in 2024 to $748.4 million in 2025 while capital revenue fell from $359.8 million to $303.8 million.1 Consolidated gross margin actually expanded 90 basis points to 45.2%, because the mix shifted toward parts.1 Adjusted EBITDA nonetheless fell 6% to $216.3 million and margin compressed from 21.8% to 20.6%, because Kadant lost the operating leverage that capital revenue provides.1
The calibrated verdict. The history does not reject the aftermarket claim. It narrows it substantially, and the narrowed version is the one investors should hold. Kadant's consumables mix protects gross margin through a downturn and materially reduces revenue volatility relative to a pure capital equipment maker. It does not protect revenue in a genuine industrial recession where customer operating rates collapse, and it does not protect EBITDA margin even in a soft-capital, stable-volume environment such as 2025. Anyone modeling Kadant as non-cyclical is modeling a different company.
The event that would falsify the revised claim is specific and observable: a period in which customer operating rates fall sharply and Kadant's organic parts and consumables revenue declines year over year. That has not happened since 2009. It happened decisively then.
The Activist's Memo
The activist's memo. What would a skeptical long-short investor press on?
First, that the reported compounding is substantially purchased rather than generated. If nearly two-thirds of adjusted EBITDA comes from businesses acquired since 2013, and the five-year plan requires 6% to 8% annual growth from further acquisitions, then a meaningful part of Kadant's multiple is a multiple on a deal pipeline. Deal pipelines are not contractual. Powell noted in February 2025 that an unusually large share of processes had failed to close the prior year, which he attributed to pricing and to sluggish target performance.23 Cheaper debt, or a more competitive market for small industrial assets, would raise Kadant's cost of growth directly.
Second, that capital is not being returned. Two consecutive $50 million buyback authorizations have gone entirely unused while the share count has drifted modestly higher through equity compensation.1 The defense is the disclosed 8.8x average acquisition multiple and management's stated average adjusted return on invested capital of 15% for significant acquisitions completed since 2013.3 That defense is credible, but it rests on management's own calculation using management's own definition, and it should be treated as a disclosed claim rather than an audited fact.
Third, the composition of the balance sheet. Goodwill and net intangibles of roughly $906 million against $979.8 million of Kadant shareholders' equity leaves thin tangible equity.1 There has been no large impairment in the modern era. There was a very large one the last time a genuine industrial recession arrived.
Fourth, governance structure. Kadant has a six-member board with staggered three-year terms, a chairman who is the former chief executive and who previously ran the failed composites business, and anti-takeover provisions listed among its own risk factors.51 This is a well-defended small-cap rather than a governance showcase, and the say-on-pay result is consistent with a shareholder base that notices.
Risk Radar
Risk radar, restricted to mechanisms that actually apply.
Capital cycle timing dominates the near term. Powell characterized bookings softness over the past two and a half years as unlike anything Kadant has seen outside a genuine recession, and attributed it to an investment environment in which capital and attention have been drawn toward artificial intelligence infrastructure and away from traditional industrial projects.12 His position is that demand is deferred rather than lost and that projects are rarely cancelled outright. That claim has partial support: of the seven or eight tracked projects that failed to close in 2025, one came through in the first quarter of 2026 and two more in the second.20 It also has a partial refutation from the same source — a couple of projects slated for 2026 were pushed to 2027 because of the Middle East conflict.20
Geographic and currency exposure. Roughly 50% of revenue in both 2025 and 2024 came from customers outside the United States, and about 30% of employees are in Europe.1 Europe is the acute weak spot. Powell described the European environment as facing stiff economic headwinds in the second quarter of 2026, noted that European customers are the most sensitive to energy prices because so many Kadant products are justified on an energy-payback calculation, and observed that customers there were again delaying decisions pending clarity.12 A weaker dollar added $7.0 million to 2025 revenue; it can subtract as easily.1
Tariffs and input costs. Powell called the volatility and magnitude of 2025 tariffs "quite challenging," and argued that the weekly policy changes shocked customers into a wait-and-see posture more than the tariff levels themselves did.8 Kadant benefited from tariff refunds in the second quarter of 2026, though that benefit was largely offset by the Kadant Profil purchase-accounting drag.12
China. The 10-K carries specific China risk factors covering government policy, the variability of capital equipment sales, and the bankers' acceptance drafts Kadant's Chinese subsidiaries receive from customers.1 In 2022 local authorities requested that Kadant relocate one of its Chinese facilities, which the company completed in 2023 following negotiations.1 There is also an underappreciated upside channel running the other way: China's ban on imported wastepaper forced domestic pulp mill construction, which is precisely the market Clyde's boiler cleaning technology serves.8
Data centers as an indirect driver. Powell has argued that data center construction pulls Material Handling products through aggregates, sand, concrete, copper and aluminum processing — all materials that must be mined, screened, sized and conveyed by equipment Kadant or its competitors build.8 The linkage is real and genuinely non-obvious. It is also second-order, unquantified in any Kadant disclosure, and should not be capitalized into a valuation.
The Investment Spine
Why Kadant wins from here. The affirmative case rests on things that are observable rather than asserted. Flow Control's 52.3% gross margin and 27.7% segment EBITDA margin are evidence of pricing power in a business whose inputs are commodity steel.110 The installed base is old and getting older, and parts demand has run ahead of what operating rates alone would predict for two consecutive years.8 The acquisition machine has a documented sourcing advantage. And the leading indicators have turned: book-to-bill reached a three-year high of 1.14 in the first quarter of 2026, backlog rose to $340 million by the second quarter, and organic capital revenue grew 23% in that quarter.2010
Why Kadant may lose. The bear case requires nothing to break. It requires two ordinary things to happen simultaneously: acquisition multiples to rise, and the capital cycle to stay deferred. In that world, organic growth hovers near zero, the 2028 revenue target becomes unreachable without paying up, EBITDA margin stalls below the 23%-plus target because operating leverage never returns, and a company trading at roughly 24 times the midpoint of its own 2026 adjusted EPS guidance gets re-rated toward the cyclical industrial supplier it partly is.122 Add a consolidating packaging customer base testing the price premium on wear parts, and the compounding story becomes an ordinary machinery story.
X. Playbook & Key Investing Lessons
Lesson 1: The best hunting ground is a market too small to be worth attacking. Kadant's structural protection is not technological. It is that a global market for rotary joints in drying cylinders cannot support the fixed cost of a serious challenge from a large diversified industrial, and cannot be served remotely by a low-cost manufacturer because the primary value sits with the field engineer standing in the mill. Investors seeking this pattern should ask one specific question: is the addressable market large enough to sustain the incumbent's operating margins, but small enough to discourage larger strategic entrants? That combination is rare in industrial manufacturing—and represents a durable structural moat precisely because the underlying markets cannot easily be scaled into target assets for large acquirers.
Lesson 2: Price the downtime, not the part. The key operational relationship is the cost of machine failure divided by the cost of the replacement component. When that ratio reaches hundreds or thousands to one, the buyer stops optimizing strictly on unit price and prioritizes operational certainty, allowing the supplier to capture a premium that appears indefensible on a pure bill of materials. A doctor blade with a working life measured in hours or months, operating inside a machine that cannot be stopped cheaply, serves as the textbook case.1 The accompanying risk is that this pricing power weakens when a customer's business faces severe financial distress, as a mill fighting for survival will attempt lower-cost product substitutions it would otherwise avoid.
Lesson 3: Aftermarket transformation is real, and it is bought far more often than built. Kadant did not build its way to a 71% consumables revenue mix through organic product launches alone. It acquired its way there—purchasing The Johnson Corporation in 2005, the Clouth Group in 2021, Key Knife in 2024 with its nearly 100% aftermarket revenue base, and Kadant Profil in 2026 featuring a similar consumable profile.414320 The underlying insight is that installed equipment bases can often be acquired from founders, family owners, or employee-owned businesses that never fully monetized the wear-parts stream, allowing an acquirer with a global service network to extract higher cash flows from identical assets. The discipline required to execute this strategy is maintaining single-digit purchase multiples, which requires a strict willingness to walk away from overpriced auctions.
Lesson 4: A failed diversification is only a lesson if the institution actually changes. Kadant's composite-decking failure created a lasting strategic boundary. Over two decades later, every subsequent transaction has remained strictly within business-to-business industrial processing markets, aligning with corporate acquisition criteria that emphasize mission-critical components for process industries.3 That demonstrates genuine organizational learning. However, investors should distinguish strategic discipline from executive accountability. The division head who oversaw that failed product line subsequently rose to chief executive officer and board chairman.5 Both facts exist alongside one another: the former highlights operational focus, while the latter indicates that board oversight did not impose individual career penalties for historical capital misallocation.
Lesson 5: Read the company's own scorecard before reading anyone else's model. Kadant provides transparency that few peers match by publishing its prior five-year targets directly alongside actual performance—including historical misses—in filings submitted to regulators.3 The pattern across three completed multi-year plans reveals that management systematically beats its profitability and earnings targets while missing or barely hitting its top-line revenue goals. This historical track record offers a far more reliable guide to management's forecasting bias than any single annual guidance range.
The Three KPIs That Matter
The three KPIs that matter from here.
First, organic capital-equipment bookings and the book-to-bill ratio. Key analytical debates surrounding Kadant depend on this metric. It indicates whether deferred customer capital spending will translate into orders, whether operating leverage will return to expand margins toward management's 23%-plus adjusted EBITDA target, and whether the 2028 revenue goal of $1.5 billion to $1.8 billion is achievable without overpaying for acquisitions. Management discloses these underlying inputs quarterly, including total bookings, the split between capital and parts, total backlog, and the capital component within backlog.
Second, organic parts and consumables revenue growth—measured on an organic basis rather than top-line total. Consolidated consumables growth can mask underlying trends when augmented by acquisitions of wear-parts suppliers. Organic parts growth serves as the direct test of Kadant's competitive moat, indicating whether the company retains pricing power against European original equipment manufacturers and regional low-cost competitors, and whether the aging installed-base tailwind remains intact. In the fourth quarter of 2025, organic parts revenue rose 3% while organic capital revenue declined 7%.8 A transition of organic parts growth into negative territory would signal a fundamental challenge to the underlying investment thesis.
Third, the credit-agreement leverage ratio, evaluated alongside transaction cadence. This leverage metric reflects the overall health of Kadant's capital allocation model. The historical pattern involves raising net leverage to between 1.5x and 2.0x for platform acquisitions, followed by using strong free cash flow to repay 40% or more of the debt within twelve months.812 A credit leverage ratio that remains elevated across multiple consecutive quarters would signal either reduced cash conversion or heightened risk tolerance. Conversely, a leverage ratio that drops near zero and remains there would indicate a slowing acquisition pipeline—a key risk for a strategic model designed to generate over half of its long-term growth through acquisitions.
XI. Outro & Recommended Earnings Call Deep-Dives
Three earnings calls repay close examination, best reviewed in sequence to highlight how management's operational outlook evolved across consecutive periods.
Call One: The Promise
The fourth-quarter 2024 call, held February 13, 2025. This call established baseline expectations. Management set initial 2025 revenue guidance of $1.04 billion to $1.065 billion and adjusted earnings per share of $9.70 to $10.05, stated explicitly that the second half of the year would be significantly stronger than the first, and framed the industrial capital recovery as a matter of timing rather than probability.23 In the exchange on acquisition pricing, Chief Executive Officer Jeffrey Powell explained that private equity buyers set clearing prices based on available leverage and that an unusual number of deal processes had collapsed before closing—offering a clear illustration of how Kadant evaluates asset competition.23 The call also featured a detailed discussion of the December 2024 investor day targets, which remain the company's primary long-term yardstick.
Call Two: The Reckoning
The fourth-quarter 2025 call, held February 19, 2026. This call delivered the operational reckoning. Full-year adjusted earnings per share landed below the low end of initial guidance, while the adjusted EBITDA margin fell to 20.6%.8 Three core sections warrant scrutiny. The prepared remarks contain management's clearest explanation of why the high-margin parts business outperformed underlying customer operating rates. The analyst Q&A on competitive intensity features Powell's candid assessment of how rivals attempt to undercut consumable pricing and how localized technical support defends that franchise. Finally, the closing section details the shift in adjusted EPS methodology alongside the announcement of the €157 million Kadant Profil acquisition—two structural decisions that alter the accounting baseline for subsequent quarters.8
Call Three: The Possible Inflection
The second-quarter 2026 call, held August 5, 2026. This call highlighted a potential inflection in capital spending. Kadant reported record quarterly revenue of $312.9 million, record adjusted EBITDA of $68.1 million representing 21.8% of sales, and adjusted EPS of $3.42 that exceeded the high end of guidance, while raising full-year revenue expectations to $1.19 billion to $1.21 billion with adjusted EPS of $12.43 to $12.68.1012 The most critical analytical details emerged during the Q&A: confirmation that organic capital equipment revenue grew 23% in the quarter, progress updates on large packaging conversion projects worth $10 million to $25 million each, an $8 million aerospace order signaling potential expansion for the Flow Control franchise, and Chief Financial Officer Michael McKenney's explicit acknowledgment that major new commitments would primarily generate 2027 revenue rather than 2026.12
Evaluated together, these three transcripts capture Kadant's central investment tension: a business with strong unit economics, a proven acquisition architecture, and a conservative balance sheet, operating through a third year of deferred capital cycles that management has repeatedly struggled to time. Whether the second quarter of 2026 marks a sustained cyclical recovery or another brief pause remains an open empirical question—one that will be settled by organic bookings rather than call transcripts.
References
-
Kadant Inc. Annual Report on Form 10-K for the fiscal year ended January 3, 2026 — U.S. Securities and Exchange Commission, 2026-03-03 ↩↩↩↩↩↩↩↩↩↩↩↩↩↩↩↩↩↩↩↩↩↩↩↩↩↩↩↩↩↩↩↩↩↩↩↩↩↩↩↩↩↩↩↩↩↩↩↩↩↩↩↩↩↩↩↩↩↩↩↩↩
-
Kadant Inc. 2024 Investor Day Presentation (Form 8-K, Exhibit 99.2) — U.S. Securities and Exchange Commission, 2024-12-12 ↩↩↩↩↩↩↩↩↩↩↩↩↩↩↩↩↩
-
Kadant Inc. Annual Report on Form 10-K for the fiscal year ended December 31, 2005 — U.S. Securities and Exchange Commission, 2006-03-16 ↩↩↩↩↩↩↩↩↩↩↩↩↩↩↩↩↩↩↩↩↩↩↩
-
Kadant Inc. Definitive Proxy Statement on Schedule 14A — U.S. Securities and Exchange Commission, 2026-04-01 ↩↩↩↩↩↩↩↩↩↩↩↩
-
CPSC and Kadant Composites LLC Announce Recall of GeoDeck Composite Decking — U.S. Consumer Product Safety Commission, 2005-08-04 ↩
-
Kadant Inc. Annual Report on Form 10-K for the fiscal year ended December 29, 2012 — U.S. Securities and Exchange Commission, 2013-03-13 ↩↩↩
-
Kadant Reports Fourth Quarter and Fiscal Year 2025 Results (Form 8-K, Exhibit 99.1) and accompanying fourth-quarter 2025 earnings conference call — U.S. Securities and Exchange Commission, 2026-02-18 ↩↩↩↩↩↩↩↩↩↩↩↩↩↩↩↩↩↩↩↩↩↩↩
-
Kadant Inc. Annual Report on Form 10-K for the fiscal year ended December 29, 2018 (2016 acquisition note) — U.S. Securities and Exchange Commission, 2019-02-26 ↩
-
Kadant Reports Second Quarter 2026 Results (Form 8-K, Exhibit 99.1) — U.S. Securities and Exchange Commission, 2026-08-04 ↩↩↩↩↩↩
-
Kadant Inc. second-quarter 2026 earnings conference call presentation (Form 8-K, Exhibit 99.2) and accompanying call — U.S. Securities and Exchange Commission, 2026-08-04 ↩↩↩↩↩↩↩↩↩↩
-
Kadant Completes Acquisition of Syntron Material Handling (Form 8-K, Exhibit 99) — U.S. Securities and Exchange Commission, 2019-01-02 ↩
-
Kadant Inc. Annual Report on Form 10-K for the fiscal year ended January 1, 2022 — U.S. Securities and Exchange Commission, 2022-03-01 ↩↩↩↩↩↩↩↩
-
Kadant Inc. Annual Report on Form 10-K for the fiscal year ended December 28, 2024 — U.S. Securities and Exchange Commission, 2025-02-25 ↩↩↩
-
Kadant Acquires KWS Manufacturing Company (Form 8-K, Exhibit 99) — U.S. Securities and Exchange Commission, 2024-01-24 ↩
-
Kadant Acquires Clyde Industries (Form 8-K, Exhibit 99.1) — U.S. Securities and Exchange Commission, 2025-10-07 ↩
-
Kadant to Acquire voestalpine BÖHLER Profil (Form 8-K, Exhibit 99.1) — U.S. Securities and Exchange Commission, 2026-01-29 ↩
-
Kadant Completes Acquisition of voestalpine BÖHLER Profil (Form 8-K, Exhibit 99.1) — U.S. Securities and Exchange Commission, 2026-04-30 ↩↩↩
-
Kadant Reports First Quarter 2026 Results (Form 8-K, Exhibit 99.1) and accompanying first-quarter 2026 earnings conference call — U.S. Securities and Exchange Commission, 2026-05-05 ↩↩↩↩↩↩↩↩↩
-
Kadant Completes Acquisition of Key Knife, Inc. (Form 8-K, Exhibit 99) — U.S. Securities and Exchange Commission, 2024-01-02 ↩
-
Kadant Inc. Annual Report on Form 10-K for the fiscal year ended January 2, 2010 — U.S. Securities and Exchange Commission, 2010-03-16 ↩↩↩↩↩↩
-
Kadant Reports Fourth Quarter and Fiscal Year 2024 Results (Form 8-K, Exhibit 99.1) and accompanying fourth-quarter 2024 earnings conference call — U.S. Securities and Exchange Commission, 2025-02-12 ↩↩↩↩↩↩
 LinkedIn
 WhatsApp
 Reddit
 Hacker News
 Email
Email Kindle
 RSS Feed
 Spotify
 Apple Podcasts
 Amazon Music
 Audible
 YouTube