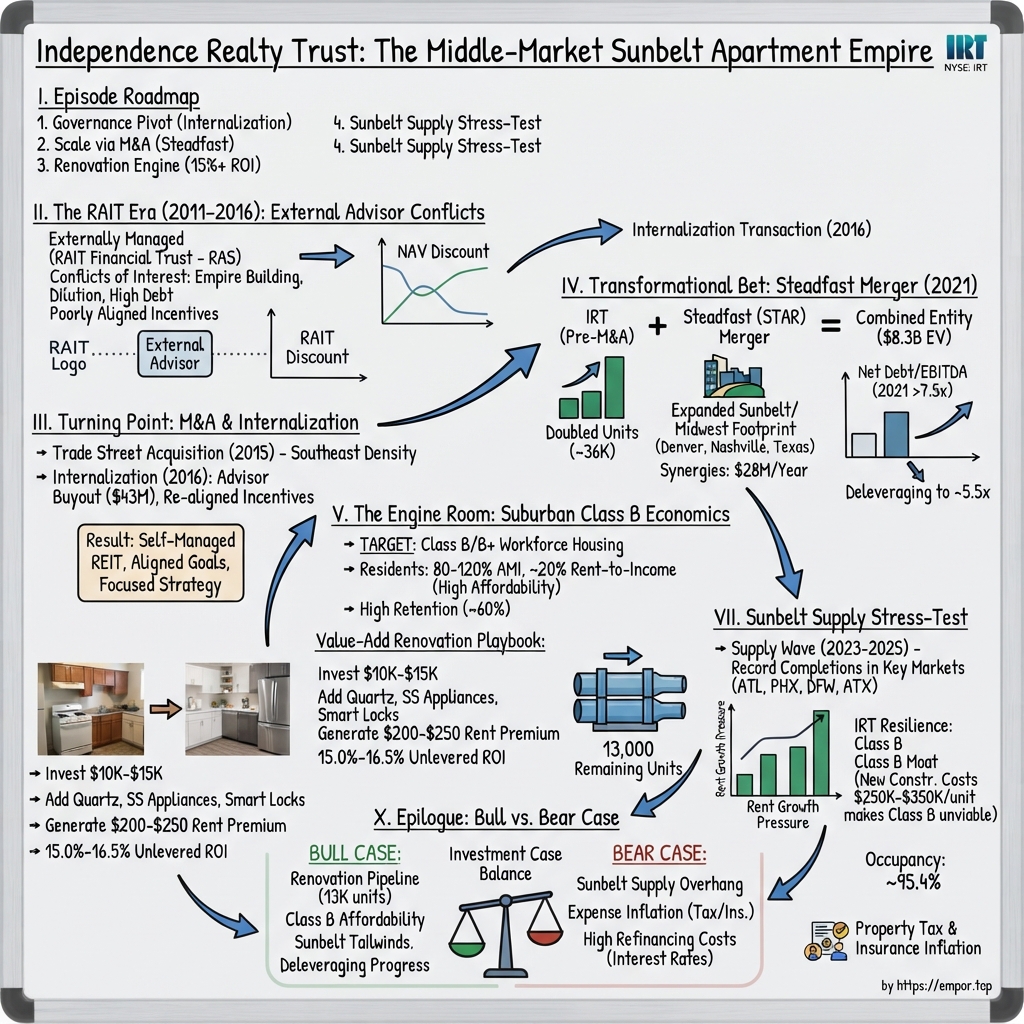
Independence Realty Trust: The Middle-Market Sunbelt Apartment Empire
I. Introduction & Episode Roadmap
On the morning of August 4, 2026, a Philadelphia real estate investment trust with a market value of roughly $3.9 billion held an earnings call that appeared unremarkable on the surface. Same-store net operating income had grown 1.2%. Occupancy had slipped twenty basis points to 95.0%. Core funds from operations came in at $0.28 a share — precisely what it had been a year earlier.12
Yet the call ran long as analysts from Citi, KeyBanc, Wells Fargo, RBC, BMO, Barclays, UBS, Deutsche Bank, Baird, and Green Street queued up to ask variations of a single question: is the bottom in?
Buried inside those headline numbers was a sequence Independence Realty Trust had not reported in three years. New lease pricing — the purest gauge of real-time pricing power — had improved from down 3.9% in the first quarter, to down 2.7% in the second quarter, to down 1.1% in July. With roughly 65% of August's new leases already signed, the figure had crossed into positive territory.1
President and CFO Jim Sebra flagged the unusual disclosure with a warning: "investors should not expect monthly data to continue to be presented on future calls." Management was revealing its monthly data precisely once because the trajectory had become the central story.1
This is the story of how a corporate afterthought developed into a major player in middle-market suburban housing.
Independence Realty Trust — traded under ticker IRT on the NYSE — owned and operated 116 apartment communities containing 33,898 units as of June 30, 2026, spread across the Southeastern and Midwestern United States.2 Rather than glass towers in coastal gateway markets, IRT owns three-story garden-style apartment buildings in Atlanta, Dallas, Indianapolis, Columbus, Oklahoma City, Louisville, Raleigh, Nashville, and Denver. Built mostly in the 1990s and 2000s, these units rent for an average of $1,597 a month.2 It represents, by design, the unglamorous middle of the American housing market.
That positioning forms the core thesis, though it warrants critical examination rather than uncritical endorsement. Institutional REIT giants like AvalonBay and Equity Residential spent decades competing for high-barrier coastal Class A assets. IRT pursued the opposite strategy: Class B and B+ suburban workforce housing in non-gateway markets, located near solid school districts and essential retail. Management describes these submarkets as "unlikely to experience substantial new apartment construction."3 The underlying premise is that middle-market housing is structurally protected because elevated land, labor, and financing costs prevent developers from economically building competing units at $1,600 a month.
That premise has been stress-tested by a massive Sunbelt apartment construction boom and the fastest interest-rate tightening cycle in forty years. IRT survived both, though whether it emerged with a durable competitive advantage remains an open question.
Four main themes define this narrative:
First, governance. IRT originated as a fee-generating vehicle for an external manager — a subsidiary of a Philadelphia specialty finance firm that ultimately headed into bankruptcy. How IRT acquired its independence outlines how a REIT earns a competitive cost of capital.
Second, scale through consolidation. The December 2021 merger with Steadfast Apartment REIT doubled IRT's portfolio overnight, but it also expanded its leverage just as interest rates began to rise.
Third, the renovation program — a standardized unit interior upgrade initiative that management considers its most effective capital allocation tool, reporting a 16.4% return on cost in the second quarter of 2026.2 Assessing that performance requires examining how the metric is calculated, as definition and accounting choices directly influence the reported yield.
Fourth, the supply shock — the 2023 through 2025 influx of new Sunbelt apartments that compressed regional pricing power, testing whether IRT's middle-market affordability offered a genuine competitive moat or merely a slower rate of rent decline.
The story begins with a company that was not initially designed to operate independently.
 Subscribe on LinkedIn
II. The Genesis: External Advisor Conflicts & The RAIT Era (2011–2016)
In the years surrounding IRT’s public listing, RAIT Financial Trust operated out of the 17th floor of 2929 Arch Street — the blue glass tower beside Philadelphia’s 30th Street Station known as the Cira Centre.4 RAIT was a commercial real estate lender that had spent the 2000s originating mezzanine debt and bridge loans. After suffering severe losses during the 2008 financial crisis, RAIT sought to generate steady fee income rather than credit risk. One vehicle designed for that purpose was a small apartment REIT it incubated in 2009 and prepared to float.
On August 13, 2013, Independence Realty Trust priced four million shares at $8.50 apiece — below its marketed range — raising approximately $34 million in gross proceeds to begin trading on the NYSE MKT.5 At listing, the company owned just eight apartment properties. Its chairman, Scott F. Schaeffer, had held the board chair since January 2011 and became chief executive officer in February 2013. Critically, he was simultaneously serving as the chief executive officer of RAIT.6
The governance conflict was immediate: the executive leading the external manager collecting advisory fees was also running the public company paying them.
In 2013, external management remained a common structure for small REITs, offering an appealing initial arrangement: a sub-scale company acquired an instant executive team, back-office infrastructure, and deal pipeline without paying overhead directly. In exchange, the REIT agreed to a fee schedule. Historically, fee structures for externally managed REITs were calculated on gross assets under management rather than per-share earnings growth.
This structure created clear economic incentives. When an advisor's compensation depends on total asset size, the incentive is to expand the portfolio — whether by issuing shares, taking on debt, or buying properties. None of those expansion moves required increasing funds from operations on a per-share basis to boost the advisor's revenue. Consequently, an externally managed REIT could expand its asset footprint while per-share value for equity holders stagnated.
Public markets priced this agency conflict accordingly. Externally managed REITs persistently traded at discounts to net asset value compared to internally managed peers, as investors demanded compensation for the governance risk. That discount created a self-reinforcing bottleneck: a REIT trading below net asset value cannot issue equity accretively to fund growth, leaving it trapped at a sub-scale size.
IRT’s early portfolio reflected these structural constraints. Properties were scattered across secondary and tertiary markets without submarket concentration, preventing regional economies of scale. Local property managers could not efficiently oversee distant assets across multiple states, and small property groupings lacked the scale to negotiate bulk vendor contracts. The portfolio was effectively worth less than the sum of its parts.
Compounding these governance hurdles was the deteriorating financial health of the external advisor itself. RAIT was not a stable sponsor quietly harvesting management fees; it was a leveraged commercial lender struggling under legacy crisis debts. Its financial trajectory steadily declined until August 2019, when RAIT Financial Trust filed for Chapter 11 bankruptcy protection. It entered a stalking-horse agreement to sell substantially all its assets to affiliates of Fortress Investment Group for approximately $174.4 million — a transaction approved by a Delaware bankruptcy judge in December 2019 despite objections from equity holders.7
That resolution highlighted the operational risk embedded in IRT's early structure. The external manager did not merely present misaligned incentives; it faced severe solvency issues. Management fees collected from IRT were helping service a distressed balance sheet. For IRT shareholders, governance risk was not an abstract academic concern, but a direct counterparty exposure.
The pressure for structural reform grew out of necessity for both entities. RAIT urgently needed liquidity, while IRT required an independent governance structure to lower its cost of capital and pursue sustainable growth.
Before IRT could negotiate its independence, however, it needed to achieve sufficient scale to make internalization viable.
III. The Turning Point: M&A Scaling & Internalization (2015–2019)
The initial strategic priority was acquiring operational density.
Trade Street Residential was a small, publicly traded apartment REIT concentrated in key Southeastern markets, including Charlotte, Raleigh, Atlanta, and Memphis. On May 11, 2015, IRT announced a definitive merger agreement to acquire Trade Street.8 The transaction closed on September 17, 2015, with IRT paying approximately $139.8 million in cash and issuing roughly 15.1 million shares; each Trade Street share converted into $3.80 in cash plus 0.4108 IRT shares.9
The acquisition immediately altered IRT's footprint, expanding its portfolio from 31 to 50 properties and raising its unit count 55% to 14,044.9
That 55% expansion mattered primarily because multifamily operating economics depend on local concentration. Operational efficiencies — such as regional maintenance oversight, shared turnover crews, market-level revenue management, and bulk vendor contracts across adjacent properties — require a critical density threshold. Trade Street did not merely expand IRT's asset base; it established local market concentration, elevating IRT into a company institutional investors had to evaluate.
The transaction also carried notable tradeoffs. IRT acquired properties six years into an extended multifamily expansion, utilizing equity that traded at a governance discount. Issuing discounted shares for market-priced assets can dilute intrinsic value per share even when expanding headline earnings. Furthermore, absorbing nineteen properties simultaneously into an outsourced management platform introduced significant integration risk.
The structural turning point arrived the following year.
On September 27, 2016, IRT announced a definitive agreement with RAIT to internalize its external management arrangements and separate from RAIT entirely.10 The structure had two pieces: IRT acquired its external advisor — a RAIT subsidiary — and acquired the assets and assumed certain liabilities of RAIT's multifamily property management business, including the management contracts on IRT's own buildings and on properties owned by RAIT and third parties.10 The purchase price was $43 million, subject to prorations.10 The internalization closed on December 20, 2016.11
Concurrently, IRT agreed to buy back approximately 7.3 million IRT shares held by RAIT subsidiaries. On October 5, 2016, IRT paid approximately $62.2 million to repurchase and retire those shares at $8.55 each.10
In total, IRT deployed roughly $105 million — $43 million for the advisory and management platform and $62 million to buy out its parent's equity stake — without acquiring new apartment units, entering new geographic markets, or adding resident revenue.
From a capital-markets perspective, however, the transaction fundamentally altered IRT's trajectory.
Internalization eliminated a primary institutional investor objection by halting fee leakage to a financially distressed sponsor. Bringing property management operations in-house enabled IRT to build internal execution capabilities rather than contracting them externally. The move also realigned executive incentives around core FFO per share, same-store net operating income, and balance sheet leverage while removing RAIT's equity overhang.
Schaeffer remained on both sides of the transition — remaining IRT's chairman and CEO while serving as RAIT's chief executive until December 2016, when he departed the parent.6 Following the separation, executive leadership was fully dedicated to IRT.
In the subsequent years, IRT executed a systematic capital recycling program: selling lower-growth, higher-capital-expenditure properties in submarkets where it lacked scale and reallocating capital into higher-density Sunbelt markets. Management describes this ongoing approach as disposing of assets "in markets where we lack scale and/or markets where management believes that growth is slowing" and redeploying the proceeds into higher-growth investments or debt reduction.3
With an internalized operating platform established, IRT launched the platform in 2018 that would become its primary earnings engine: the Value Add Initiative.3 Scaling that program required broader portfolio reach, which arrived three years later during a major market expansion.
IV. The Transformational Bet: The Steadfast Merger & Sunbelt Dominance (2021–2022)
In the summer of 2021, pandemic-driven shifts in remote work untethered millions of white-collar households from coastal metropolitan centers. Migration accelerated into Sunbelt markets like Phoenix, Tampa, Dallas, Atlanta, Nashville, and Charlotte. As apartment rents surged, institutional capital followed, compressing capitalization rates on Sunbelt multifamily properties to levels historically reserved for prime coastal assets.
Into that environment, on July 26, 2021, IRT announced an all-stock merger with Steadfast Apartment REIT (STAR), a non-traded REIT sponsored out of Southern California.12
The transaction was structured as an all-stock merger of equals. Each STAR share would convert into 0.905 IRT shares, leaving IRT and STAR shareholders each owning approximately 50% of the combined company.12 The board expanded to ten members — five from each side.12 Schaeffer remained chairman and CEO, Sebra continued as CFO, IRT's Farrell Ender served as president, and STAR's Ella Neyland became chief operating officer.12 The combined entity comprised 131 apartment communities containing approximately 38,000 units across sixteen states, with a pro forma enterprise value of roughly $7 billion.12
The strategic rationale aligned with IRT's market concentration goals. Steadfast introduced Denver and Nashville as new core markets while deepening IRT's footprint in Texas.12 The transaction transformed IRT from a regional player with scattered holdings into a REIT with density across ten major markets: Atlanta, Dallas/Fort Worth, Denver, Oklahoma City, Louisville, Columbus, Indianapolis, Raleigh-Durham, Houston, and Memphis.12 Management projected approximately $28 million in annual synergies — comprising $20 million from consolidating corporate and property management functions, and roughly $8 million operational.12
Merging with a non-traded REIT provided structural advantages for both parties. STAR shareholders gained daily liquidity through IRT's public stock listing. For IRT, acquiring a large, complementary Sunbelt portfolio via an all-stock transaction avoided competitive bidding against private equity suitors without requiring cash outlays.
Shareholders of both companies approved the merger on December 13, 2021, and the transaction closed on December 16, 2021. At the market close on December 15, the combined company carried an equity market capitalization of approximately $5.6 billion and a total enterprise value of approximately $8.3 billion.13
That $8.3 billion enterprise value marked the peak valuation of the enterprise. By March 31, 2026, IRT's total enterprise value — debt plus equity market capitalization — stood at roughly $6.0 billion.14 More than four years after the transaction closed, the company operated with a smaller total valuation. While part of this shift reflected deliberate portfolio dispositions, it primarily resulted from the sector-wide repricing of apartment assets in a higher interest rate environment.
This valuation decline raises a critical strategic question: did IRT acquire Steadfast at the market top?
While the transaction occurred near the peak of the asset valuation cycle, the all-stock fixed-ratio structure insulated IRT from cash-funded peak valuation risk. Because IRT did not issue debt or deploy cash reserves to fund the purchase, both shareholder bases absorbed subsequent asset repricing proportionally. Neither group extracted excess value from the other; instead, both remained tied to the same market cycle.
However, the transaction left IRT with an expanded debt load. Combining two leveraged portfolios created an entity carrying higher total debt than IRT had historically managed, just as the Federal Reserve initiated its sharpest rate-tightening cycle in four decades. Throughout 2022, IRT's net debt to adjusted EBITDA — measured before adjustments for acquisition and disposition timing — ran at 7.4x, 7.4x, and 7.5x across consecutive quarters.15
For an equity REIT, leverage in the mid-7x range does not signal immediate crisis, but it imposes strict financial constraints. It reduces capital allocation flexibility, draws scrutiny from rating agencies, and increases refinancing risk as fixed-rate debt maturities approach higher prevailing interest rates.
In the short term, strong operational performance masked these balance sheet risks. Surging Sunbelt rent growth delivered strong financial returns: 2022 same-store net operating income grew 13.7% for the full year, with core FFO per share up nearly 30%.15 Fourth-quarter core FFO more than doubled year-over-year to $66.8 million, reflecting the full-quarter contribution of the combined portfolio.15
These headline metrics reflected the temporary convergence of historic rent growth and a doubled asset base rather than an enduring operational moat. While management acknowledged the cyclical nature of these gains, the 2022 performance set an elevated benchmark that proved difficult to sustain as market conditions softened.
The same population inflows that drove 2022 rent expansion triggered an unprecedented multifamily development boom across the Sunbelt. As new supply delivered over the subsequent two to three years, market dynamics shifted from rent growth to pricing pressure.
Understanding how IRT navigated that supply influx requires examining the operational program built to support unit-level returns.
V. The Engine Room: Suburban Class B Economics & The In-House Renovation Playbook
Picture a two-bedroom apartment in suburban Indianapolis, built in 2003. Beige laminate countertops. White appliances with a faint yellow cast. Builder-grade oak cabinets with brass hardware. Vinyl flooring in the entry, carpet everywhere else. It rents for approximately $1,450 a month.
Two miles away, a mid-rise completed in 2024 offers quartz counters, stainless steel appliances, luxury vinyl plank flooring, a package room, and a pet spa. It asks $1,950, though it currently offers six weeks of free rent to sign.
IRT's central operating insight is that the gap between those two apartments consists mostly of interior finishes—and finishes are inexpensive relative to whole buildings.
This is the Value Add Initiative, launched in 2018.3 The mechanics are deliberately industrial. When a unit turns over, the crew executes a standardized scope: new countertops, updated appliance packages, cabinet refacing or replacement, hardware, lighting, flooring, and smart-home components like keyless entry and leak detection. Standardizing the scope across dozens of properties enables bulk material purchasing, vendor consolidation, and faster execution through repetition.
Through December 31, 2025, IRT had renovated 11,445 units at an average cost of $17,372 each, against an identified pipeline of 18,789 units across 61 properties.3 The reported return on total renovation cost was approximately 16.1%—and approximately 18.2% on the interior portion alone.3
Evaluating that headline figure, however, requires examining how the return is calculated.
The 2025 Form 10-K states the methodology explicitly: IRT multiplies the monthly rent premium per unit by twelve and divides by the renovation cost per unit. The rent premium is defined as the difference between the rental rate on the renovated unit—excluding the impact of concessions—and the market rent for a comparable unrenovated unit, as determined by management.3
Three analytical considerations follow from that definition.
First, the metric represents a gross rent-to-cost yield rather than a net return. It includes no deduction for incremental operating expenses, no deduction for vacancy incurred while the unit sits empty during construction, and no cost of capital. On the first-quarter 2026 earnings call, Schaeffer acknowledged the vacancy drag directly, noting that a value-add unit is out of service for roughly 20 to 30 days versus 7 to 10 days for a standard turn, which explains why the value-add portfolio inherently operates at lower occupancy.16 That vacancy friction represents a real economic cost omitted from the reported ROI.
Second, capital inputs have increased. In the second quarter of 2026, IRT completed 600 renovations at an average cost of $20,477 per unit and achieved a $279 monthly rent premium, producing a 16.4% return.2 For full-year 2025, average costs were $19,661 per unit with a $251 premium, yielding 15.3%.17 Compared to the cumulative program average of $17,372, construction cost inflation is visibly working through the program in real time. Yields held up because monthly premiums expanded alongside costs, but the margin of safety is narrower than the flat headline return suggests.
Third, the rent premium relies on management's internal assessment of comparable market rent rather than an audited market baseline. While IRT cross-references third-party rental data, the input remains an estimate produced by the entity evaluated on the metric.
Despite these qualifications, the program demonstrates tangible operational traction beyond the headline ROI. In the first quarter of 2026, the value-add portfolio generated approximately 3.2% NOI growth compared to roughly 50 basis points in the non-value-add portfolio.16 That 270-basis-point growth spread within the same company and geographic markets confirms that renovated units are outperforming unrenovated assets.
Schaeffer highlighted another strategic dynamic on the second-quarter call: renovated Class B units compete most directly with new Class A construction rather than traditional Class B stock. During the Sunbelt supply crest, newly delivered Class A developments offered aggressive concessions, temporarily compressing the rent premiums IRT could command on renovated units. As those competitor concessions burn off, management anticipates the rent premium will widen.1
Recent operational data aligns with that thesis, as the second-quarter 2026 monthly premium of $279 increased from $251 a year earlier.217
The secondary driver of the renovation program involves turn-time efficiency. When the initiative launched, completing a value-add unit required 30 to 35 days. Turn times have since fallen below 20 days.1 Schaeffer, who noted he was historically reluctant to push high renovation volumes due to occupancy drag and headline risk, told analysts that shortened turn cycles will allow IRT to scale execution from 2,000 to 2,500 units in 2026 toward 3,000 to 4,000 units annually.1
Deploying capital into 4,000 units annually at roughly $20,000 per unit equates to approximately $80 million in annual capital expenditures.1 Relative to IRT's 2025 adjusted EBITDA of $364.5 million, this represents a steady growth driver that can be fully funded out of organic cash flow rather than equity issuance.17 Schaeffer acknowledged that internal boundary on the same call, emphasizing that at 4,000 units annually, self-funded renovation reaches its practical ceiling, and that larger-scale external expansion requires a lower cost of capital.1
That admission underscores a core reality: the internal renovation engine is effective, but fundamentally bounded.
IRT's underlying thesis rests on workforce housing affordability. Management asserts that its price point—an average effective monthly rent of $1,597 across the same-store portfolio—sits sufficiently below new-construction replacement costs to insulate existing assets from direct supply competition.2 Meanwhile, single-family housing dynamics reinforce renter retention: elevated home prices and mortgage rates keep monthly ownership costs well above IRT's average rent across its core submarkets.
A notable disclosure gap exists regarding resident financials. IRT's 2025 Form 10-K does not report portfolio-wide resident rent-to-income ratios or average household income.3 While affordability metrics appear regularly in investor presentations, they do not form part of the audited annual filings.
The audited filings do, however, track resident retention. Full-year retention reached 59.8% in 2025 and 58.1% in the second quarter of 2026.172 The modest decline reflects a tactical trade-off: IRT deliberately pushed lease renewal pricing harder in 2026, accepting slightly lower retention to capture higher rate growth.
Beyond physical unit upgrades, IRT has expanded its operational technology stack. In 2025, the company deployed an AI leasing agent to handle prospect communications, refined bad-debt collections, and reduced unit turn durations.18 Its largest property-technology roll-out involves bulk internet. IRT installed property-wide gigabit Wi-Fi across 19,000 units at 63 communities, launching the service around July 1, 2026. Management expects the initiative to generate roughly $5.5 million in second-half revenue and $3.0 million in NOI, adding at least $0.01 per share to core FFO in 2027.181 Resident adoption reached approximately 70% in July, with management projecting 80% to 85% penetration by year-end as leases renew.1
Bulk Wi-Fi is an industry standard rather than a proprietary moat. However, its execution demonstrates the capability of IRT's internalized platform: the company identified a portfolio-wide ancillary revenue opportunity, negotiated a single contract, and deployed hardware across 19,000 units within six months. The externally managed 2013 predecessor could not have executed a similar initiative.
Ultimately, IRT's internal engine was built to generate self-funded growth during periods when market-wide rent growth slows. That capability became essential when Sunbelt market expansion stalled in 2023.
VI. Management, Governance, & Deleveraging Execution
Scott Schaeffer brings a unique background to the chief executive role at Independence Realty Trust. He became IRT's chairman in January 2011 and CEO in February 2013, while also serving two separate stints as president—from February 2013 to August 2014, and from May 2023 to September 2024.6 Prior to and during IRT's early years, Schaeffer led RAIT Financial Trust as CEO from February 2009 to December 2016 and as chairman from December 2010 to October 2016.6 He holds a Bachelor of Science in Commerce from Rider University.6
Unlike many REIT executives with backgrounds in brokerage or property development, Schaeffer built his career in structured finance and commercial lending. That origin influences his strategic posture. On earnings calls, he consistently resists expansion for its own sake. When asked in August 2026 about growth opportunities as market fundamentals improved, Schaeffer prioritized capital discipline over asset acquisition, stating that "it's all about the cost of capital" and adding, "We have always resisted growth for the sake of growth."1
Jim Sebra serves as the operational counterweight in executive leadership. Having served as CFO through the Trade Street acquisition, the internal management transition, and the Steadfast merger, Sebra was promoted to President and CFO on September 3, 2024, expanding his financial oversight to include direct responsibility for operational functions.19 Schaeffer framed the operational consolidation as a move toward "good corporate governance."19 Sebra holds a B.S. in Accounting from Saint Joseph's University and an MBA from Villanova, where he serves as an adjunct professor of finance.19
Sebra provides detailed operational reporting on investor calls, including direct disclosures regarding underperforming assets. When questioned about the Tisdale at Lakeline Station development in Austin, Sebra acknowledged that rental rate performance was "behind some of the initial underwriting we made when we entered," citing increased concession activity and pushing expected stabilization to the first quarter of 2027.1 Regarding the Flatiron property in Broomfield, Colorado, Sebra similarly noted that lease-up progress was running approximately one quarter behind plan on both occupancy and rental rates.16
IRT's executive compensation structure reflects a high degree of formulaic alignment with operational performance goals. The 2025 annual cash bonus was 75% objective, evaluated across five financial metrics: core FFO per share weighted at 40%, same-store NOI growth at 20%, operating margin at 15%, G&A as a percentage of revenue at 15%, and net debt to adjusted EBITDA at 10%.20 Performance outcomes in 2025 were mixed: core FFO per share came in at $1.17 against a $1.18 target and a $1.16 threshold; same-store NOI growth of 2.4% beat the 2.1% target; operating margin of 63.6% exceeded the 63.4% maximum performance level; G&A expense at 2.7% of revenue beat the 2.8% maximum limit; and net debt to adjusted EBITDA landed exactly on the 5.7x target.20
Long-term equity incentive awards balance objective market benchmark comparisons with discretionary board evaluations. IRT's 2023 performance share units (PSUs), covering the three-year period ended December 31, 2025, were certified at 131% of target on February 3, 2026.20 This payout reflected a 70% weighting to relative total shareholder return (TSR)—earned at 123% of target based on a 16% three-year TSR that ranked at the 62nd percentile of the NAREIT Apartment Index—and a 30% weighting to subjective criteria, which the board awarded at the maximum 150% rate.20 While relative TSR measures outperformance against apartment peers during broader sector drawdowns, awarding the maximum payout on subjective criteria contrasts with the moderate realization on objective returns.
Recent equity grants feature extended vesting horizons. The 2025 PSU awards measure relative performance against FTSE NAREIT Apartment Index members over a performance period ending December 31, 2027, with half of earned units vesting upon certification and the remaining half vesting on December 31, 2028.20 Time-based restricted stock units comprise the remaining 25% of annual equity awards.20
Executive compensation levels remain within standard industry bounds relative to IRT's $3.9 billion equity market capitalization. For 2025, Schaeffer's total compensation reached $5,266,937, comprising an $800,000 base salary, a $500,000 bonus, $2,825,675 in stock awards, and $1,127,262 of non-equity incentive plan compensation.20 Sebra's total compensation reached $2,477,308.20 Ownership guidelines mandate that the CEO hold company stock equal to five times base salary and other executive officers hold three times salary; all directors and executive officers complied or remained within their permitted phase-in window as of early 2026.20 As of March 16, 2026, Schaeffer beneficially owned 821,094 shares and Sebra held 338,638 shares out of 235,647,309 shares outstanding.20
Institutional ownership is led by passive index managers, with BlackRock holding 14.17% and Vanguard holding 13.75%. Active sector management is represented by real estate specialist fund Long Pond Capital, which held 12,301,684 shares, or 5.22%.20
The company's governance and capital discipline have been tested most directly by its balance sheet deleveraging execution. On October 30, 2023, facing elevated post-merger debt and rising interest rates, IRT announced a Portfolio Optimization and Deleveraging Strategy targeting the sale of ten properties across seven markets—exiting or reducing its presence in each—with the goal of lowering net debt to adjusted EBITDA by 0.8x to 0.9x and reaching the mid-5x range by year-end 2024.21
Management executed the disposition program as scheduled. Nine properties were sold by March 31, 2024, for gross proceeds of approximately $496.8 million, and the tenth closed on April 30, 2024, for $28.5 million, with all proceeds applied to debt reduction.22 By December 31, 2025, net debt to adjusted EBITDA reached 5.7x, inside the targeted range.17
Capital recycling continued along similar disciplined lines through 2025 and early 2026. IRT sold a Birmingham community for $111.0 million in February 2025 and a Louisville community for $50.0 million in November—the latter at a 5.2% economic cap rate, generating a $17.5 million gain—while acquiring a 280-unit Indianapolis property for $59.5 million and two Orlando communities for $60.3 million and $94.8 million, built in 2024 and 2019 respectively.318 On January 15, 2026, IRT acquired a 140-unit Columbus community for $29.5 million at a 5.6% economic cap rate, located two miles from existing IRT properties.318 This strategy sells older, higher-capex assets at low-5% cap rates to acquire newer properties with lower maintenance requirements while increasing local market density.
Debt maturities were restructured in tandem with property sales. In the fourth quarter of 2025, IRT entered a new $350 million four-year unsecured term loan and used the proceeds to repay a $200 million term loan and mortgages maturing in 2026, leaving zero debt maturities until 2028.18 Fitch Ratings and S&P Global Ratings each maintain BBB senior unsecured credit ratings for IRT; in June 2026, Fitch moved the outlook to positive from stable while both agencies affirmed the rating.31 As of June 30, 2026, IRT carried a 4.3% weighted average interest rate with 2.9 years of weighted average maturity, 86.9% of debt fixed or hedged, and $503.1 million of liquidity.2
However, debt structure choices involved active interest-rate decisions. Sebra told analysts in February 2026 that while IRT had originally intended to refinance 2026 maturities in the investment-grade bond market, investment-grade bond yields were "much more expensive today than where a floating rate environment is," leading the company to choose the bank term loan and deliberately carry higher floating-rate exposure.18
While lower SOFR rates initially reduced interest costs, this approach creates directional rate risk. Management explicitly stated it was not planning further swaps while watching the market "like a hawk."18 Illustrating this sensitivity, IRT's second-quarter 2026 guidance update included a $2 million increase in interest expense, driven in part by an assumed 25 basis point SOFR increase in September.1
Reported leverage increased temporarily in 2026, reaching 6.5x net debt to adjusted EBITDA in both the first and second quarters due to seasonally lower first-quarter EBITDA, the consolidation of the Austin joint venture asset in January, and investment timing.142 Management committed to returning leverage to the mid-5s by year-end 2026, using proceeds from the pending sale of Stonebridge Crossing in Memphis.1
Capital distribution policy has also moved alongside balance sheet management. On May 13, 2026, IRT raised its quarterly dividend 5.9% to $0.18 per share, payable July 17, 2026, with Schaeffer attributing the decision to "conviction in the strength of our operating platform and the improving fundamentals."23 Raising the dividend payout while leverage temporarily sits above target presents a capital allocation choice that balances shareholder returns against near-term deleveraging.
These capital allocation and governance decisions were executed against a broader market backdrop that management did not control.
VII. The Sunbelt Supply Wave & Skeptical Investor Stress-Test
In 2024, construction cranes filled the sky across northern Atlanta's suburbs, mirrored in Austin, Dallas, Charlotte, Nashville, and Phoenix. The 2021 rent spike produced a classic supply response: surging rents made development pencil, and developers built aggressively.
Nearly 592,000 multifamily units were delivered nationally in 2024 — the most in a single year since 1974 — with the bulk landing predominantly in Sunbelt metros.24 Austin alone absorbed roughly 31,000 new units in 2024 before completions dropped toward 10,000 in 2025, a 68% decline.24
Weighted by IRT's own net operating income exposure, CoStar calculated inventory growth in the company's markets at 5.9% in 2024 and 3.7% in 2025, compared to a pre-wave long-term average of 3.2%, before projecting a slowdown to 2.1% in 2026.18
The economic mechanism was straightforward. When a newly constructed Class A property opened 60% vacant, the landlord rarely cut asking rents, as doing so would impair the asset's appraised value. Instead, developers offered heavy upfront concessions — such as six weeks or two months of free rent on a one-year lease. This structure allowed effective rents to drop while nominal face rents held firm. A prospective resident weighing a renovated IRT apartment at $1,650 a month against a brand-new building listed at $1,950 with two months free was effectively comparing $1,650 against $1,625.
In effect, the luxury supply wave cascaded downward to compress workforce housing pricing power. IRT's middle-market moat provided protection at sticker prices, but proved porous against net effective discounting.
The impact showed directly in IRT's leasing metrics. New lease trade-outs dropped to negative 3.7% in the fourth quarter of 2025 and negative 4.0% in the first quarter of 2026.1816 Full-year 2025 same-store NOI grew 2.4% on a 1.7% revenue increase — exceeding initial corporate guidance, but representing a sharp deceleration from the 13.7% NOI surge in 2022.17 Core FFO for full-year 2025 reached $1.17 per share.17
Management responded through an explicit operational trade-off. During the supply crest, IRT prioritized high portfolio occupancy over aggressive rate growth. Schaeffer outlined the strategy in April 2026: "during that period of excess deliveries, we really were focused on keeping our occupancy high. And now we feel that we're well positioned with that stable occupancy and the supply-demand equation flipping better for landlords that we can now start pushing rents while still keeping occupancy stable."16
Operational execution subsequently tracked that blueprint. Renewal rate spreads expanded from 3.2% in the first quarter of 2026 to 4.1% in the second quarter and 4.6% in July, with August renewals — 95% finalized — holding at 4.5%.1 Blended rent growth across like-term leases accelerated from 0.7% to 1.3%, reaching 2.5% in July.1 Meanwhile, occupancy slipped by just twenty basis points sequentially to 95.0%.2 The sequence demonstrated IRT leveraging stable occupancy to re-establish pricing power.
Concession trends offered clearer evidence of shifting pricing dynamics. The share of new leases requiring concessions fell from 52% in March and April 2026 to 23% by July, after averaging roughly $1,300 per concession in the second quarter.1 Addressing a question from RBC analyst Brad Heffern on whether revenue gains stemmed from base rate expansion or reduced discounting, Sebra clarified the distinction: year-over-year growth was driven by base rate gains, whereas sequential improvement from early 2026 reflected the burn-off of concessions.1 By distinguishing between annualized rate expansion and sequential concession burn-off, management provided a clearer view of underlying pricing drivers.
Geographically, performance reflected the uneven distribution of new construction. Midwest properties posted positive new lease trade-outs of 2.3% in the second quarter and 2.1% in July.1 Sunbelt markets remained negative at 3.8% for the quarter, though trade-outs improved by 180 basis points in July.1 Western properties gained 340 basis points to reach positive 0.2%.1 In Atlanta — IRT's largest market — new lease trade-outs rebounded from negative 3.4% in the second quarter to positive 2.0% in July, as new lease concession frequency dropped from 60% to 70% in March and April down to roughly 17%.1 By contrast, Dallas and Tampa remained key laggards, with approximately 40% of new leases still requiring concessions.1
The geographic divergence mapped directly to regional construction volumes: the Midwest avoided both the building boom and the subsequent pricing hangover, whereas Sunbelt markets absorbed both.
Against these operational shifts, a critical evaluation of IRT's positioning requires examining several key counter-arguments:
The revenue growth is bought, not earned. The most compelling skeptical argument stems from management's own revenue breakdown. Sebra detailed the components of 2026's projected $10 million in same-store revenue growth: $8.7 million earned in the first half, plus $5.5 million expected from the bulk Wi-Fi rollout in the second half, leaving just $1.3 million to be generated by new leases signed in the second half of the year.1 He noted that 87% of full-year revenue growth was "already achieved or contracted."1 While that high proportion reduces earnings guidance risk, it also highlights structural revenue quality: a significant portion of 2026 growth represents a one-time ancillary service rollout rather than core rental rate expansion. Furthermore, the Wi-Fi initiative adds $1.9 million in operating contract expenses, yielding approximately $3 million in NOI on $5.5 million of gross revenue — an accretive operational improvement, but one that provides a step-level benefit rather than repeatable annual growth beyond 2027.181
Bad debt has not normalized. Bad debt stood at 1.1% of revenue in the second quarter of 2026, down from 1.3%, with management guiding to approximately 95 basis points in the second half — a level that remains elevated compared to historical pre-pandemic norms.1 In response to UBS inquiries regarding the persistent drag, Sebra explained that while outright non-payment fraud had abated, sophisticated identity fraud remained significantly more prevalent than in 2020, requiring ongoing technology deployments to mitigate.1 Management expressed a target of returning to pre-pandemic loss rates, anticipating incremental progress into 2027.1
The lease-ups have disappointed. IRT's non-same-store development projects — Flatiron in Broomfield, Colorado, and Tisdale in Austin, Texas — experienced slower lease-up paces and lower effective rents than original underwriting projected. In the second quarter of 2026, management reduced expected non-same-store NOI guidance by $2 million, primarily reflecting delays at Tisdale, which recorded just 36% occupancy during the quarter.161
The buyback discipline is arguable in both directions. IRT repurchased 1.9 million shares for $30 million in the fourth quarter of 2025 and 1.8 million shares for $30 million in the first quarter of 2026 — totaling 3.7 million shares and $60 million — before suspending repurchases.1816 When Deutsche Bank analyst Peter Abramowitz questioned why repurchases halted while the stock traded below the prior buyback price and at a discount to net asset value, Sebra stated that the company lacked excess capital during the quarter.1 Schaeffer expanded on the capital allocation framework, explaining that initial buybacks were funded by selling joint-venture assets that "were not contributing to EBITDA," noting that IRT has "resisted selling assets, giving up the EBITDA, in order to just buy back stock" because un-levered dispositions used for share repurchases increase balance sheet leverage metrics.1
While this approach preserves cash flow coverage, it effectively ties share repurchases to available non-earning asset sales. Critics argue that when public equity trades at a substantial discount to underlying private asset values, selling stabilized properties to repurchase shares creates intrinsic value per share despite headline leverage ratios. IRT management has rejected that trade-off, presenting investors with a choice between balance-sheet conservatism and aggressive capital recycling.
Aging portfolio and potential capital expenditure pressure. Green Street analyst John Pawlowski raised a key operational question during the second-quarter call, noting that absolute repair and maintenance expenses had declined for nearly two and a half years, aided partly by lower tenant turnover. When asked whether a deferred maintenance catch-up was looming, Sebra dismissed the concern, attributing cost containment to improved vendor management and on-site maintenance efficiency.1 Maintaining 1990s and 2000s vintage garden-style communities carries inherent physical capital requirements, making long-term maintenance expenditure a key area for ongoing monitoring.
Non-controllable operating expense volatility. Property insurance premiums and municipal tax assessments escalated rapidly across Sunbelt markets following 2021. IRT achieved recent expense relief: 2026 guidance incorporated an 11.5% decrease in property insurance premiums alongside favorable Texas property tax appeal settlements, allowing management to reduce full-year same-store operating expense growth guidance from 3.4% to 2.0%.181 Sebra noted, however, that property tax appeal timing "can be a bit lumpy," signaling that tax savings may not accrue evenly across future quarters.1
Against these headwinds, the core bullish thesis relies on structural supply protections: elevated land, labor, material, and financing costs prevent developers from economically constructing workforce housing at IRT's price point. The recent supply wave was concentrated in high-end luxury developments and is contracting rapidly, with quarterly national completions in the first quarter of 2026 down 53% from their third-quarter 2024 peak.24
The fundamental question for IRT is whether temporary supply pressures have receded sufficiently to allow its low-cost middle-market positioning to generate sustainable per-share value compounding over the full real estate cycle.
VIII. Playbook: Business & Investing Lessons
A small piece of Philadelphia geography captures this entire trajectory. RAIT Financial Trust is gone—liquidated through a Delaware bankruptcy court, its remaining assets absorbed by a New York credit fund. The apartment REIT it incubated to harvest advisory fees remains, operating out of its own offices at 1835 Market Street with 904 employees on its own payroll.3 The parent optimized for fee extraction and collapsed; the subsidiary built an operational platform and outlived it.
That inversion illustrates the first of several areas where the conventional narrative on IRT diverges from operational reality.
Myth vs. reality, three times over.
The myth that IRT is purely a Sunbelt growth REIT. While Sunbelt migration forms the core of the company's public branding and market positioning, operational data presents a more nuanced picture. In the second quarter of 2026, seven of IRT's markets posted positive new lease trade-outs—led by Lexington at positive 9.6%, Cincinnati at 4.6%, Charleston at 1.8%, Columbus and Oklahoma City both at 1.1%, San Antonio at 1.0%, and Louisville at 0.3%.1 The Midwest portfolio delivered positive 2.3% trade-outs, whereas the Sunbelt portfolio averaged negative 3.8%.1 Key Sunbelt markets that drove earlier expansion—Atlanta, Dallas, and Tampa—acted as operational drags, while steady Midwestern and secondary markets provided critical income stability. The investment implication is clear: investors seeking pure Sunbelt population migration exposure have had their returns supported largely by performance in Kentucky and Ohio.
The myth that workforce housing was insulated from the supply wave. The thesis for Class B housing assumed that a surge in luxury Class A apartment deliveries would pass over lower rent points without affecting middle-market demand. Operational performance proved otherwise. In March and April of 2026, more than half of IRT's new leases required concessions, which averaged roughly $1,300 per unit.1 The structural argument correctly identified that high land, labor, and financing costs would prevent developers from constructing competing Class B property at $1,600 a month. However, it underestimated how aggressive Class A rent concessions and temporary price cuts would bleed into middle-market pricing power.
The myth that internalization resolved the cost-of-capital constraint. Eliminating external advisory fees removed a persistent valuation penalty, but a decade later, it has not generated a durable cost-of-capital premium. That constraint was evident on the August 2026 earnings call when CEO Scott Schaeffer noted that acquisitions remain on hold until the cost of capital improves, emphasizing that the company has "always resisted growth for the sake of growth."1 Simultaneously, analysts questioned why a company trading at a reported discount to net asset value was not aggressively expanding its share repurchases.1 Internalization was a necessary step to establish corporate viability, but governance reform alone sets the floor for valuation rather than the ceiling.
Beyond these narrative corrections, five broader business and investment lessons emerge from IRT's execution:
1. In capital-intensive real estate, governance dictates the cost of capital. IRT's most consequential strategic transaction added no real estate assets. Deploying approximately $105 million in December 2016 to buy out its external advisor and retire RAIT's equity stake appeared on paper as an expense without immediate revenue. In practice, it unlocked the company's capital markets access. An externally managed REIT trading at a structural discount to net asset value cannot issue equity accretively or pursue large-scale acquisitions. The internalization established the governance foundation required to execute subsequent transactions, including the 2021 all-stock merger with Steadfast. In security-issuance growth models, manager incentive structures directly influence the long-term cost of capital.
2. Counter-positioning holds when competitor cost structures prevent entry, but pricing umbrella protections remain dynamic. IRT's primary structural protection stems from replacement cost dynamics: elevated land, material, labor, and debt costs prevent developers from economically building new suburban units that rent at $1,600 a month. That structural barrier does not depend on competitor choice. However, the 2023–2025 supply wave demonstrated that structural product protection differs from cyclical pricing insulation. Heavy concessions on newly delivered luxury units temporarily compress workforce housing rent spreads, proving that high-end supply waves still exert downward pricing pressure across adjacent submarkets.
3. Standardized, internal capital allocation offers predictable yields but carries absolute scale limits. The Value Add Initiative operates as an internal capital allocation engine. It possesses distinct advantages over external acquisitions: the asset pipeline is already owned, the scope of work is standardized, and capital requirements can be funded directly from organic cash flow. Furthermore, operational cycle times—reducing unit turn durations from over 30 days down to under 20 days—accelerate capital velocity and mitigate vacancy drag. However, management's execution boundaries limit annual program deployment to roughly $80 million, or 4,000 units per year. Value-add programs provide steady organic growth, but cannot replace external expansion for large-scale portfolio transformation.
4. M&A execution is evaluated over multi-year operational integration rather than transaction announcement. The Steadfast combination doubled IRT's scale in late 2021, but left the combined entity with elevated leverage just as borrowing costs rose sharply in 2022. Resolving that balance sheet exposure required disciplined post-merger execution: delivering projected operational synergies, managing a 33,000-unit platform, and executing a targeted ten-property disposition program on schedule to achieve a 5.7x net debt to adjusted EBITDA target by year-end 2025. Long-term M&A value creation depends on post-closing operational and balance-sheet execution.
5. Executive restraint defines corporate risk profiles. Strategic clarity is demonstrated as much by capital allocation refusals as by active investments. Management declined to sell income-generating assets solely to fund share buybacks, resisted accelerating unit renovations at the expense of portfolio occupancy, and paused property acquisitions while the cost of capital remained elevated. While individual capital allocation choices remain open to debate, consistent execution boundaries provide investors with clear visibility into balance-sheet management and long-term underwriting assumptions.
These operational lessons illustrate how middle-market platforms navigate broader market cycles. Evaluating IRT's long-term position requires examining how these internal mechanics translate into competitive durability.
IX. Strategic Position: Hamilton Helmer's 7 Powers & Porter's 5 Forces
Hamilton Helmer's strategic framework asks a fundamental question: what enables a company to earn returns above its cost of capital that competitors cannot erode? While many firms claim multiple advantages, Independence Realty Trust plausibly displays elements of three, though each carries distinct boundaries.
Process Power is the strongest candidate, though its scope is focused. Process Power exists when an organization builds an operational capability that competitors understand but cannot easily replicate because it relies on accumulated organizational learning. IRT's renovation platform demonstrates these mechanics through standardized scopes across 61 properties, bulk vendor sourcing, and a unit turn cycle compressed from 30 to 35 days down to under 20 through repetition across more than 11,400 completed units.31 Achieving that execution speed requires sustained operational practice rather than simple capital deployment.
Applying a strict standard, however, reveals clear limits: Mid-America Apartment Communities (MAA), Camden Property Trust, NexPoint, and numerous private operators run similar unit upgrade programs, with several reporting comparable returns. IRT's initiative represents a disciplined operational efficiency rather than an unassailable competitive moat.
Counter-Positioning represents the clearest structural defense. It arises when competitors cannot match a business model due to economic constraints rather than a lack of desire. A merchant developer cannot build new apartments within IRT's average $1,600 monthly rent range while earning an acceptable return, as total land, labor, and financing costs require significantly higher asking rents. This structural barrier explains why the recent supply wave consisted almost entirely of Class A developments. However, this positioning guards primarily against direct competing supply at similar price points, offering less protection against aggressive net-effective discounting by luxury properties during lease-up periods.
Scale Economies operate primarily at the regional level, where local density has expanded significantly since IRT's early years. Local property clustering—such as acquiring a Columbus asset two miles from existing holdings, expanding in Indianapolis to 2,259 units, and growing Orlando from 617 to 1,260 units—lowers per-unit costs for regional management, maintenance dispatch, and marketing.3 Portfolio density also enabled the rollout of a single bulk Wi-Fi contract across 19,000 units.18
Scale in multifamily housing remains relative, and IRT is a mid-sized operator. MAA owned interests in more than 100,000 apartment homes at year-end 2025, roughly three times IRT's unit count.25 Similarly, IRT's approximately $3.9 billion equity market capitalization is a fraction of the large-cap Sunbelt REITs with which it competes for properties and capital. While IRT enjoys overhead efficiencies over smaller private landlords, it holds no cost-of-scale advantage over larger peers like MAA or Camden.
The powers IRT lacks are equally instructive: the business features no network effects, no switching costs beyond standard lease terms and moving expenses, no brand equity that commands rental premiums, and no cornered resources. Multifamily housing remains a largely commoditized asset class where operational execution determines relative performance, placing a realistic ceiling on long-term returns on capital.
An evaluation through Michael Porter's Five Forces framework underscores these competitive dynamics.
Threat of new entrants: moderate to low, and cyclical. Entry barriers in middle-market multifamily housing are economic rather than regulatory or technological. Constructing new apartments requires land, labor, materials, and financing costs that mandate rents well above IRT's core price band. The recent construction cycle illustrated this dynamic: rising rents justified Class A development, bringing nearly 592,000 national apartment deliveries in 2024 that did not directly match the baseline price point of IRT's suburban Class B portfolio.24 Should middle-market rents rise sufficiently over an extended period, development economics would eventually support new entry, making this barrier durable but cyclical rather than permanent.
Bargaining power of tenants: elevated but moderating. During the 2023–2025 supply crest, prospective residents gained temporary leverage as landlords competed for occupancy. That pricing pressure was evident when more than half of IRT's new leases required concessions in March and April 2026, averaging roughly $1,300 per unit.1 Concession frequency fell to 23% by July 2026 as market absorption reduced available inventory.1 While individual tenants hold limited negotiating power, the broader set of rental options influences market pricing power. Structurally, high homeownership costs continue to support tenant retention, which hovered between 58% and 61%.217
Bargaining power of suppliers: moderate to high, varying by category. Trade labor and construction materials follow broader inflationary trends, as seen in IRT's average renovation cost per unit rising from the $17,372 program baseline toward $20,477 in the second quarter of 2026.32 Non-controllable operating expenses—specifically property insurance and municipal tax assessments—present greater structural pressure. IRT mitigates these costs through portfolio-scale purchasing and property tax appeals, which generated momentum via an assumed 11.5% insurance premium decline for 2026 and successful Texas tax settlements.181 However, management's acknowledgment that tax appeal timing remains uneven underscores that vendor and municipal cost pressures require ongoing management.
Threat of substitutes: low to moderate. Single-family homeownership represents the primary substitute for apartment living, but high purchase prices and elevated mortgage rates keep home buying financially out of reach for many middle-market renters. Institutional single-family rentals present a more relevant alternative, offering suburban locations and extra space at price points that overlap IRT's target demographic. While single-family rentals have not materially impaired IRT's resident retention, the segment remains an active competitive alternative that does not depend on lower mortgage rates to attract tenants.
Competitive rivalry: high and fragmented. IRT competes locally for residents against surrounding multifamily properties operated by public REITs, regional real estate firms, and private landlords. It faces similar competition in property acquisitions against larger REITs, private equity funds, and institutional investors, a dynamic explicit in IRT's Form 10-K, which identifies competition as a key factor affecting transaction availability and pricing.3 Given the lack of pricing coordination and structural product differentiation in multifamily housing, submarket rivalry remains an ongoing operational reality.
In sum, IRT operates in a commoditized sector with a defensible middle-market price point, a disciplined renovation platform, and meaningful regional scale. That combination supports steady operational performance under normal market conditions and relative outperformance when new supply contracts, though it does not provide the structural moat required to generate persistent economic rents above its cost of capital.
X. Epilogue & Bull vs. Bear Case
Looking across a thirteen-year arc, the corporate evolution is clear. A fee-generating vehicle for a distressed lender transformed into a self-managed operator of nearly 34,000 apartments with an investment-grade balance sheet, a positive credit ratings outlook, no debt maturities until 2028, and a recently raised dividend.211823 Whatever operational hurdles remain, the trajectory does not represent a story of value destruction.
Yet an objective scorecard reveals notable challenges. Total enterprise value remains below levels recorded when the Steadfast merger closed. Core FFO per share guidance for 2026 sits at a midpoint of $1.14, representing a decline from $1.17 in 2025—marking a modest per-share earnings contraction four years after doubling portfolio scale.117 Net debt to adjusted EBITDA rose in early 2026 before management's projected year-end return to the mid-5x range.1421 Furthermore, the three-year total shareholder return through December 2025 reached 16%, placing IRT in the 62nd percentile of apartment REITs—outperforming lower-tier peers, but trailing initial merger expectations.20
The bull case for Independence Realty Trust rests on four testable pillars.
First is the internal renovation pipeline. Approximately 7,300 units remain in the identified 18,789-unit program, generating returns management projects will widen as competing Class A concessions burn off, supported by an operational throughput ceiling that has effectively doubled as turn times compressed.31 Operational evidence supporting this leg includes monthly rent premiums expanding from $251 to $279 year-over-year while reported returns rose from 15.3% to 16.4%.172 Conversely, the pillar would weaken if monthly rent premiums stagnate while per-unit renovation costs continue to rise.
Second is the projected deceleration in competing supply. Multifamily completions across IRT's markets are forecast to drop to 2.1% of inventory in 2026, down from 5.9% in 2024—moving below the historical long-term average—while underlying job, population, and household growth are projected to exceed national rates.18 If these projections materialize, regional landlords could regain meaningful pricing power in 2027 and 2028 for the first time since 2022.
Third is middle-market affordability. IRT's average monthly rents sit well below new construction asking rates, while elevated single-family housing costs keep homeownership out of reach for much of its resident base. This price gap provides a demand floor, reflected operationally in resident retention rates near 60%.
Fourth is balance sheet maturity structure and liquidity optionality. The company faces no debt maturities until 2028, maintains BBB credit ratings with a positive outlook from Fitch, and intends to access the investment-grade bond market to address 2028 maturities, which could unencumber mortgaged assets and support potential credit rating upgrades.18
The bear case presents equally specific counter-arguments.
First, Sunbelt supply absorption may prove slower and more uneven than anticipated; key markets like Dallas and Tampa saw roughly 40% of new leases requiring concessions in July 2026.1 Second, non-controllable operating costs remain vulnerable to insurance market shifts or aggressive municipal property tax reassessments. Third, carrying floating-rate debt creates active interest rate exposure, already reflected in the $2 million interest expense increase included in revised 2026 guidance.1 Fourth, long-term capital expenditure obligations for a portfolio built predominantly in the 1990s and 2000s will require ongoing capital commitment. Finally, 2026 revenue growth relies heavily on a one-time bulk Wi-Fi deployment rather than organic rent expansion, boosting near-term performance while creating a harder comparison for 2027 growth.1
The core bear thesis is not tied to a single operational flaw, but to structural industry dynamics. In this view, IRT is an efficiently managed operator in a commodity sector that rarely rewards operational execution with persistent economic rents above the cost of capital. Upside remains tied to the broader apartment cycle, while management acknowledges that substantial external growth remains constrained by capital market conditions outside its control.1
The bull rebuttal contends that this structure represents a resilient real estate model: an internally funded business operating in a middle-market housing segment protected by high replacement costs and minimal direct competing supply.
Both perspectives are supported by empirical evidence, differing primarily on how market participants value the equity's leverage to a cyclical recovery.
Three key operational metrics provide an empirical test of these competing theses over the coming years without relying on management narrative:
Same-store NOI growth, decomposed into core rent versus ancillary revenue. This metric tracks whether middle-market positioning translates into sustainable earnings. Evaluating durability requires separating core rental rate expansion from one-time ancillary additions, such as the bulk Wi-Fi rollout. Full-year 2026 guidance pointing to a 1.5% NOI growth midpoint serves as the benchmark, with long-term revenue composition determining its trajectory.1
Value-add throughput and return on cost, evaluated alongside per-unit expense. Investors must track annual renovation volume against management's target of 3,000 to 4,000 units while monitoring returns against unit costs. A stable 16% return on expanding unit costs indicates that rent premiums are matching inflation, whereas a stable yield on declining volumes signals a contracting pipeline.12
Net debt to adjusted EBITDA relative to the year-end 2026 target. Management committed to reducing leverage from 6.5x at mid-year 2026 back to the mid-5x range by December 2026, using proceeds from the Stonebridge Crossing sale.12 This target provides an explicit timeline to evaluate whether the balance-sheet discipline demonstrated following the Steadfast merger continues to guide capital allocation.
XI. Outro
Thirteen years ago, Independence Realty Trust was eight apartment buildings and a management contract, priced below its marketed IPO range and led by an executive who was simultaneously running the firm collecting its advisory fees. Today, it is a self-managed operator of 116 communities with an investment-grade balance sheet, a track record of meeting stated leverage targets, and an operating platform capable of executing a portfolio-wide revenue initiative across 19,000 apartments within six months.
The transformation was not driven by a proprietary product or a technology breakthrough. It was driven by two pragmatic decisions: buying out a conflicted external manager at a high upfront cost, and selling ten properties across seven markets to reduce debt during a sluggish transaction environment. Both moves centered on aligning corporate governance with equity holders.
What remains unresolved is whether the middle of the American housing market — the $1,600-a-month suburban two-bedroom near solid schools and essential retail — is a structurally privileged asset class, or merely a defensible one. The recent supply wave demonstrated that middle-market rents are defensible, even if temporary luxury concessions compress pricing power. The next cycle, characterized by declining construction deliveries and ongoing Sunbelt migration, will test whether that middle-market positioning can drive sustained per-share growth.
Management has provided investors with explicit benchmarks and target timelines. The defining feature of IRT's current outlook is that its operating commitments are specific enough to be empirically measured.
References
-
Independence Realty Trust Reports Q2 2026 Results: Full Earnings Call Transcript — Sahm Capital, 2026-08-04 ↩↩↩↩↩↩↩↩↩↩↩↩↩↩↩↩↩↩↩↩↩↩↩↩↩↩↩↩↩↩↩↩↩↩↩↩↩↩↩↩↩↩↩↩↩↩↩↩↩↩↩↩↩↩↩↩
-
Independence Realty Trust Announces Second Quarter 2026 Financial Results — Independence Realty Trust, Inc., 2026-08-03 ↩↩↩↩↩↩↩↩↩↩↩↩↩↩↩↩↩↩
-
Independence Realty Trust, Inc. Annual Report on Form 10-K for the year ended December 31, 2025 — U.S. Securities and Exchange Commission ↩↩↩↩↩↩↩↩↩↩↩↩↩↩↩↩↩
-
RAIT Financial Trust Annual Report on Form 10-K for the year ended December 31, 2012 — U.S. Securities and Exchange Commission ↩
-
Independence Realty Trust, Inc. Announces Pricing of Public Offering — Independence Realty Trust, Inc., 2013-08-13 ↩
-
Scott Schaeffer — Board of Directors, Independence Realty Trust, Inc. ↩↩↩↩↩
-
RAIT Financial files for Chapter 11, agrees to sell assets to Fortress — S&P Global Market Intelligence, 2019-09-03 ↩
-
Independence Realty Trust Announces Definitive Merger Agreement to Acquire Trade Street Residential — GlobeNewswire, 2015-05-11 ↩
-
Independence Realty Trust Completes Acquisition of Trade Street Residential — Independence Realty Trust, Inc., 2015-09-17 ↩↩
-
Independence Realty Trust, Inc. Current Report on Form 8-K, Exhibit 99.1 (Internalization) — U.S. Securities and Exchange Commission, 2016 ↩↩↩↩
-
Independence Realty Trust Completes Management Internalization — Independence Realty Trust, Inc., 2016-12-20 ↩
-
Independence Realty Trust and Steadfast Apartment REIT Announce Strategic Merger — Independence Realty Trust, Inc., 2021-07-26 ↩↩↩↩↩↩↩↩
-
Independence Realty Trust and Steadfast Apartment REIT Complete Strategic Merger — Business Wire, 2021-12-16 ↩
-
Independence Realty Trust, Inc. Current Report on Form 8-K, Exhibit — Selected Financial Information (Q1 2026) — U.S. Securities and Exchange Commission, 2026 ↩↩↩
-
Independence Realty Trust Announces Fourth Quarter and Full Year 2022 Financial Results — Independence Realty Trust, Inc., 2023-02-15 ↩↩↩
-
IRT Q1 2026 Earnings Call Transcript — The Motley Fool, 2026-04-30 ↩↩↩↩↩↩↩
-
Independence Realty Trust Announces Fourth Quarter and Full Year 2025 Financial Results — Independence Realty Trust, Inc., 2026-02-11 ↩↩↩↩↩↩↩↩↩↩
-
Independence Realty Trust, Inc. (NYSE:IRT) Q4 2025 Earnings Call Transcript — Insider Monkey, 2026-02-12 ↩↩↩↩↩↩↩↩↩↩↩↩↩↩↩↩↩
-
Independence Realty Trust Promotes Jim Sebra to President — Business Wire, 2024-09-03 ↩↩↩
-
Independence Realty Trust, Inc. Definitive Proxy Statement on Schedule 14A (2026 Annual Meeting) — U.S. Securities and Exchange Commission ↩↩↩↩↩↩↩↩↩↩↩↩
-
Independence Realty Trust Announces Third Quarter 2023 Financial Results — Independence Realty Trust, Inc., 2023-10-30 ↩
-
Independence Realty Trust, Inc. Quarterly Report on Form 10-Q for the quarter ended March 31, 2024 — U.S. Securities and Exchange Commission ↩
-
Independence Realty Trust Increases Quarterly Dividend by 6% — Business Wire, 2026-05-13 ↩↩
-
Apartments.com and CoStar Release a Multifamily Construction Activity Update for Q1 2026 — CoStar Group, Inc., 2026 ↩↩↩↩
-
Mid-America Apartment Communities, Inc. Annual Report on Form 10-K for the year ended December 31, 2025 — U.S. Securities and Exchange Commission ↩
 LinkedIn
 WhatsApp
 Reddit
 Hacker News
 Email
Email Kindle
 RSS Feed
 Spotify
 Apple Podcasts
 Amazon Music
 Audible
 YouTube