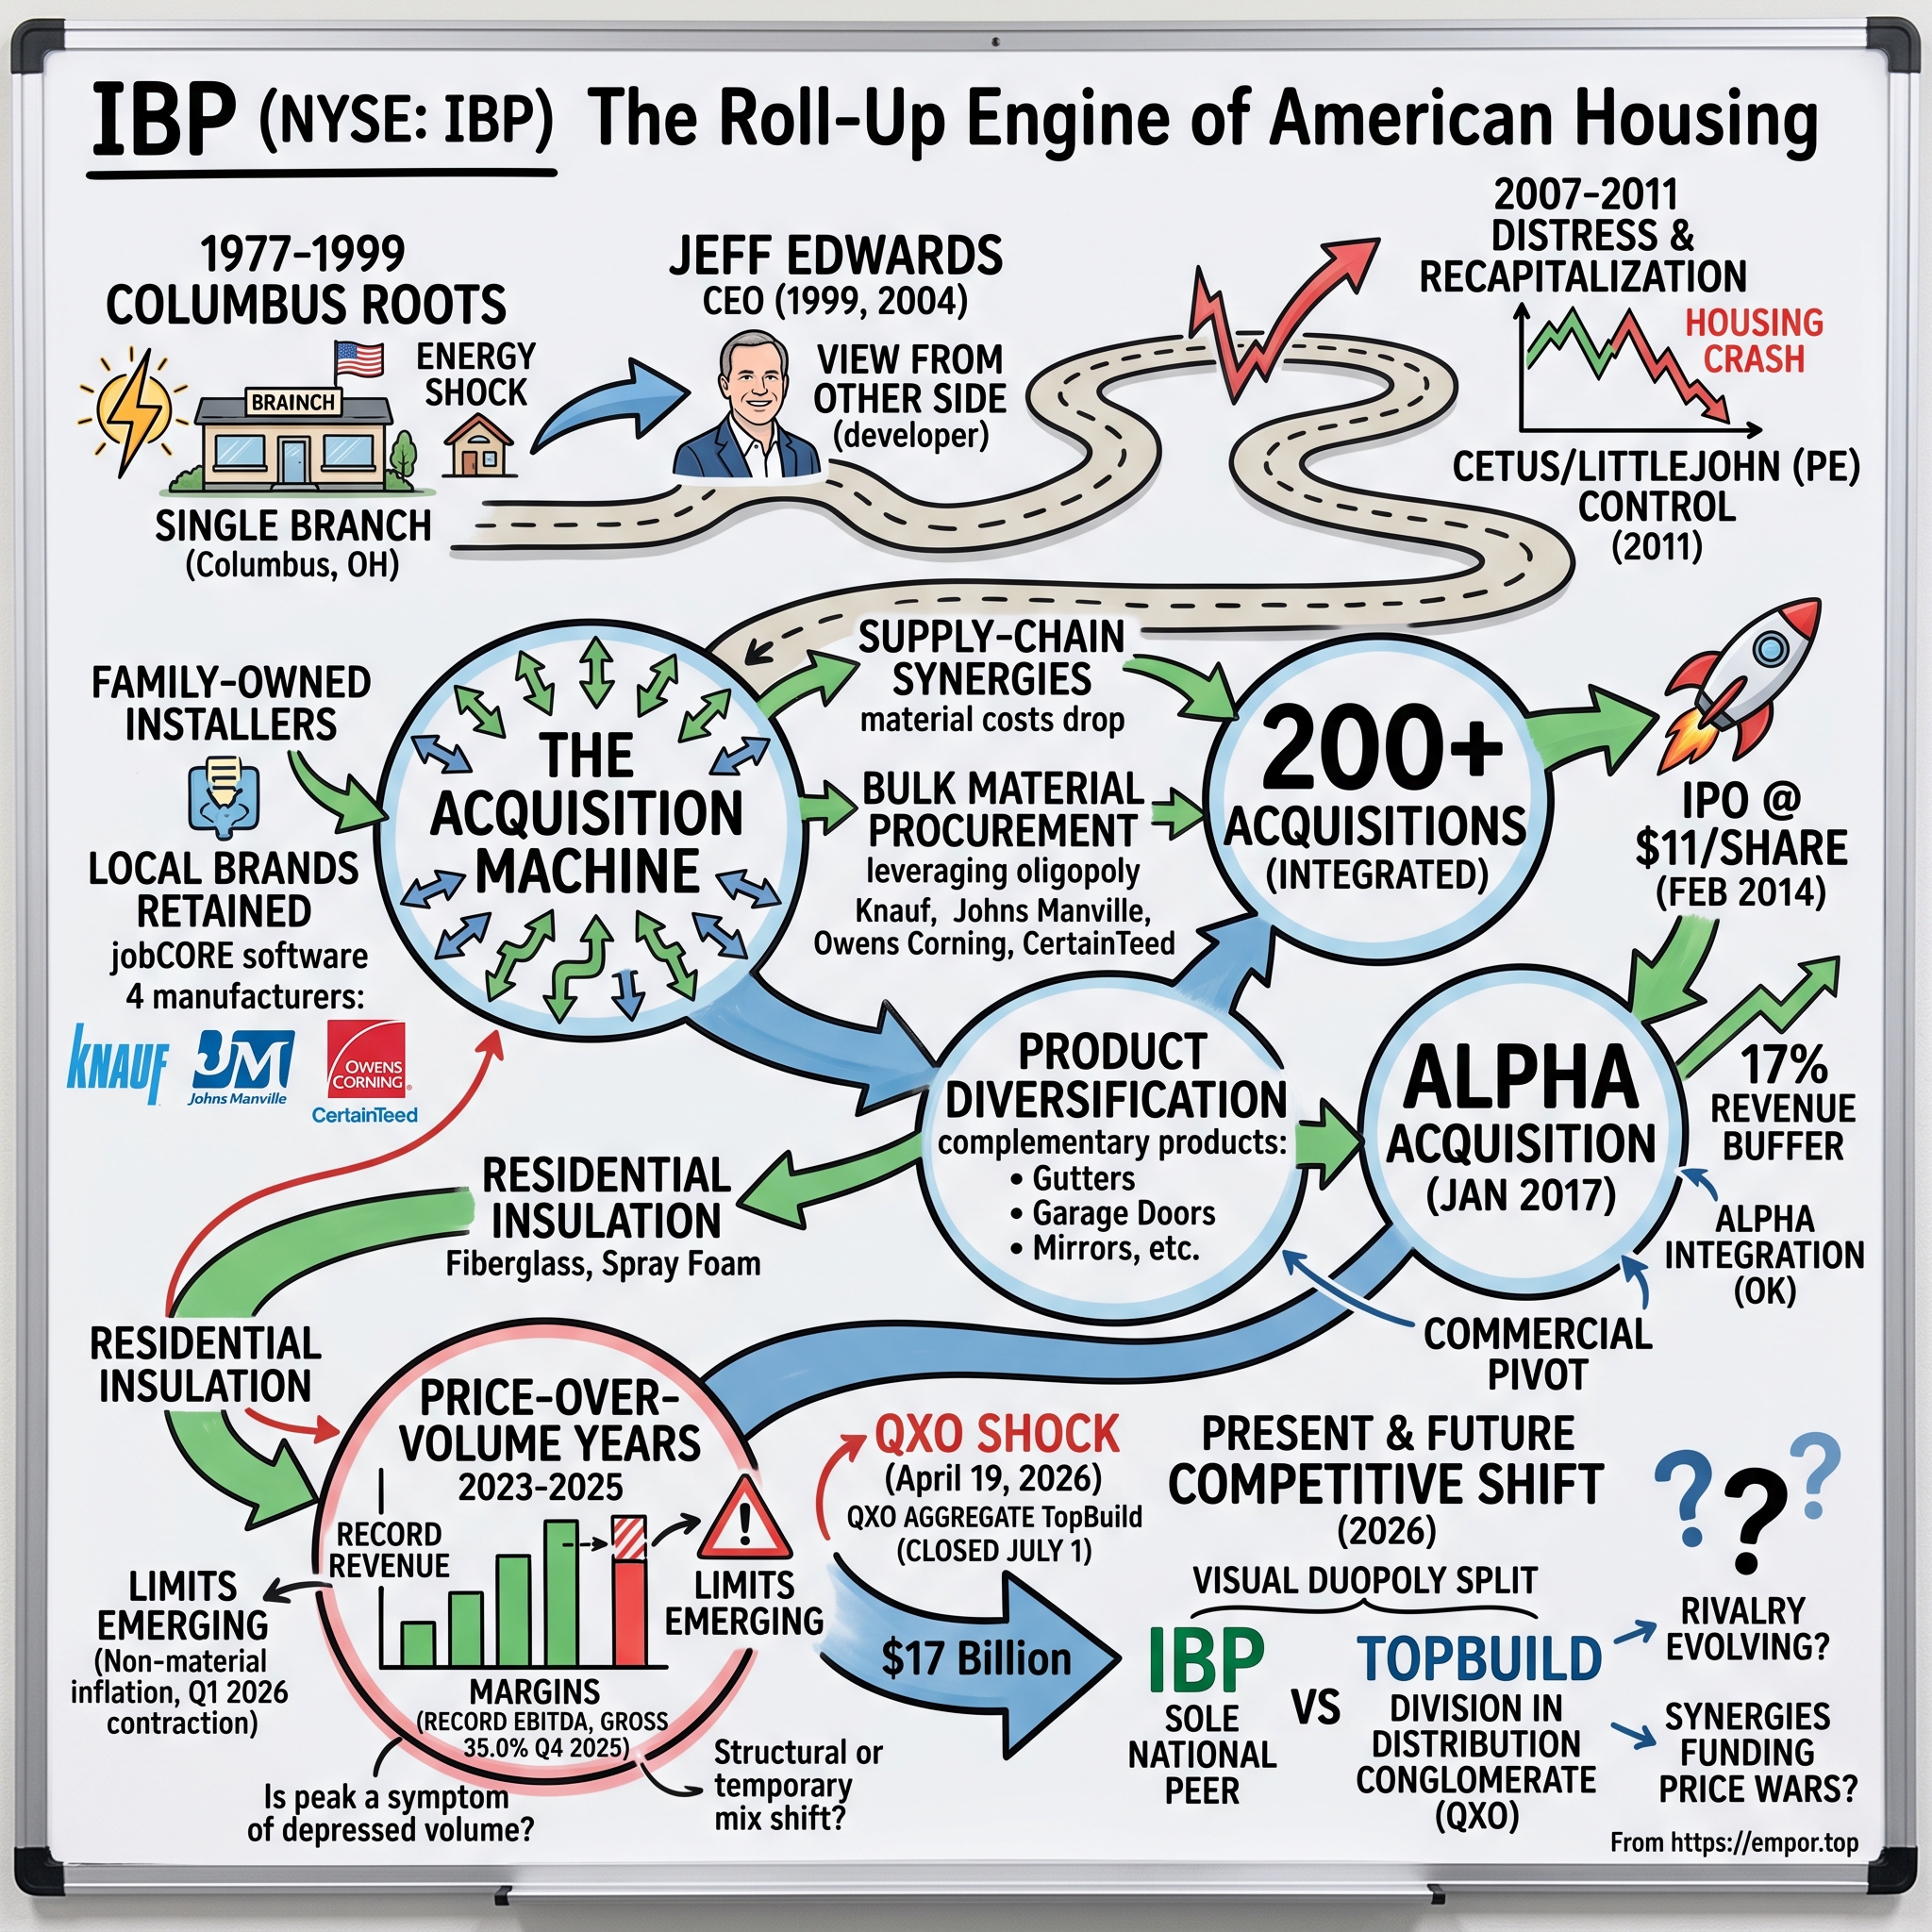
Installed Building Products (NYSE: IBP): The Roll-Up Engine of American Housing
I. Introduction & Episode Roadmap (00:00 - 06:00)
Walk onto a half-built subdivision in suburban Columbus, Phoenix, or Charlotte on a Tuesday morning and you will not see a stock ticker. You will see a truck—a white box truck with a local name painted on the side, a name that has been in that county for thirty years. You will see a crew hauling rolls of pink fiberglass and dragging a hose from a spray rig into a house that has framing, wiring, and plumbing, but no walls yet. They will be on site for a few hours. Then an inspector will arrive, check the R-values and air sealing, and either sign the card or walk away.
Until that card is signed, nothing else moves. The drywall crew cannot start. The painters cannot start. The buyer cannot close. A trade representing a small slice of a home's total cost sits directly astride the schedule of the entire project.
That truck, more likely than not, belongs to a company most homebuyers have never heard of. Installed Building Products operates a national network of more than 250 branch locations across all 48 continental states and the District of Columbia, generating net revenue of $2.97 billion in 2025.1 It employs roughly 10,400 people, including about 7,100 installers.1 Its stock has been listed on the New York Stock Exchange since 2014, when it priced its initial public offering at $11.00 per share.2 It is, by its own description, one of the nation's largest installers of insulation for residential new construction, as well as a diversified installer of complementary products bolted, hung, caulked, or sprayed into a house late in the build cycle.1
The core thesis. Homebuilders get the headlines and cyclical valuation multiples. D.R. Horton, Lennar, PulteGroup, and NVR are the names investors debate when discussing housing. But builders do not perform much of the physical construction themselves; they assemble, schedule, and finance. The physical labor falls to sub-trades, where operating bottlenecks emerge. Insulation is the purest example: mandated by building codes, inspected by municipalities, impossible to skip, and difficult to scale without a standing army of trained crews alongside a direct supply line to the four North American manufacturers of fiberglass.
For a decade, the defining structural feature of this trade was its consolidation into a duopoly atop an otherwise atomized industry: IBP and TopBuild Corp. As of mid-2026, that structure has shifted. On April 19, 2026, QXO, Inc.—Brad Jacobs's building-products roll-up—announced a definitive agreement to acquire TopBuild for approximately $17 billion, valuing each TopBuild share at $505.3 The transaction closed on July 1, 2026.4 IBP's sole national peer is now a division within a far larger distribution conglomerate. That represents the single most significant change to the company's competitive landscape in a decade, and its full ramifications remain unresolved.
The episode arc.
- The origin. From a single Columbus insulation branch opened in 1977 to Jeff Edwards, a scion of a central Ohio real-estate family, deciding that a fragmented sub-trade was the most compelling asset his family owned.1
- Distress, then discipline. Far from a seamless private-equity growth story, IBP nearly collapsed during the housing crash. A distressed-debt firm took control of its senior loans and converted them into equity during a 2011 recapitalization, setting up a public listing two and a half years later.5
- The duopoly war, and its end. Building scale across thousands of local installers, exerting leverage over an oligopoly of fiberglass manufacturers, and assessing what happens now that its chief rival belongs to an owner with $18 billion in combined revenue and a target of reaching $50 billion.3
- The commercial pivot. The January 2017 acquisition of Alpha Insulation and Waterproofing, which expanded commercial operations from a minor footprint to roughly 17% of revenue, creating a critical growth engine when residential housing slowed.19
- The price-over-volume years. How a company whose job volumes declined in each of the past two years still generated record gross margins and record adjusted EBITDA—and where that strategy faces operational limits.12
- Frameworks, credibility, and the stress test. Helmer's 7 Powers, Porter's Five Forces, related-party transactions warranting scrutiny, and the core metrics that will determine whether IBP operates as a true compounder or a well-managed cyclical.
A central tension runs through the business today. In the first quarter of 2026, IBP's consolidated net revenue fell 3.5% and adjusted gross margin compressed to 32.2%—staying within management's full-year target range, but dropping significantly from the record 35.0% reached one quarter earlier.112 The stock, after trading near a 52-week high of $349, closed July 2026 in the low $220s.16 Investors are now testing whether those peak margins reflected structural advantages or merely a temporary product mix during an atypical cycle. That question forms the spine of this analysis.
 Subscribe on LinkedIn
II. Columbus Roots & The Unsung Machinery of US Residential Construction (1977–2004) (06:00 - 18:00)
The story began in the aftermath of an energy shock. In 1977, a single insulation installation branch opened in Columbus, Ohio.1 The macro background was pivotal: following the 1973 oil embargo, energy efficiency emerged as a national priority. Utilities, government regulators, and evolving building codes began treating insulation as a mandatory construction standard rather than a discretionary addition.
That initial Columbus location operated as a modest local contractor. It purchased fiberglass, hired local crews, dispatched trucks to job sites, and billed regional homebuilders. For more than two decades, it remained a localized contractor serving a regional market, showing few outward signs that it would eventually form the foundation of a $3 billion enterprise.
The Edwards family and the view from the other side of the table
The company's trajectory shifted through the involvement of the family behind the business. Jeffrey W. Edwards became Chairman of the board in 1999 and Chief Executive Officer in 2004.5 Edwards was not an outside executive brought in to formalize a trade shop. He and members of his family had spent more than four decades establishing, acquiring, and managing businesses across the construction supply chain—including multi-family and student housing development, industrial tool distribution, wholesale building supply, homebuilding, land development, and real estate brokerage under the Edwards Companies.5
This operational background shaped IBP's strategy. Edwards approached the insulation trade as a developer and builder—a customer of subcontracted labor. Having managed project schedules from the builder's side of the table, he recognized how minor delays from sub-trades could stall an entire project and delay closings.
From that vantage point, the fragmentation of local installation trades represented a structural inefficiency. Thousands of independent owner-operators managed small fleets, purchased materials at near-retail prices, operated with basic administrative systems, and lacked the capacity to provide multi-state builders with guaranteed staffing across regional markets. While the installation work was mandatory, the service providers were too small to scale alongside expanding homebuilders.
Why insulation is the ideal trade to consolidate
Several structural characteristics make residential insulation uniquely suited for trade consolidation.
Insulation represents a small percentage of total home construction costs. Builders rarely market it as a primary feature, and buyers seldom evaluate batt density during home tours. While IBP does not disclose insulation's exact share of total construction costs in its filings and industry estimates vary, it remains a modest financial line item within a home's budget.
Despite its low relative cost, insulation sits directly astride the construction schedule. As IBP notes in its filings, insulation installation is a required phase in construction because subsequent interior work cannot begin until the installation passes municipal inspection.1 Local building codes mandate insulation across multiple structural areas—including basements, crawl spaces, exterior building envelopes, attics, and interior walls for sound dampening—with each area requiring separate site visits at different construction stages.1 Because installation standards and code enforcement vary by municipality, installers must understand specific local jurisdiction requirements. IBP's crews actively assist builders in coordinating these inspections.1
This workflow creates a localized operational defense: successful installation requires navigating specific local code enforcement, while builders rely on installers to keep projects on schedule. Rather than selling a standardized physical product, the installer provides time-sensitive field services tied to regulatory approvals.
Material complexity further increases operational barriers. While fiberglass batts and loosefill are straightforward to handle, spray polyurethane foam requires precise technical application. Spray foam is mixed on site from two chemical components using specialized equipment, offering the highest insulating value per inch and air-sealing performance among IBP's product offerings, along with the highest installed cost.1 Improper chemical mixing or application under incorrect ambient conditions creates structural defects requiring costly removal. Managing spray foam operations requires rigorous crew training and field oversight, areas where larger operating platforms hold structural advantages.
Finally, national homebuilders face structural disincentives to performing insulation work internally. Direct deployment would require hiring, training, insuring, and equipping thousands of field workers to perform high-liability labor subject to severe housing cycle volatility. Over recent decades, major homebuilders have increasingly outsourced field labor to maintain flexible cost structures, creating a market for scaled subcontracting partners.
The early playbook
Beginning in the late 1990s, Edwards initiated an acquisition strategy designed to build a national platform.1 The economic premise relied on operational scale: local installers gained financial advantages inside a consolidated network—through bulk material procurement, corporate insurance programs, and centralized administrative functions—compared to operating independently. Furthermore, because many target businesses were small, family-owned enterprises lacking clear succession plans, they could be acquired at modest valuations.
By the time Edwards assumed the CEO role in 2004, the consolidated model was established. IBP expanded its share of the U.S. residential new construction insulation installation market from approximately 5% at the end of 2005 to roughly 16% by September 2013, measured relative to total U.S. housing completions.5
However, this initial expansion did not guarantee immunity from macro shocks. The model was soon tested by the severe downturn in the U.S. housing market, bringing the company close to financial failure.
III. The PE Playbook & The Roll-Up Engine (2004–2014) (18:00 - 33:00)
Corporate presentations often depict a straightforward private equity narrative: an investor identifies a fragmented industry, backs an experienced management team, and builds a disciplined acquisition platform leading to a successful public listing.
The company's SEC filings describe a more complex trajectory.
The near-death experience
From 1968 through 2006, U.S. housing starts averaged roughly 1.6 million annually. Between 2007 and 2012, that average dropped by half to approximately 800,000, bottoming near 554,000 in 2009.5 For a trade contractor whose revenue depends directly on home framing, this was not a typical downturn, but a prolonged halving of its addressable market.
Installed Building Products entered the crash heavily leveraged. In 2010, entities owned by the Edwards investors and other indirect stockholders bought $27.8 million of outstanding senior secured debt under the company's existing credit facility, converting those loans into second-lien debt.5 That capital infusion proved insufficient. In July 2011, Cetus Capital II, LLC purchased the remaining $77.6 million of the company's first-lien debt, including accrued interest.5
Cetus Capital is an affiliate of Littlejohn & Co., a Connecticut investment firm specializing in middle-market companies undergoing structural changes in capital structure, strategy, operations, or growth.5 Rather than providing expansion equity, Littlejohn acquired the debt of a distressed enterprise.
A formal restructuring followed in November 2011. Cetus contributed the first-lien debt to a newly formed Delaware holding company—Installed Building Products, Inc., incorporated on October 28, 2011—in exchange for 1,000 shares of Series A Preferred Stock and 300,000 shares of Redeemable Common Stock.5 The insider-held second-lien debt was cancelled, alongside $3.8 million in stockholder notes and $0.9 million of accrued interest owed to the Edwards investors.5 The company recorded an $18.5 million gain on debt extinguishment in 2011.5
The restructuring reshaped the company's ownership. The lender assumed equity control because the original debt could not be serviced, while the founding family wrote off its existing claims to complete the recapitalization. The 2011 financial statements reflected the downturn's severity: net revenue stood at $238.4 million, with an operating loss of $17.1 million and negative adjusted EBITDA of $6.6 million.5
This recapitalization provides critical context for evaluating management's execution. Before building a national roll-up platform, the company encountered extreme financial distress during the housing collapse, surrendered balance-sheet control, and reconstructed its capital structure. Subsequent assertions regarding counter-cyclical resilience must be evaluated against this history.
The mechanics of the local roll-up
Following the recapitalization, Installed Building Products refined an acquisition model designed to capture operating efficiencies across localized installation markets.
The target profile. IBP target companies are typically well-run, family-owned installers with established local customer bases and regional reputations in profitable markets, where IBP seeks to retain local management teams and existing brand names.1 These target businesses generally operate with limited administrative infrastructure. While IBP does not disclose a fixed revenue threshold for acquisition targets, deal disclosures illustrate the typical scale: in the first quarter of 2026, for example, four completed acquisitions represented annual revenues of approximately $5 million, $13 million, $3 million, and $7 million.11
The synergy stack. Value creation relies on direct supply chain integration and overhead elimination. IBP purchases the majority of its installation products directly from manufacturers, bypassing middle-tier distributors.1 When an acquired contractor transitions from distributor pricing to IBP's direct national supply terms, material costs drop immediately. Centralized risk management, fleet financing, safety compliance, and payroll systems further reduce local operating expenses. Management reports achieving prompt margin expansion and revenue growth at newly acquired branches by applying national purchasing terms and connecting local operations with large national homebuilders.1
Valuation arbitrage. While IBP does not disclose specific transaction multiples, purchase prices can be evaluated relative to acquired revenue. In 2025, the company invested $51.5 million in acquisitions to secure approximately $53.3 million in expected annual revenue, alongside four bolt-on additions integrated directly into existing branches.1 A purchase price near one times annual revenue reflects the small, unlevered, and lightly structured nature of these local target businesses.
Local autonomy as a retention device. Retaining local brand identity serves a key commercial purpose. Because homebuilders select insulation contractors based on service reliability, local code knowledge, application skill, competitive pricing, and existing relationships, the primary asset in an acquisition is the established local relationship.1 Rather than rebranding local operations under a unified national logo, IBP maintains local customer-facing brands while standardizing back-office functions through an internal software platform called jobCORE, which feeds real-time operational and financial data from local branches to headquarters in Columbus.1
February 2014: the listing
Installed Building Products completed its initial public offering on February 19, 2014. The company sold 8,567,500 shares—including the underwriters' fully exercised option for 1,117,500 shares—at $11.00 per share, raising approximately $87.6 million in net proceeds before expenses.6 Deutsche Bank Securities and UBS Investment Bank acted as joint book-running managers, with Zelman Partners serving as lead manager.6 Trading on the New York Stock Exchange commenced on February 13, 2014.7
Two aspects of the offering merit attention. First, public accounts sometimes cite a $13.00 offering price, but official filings confirm the deal priced at $11.00 per share, with net proceeds reflecting balance-sheet deleveraging and liquidity rather than massive expansion capital.6 Second, the pre-IPO capital structure reflected the recent restructuring: Chairman and CEO Jeffrey W. Edwards beneficially owned 61.9% of shares prior to the offering, Cetus Capital II held 26.6%, and TCI Holdings—the former owner of an acquired contracting business—held 11.5%.5
Subsequent financial performance validated the acquisition platform during the housing recovery. From the 2014 listing through year-end 2023, net revenue compounded at an annual rate of 21%, net income grew at 37%, and adjusted EBITDA expanded by 31%, supported by nearly 90 acquisitions.8 Since initiating its acquisition strategy in 1999, IBP has completed and integrated more than 200 contractors.1
This growth occurred in a highly fragmented trade lacking proprietary technology, patents, network effects, or consumer brand power. Platform compounding was achieved by acquiring localized contractors at disciplined valuations, integrating them into a centralized procurement and administrative structure, and expanding alongside recovering national residential construction.
IV. The Duopoly War: IBP vs. TopBuild & Industry Structure (33:00 - 53:00)
For most of the past decade, industry analysts operated under a straightforward framework: two national platforms competed alongside thousands of independent local contractors. While competition remained intense at the branch level, overall industry pricing remained rational, allowing both national operators to achieve profit margins that would have seemed unattainable for subcontracting trades a decade earlier.
In April 2026, that competitive structure shifted.
The QXO shock
On April 19, 2026, QXO, Inc. announced a definitive agreement to acquire TopBuild Corp. for approximately $17 billion.3 The terms valued TopBuild at $505 per share—a 23.1% premium over its prior Friday closing price—with shareholders electing cash or QXO stock, subject to proration, in a mix of roughly 45% cash and 55% stock.3 Stockholders of both companies approved the transaction on June 29, 2026, with approximately 99% of votes cast at QXO's meeting in favor and approximately 78% at TopBuild's.15 The deal closed on July 1, 2026.4
The scale of the transaction reflects significant ambition. QXO Chairman and CEO Brad Jacobs—who previously built United Rentals and XPO—described building QXO into a market leader through more than $13 billion of acquisitions in eleven months, closing Beacon in 2025 and Kodiak Building Partners for approximately $2.25 billion on April 1, 2026, before TopBuild.3 The combined company holds the top position in insulation, second in roofing, and top in waterproofing, employing approximately 28,000 people across roughly 1,150 locations, and targets $50 billion in annual revenues within a decade.3
For IBP, the strategic implications of this transaction present both operational risks and potential advantages.
From a bear perspective, IBP's chief competitor now sits inside an entity with dramatically greater purchasing scale across multiple product categories, an explicit strategy of procurement and cross-selling synergies, and the balance sheet to be aggressive on price to win share. QXO expects to realize approximately $300 million of synergies by 2030, from cross-selling as well as scaled procurement, network optimization and logistics.3 If any of that is funded by lower installed prices to builders, IBP's margin structure could face pressure. The scale gap is now stark: TopBuild generated approximately $6.2 billion of net sales and roughly $1.14 billion of adjusted EBITDA in 2025, on an acquisition-adjusted basis—more than twice IBP's revenue and more than twice its EBITDA.3
The bull reading suggests that acquirers paying $17 billion generally need investment returns rather than price wars, and integrating a specialized insulation installer into a broader distribution organization poses genuine cultural and operational challenges. Jacobs himself framed TopBuild's roughly 18% adjusted EBITDA margin as best-in-class and something QXO wants to replicate elsewhere—which is not the language of a buyer planning to compete margin away.3
When asked on IBP's first-quarter 2026 earnings call how the merger alters competitive dynamics, Chairman and CEO Jeffrey Edwards stated that the company was not anticipating any great changes, noting the competitor had been a competitor all along, while suggesting the deal could be an upside for IBP's acquisition pipeline because a distribution-focused owner may be less interested in buying installation businesses.8
Whether QXO's ownership alters local branch pricing discipline or changes the acquisition environment for local contractors remains an open question that will depend on multi-quarter pricing and market share trends.
The shape of the two businesses
Prior to the acquisition, IBP and TopBuild maintained distinct operating structures. TopBuild—spun out of Masco in 2015—ran two engines: TruTeam, a national installation contractor, and Service Partners, a specialty distribution arm selling to independent installers across more than 450 locations in the United States and Canada.15 It was, in effect, simultaneously the largest competitor to independent installers and their primary supplier.
IBP is comparatively pure-play. In 2025, 93% of net revenue came from the service-based installation of building products, forming the Installation operating segment and the company's single reportable segment.1 The remainder consists of regional distribution operations serving the Midwest, Mountain West, Northeast and Mid-Atlantic—roughly 5% of net revenue—and cellulose manufacturing operations at approximately 2%.1
This strategic distinction matters. While distribution provided TopBuild with a second profit pool, it required supplying independent contractors who competed directly with its installation branches. IBP's distribution platform is smaller and increasingly internal. On the fourth-quarter 2025 call, Edwards estimated the company was servicing roughly 60% to 70% of its branches from about five or six distribution locations, noting that the internal distribution build-out had worked as expected and helped margins.8
Leverage over the manufacturers
Upstream, industry structure is highly concentrated. Fiberglass insulation manufacturing is primarily served by four major manufacturers: Owens Corning, Knauf Insulation, CertainTeed and Johns Manville.1 IBP buys significant volume from all four and maintains relationships with each spanning more than two decades, with its three largest suppliers accounting for approximately 35% of all material purchases in 2025.1
This arrangement creates a bilateral oligopoly where a concentrated seller base faces a concentrated buyer. The company's stated advantage is that its national purchasing volumes account for a meaningful portion of these suppliers' production, allowing manufacturers to plan production schedules—and allowing IBP to negotiate preferred supply terms and minimize purchases through distribution and retail.1
The dynamics of this purchasing relationship were outlined on IBP's first-quarter 2026 earnings call. Observing that a manufacturer was preparing to bring significant fiberglass capacity back online, Chief Financial Officer Michael Miller stated that he saw no near-term tightness in fiberglass.8 Edwards added that there was absolutely no tightness in material flow.8
Spray foam presented a different dynamic. Miller noted two announced price increases totaling roughly 25%, which he expected the market to largely absorb because foam manufacturers' factory costs had risen. He sized spray foam at about 11% of IBP's total sales, noting that an average spray foam job runs roughly twice an average fiberglass job—though not on a like-for-like basis, since foam homes are typically much larger.8
These dynamics demonstrate that national volume delivers procurement power—better terms and allocation than a single-truck competitor—rather than total immunity from input cost inflation. When manufacturers raise prices during periods of softer demand, IBP's margin protection relies on passing those costs through to higher-end builders while managing margin pressure in price-sensitive segments.
Leverage over the builders
Downstream, IBP serves a highly dispersed customer base. Single-family homebuilders remain fragmented, with the top 100 builders collectively representing about 49% of the market.1 IBP's own top ten customers accounted for approximately 14% of net revenue in 2025, and its single largest customer represented approximately 4%.1
This customer structure reflects localized service execution: IBP's largest customer is independently serviced by 96 different IBP branches nationwide.1 Of IBP's top 20 customers, 18 are homebuilders and two are commercial customers, and most of the top 10 have been customers for at least two decades.1
Low customer concentration provides structural diversification, but it does not eliminate exposure to production slowdowns among entry-level builders. Entry-level production builders—the public builders at the low end—represent about 14% of total revenue, and that is precisely where pricing pressure is concentrated.8 Across 2025, public builders' homebuilding revenue declined around 6% and IBP's revenue with them declined around 6%: direct tracking from a supplier holding market share alongside its customers' underlying build rates.8
When single-family housing activity slowed, the company relied on market expansion outside core residential insulation—a strategy initiated through a major commercial acquisition nine years earlier.
V. The Commercial Pivot: Alpha Insulation & End-Market Diversification (2017–2020) (53:00 - 1:08:00)
By 2015, the business in Columbus had recovered, with revenue roughly doubling from its housing-crash trough. Yet the core risk profile remained unchanged: the platform was still fundamentally a bet on single-family housing starts. Every insight management gained regarding operating leverage and every local branch acquired depended on a macro variable the company could not control—one that had nearly caused its demise a few years earlier.
Diversification within residential construction offered limited protection. Multi-family projects provided modest insulation at the margin, but remained tied to overall housing cycles. IBP required a revenue driver independent of thirty-year mortgage rates.
The Alpha deal
On January 5, 2017, IBP closed its acquisition of Trilok Industries, Inc., Alpha Insulation and Waterproofing, Inc., and Alpha Insulation and Waterproofing Company—collectively, Alpha.9 Founded in 1982 and headquartered in Atlanta, Alpha served commercial customers through nine branches across Georgia, Florida, Texas, Tennessee, and North Carolina.9 The deal brought specialized commercial insulation, waterproofing, fire-stopping, and fireproofing expertise into a platform that then operated just over 100 branch locations.9
It marked IBP's largest acquisition to date.10 Total consideration reached roughly $117 million, comprising approximately $82.1 million in cash, $21.7 million in contingent earn-outs, $10.9 million in stock via 282,577 shares issued to the seller's equityholders, and $2.0 million in assumed seller obligations.7 Vic Verma, Alpha's founder and chief executive, remained to run the unit, and the business continued operating under its established brand.9
The underlying logic rested on differing economic cycles: commercial construction operates on a longer timeline than single-family housing. Projects like hospitals, stadiums, schools, airports, office towers, and industrial facilities involve multi-year build schedules, distinct financing, and separate permitting processes, which tends to provide greater revenue visibility.1 The acquisition also introduced formal backlog tracking to IBP for the first time; previously, residential jobs were scheduled and completed so quickly that backlog was not considered material to the business.10
The skeptic's case, and how it aged
The transaction carried clear execution risks at the outset.
First, working capital dynamics differed sharply. Commercial construction relies on progress billings and retainage—where project owners withhold a percentage of payment until final completion—making cash conversion materially slower than in residential subcontracting, where crews install material and invoice within days. Integrating a retainage-heavy model altered IBP's cash flow cadence.
Second, accounting rules introduced complexity. Commercial contracts are recognized over time using a cost-to-cost input method based on estimated total costs to completion. As IBP noted in its filings, using estimated costs to complete is a significant variable in determining recognized revenue and can change throughout a contract's duration.1 Percentage-of-completion accounting historically creates earnings volatility if cost estimates prove inaccurate.
Third, financial controls posed an explicit risk. In its 2016 disclosures, IBP warned that it might face difficulties incorporating Alpha into its internal control over financial reporting due to material weaknesses and significant deficiencies identified in Alpha's internal control over financial reporting.10 Acquiring an entity with documented control weaknesses in a segment reliant on subjective revenue accounting created a heightened risk of accounting restatements.
Those accounting failures did not materialize. Management excluded the newly acquired subsidiaries from its internal-control assessment during the allowed one-year post-acquisition window—when Alpha represented 18.0% of total assets and 10.2% of net revenue in 2017—and auditor Deloitte & Touche subsequently issued an unqualified opinion on internal control over financial reporting as of December 31, 2017.7 In the years since, no financial restatements have occurred, validating the integration outcome.
What the pivot actually delivered
The operational impact of the diversification strategy yielded measurable structural shifts. Revenue from the commercial end market grew from approximately 11% of consolidated net sales in 2013 to 17% by 2025.1 Over the same period, core insulation installation declined from roughly 74% of revenue to 58% as complementary product lines expanded, reducing IBP's concentration in a single residential trade.1
Crucially, commercial operations provided a buffer during residential downturns. In 2025, commercial same-branch sales rose 10.4% while residential same-branch sales contracted 4.4%, cushioning consolidated same-branch growth to negative 1.3%.1 The performance divergence widened sharply in the fourth quarter of 2025, when commercial same-branch sales expanded 22.9% against a 9.3% drop in residential same-branch sales.2 Heavy commercial same-branch growth surged 38% during that fourth quarter.8
However, commercial growth was uneven across sub-segments. IBP categorizes its commercial exposure into light commercial and heavy commercial—the latter comprising large-scale projects excluded from standard price/mix and job volume metrics because high per-job revenue distorts unit averages.1 While heavy commercial drove segment expansion, light commercial remained soft. Furthermore, management clarified that this expansion was not powered by technology infrastructure demand. Addressing questions regarding data center exposure, CFO Michael Miller stated that IBP was under-indexed in data centers and that heavy commercial growth stemmed instead from institutional projects across education, healthcare, recreation, transportation, and manufacturing.8 COO Brad Wheeler affirmed that the company focused on its core market while capturing data center projects opportunistically within its existing footprint.8
This distinction is critical for evaluating revenue sustainability. IBP's commercial momentum reflects market share gains in traditional institutional construction rather than temporary demand tied to hyperscale technology capital expenditure cycles.
A key operational question centers on capital allocation timing. Throughout 2025 and early 2026, management acknowledged having under-invested in commercial expansion. When asked during the fourth-quarter 2025 earnings call why capital deployment had lagged behind commercial opportunities while residential demand softened, Edwards responded that the operational team had felt fully prepared to accelerate growth only over the preceding two or three quarters, adding that the company was now prepared to grow that business well beyond organically.8 Miller noted that leadership sought to avoid disrupting an already high-performing unit.8 While preserving operational stability was logical, the delay also indicates that the company's highest-growth segment received constrained expansion capital for several years while executive attention remained focused on stabilizing the softer residential core.
VI. The "Price Over Volume" Masterclass: Housing Downturns & Energy Codes (2021–Present) (1:08:00 - 1:26:00)
Between 2023 and 2025, Installed Building Products presented a distinct financial puzzle for housing analysts. As mortgage rates surged and single-family residential activity slowed, the total number of completed installation jobs performed by IBP's crews declined. Yet across those same years, the company generated record net revenue, record gross profit, record adjusted EBITDA, and expanding profit margins.
How a trade subcontractor generates record profitability while completed job volumes fall is answered by a specific operational mechanism. Understanding how this price-over-volume dynamic functions—and identifying where its operational limits emerge—provides essential context for evaluating the company's financial model.
The decoupling, in plain English
IBP reports two organic performance metrics separately: job volume, representing the year-over-year change in completed same-branch jobs, and price/mix, reflecting changes in product mix and unit pricing.1 Between 2023 and 2025, these two drivers moved in opposite directions.
In 2025, same-branch job volume declined 5.7% while price/mix increased 1.6%.1 In 2024, volume was essentially flat at positive 0.2% while price/mix grew 3.7%.1 In 2023, volume fell 8.4% while price/mix expanded 7.2%.1 Across three consecutive years, the average dollar value generated per job rose even as total job counts stagnated or fell.
Three main forces drove that decoupling:
Energy codes. Building energy codes are updated periodically, with each revision requiring higher insulation R-values, tighter air sealing, and improved building envelope performance. The U.S. Department of Energy determined that structures meeting the 2021 International Energy Conservation Code achieve national site energy savings of approximately 9.4% relative to the 2018 edition; upon publication of that determination, each state was required to certify whether it had reviewed and updated its residential code to meet or exceed the standard.13 Higher thermal requirements and continuous air barrier mandates increase material volume and labor hours per house—content growth entirely independent of total home completions. Management has also cited federal energy-efficiency legislation as a supporting long-term demand catalyst.8
Product mix. High-performance installation materials carry significantly higher job values. On an average job, spray polyurethane foam generates roughly twice the revenue of standard fiberglass insulation, with installation concentrated in larger custom and semi-custom homes.8 Spray foam represented approximately 17% of insulation installation sales in 2025.1 In addition, branch sales teams expand complementary product lines—such as garage doors, rain gutters, shower doors, closet shelving, and blinds—when core insulation activity slows. CFO Michael Miller described this cross-selling focus as a compensating behavior driven by incentive design: because field compensation is closely tied to branch profitability, salespeople and branch managers prioritize complementary products when residential insulation volume softens.8
Customer mix. Customer orientation introduces a cyclical margin dynamic. Entry-level production builders buy at lower gross margins, whereas custom and semi-custom builders buy at higher ones. When the entry-level market weakened while custom homebuilding held firm, IBP's sales mix shifted toward its more profitable customer base. Management confirmed that this customer shift within the Installation segment drove record gross margins in the fourth quarter of 2025, noting that IBP's Midwest region—weighted toward private, custom, and semi-custom builders—achieved mid-single-digit sales growth during that quarter.28
The numbers, and what they mean
For the full year ended December 31, 2025, IBP delivered $2.97 billion in net revenue, up 1.0% year over year; gross profit reached $1.01 billion at a 34.0% margin, up from 33.8% in 2024; adjusted EBITDA rose to $518.5 million at a 17.5% margin, compared to $511.4 million and 17.4% in 2024; net income reached $265.4 million, or $9.71 per diluted share; and operating cash flow totaled $371.4 million.2 Performance peaked in the fourth quarter of 2025, with gross margin reaching 35.0% and adjusted EBITDA margin hitting 19.0%.2
However, evaluating these financial results requires context. IBP's gross margins have historically run between 33% and 35%, rather than above 36%. Management maintains a full-year target gross margin range of 32% to 34%, and Miller has repeatedly declined to raise that baseline.8 Furthermore, recent margin expansion stemmed largely from temporary customer and product mix shifts rather than permanent structural price increases.
When asked on the fourth-quarter 2025 earnings call whether peak performance justified elevating the long-term gross margin target, Miller clarified that management expects margins to remain within the 32% to 34% range. He explained that an eventual recovery in entry-level production housing will increase lower-margin volume, putting downward pressure on gross margin percentages while generating operating-expense leverage and higher absolute EBITDA dollars.8
This distinction highlights that a portion of IBP's record gross margin was a direct symptom of depressed entry-level housing demand. Management's explicit acknowledgment of this dynamic provides a realistic benchmark for evaluating future earnings power as construction mix normalizes.
Where the mechanism started to break
The operational limits of this price-over-volume mechanism emerged in the first quarter of 2026.
Consolidated net revenue fell 3.5% year over year to $660.5 million, with total same-branch revenue down 5.9%. Residential same-branch sales fell 11.2%, partially offset by a 10.7% gain in commercial same-branch sales. In the core residential business, price/mix was flat while job volumes fell 10.0%; including heavy commercial projects, price/mix rose 2.9% against a 9.9% volume drop. Adjusted gross margin contracted to 32.2% from 32.7% in the prior-year period, adjusted EBITDA fell to $92.1 million, and adjusted diluted earnings per share came in at $1.79, missing market consensus.11
Management attributed roughly $20 million of lost revenue to severe winter weather that reduced working days at several branches—a disruption management had pre-announced during its February call.811 More significantly, management provided detailed disclosure on the margin bridge. Product-level margin—measured before secondary cost of goods sold—actually expanded 70 basis points year over year. The drag on reported gross margin came from operational factors around the product: a 20 basis point headwind from complementary product mix, a 40 basis point impact from lower-margin distribution and manufacturing operations, a 30 basis point increase in depreciation, and a 30 basis point increase in vehicle insurance.8
Below the gross profit line, non-material overhead costs faced broader inflationary pressure: medical insurance expense rose nearly 40%, general liability insurance increased 35%, facility costs grew 12%, and vehicle insurance climbed 25%.8 Miller also projected $15 million to $20 million in additional fuel expense across the remainder of 2026 based on prevailing diesel prices, while noting a 20% increase in aluminum costs impacting the gutter business, which accounts for roughly 6% of revenue.8
These results underscore a structural constraint. While IBP demonstrated strong discipline in material pricing and product margins—achieving 70 basis points of product-margin expansion despite double-digit volume drops—the overall business faced pressure from non-material operational overhead. Expenses such as insurance, fuel, fleet maintenance, and facility leases scale with headcount and physical branch footprint rather than job value. In a flat-to-down volume environment, these fixed operational costs create negative operating leverage.
Management reaffirmed its full-year gross margin guidance of 32% to 34%, anticipating normal seasonal improvement following the first quarter.8 The company reports second-quarter 2026 financial results on August 6, 2026—five days after this publication date—providing the first clean read on whether the first quarter reflected temporary weather and seasonality or an ongoing overhead cost challenge.
VII. Segment Economics, Unit Economics & The Installer Labor Moat (1:26:00 - 1:44:00)
Strip away the corporate umbrella and Installed Building Products operates as roughly 250 local businesses sharing a central purchasing department, insurance program, software platform, and balance sheet. Evaluating the economics of an individual branch reveals far more about the company's compounding engine than any consolidated financial ratio.
What is actually in the box
The Installation segment essentially is the company. It generated 93% of net revenue in 2025 and constitutes Installed Building Products' single reportable segment.1 The remaining 7% consists of regional distribution at roughly 5% of net revenue and internal cellulose manufacturing at approximately 2%.1
The product revenue mix within installation is more diversified than the corporate name suggests. In 2025, insulation installation accounted for approximately 58% of net revenue. Complementary products filled out the remainder: shower doors, closet shelving, and mirrors represented roughly 7%; garage doors accounted for about 6%—with roughly 22% of that subset coming from ongoing aftermarket service, providing the company's only recurring revenue stream; waterproofing contributed approximately 5%; rain gutters accounted for about 4%; fire-stopping and fireproofing represented roughly 4%; window blinds made up about 3%; and other building products comprised the final 6%.1
Within the insulation category itself, traditional fiberglass and cellulose accounted for roughly 83% of sales, while spray polyurethane foam represented approximately 17%.1 Fiberglass consists of fibrous glass bound by thermoset resin, containing an average of 50% recycled material and sold as batts or loosefill, whereas cellulose is manufactured primarily from recycled paper and cardboard with at least 75% recycled content and blown in with specialized equipment.1 Installed Building Products produces its own cellulose internally through Advanced Fiber Technology in Bucyrus, Ohio, and Carolina Precision Fibers in Ronda, North Carolina, which was acquired in 2025.1
Beyond commercial operations at approximately 17% of revenue, the company does not disclose explicit percentage breakdowns for its other end markets; filings describe single-family residential as the largest market, with multi-family development and repair-and-remodel projects comprising the balance.1 Consequently, any precise single-family revenue model relies on external estimates rather than SEC filings.
Branch-level unit economics
The company does not disclose branch-level revenue, truck counts, or local operating margins. However, dividing $2.97 billion in 2025 net revenue across more than 250 branch locations implies an average branch size of roughly $12 million in annual revenue.1 That average spans a wide spectrum—a mature Columbus branch offering eight product lines operates at a vastly different scale than a recently acquired two-year-old branch running a single line—but it provides a baseline for local branch economics.
The defining economic characteristic of this business model is its low capital intensity. Combined capital expenditures and total incurred finance leases were approximately $17 million in the fourth quarter of 2025, or roughly 2% of revenue.8 In the first quarter of 2026, capital spending totaled approximately $18 million, representing about 3% of revenue on a seasonally lower revenue base.8 Net property and equipment stood at $183.3 million at year-end 2025, with vehicles and equipment accounting for $412.7 million in gross carrying value before accumulated depreciation.1 That modest physical asset base—trucks, insulation blowers, spray rigs, and leased branch warehouses—supports a $3 billion revenue platform.
This capital-light structure yields robust cash conversion. Generating $371.4 million in operating cash flow against $518.5 million in adjusted EBITDA in 2025 represents a pre-capex conversion rate of roughly 72%; after accounting for capital expenditures of approximately 2% of revenue, free cash flow conversion lands near 60% of adjusted EBITDA.2 For an enterprise with no manufacturing plants to retool and no research and development budget, this high cash yield forms the core financial payoff.
A second crucial financial feature is cost flexibility. The operating structure relies heavily on variable costs, with materials and direct labor forming the largest expense lines and most installation workers compensated on a completed-job basis.1 When installation volumes decline, working capital requirements shrink as inventory and accounts receivable are converted into cash.1 Chief Financial Officer Michael Miller illustrated this mechanism during the fourth-quarter 2025 call, noting that several branches in Texas and Florida maintained stable operating margins despite significant sales drops, attributing that resilience to variable cost flex and branch manager compensation tied directly to branch profitability.8
This flexible cost structure explains why operating income does not collapse during volume drawdowns. However, it also defines the boundary of margin protection: fixed operational costs such as vehicle insurance, depreciation, and facility leases cannot flex downward with job volume, as highlighted by the margin compression experienced in the first quarter of 2026.
The labor moat, examined
In the installation trade, the primary constraint on growth is neither material availability nor builder demand, but crew capacity. Installed Building Products employed approximately 10,400 people at year-end 2025, consisting of roughly 7,100 installers, 800 sales professionals, 700 production personnel, and 1,800 administrative and management staff.1 Fewer than 3% of employees are covered by collective bargaining agreements, and the company has never experienced a work stoppage.1 The workforce reflects significant diversity, with minority representation exceeding 50% and Hispanic or Latino workers accounting for 49.5%—a proportion above construction industry averages.1
The company's primary operational claim centers on workforce retention. In 2025, Installed Building Products recorded an average monthly installer turnover rate of 3.2%, compared to the U.S. construction industry average of 4.0% reported by the Bureau of Labor Statistics.1 That represents a sustained 80-basis-point retention advantage. Tenured leadership reinforces this stability, with regional managers, branch managers, and sales personnel averaging more than 12 years with the company, and the sales force specifically averaging about 11 years.1
Workforce retention directly drives productivity because installation quality and speed depend on learned field skills. Management measures this effect directly, reporting a 4% increase in annual sales per installer per business day in 2025.1 Experienced crews complete jobs faster, generate fewer builder callbacks, and pass municipal inspections on first walkthroughs. Reduced turnover also lowers recruitment and training costs while improving field safety records—a critical factor given that workers' compensation represents a major expense item.
Maintaining lower turnover requires institutional benefits that small, independent contractors cannot easily match: employer-sponsored medical insurance, 401(k) plans, paid time off, longevity stock awards, financial wellness programs, and employee savings matching.1 Furthermore, the Installed Building Products Foundation, established in 2019, awarded more than 240 grants totaling over $4.1 million in 2025 for scholarships and employee emergency assistance, bringing its cumulative grant funding to over $18.4 million since inception.1
While a turnover rate 80 basis points below the national average provides a tangible operational edge, it does not constitute an impenetrable barrier against broader labor market pressures. Construction labor availability can tighten rapidly, and workforce demographic composition exposes the company to regulatory shifts; filings explicitly cite potential changes in labor or immigration laws, along with compliance in employment eligibility verification, as operational risk factors.1 Nevertheless, in a trade where revenue growth is ultimately governed by qualified crew capacity on job sites, superior worker retention serves as a compounding competitive advantage.
This combination of asset-light economics, flexible cost structures, and a defensible labor position underpins Installed Building Products' market strategy. The final task is evaluating how those operational advantages withstand formal strategic frameworks and rigorous financial scrutiny.
VIII. Strategic Frameworks: Helmer's 7 Powers & Porter's 5 Forces (1:44:00 - 1:59:00)
Strategic frameworks are most useful when applied to test hypotheses rather than decorate narratives. Applied rigorously, they demonstrate that Installed Building Products possesses fewer sources of durable competitive advantage than its recent financial performance might suggest—and that its genuine advantages are real but narrower than the bullish investment case assumes.
Hamilton Helmer's 7 Powers
1. Scale economies — real, but bounded. IBP's purchasing scale is tangible: the company buys directly from manufacturers rather than distributors, with its three largest suppliers accounting for roughly 35% of material purchases under relationships spanning more than two decades.1 This scale yields preferred pricing and supply allocation. However, this advantage is now shared with a chief competitor operating inside a significantly larger distribution organization. Furthermore, as first-quarter 2026 performance demonstrated, purchasing scale provides no protection against rising costs for vehicle insurance, medical coverage, or diesel fuel.8 Scale advantages are substantial in material procurement, but absent across general operational overhead.
2. Process power — operational, but difficult to benchmark externally. Over decades, IBP has refined branch logistics, route density, municipal inspection scheduling, and safety protocols, managing these workflows centrally through its jobCORE software platform, which transmits real-time branch data to Columbus headquarters.1 Improving sales per installer support the existence of operational efficiencies. The analytical challenge is verification: with its sole national peer absorbed into a broader corporate structure, external benchmarking of relative process efficiency has become increasingly difficult.
3. Cornered resource — moderate, and centered on labor. A multi-state network of trained, safety-certified installation crews—particularly for complex spray foam application—represents IBP's closest equivalent to an uncopyable asset. This position is protected by workforce retention advantages rather than long-term employment contracts, making it durable but not exclusive.
4. Counter-positioning — absent. The business model involves no structural trade-off that incumbents cannot replicate without damaging their legacy operations. An independent local installer refrains from building a national platform not out of fear of cannibalization, but because it lacks the capital and scale to do so. That represents a traditional scale barrier rather than counter-positioning.
5. Switching costs — moderate and asymmetric. For a homebuilder mid-subdivision, replacing an insulation installer causes operational disruption because framing, electrical, plumbing, and drywall schedules depend on passing insulation inspections. This dynamic produces high customer retention: most of IBP's top ten customers have maintained relationships with the company for at least two decades, and customer churn remains low.1 However, this retention does not translate into pricing power at the lower end of the market, where IBP's revenue with public homebuilders closely tracked those builders' underlying sales in 2025.8 Switching costs protect customer volume rather than unit pricing.
6. Network effects — absent. Expanding operations or adding customers in one branch location does not increase the value of another branch to a third party. The platform benefits from geographical density and cross-selling capabilities, which reflect scale economies rather than network effects.
7. Branding — low, and intentionally localized. IBP markets its services primarily through local brand names and trademarks, explicitly stating in filings that the business is not reliant on any single brand.1 Homebuyers rarely know which subcontractor installed a home's insulation. Brand equity resides in established local relationships, serving as a customer retention mechanism rather than a pricing driver.
In aggregate, IBP exhibits two strong sources of power, two moderate ones, and three that are weak or absent. This profile reflects a well-run operating company with defensible cost and labor advantages, rather than a franchise possessing broad pricing power.
Porter's Five Forces
Supplier power — moderate to high. Four major fiberglass manufacturers supply a concentrated base of large buyers. While IBP's purchasing volume secures favorable terms and product allocation, its pricing power upstream remains limited: faced with announced spray foam price increases of roughly 25% and returning fiberglass production capacity, IBP functions as a price-taker on broad market trends and a negotiator only on the margins.8
Buyer power — moderate overall, but concentrated in entry-level housing. The builder landscape remains fragmented, with the top 100 builders accounting for approximately 49% of the market and IBP's top ten customers generating 14% of revenue.1 However, pricing pressure concentrates among entry-level production builders, who represent roughly 14% of IBP's sales.8 The primary mitigating factor is that installation service execution is managed locally across multiple branch locations, making wholesale contractor switching operationally complex for builders.
Threat of new entrants — low at scale, though low locally. Launching a single local insulation truck requires modest capital. However, replicating a network of 250 branches, direct manufacturer supply agreements, national insurance coverage, and 7,100 trained installers requires substantial capital, time, and organizational coordination. Furthermore, a well-capitalized competitor can enter through acquisition rather than organic building, as demonstrated by the TopBuild transaction in 2026.
Threat of substitutes — very low. Building energy codes mandate thermal envelope performance, limiting direct substitution. Material shifts occur primarily within the category—such as moving from fiberglass to spray foam or hybrid systems—which alters IBP's product mix and margin profile rather than eliminating the service requirement. The primary long-term substitution risk is off-site prefabrication and panelized construction, where insulation is installed in factory settings before reaching the job site. While panelization has expanded slowly, it represents a structural workflow shift worth monitoring.
Competitive rivalry — evolving. For a decade, the industry operated as a stable duopoly alongside localized contractors, supporting disciplined market pricing. The acquisition of TopBuild by QXO introduces an owner focused on procurement synergies and aggressive expansion, making competitive dynamics a key variable going forward.
Evaluating the consensus narrative. A common investment thesis holds that IBP possesses pricing power derived from regulatory mandates. The operational reality is more nuanced. Evolving building codes drive content per home by requiring additional material and labor, but they do not enable IBP to charge higher unit prices for identical work. Recent pricing expansion resulted substantially from temporary customer and product mix shifts, and management has explicitly noted that these mix benefits will normalize as entry-level housing activity recovers.8 Consequently, expectations that consolidated gross margins will permanently remain above 35% are inconsistent with management's stated operational targets.
These strategic frameworks outline the structure of the business platform. Evaluating its ongoing compounding capability requires examining corporate governance, capital allocation, and insider alignment.
IX. Management Credibility, Capital Allocation & Skeptical Investor Stress Test (1:59:00 - 2:14:00)
The most useful way to evaluate a management team is not to read what they say about the future. It is to read what they said about the future three years ago and check.
The people
Jeff Edwards has been Chairman since 1999 and CEO since 2004 — more than two decades directing strategy through a near-death restructuring, an IPO and two housing cycles.51 As of March 23, 2026, he beneficially owned 3,524,938 shares, or 13.1% of the company.12 That is a substantial stake by any public-company standard, though below the 15%-plus figure sometimes cited. Directors and executive officers as a group held 13.8%.12 Institutionally, BlackRock held 13.7% and Vanguard 9.7%.12
His style on calls is unusual for a CEO: brief, deferential to the CFO on anything numerical, and occasionally blunt to the point of terseness. Asked whether the QXO-TopBuild combination changed how builders bundle purchasing, his complete answer was "No, we don't."8 He devotes a disproportionate share of prepared remarks to thanking employees. Read cynically, that is filler. Read against a business whose binding constraint is crew retention, it is at least consistent with where he believes value comes from.
Michael Miller, the CFO, has been directing strategy alongside Edwards for over two decades.1 He is the more revealing voice on calls — voluble, willing to volunteer disaggregated data that was not asked for, and repeatedly explicit that the company does not provide guidance while nonetheless handing analysts the components they need. Brad Wheeler, Chief Operating Officer, has worked at the company in various roles since 2010 and has been credited by name with the heavy commercial turnaround.18
A note on continuity risk: this is a leadership team that has been in place for two decades with no publicly disclosed succession plan for the CEO role. That is a genuine, under-discussed concentration.
Capital allocation, on the record
The framework is stated plainly and has been consistent: leverage well below a stated target of 2.0x net debt to trailing twelve-month adjusted EBITDA, acquisitions first, then dividends and opportunistic buybacks.
Leverage. Net debt to adjusted EBITDA was 1.1x at December 31, 2025 and 1.2x at March 31, 2026.8 In January 2026, IBP closed a private offering of $500 million of 5.625% senior unsecured notes due 2034, used part of the proceeds to fully repay $300 million of notes due 2028, and amended its asset-based revolver to increase commitments to $375 million and extend maturity to January 2031 — leaving nearly $900 million of available liquidity.28 Fitch assigned a first-time Long-Term Issuer Default Rating of 'BB+' with a Stable Outlook.2 For a cyclical subcontractor, refinancing risk is currently close to a non-issue.
Acquisitions. The company has repeatedly targeted at least $100 million of acquired annual revenue per year. It fell short in 2025, completing 11 acquisitions including bolt-ons representing over $64 million of annual revenue, against $75 million from eight companies in 2023.28 It has nonetheless reiterated the $100 million target for 2026, and completed four acquisitions worth roughly $28 million of annual sales in the first quarter alone — putting it on a plausible pace.11 Adjusted return on invested capital was 24% in 2025, in line with the prior three years.8 Missing a stated target and then repeating it is worth flagging; sustaining ROIC in the mid-20s while missing it is the mitigating evidence.
Shareholder returns. In 2025, IBP paid $87.6 million in dividends and repurchased $172.6 million of stock, a 13.1% increase in total capital returned.1 The dividend structure is deliberately two-part: a regular quarterly dividend, raised to $0.39 per share for 2026, plus an annual variable dividend set at $1.80 per share for 2026, up nearly 6%.2 The variable dividend is an honest design for a cyclical business — it lets the company return excess cash without embedding a fixed obligation it might have to cut in a downturn.
The skeptic's case
"Is this just a cyclical roll-up masking organic stagnation with constant small acquisitions?"
The evidence cuts both ways and should be presented that way.
For the skeptic: consolidated same-branch sales were negative 1.3% in 2025 and negative 5.9% in the first quarter of 2026.111 Organic growth has been negative. Total revenue grew 1.0% in 2025 only because acquisitions offset organic decline. If you strip out purchased revenue, this has been a shrinking business for six quarters.
For the defense: the composition matters. Commercial same-branch sales grew 10.4% in 2025 and 10.7% in the first quarter of 2026, and heavy commercial grew 38% and over 20% respectively.1118 The organic decline is entirely a residential-volume phenomenon in a period when national single-family starts fell 6.9% in 2025 and a further 6% in the first quarter of 2026.18 Multi-family same-branch sales fell only 5.7% in 2025 against a 20.3% decline in national multi-family completions — outperformance of that magnitude is share gain, not accounting.1
The fair conclusion: IBP is not masking stagnation, but it is also not growing organically. It is holding share and defending margin in a down cycle while buying growth at the edges. Whether that becomes compounding again depends on a housing recovery that is outside management's control.
The governance questions an activist would actually raise. These are specific and disclosed, and they deserve airing.
First, buybacks from an insider entity. On three occasions in 2025 — March 7, August 19 and November 24 — IBP entered privately negotiated share repurchase agreements with PJAM IBP Holdings, Inc., buying 100,000, 200,000 and 150,000 shares respectively at prices of $168.75, $257.38 and $250.96, each a 3.0% discount to the prior close.12 Jeff Edwards has beneficial ownership of the shares held by PJAM, an Edwards Investors entity.12 Those three transactions total roughly $106 million — more than 60% of the year's $172.6 million of repurchases. There are defensible readings: the discount favors the company, and absorbing insider stock reduces overhang. There is also a less flattering reading: a substantial portion of the buyback program functioned as a liquidity mechanism for the CEO's affiliated holdings rather than as opportunistic open-market repurchase. Both readings are legitimate; the disclosure is clear and the transactions go through a Related Party Transaction Policy administered by the Audit Committee.12
Second, related-party leases and aircraft. IBP paid $722,627 in 2025 base rent to The Edwards Companies, LLC for its Columbus headquarters, plus $285,385 and $154,209 for two branch locations leased from an affiliate of a family member.12 It signed a lease with an Edwards affiliate in 2024 for a new headquarters expected to be occupied in the second quarter of 2026.12 It paid $347,788 under an aircraft lease with an Edwards affiliate and $473,936 as its pro-rata share of ownership costs for a 35% interest in an aircraft co-owned with an Edwards affiliate.12 Individually immaterial against a $3 billion revenue base; collectively, a pattern of the company transacting with entities the CEO controls.
Third, a director relationship worth noting. IBP recorded $24,788,094 of sales in 2025 to affiliates of director Robert H. Schottenstein, including M/I Homes.12 The company states such transactions are on arm's-length terms.12 It is nonetheless a homebuilder customer relationship running through a board seat.
The accounting flags. IBP recorded no goodwill impairment charges in 2023, 2024 or 2025, and carried $70.0 million of accumulated impairment losses from earlier periods against gross goodwill of $520.4 million at the end of 2025.1 But the Distribution reporting unit is worth watching. In the annual quantitative test as of October 1, 2025, estimated fair value exceeded carrying value by 18.4% — down sharply from 32.1% a year earlier, driven by additional carrying value from a 2024 distribution acquisition and lower forecast revenue and EBITDA due to near-term softening demand.1 Deloitte designated goodwill in the Distribution reporting unit a Critical Audit Matter.1 A 100 basis point change in discount rate or residual growth rate would not have triggered impairment, so the cushion is not paper-thin.1 But a cushion that halves in one year in a segment built by acquisition is exactly the kind of thing that becomes a write-down two years later if demand does not recover.
Legal exposure appears routine: various claims and lawsuits incidental to the ordinary course of business, including wage and hour lawsuits, with management stating it does not expect material adverse effect.1 For a company with 7,100 hourly installers, wage-and-hour litigation is a permanent operating cost rather than an event.
X. Playbook: Business & Investing Lessons (2:14:00 - 2:26:00)
1. The most durable arbitrage is organizational, not financial. The reason a family-owned insulation contractor is worth more inside Installed Building Products than as an independent operation has nothing to do with valuation multiple expansion. Inside the platform, the same crews doing the same work purchase materials at manufacturer-direct prices rather than through distributors, secure coverage under national insurance programs, and eliminate local administrative overhead. The economics improve because operating costs drop. Roll-ups reliant solely on financial arbitrage break down when public valuation multiples compress. Platforms that deliver genuine cost synergies can continue acquiring through down cycles—allowing IBP to keep buying local contractors during a housing slowdown even as its own share price fluctuated.
2. Look for the trade that sits on the critical path. The most valuable position in a complex construction supply chain is rarely the largest budget item. It is the trade that gates everything downstream. Insulation accounts for a small fraction of a home's total cost, but its installation and municipal inspection block drywall crews, painters, and interior finish workers. Subcontractors positioned at mandatory, inspected checkpoints possess strategic importance disproportionate to their share of the budget—and that asymmetry creates customer willingness to pay for schedule reliability rather than shop purely on price.
3. Regulation grows content, not price — know the difference. Energy code updates provide a genuine long-term demand catalyst because each revision mandates higher thermal resistance, tighter air sealing, and additional material volume per structure.13 However, stricter building codes do not allow an installer to charge higher unit rates for identical work; they simply expand the physical scope of work per house. That represents a volume-of-content driver that can partially offset declines in total housing starts. Investors who mistake regulatory expansion for pricing power risk misjudging earnings power when construction mix shifts back and gross margins normalize—a trajectory the chief financial officer has explicitly cautioned analysts to expect.8
4. Mix improvement in a downturn is a loan, not a gift. IBP's record profit margins coincided with cyclical weakness among entry-level production builders—the company's lowest-margin customer segment. Margin percentages expanded partly because lower-margin volume contracted. When entry-level construction recovers, gross margins will face downward pressure even as absolute revenue and EBITDA dollars grow. This dynamic recurs across cyclical industries, making customer mix one of the most frequently misread drivers of earnings quality. The critical diagnostic question following any margin record is simple: which customer stopped buying?
5. In labor-constrained trades, retention is the strategy. IBP's installer turnover advantage relative to the broader construction industry translates into higher daily sales per installer, lower recruitment costs, improved field safety records, and fewer builder callbacks.1 The mechanisms driving that stability—employer-sponsored health benefits, 401(k) matching, longevity stock awards, and internal advancement—require capital scale that smaller local competitors cannot match. When qualified crew capacity forms the primary constraint on growth, the contractor that retains its labor force gains market share without sacrificing price discipline.
6. Read the related-party section before the growth section. The most revealing disclosures in corporate filings are often found outside strategic summaries. In IBP's proxy statements, details regarding property leases, aircraft co-ownership, and privately negotiated stock repurchases with insider-affiliated entities provide essential context on corporate governance.12 While each transaction is disclosed and individually small relative to total revenue, the broader pattern remains a relevant input when evaluating capital allocation discipline—and represents the type of detail that attracts scrutiny if operational performance softens.
XI. Bear vs. Bull Case & The 3 Critical KPIs (2:26:00 - 2:40:00)
The bull case
A genuine, quantified supply deficit. The United States remains structurally underbuilt. The 2026 Housing Supply Gap Report from Realtor.com estimated the cumulative shortfall at 4.03 million homes in 2025, up from 3.8 million in 2024, as roughly 1.41 million new households formed against only 1.36 million housing starts.14 Every missing home ultimately requires insulation, and Installed Building Products holds a top-two market position for new single-family installation in over half its operating markets, measured by permits issued.1 Should construction eventually normalize toward household formation, that volume recovery will flow disproportionately to the two operators with national crew capacity.
Codes keep raising content per structure. The U.S. Department of Energy's affirmative determination on the 2021 International Energy Conservation Code obligates states to review and certify their residential codes, ratcheting building envelope requirements upward with each adoption cycle.13 This content expansion provides a rare structural tailwind that operates independently of interest rate cycles.
The commercial pillar is compounding. Heavy commercial operations expanded significantly—rising over 20% in the first quarter of 2026 after a 38% surge in the prior quarter—with backlog continuing to expand despite record revenue.8 Total company backlog reached $162.9 million at year-end 2025, up from $126.3 million a year earlier.1 Management has signaled a willingness to accelerate growth through commercial acquisitions, while identifying mechanical and industrial insulation—a fragmented category offering larger transaction sizes and attractive margins—as a third strategic growth vector.8
The consolidation runway remains broad. Installed Building Products has completed over 200 acquisitions since 1999 while continuing to describe its core residential installation market as highly fragmented with substantial consolidation potential.18 Beyond one other large national peer, the industry consists of several regional operators and thousands of local contractors.1 Chief Executive Officer Jeffrey Edwards noted in May 2026 that the acquisition pipeline remained strong, potentially aided by a chief competitor shifting its focus toward broader distribution.8
Balance sheet optionality. With net debt at 1.2 times adjusted EBITDA, nearly $900 million in available liquidity, and $474.6 million remaining under a share repurchase authorization extending to March 1, 2027, the company maintains the financial flexibility to acquire distressed assets or repurchase its own shares during industry downturns.118
The bear case
A prolonged single-family housing stall. The company's annual report cites a Fannie Mae forecast projecting 1.31 million U.S. housing starts in 2026, representing a 3.7% decline from 1.36 million in 2025.1 Persistent affordability constraints continue to depress entry-level homebuying, directly weakening the volume driver for high-production builders.
Operational overhead inflating faster than pricing. Non-material expenses are experiencing acute cost pressure: vehicle insurance rose 25%, medical insurance increased nearly 40%, general liability grew 35%, and facility expenses climbed 12%, alongside $15 million to $20 million in projected incremental fuel costs for late 2026 and a 20% increase in aluminum input costs.8 Because these fixed overhead items do not yield to material purchasing scale, flat or declining job volumes lead directly to operating margin compression.
Targeted pricing pressure from large builders. Chief Financial Officer Michael Miller confirmed active pricing pressure among entry-level production builders—who represent approximately 14% of revenue—where IBP's sales have tracked public homebuilders' volume declines almost exactly.8 Defending market share while attempting to preserve unit margins creates an operational trade-off in price-sensitive segments.
Evolving competitive dynamics under QXO ownership. Following QXO's acquisition of TopBuild, Installed Building Products faces a primary competitor embedded within a larger distribution entity focused on aggressive cross-selling and purchasing scale. If QXO elects to accept lower installation margins to win market share across broader product categories, industry pricing discipline could face unprecedented pressure.
Gross margin dilution from complementary products. Expanding complementary lines cushions core insulation downturns but places downward pressure on gross margin percentages. In the first quarter of 2026, Miller noted that complementary product mix created a 20-basis-point gross margin headwind, while distribution and manufacturing operations added a 40-basis-point drag—even though distribution and manufacturing support overall EBITDA margin.8 As non-insulation lines expand, headline gross margin metrics become less directly comparable to historical baselines.
Narrowing goodwill headroom in distribution. Fair-value headroom for goodwill in the Distribution reporting unit decreased significantly over a twelve-month period, leading independent auditor Deloitte to classify it as a Critical Audit Matter.1 While no impairment has been recorded, persistent demand weakness across regional distribution networks could force future goodwill write-downs.
The three KPIs that matter most
1. Same-branch net revenue growth, disaggregated by price/mix, volume, and heavy commercial. Same-branch organic growth isolates underlying operating performance from acquired revenue. In the fourth quarter of 2025, for example, price/mix expansion was 1.7% excluding heavy commercial projects, but reached 5.8% when heavy commercial was included.2 A sustained return to positive consolidated same-branch growth driven by job volume—rather than mix shift—would indicate a genuine residential recovery, whereas persistent volume declines alongside flat price/mix, as seen in the first quarter of 2026, signal ongoing market softness.11
2. Adjusted gross margin performance relative to the 32% to 34% target range. Executive leadership has consistently maintained a full-year gross margin target of 32% to 34%, choosing not to elevate guidance even after quarters exceeding the upper threshold.8 Maintaining full-year 2026 gross margins within this band despite escalating overhead inflation would validate management's cost-flexibility thesis, whereas a breakdown below 32% would indicate structural cost pressure. Given first-quarter seasonality, this metric is best evaluated on a full-year basis.
3. Acquired annual revenue relative to the $100 million baseline. This metric tracks M&A conversion and capital deployment discipline. The company added over $64 million in acquired annual revenue in 2025 and reiterated its $100 million target for 2026, securing approximately $28 million during the first quarter.211 Because transaction multiples are not disclosed individually, capital efficiency must be gauged by comparing invested capital against acquired revenue alongside adjusted return on invested capital, which reached 24% in 2025.18 An acceleration in acquired revenue accompanied by declining return on invested capital would signal eroding deal discipline.
XII. Epilogue & What to Watch (2:40:00 - 2:45:00)
There is a particular kind of American enterprise that expands from a single truck and a local phone number, survives a distressed restructuring, and becomes an index constituent that few outside the industry recognize. Installed Building Products is one of them. Beginning in 1977 as a single Columbus location, the business surrendered balance-sheet control during the housing collapse, restructured its debt, listed at $11.00 per share in 2014, and now operates a national network of more than 250 branches generating nearly $3 billion in revenue, $518.5 million in adjusted EBITDA, and $371.4 million in operating cash flow while employing over 10,000 people.126
What remains unsettled, as of August 2026, are three core operational questions that upcoming quarters will begin to resolve.
What does the new competitive structure do to pricing? The company's sole national peer now operates inside an $18 billion combined-revenue distribution conglomerate with a stated $50 billion revenue target and synergy goals rooted in procurement and pricing.3 Management's public position is that competitive dynamics remain unchanged and that the acquisition pipeline may even improve.8 The test lies in IBP's own price/mix disclosures over subsequent quarters. If price/mix holds while job volumes remain soft, the industry's historical pricing discipline survived TopBuild's ownership change. If price/mix erodes, pricing power was weaker than believed.
Do uncontrollable overhead costs moderate, or does the margin band break? IBP has defended its full-year target gross margin range of 32% to 34% through a period when insurance, fuel, vehicle, and facility expenses all inflated at double-digit rates.8 Second-quarter 2026 results, scheduled for release on August 6, 2026, will offer the first clear indication of whether first-quarter margin compression reflected temporary weather and seasonality or an ongoing structural squeeze.
When does entry-level homebuying recover, and how will that affect reported margins? Management has noted that a recovery in entry-level production housing will actually lower gross margin percentages while expanding EBITDA margins, because high-volume production-builder work carries lower gross margins but delivers operating leverage.8 Investors who understand that trade-off will evaluate a cyclical recovery accurately, whereas those focused solely on peak gross margins may misinterpret higher-volume, lower-margin growth.
Beyond those core questions, the key operational metrics to monitor are straightforward: the pace of state-level adoption of updated energy codes, which expands material content per house; the trajectory of heavy commercial backlog, which served as the primary growth engine but faces increasingly challenging comparisons; whether commercial and mechanical-industrial expansion receives dedicated capital; the remaining goodwill headroom in the Distribution reporting unit; and the succession plan for a Chief Executive Officer who has led the company since 2004 and holds a 13.1% beneficial ownership stake.12
In U.S. residential construction, homebuilders market the brand and buyers sign the mortgage. Between those steps, local installation crews climb into framing, blow fiberglass into attics, pass municipal inspections, and unlock the construction schedule for every subsequent trade. That work is mandatory in every cycle, regardless of who owns the truck. The central investment question is not whether the work will be performed, but how economic value is divided among suppliers, installers, and builders—a distribution being actively tested today.
References
-
Installed Building Products, Inc. Form 10-K for the fiscal year ended December 31, 2025 — U.S. Securities and Exchange Commission, 2026-02-26 ↩↩↩↩↩↩↩↩↩↩↩↩↩↩↩↩↩↩↩↩↩↩↩↩↩↩↩↩↩↩↩↩↩↩↩↩↩↩↩↩↩↩↩↩↩↩↩↩↩↩↩↩↩↩↩↩↩↩↩↩↩↩↩↩↩↩↩↩↩↩↩↩↩↩↩↩↩↩↩↩↩↩↩↩↩↩
-
Installed Building Products Reports Record Fourth Quarter and Fiscal Year 2025 Profitability (Form 8-K, Exhibit 99.1) — U.S. Securities and Exchange Commission, 2026-02-26 ↩↩↩↩↩↩↩↩↩↩↩↩↩↩↩
-
QXO to Acquire TopBuild for $17 Billion (Form 8-K, Exhibit 99.1) — U.S. Securities and Exchange Commission, 2026-04-20 ↩↩↩↩↩↩↩↩↩↩
-
QXO Completes Acquisition of TopBuild (Form 8-K, Exhibit 99.1) — U.S. Securities and Exchange Commission, 2026-07-01 ↩↩
-
Installed Building Products, Inc. Form S-1 Registration Statement — U.S. Securities and Exchange Commission, 2014-01-10 ↩↩↩↩↩↩↩↩↩↩↩↩↩↩
-
Installed Building Products Announces Closing of Initial Public Offering of Common Stock and Full Exercise of Option to Purchase Additional Shares (Form 8-K, Exhibit 99.1) — U.S. Securities and Exchange Commission, 2014-02-19 ↩↩↩↩
-
Installed Building Products, Inc. Form 10-K for the fiscal year ended December 31, 2017 — U.S. Securities and Exchange Commission, 2018-02-28 ↩↩↩
-
Installed Building Products Earnings Call Transcripts Archive — Seeking Alpha ↩↩↩↩↩↩↩↩↩↩↩↩↩↩↩↩↩↩↩↩↩↩↩↩↩↩↩↩↩↩↩↩↩↩↩↩↩↩↩↩↩↩↩↩↩↩↩↩↩↩↩↩↩↩
-
Installed Building Products Announces Closing of Alpha Insulation and Waterproofing Acquisition (Form 8-K, Exhibit 99.1) — U.S. Securities and Exchange Commission, 2017-01-05 ↩↩↩↩↩
-
Installed Building Products, Inc. Form 10-K for the fiscal year ended December 31, 2016 — U.S. Securities and Exchange Commission, 2017-02-28 ↩↩↩
-
Installed Building Products Reports First Quarter 2026 Results; Declares Regular Quarterly Cash Dividend (Form 8-K, Exhibit 99.1) — U.S. Securities and Exchange Commission, 2026-05-07 ↩↩↩↩↩↩↩↩↩↩
-
Installed Building Products, Inc. 2026 Proxy Statement (Schedule 14A) — U.S. Securities and Exchange Commission, 2026-04-08 ↩↩↩↩↩↩↩↩↩↩↩↩↩
-
Final Determination: 2021 IECC Edition Affirmative Determination — U.S. Department of Energy, 2021-07 ↩↩↩
-
Housing Supply Gap Surpasses 4 Million Homes in 2025 as Construction Fails to Keep Pace with Demand — Barchart ↩
-
QXO and TopBuild Stockholders Overwhelmingly Approve QXO's Acquisition of TopBuild (Form 8-K, Exhibit 99.1) — U.S. Securities and Exchange Commission, 2026-06-29 ↩↩
-
IBP Market Data & Financial Headlines — The Wall Street Journal ↩
 LinkedIn
 WhatsApp
 Reddit
 Hacker News
 Email
Email Kindle
 RSS Feed
 Spotify
 Apple Podcasts
 Amazon Music
 Audible
 YouTube