The Gorman-Rupp Company: The Pump Maker That Bet on a Bigger Engine
I. The Pump Maker’s Big Bet
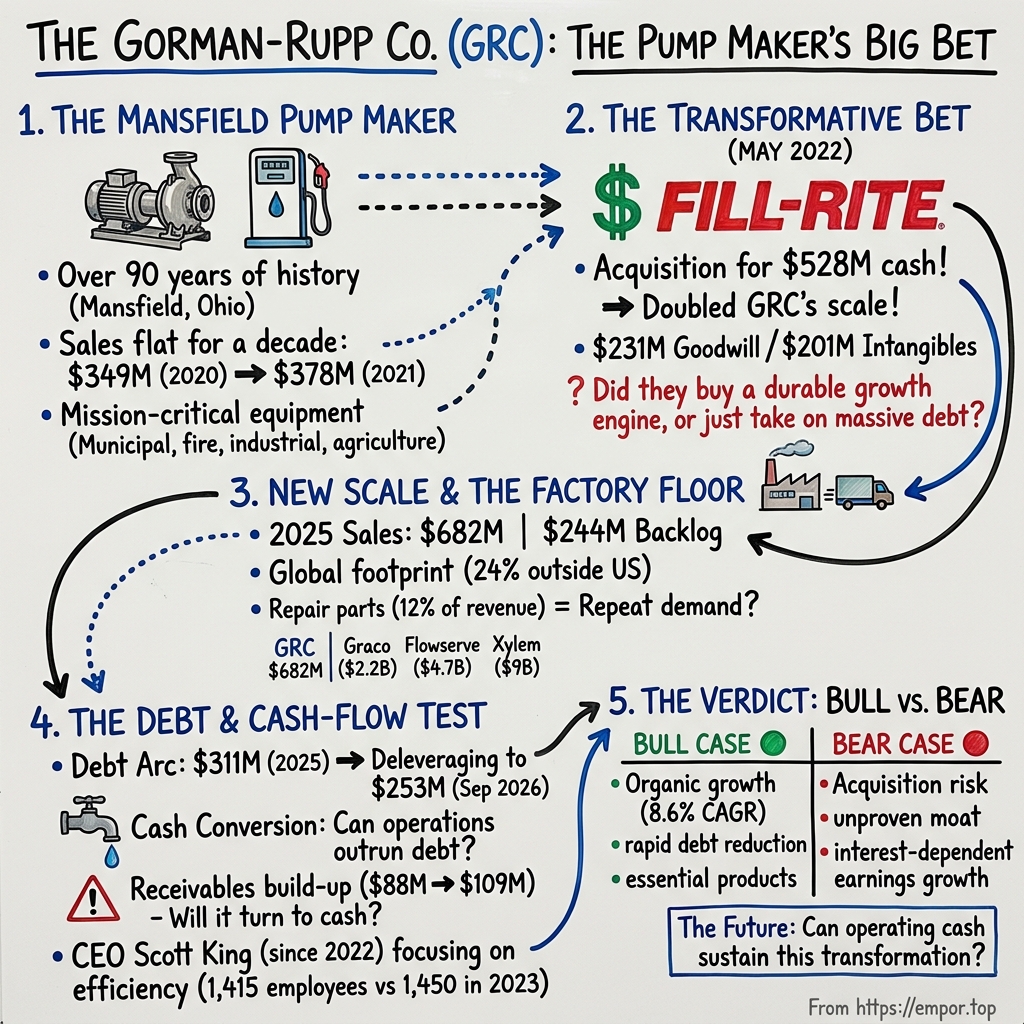
On the last day of May 2022, a pump company in Mansfield, Ohio, did something it had never done in nearly nine decades of business. It wired out more money than it had brought in from customers the entire previous year. The Gorman-Rupp Company closed its purchase of Fill-Rite, a maker of fuel-transfer pumps and meters, from Tuthill Corporation, and the cash consideration came to $528 million.1 In 2021, Gorman-Rupp’s sales had been about $378 million.1
Sit with that mismatch for a moment, because the whole story hangs on it. This was not a sprawling conglomerate shuffling divisions. This was a company that had grown up selling centrifugal pumps, fire pumps, irrigation pumps and sewage lift stations, mostly through distributors, mostly to customers who would rather never think about a pump again once it was installed. It had a tradition of conservative finance so deep that the company carried no borrowings at the end of 2021.2 Then, in a single transaction, it took on hundreds of millions of dollars of debt to buy a business that sold into farms, construction sites and fleet yards, and which reached customers through retail shelves and e-commerce as well as through dealers.3
Four years later, the transformation is visible from the top line down. Sales reached a record $682 million in 2025.4 Net income, which had been about $30 million in 2021, reached $53 million.2 The first nine months of 2026 produced record quarters in a row, and by the end of September the company had cut its gross debt to about $253 million.5 The pump maker that bet on a bigger engine looks, on a quick read, like it won the bet.
But a quick read is exactly what this story resists. Three questions sit underneath the record quarters, and each of them is harder than the headlines suggest. The first is how much of the growth was earned and how much was bought. Doubling a company by acquisition is not the same as doubling it by winning customers, and the reported numbers blend the two. The second is whether Fill-Rite has earned back its price. A business bought for $528 million has to throw off enough cash, for long enough, to justify that sum plus the interest paid to finance it, and Gorman-Rupp does not report Fill-Rite’s standalone profits. The third is whether today’s earnings power survives once the easy tailwinds fade. Some of the recent profit growth came from paying down expensive debt, from one-time costs that did not recur, and from a cost-accounting quirk that shifts with inflation. Strip those out and the question becomes what the core machine actually earns.
The company being judged is simpler to describe than the questions. Gorman-Rupp reports a single segment: it designs, manufactures and sells pumps and pump systems.6 It offers more than 5,000 pump models, from units a quarter of an inch across to machines nearly fifteen feet tall that can move over a million gallons a minute.2 It sells into fire suppression, industrial and HVAC work, agriculture, municipal water and wastewater, construction, OEM equipment and refined petroleum, and it ships to customers in about 140 countries.2 No single customer accounted for more than 10% of sales in 2023 through 2025.6 It is, in other words, a diversified, unglamorous, mission-critical equipment maker, the kind of business that rarely makes the news.
And yet one decision, the Fill-Rite purchase, changed its financial shape more than anything in the prior half-century. It brought $231 million of goodwill onto the balance sheet, which the company’s auditor singled out as its critical audit matter in 2025.6 It turned a debt-free company into a leveraged one. And it set a clock running: every year since, investors have been able to ask whether the acquired business was earning its keep.
So the stakes of this episode are straightforward. If Fill-Rite was a durable growth engine bought at a defensible price, Gorman-Rupp has reinvented itself as a larger, higher-margin pump platform, and the market is right to value it near its own historical norms. If Fill-Rite was a one-time step up in size, financed at a cost that has only recently stopped biting, then the record quarters say less about the future than they appear to. To decide between those readings, the story has to start long before 2022, in a small Ohio city where a pump company learned to live with the fact that nobody buys pumps evenly.
 Subscribe on LinkedIn
II. A Mansfield Pump Maker Learns to Live With Cycles
The founding legend is short, and it is told with a certain Midwestern pride. In 1933, at the bottom of the Depression, J.C. Gorman and Herbert E. Rupp started a pump company in Mansfield with $1,500 of capital. The company describes that sum as its initial and only capital investment.3 The two founders wrote a mission statement that still appears in the company’s materials today: to provide a quality product, competitively priced, delivered on time, backed by reliable service, at a profit that gives shareholders an equitable return and employees competitive wages and benefits.2
That sentence reads like boilerplate until you notice what it leaves out. There is nothing in it about being the biggest, the cheapest or the most innovative. It is a promise about reliability, delivery and service, which happens to be exactly what a pump buyer cares about. A pump is the kind of equipment whose value is invisible until it fails. When a sewage lift station stops, streets flood. When a fire pump will not start, a sprinkler system becomes decoration. When a dewatering pump on a construction site quits, a foundation pit fills with water and a crew stands idle at hundreds of dollars an hour. The buyer of a pump is not really buying a machine. The buyer is buying the absence of a disaster.
From that small base, the company grew slowly and in a recognizable pattern: build a reputation in one kind of pump, then add adjacent kinds. It opened a Canadian manufacturing plant in 1956, its first move abroad.3 It listed its shares publicly in 1968, first on the American Stock Exchange; it moved to the New York Stock Exchange in 2017.7 In 1988 it bought Patterson Pump, a maker of large pumps for sewage, flood control and fire protection, and a decade later set up Patterson Pump Ireland to make fire pumps for Europe.3 In 2010 it added National Pump Company, which built submersible and vertical turbine pumps for irrigation, municipal and petroleum customers, followed by a string of small domestic and international purchases through 2016.3
Two threads ran through those decades. One was family. Jeffrey Gorman ran the company as chief executive from 1998 through 2021 and remains its chairman.6 The other was money: the company paid cash dividends quarter after quarter and raised the annual payout for 53 consecutive years through 2025, a streak management likes to note puts it among the top 50 U.S. public companies on that measure.3 A company that raises its dividend for half a century is telling investors that it values steadiness above almost everything else.
Steadiness, however, is not the same as growth, and the decade before Fill-Rite shows the difference. Sales were about $406 million in 2015.8 By 2020 they had fallen to about $349 million.9 Management itself characterizes the 2016–2020 period as a sales contraction of about 3% a year, all of it organic.3 Even the 2021 rebound, to about $378 million, left the company roughly where it had been six years earlier.10 Net income told the same flat story: about $25 million in 2015 and about $25 million again in 2020.89
Why did a well-run pump maker go sideways for a decade? The record does not point to a single blow. The answer is closer to the nature of the business. Gorman-Rupp’s end markets each have their own cycle. Construction dewatering follows building activity and rental-fleet purchasing. Agriculture follows farm incomes, which follow commodity prices and weather. Petroleum follows refinery and pipeline spending. Municipal work follows bond issues and utility rates. Diversification means these cycles rarely all turn down at once, but it also means they rarely all turn up at once. A diversified pump maker tends to grow at roughly the pace of the industrial economy, minus whatever it loses to competitors and plus whatever it gains from new products.
The long history is real evidence of endurance. A company does not survive ninety years in a fragmented, competitive industry, against rivals many times its size, without doing something right for its customers. But the history is not evidence of immunity from cycles, and the record of 2015 through 2021 makes that plain. When Scott King took over as chief executive on January 1, 2022, he inherited a strong brand, a clean balance sheet and a top line that had not grown in six years.6
That is the backdrop against which the Fill-Rite decision has to be judged. One reading is that the old business had reached a ceiling, and that the only way to restart growth was to buy it. Another is that management saw an opportunity to put an underused balance sheet to work, expanding the company’s reach into fuel transfer and retail channels where its existing brands did not go. Both readings could be partly true. Before weighing them, though, it is worth understanding what the core business actually does when an order comes in, because that is where any durable advantage would have to live.
III. The Pump Order That Has to Become a Shipment
Picture a consulting engineer at a desk in a mid-sized American city, drawing up the plans for a new wastewater pumping station. The station has to lift sewage from a low-lying neighborhood into a trunk main, around the clock, for decades. The engineer specifies the flow rate, the head pressure, the solids the pump has to pass, the power supply, the controls, and often a short list of acceptable manufacturers. The contractor who wins the job then buys the pump system, usually through a local distributor who knows the products, stocks the parts and will answer the phone when something goes wrong at two in the morning.
That chain, from specification to distributor to installation, is the arena in which Gorman-Rupp competes. Most of its revenue comes from selling pumps and pump systems under fixed-price contracts, and most of those contracts have a single performance obligation: deliver the product.6 The company generally recognizes revenue when control of the product transfers to the customer, which usually means when it ships.6 There is no subscription, no standard multi-year contract term and no disclosed minimum purchase commitment.6 Gorman-Rupp earns its money one order at a time.
That makes the order book the company’s pulse. Gorman-Rupp ended 2025 with a backlog of $244 million, and it expected substantially all of its year-end backlog to ship within a year.6 Against 2025 sales of $682 million, that backlog represented a bit more than four months of work.4 It is a buffer, not a moat. A pump maker with four months of orders in hand can see the next couple of quarters clearly and the year after that hardly at all.
The order flow in 2025 was genuinely strong. Incoming orders reached a record $728 million, up about 10.5%, which meant the company booked more work than it shipped and the backlog grew from $206 million to $244 million over the year.34 That is the healthiest kind of growth signal a project-driven manufacturer can give: demand running ahead of output.
The spread of that demand is the company’s first line of defense. Management describes its market mix as diversified by design. Industrial, chemical and HVAC customers and fire-suppression customers each account for roughly a fifth of sales. Agriculture is roughly a seventh. Municipal water and wastewater, and construction and dewatering, are each somewhat more than a tenth. OEM supply and refined petroleum are smaller.3 International customers took about 24% of 2025 sales.6 Most of the company’s distribution is exclusive by geographic territory and market, and no single distributor accounts for more than 5% of sales.3
This is the opposite of a concentrated customer base, and it matters for bargaining power. A pump maker that sells 40% of its output to one rental-fleet giant has to accept that giant’s prices. A pump maker selling small orders through hundreds of distributors into eight end markets faces many buyers, none of whom can dictate terms. That is a genuine structural advantage, and it is evidenced: Gorman-Rupp reported no customer above 10% of sales in any year from 2023 through 2025.6 What it does not report is how concentrated the next tier is. The company does not disclose its top-five or top-ten customer share, or customer retention, or how many distributors carry its lines.6
Then there is the aftermarket. Pumps wear out, especially pumps that move abrasive slurries or corrosive chemicals, and they need replacement parts. Gorman-Rupp sold $80 million of repair parts in 2025, about 12% of revenue.6 Management notes that most parts ship within 24 hours and that the repair-parts share varies enormously by application: around 30% of sales in construction and industrial work, where pumps chew through impellers and seals, and minimal in fire suppression, where pumps sit idle most of their lives.3 Adjusted for the markets with little repair activity, management estimates the parts share at about 20%.3 The company’s own illustration of pump lifespans runs from less than a year in abrasive construction and fracking service to more than twenty years in clean-water and fire applications.3
Here is where a careful listener should slow down. Repair parts are real repeat demand, and a company with a large installed base of pumps in the field earns some revenue simply because those pumps exist. But 12% of revenue is not a recurring-revenue business. The other 88% has to be won, order by order, against competitors. And because Gorman-Rupp sells mostly through independent distributors, it does not always own the relationship with the end user who replaces the parts. Repair parts are a cushion under the business, not a floor.
The giants on the other side of the table
The industry frame makes the point sharper. Management cites industry estimates that the pump market runs to about $80 billion a year and describes it as fragmented, with many niche players, divisions of larger companies and hundreds of private firms.3 Gorman-Rupp’s own competitor slides list familiar names: Xylem, with brands like Flygt, Goulds and Godwin; Flowserve; IDEX; Franklin Electric; Pentair; Dover; Ingersoll Rand; and private firms like Grundfos and Thompson Pumps.3
Scale those names against Gorman-Rupp and the picture is humbling. Xylem reported about $9.04 billion of revenue in 2025.11 Flowserve reported about $4.73 billion.12 Graco, whose fluid-handling equipment overlaps in some applications, reported about $2.24 billion.[^13] Franklin Electric, which competes in water and fueling systems, reported about $2.13 billion.13 Gorman-Rupp, at $682 million, is a fraction of each. None of these companies is a pure substitute for Gorman-Rupp; each has a different product mix, and much of their revenue comes from products Gorman-Rupp does not make. Revenue size does not translate into pump-market share, and Gorman-Rupp does not disclose its share of any defined pump market. If management’s $80 billion estimate is in the right range, Gorman-Rupp holds less than 1% of it, though that comparison mixes very different product categories. Management says the company holds number-one positions in many of the niches where it operates, a claim it does not support with published share data.3
So what wins a Gorman-Rupp order? Management’s answer is the founders’ answer: quality, availability, reliable service and knowledgeable distribution. It points to certified test labs that can replicate harsh field conditions, to fire pumps carrying UL and FM Global approvals, to flood-control pumps that can move a million gallons a minute, and to distributors expected to keep a physical location, stock inventory and maintain trained service staff.3 Management also argues that the pump industry is mature, which tends to produce pricing stability, and that customers are brand loyal when their needs are met because so many applications are mission-critical.3
Those are plausible advantages, and some are partly evidenced. The fire-pump approvals are real barriers: a newcomer cannot sell into a sprinkler system without them. The distributor network is real and diversified. The parts business is measurable. But the stronger claims, brand loyalty, pricing power, durable share, are management’s characterizations rather than published facts. The company does not disclose customer retention, win rates or price realization separate from volume.
A supply chain with a narrow point
There is one more piece of the operating picture, on the supply side. Gorman-Rupp says it has multiple sources for most materials and is not dependent on any single supplier for material components. It flags one exception: a limited number of suppliers for motors and motor components used in its large submersible pumps and systems.6 It has no long-term supply contracts for materials.6 Management also emphasizes that its supply chain and manufacturing are primarily U.S.-based, which it argues has minimized tariff-related price increases.3
The motor point deserves a plain explanation. A submersible pump is a sealed pump and motor unit that sits underwater, in a well or a wet pit. The motor is a specialized component; it must be waterproof, cooled by the fluid around it and built to run for years without inspection. If only a handful of companies make the motors Gorman-Rupp needs for its largest systems, a disruption at one of them could delay shipments or raise costs on exactly the big-ticket municipal and flood-control projects that carry the most visibility. It is not a crisis, and the company presents it as a known constraint, but it is a reminder that a pump maker is also an assembler whose output depends on others’ capacity.
Put the pieces together and the core business looks like this. It is diversified, order-driven, distributor-led and modestly aftermarket-supported. It plausibly wins on reliability and breadth, and it faces competitors with several times its scale. All of which leaves the question that framed the end of the 2010s: if the commercial edge was real, why had the company gone a decade without growth, and why did management decide that the way forward ran through a $528 million purchase?
IV. Fill-Rite: The $528 Million Change in Scale
On April 27, 2022, less than four months into his tenure as chief executive, Scott King announced that Gorman-Rupp had agreed to buy the Fill-Rite and Sotera businesses from Tuthill Corporation.14 It was the largest deal in the company’s history by a wide margin, and King did not undersell it. He said Gorman-Rupp was “extremely excited to welcome Fill-Rite’s impressive portfolio of mission-critical pumps,” and he named the milestone he expected the deal to deliver: revenues of “over $500 million annually.”14
To understand why King would bet so much so early, it helps to know who he is. He is not a dealmaker parachuted in from private equity. He is a mechanical engineer, trained at the University of Minnesota, with an MBA from the University of Michigan, who joined Gorman-Rupp’s Pumps USA division in 2004 as a manufacturing manager.3 He rose through director of manufacturing, general manager, vice president of operations and chief operating officer before becoming president in 2021 and CEO in 2022.3 Outside the company, he chaired the board of the Hydraulic Institute, the pump industry’s trade association, and served as president of the Rotary Club of Mansfield.3 He is, in short, a factory-floor executive raised inside the company’s own culture, and he succeeded Jeffrey Gorman, who had held the top job since 1998. That background matters, because his first major act as CEO was the least conservative thing the company had done in decades.
Fill-Rite makes rugged pumps for moving fuel and other liquids out of tanks and drums: the electric and hand pumps a farmer uses to fill a tractor from a bulk tank, the pumps a contractor mounts on a pickup to refuel equipment on site, along with meters, nozzles, hoses and accessories.14 The deal also brought Sotera, a sister brand, and together the businesses gave Gorman-Rupp fixed and portable fuel-transfer pumps and chemical-transfer pumps as well as meters and accessories.3 The businesses operated from Fort Wayne, Indiana, and Lenexa, Kansas, and Gorman-Rupp said their supply chain was about 95% U.S.-based.14
This was a different kind of pump business from the one Gorman-Rupp knew. Its products were smaller, more standardized and sold in far greater unit volumes. They reached customers through farm-supply and industrial distributors, but also through retail and e-commerce, a channel that, management notes, is primarily attributable to Fill-Rite.3 Where a Gorman-Rupp fire pump might be a specified, engineered item delivered to a construction project, a Fill-Rite transfer pump is closer to a premium tool: something a buyer chooses off a shelf or a website because the brand is trusted.
The financial case looked attractive on its face. For the twelve months ended March 2022, Fill-Rite had generated about $140 million of revenue and about $34.5 million of adjusted EBITDA, a margin of roughly 25%.14 Gorman-Rupp’s own adjusted EBITDA margin in 2021 was about 15%, on adjusted EBITDA of $58 million.2 So the target was not only big relative to the buyer, but meaningfully more profitable per dollar of sales.
The price, and what it implied
Gorman-Rupp agreed to pay $525 million, rising to $528 million at closing.141 Because the deal was structured as an asset purchase, Gorman-Rupp could step up the tax basis of what it bought and deduct the cost over time. Management valued those future tax benefits at about $80 million, reducing the net cost to about $448 million.1
Now do the arithmetic that the headlines skipped. Paying about $525 million for $34.5 million of trailing adjusted EBITDA works out to roughly fifteen times. Net of the tax benefits, the multiple falls to roughly thirteen times. Those are management’s seller-period figures for the target, adjusted by the seller’s definitions, and they are the cleanest standalone earnings yardstick the public record offers. Gorman-Rupp has not reported Fill-Rite’s profits on a standalone basis since the deal closed.
Is thirteen to fifteen times EBITDA expensive for a niche fluid-handling brand with 25% margins? There is no honest one-word answer. It is a full price for a business that had just come through an unusually strong demand period, and it is about where Gorman-Rupp itself trades today on enterprise value to EBITDA, which means the company paid roughly what the market currently pays for Gorman-Rupp.15 A buyer who pays the same multiple at which its own shares trade does not create value from the multiple. Value has to come from growth, cost savings or the tax shield. And Gorman-Rupp does not publish a set of comparable deals against which the price could be called cheap or rich. What the record does support is that the price was full, that the tax benefits were a real and quantified offset, and that the deal’s success would depend entirely on Fill-Rite’s cash earnings after the deal.
The financing turned a conservative balance sheet into a levered one. Gorman-Rupp funded the purchase with cash on hand and new debt: a $350 million senior secured term loan, a $100 million revolving credit facility and a $90 million unsecured subordinated term loan, with J.P. Morgan providing committed financing.114 By the end of 2022 total debt stood at about $448 million, and the company’s leverage ratio, debt net of excess cash relative to adjusted EBITDA, was about 4.4 times.2 Management had set a target of reducing leverage below 3.5 times by the end of 2024.14
When a company buys a business, accountants split the price into the things that can be identified and valued, such as inventory, equipment, customer relationships and technology, and a residual called goodwill, which represents everything else the buyer was willing to pay for: the brand’s future, the growth prospects, the hoped-for synergies. In Fill-Rite’s case, about $201 million was assigned to customer relationships and about $231 million to goodwill.1 In other words, more than 80% of the price was allocated to intangible value, meaning things that do not show up on a factory floor.
That allocation has two consequences that still shape the company. The customer relationships are amortized, written down as an expense, over twenty years, which is why Gorman-Rupp’s amortization charge jumped from about half a million dollars in 2021 to more than $12 million a year from 2023 onward.2 That is a real accounting cost that depresses reported earnings, though not cash. The goodwill, by contrast, is not amortized. It sits on the balance sheet until an annual test suggests it is worth less than its carrying value, at which point it must be written down.
The early scorecard
The first year was not pretty on the income statement. Gorman-Rupp reported 2022 sales of about $521 million, of which about $87 million came from Fill-Rite in its seven months under new ownership.1 King’s “over $500 million” milestone had been reached even with only seven months of the acquired business. But net income fell from about $30 million in 2021 to about $11 million in 2022.2 The reasons were mostly the costs of the deal itself: about $7 million of acquisition costs, an inventory step-up charge as Fill-Rite’s stock was revalued to fair value and then sold, amortization of the acquired backlog, interest on the new debt, and an unusually large LIFO charge as inflation ran through the inventory accounts.13 An acquisition year is almost always ugly in reported earnings; the useful question is what came after.
The tempting story is that Fill-Rite drove Gorman-Rupp’s growth after the deal. The record shows something more balanced. Management reports a 2021–2025 sales growth rate of about 14.4% a year. It splits that into about 8.6% organic growth and about 5.7% from acquisitions.3 So by the company’s own arithmetic, the legacy business plus Fill-Rite’s post-acquisition growth contributed more of the four-year expansion than the acquired revenue base itself. That is a better outcome than the cynical reading, in which the deal simply bolted a bigger number onto a stagnant company. Organic growth of nearly 9% a year in a business that had shrunk 3% a year in the prior five is a real change, though it should be read in context: 2021–2023 was a period of broad industrial price inflation, and some of the “organic” growth was price rather than volume.
Fill-Rite itself has been a mixed contributor. In 2026 it looks like a growth driver: the company attributed a $13 million increase in nine-month agriculture sales to broad-based improvement across Fill-Rite’s sales channels, and pointed to Fill-Rite again when explaining third-quarter gains in agriculture, construction and industrial sales.5 That language implies Fill-Rite channels had been weaker in the prior period; a recovery is not the same as a trend.
And then there is the goodwill test. In its 2025 audit, EY identified the Fill-Rite goodwill impairment test as a critical audit matter, the auditor’s term for the judgment it found most demanding.6 The test concluded that Fill-Rite’s fair value exceeded its carrying value, so no write-down was needed. But the auditor noted that the estimate depended on assumptions about discount rates, revenue growth and profitability, and that it was sensitive to those inputs.6 The auditor issued clean opinions on the financial statements and on internal controls.6 Nothing in that is a warning sign. It is, however, a reminder that $231 million of value on the balance sheet rests on forecasts, and that a period of weaker fuel-transfer demand or a higher interest-rate environment could change the answer.
Here, then, is where the Fill-Rite verdict lands. The deal made Gorman-Rupp materially bigger, added a higher-margin product line and new channels, and met the headline promises King made on announcement day. The tax step-up lowered its effective cost. But the price was full, the target’s standalone cash earnings have not been reported since, and the goodwill test is sensitive by the auditor’s own description. The test of the purchase is not whether the company grew. It is whether the cash flows have repaid the cost of capital tied up in it, and that question leads straight to the debt the deal created.
V. The Debt That Turned Growth Into a Cash-Flow Test
For a company that had gone into 2022 with no borrowings, the interest bill that followed was a shock to the income statement. In 2021, Gorman-Rupp paid essentially no interest. In 2023, the first full year after the deal, interest expense came to about $41 million.2 To put that in perspective, it was larger than the company’s entire net income in 2021. Rising benchmark rates made it worse, because the senior term loan floats at a margin over SOFR, and Gorman-Rupp has used interest-rate swaps to manage part of that exposure.36
The deleveraging that followed is the clearest success in the post-acquisition story, and it is worth tracing because it tests a specific management promise. King had targeted leverage below 3.5 times by the end of 2024.14 By the end of 2023, leverage was about 3.3 times, and it had fallen to about 2.3 times by the end of 2025.2 The company reached its target a year early and kept going. Total debt fell from about $448 million at the end of 2022 to about $253 million at the end of September 2026.2516
Along the way came a refinancing that shows how the company managed the debt’s cost. On May 31, 2024, Gorman-Rupp upsized and extended its senior term loan, extended its revolving credit facility, issued $30 million of new 6.4% senior notes with a seven-year term, and retired the $90 million subordinated loan, the most expensive layer of the original financing.3 The trade cost money up front. The company recorded a $1.8 million prepayment penalty, $1.3 million of other transaction expenses and a $4.4 million noncash write-off of previously deferred financing fees.3 Those charges helped explain why the company’s “other expense” line jumped in 2024.6
The payoff showed up quickly in interest expense, which fell from about $41 million in 2023 to about $23 million in 2025.2 The roughly $10 million reduction in 2025 alone accounted for a large share of that year’s profit increase. Pretax income rose by about $19 million in 2025, and lower interest expense supplied more than half of it.2 That is the critical nuance. Some of the earnings growth since 2023 is not the pump business getting better. It is the acquisition’s financing cost getting smaller.
Today the debt structure is simple. At the end of 2025 the company owed about $281 million under the senior term loan, which floats at a margin over SOFR and matures in May 2029, and $30 million of 6.4% notes due May 2031.3 At September 30, 2026, it reported compliance with its covenants and about $100 million of undrawn revolver capacity.16 No major rating agency has published a rationale for the company; Gorman-Rupp does not disclose an agency rating in its filings.616 The evidence is the company’s own: falling debt, ample liquidity and no final maturity before May 2029.
Why cash ran ahead of profit
The debt came down because the business generated cash faster than its reported earnings would suggest. From 2023 through 2025, Gorman-Rupp reported cumulative net income of about $128 million and cumulative cash from operations of about $274 million.6 The company generated roughly two dollars of operating cash for every dollar of reported profit.
That gap is not mysterious, but it is important to understand which parts of it repeat. The largest piece is depreciation and amortization, especially the amortization of Fill-Rite’s customer relationships and technology. Those charges reduce reported earnings, but no cash leaves the building. They will continue for years, because the intangibles have long amortization lives. A second piece is LIFO, an inventory accounting method that charges the most recently purchased materials against sales first. In an inflationary period, LIFO raises the reported cost of goods and lowers reported profit, but the cash was already spent when the inventory was bought. LIFO charges are noncash in the period they hit, and they fade when inflation fades. A third piece is pension expense and stock-based compensation, both of which reduce earnings without an immediate cash outflow.6
Then there are the timing items. Working capital, meaning receivables, inventory and payables, moved in different directions in different years. Management points out that operating working capital fell from about 54% of sales in 2020 to about 39% in 2025, and that sales rose 95% over that span while inventory rose only 38%.3 That is a genuine efficiency gain and a real source of cash, but it is not infinitely repeatable; a company cannot keep shrinking its inventory relative to sales forever. And 2025 included a $10 million deferred-tax adjustment that boosted operating cash without reflecting stronger operations.6
The fair reading is that Gorman-Rupp’s cash generation is strong and largely real, but some of the surplus over earnings came from a period-specific mix of inflation accounting, working-capital release and tax timing. The durable portion is the noncash amortization and depreciation, plus whatever operating profit the business earns. That leaves free cash flow comfortably able to cover the dividend, capital spending and continued debt reduction, but it should not be extrapolated as if every year will produce two dollars of cash per dollar of profit.
The net-income puzzle of 2026
That brings the story to the most striking number of 2026. In the first nine months, sales rose about 7.8%, to about $556 million, while net income rose about 53%, from about $39 million to about $60 million.5 When profit grows seven times faster than sales, something other than demand is at work, and the obvious suspect is interest savings.
The arithmetic tells a more interesting story. Operating income in the nine months rose by about $21 million, from about $71 million to about $92 million.5 Interest expense fell by about $4 million, from about $18 million to about $14 million.5 So the debt paydown contributed something like one-sixth of the improvement in pretax earnings. About $3 million of it came from the absence of one-time facility-optimization costs that had depressed the comparable 2025 period.5 The company attributed the rest to leverage on labor, overhead and selling expenses as volumes rose, price increases taken in the first quarter, and a lower LIFO charge.5
That changes the investor’s question. Interest savings matter, but they are not the main event. The main event is that the factories are earning more on each dollar of sales: operating margin reached about 16.5% for the nine months, up from about 13.7%.5 Whether that margin holds when volumes stop rising, or when inflation pushes LIFO charges back up, is a question about the operating business and the people running it.
VI. Scott King’s Growth Plan Meets the Factory Floor
On October 23, 2026, Gorman-Rupp reported its third quarter, and King had the kind of results every CEO wants to read aloud. Sales were a record $193 million, up about 12%. Gross margin was a record 33.4%. Earnings per share were a record, the third consecutive quarter of record EPS and the second consecutive quarter of record sales. Growth was broad-based, with every market up from the prior year.5 King said the margins reflected increased volumes driving leverage on labor, overhead and SG&A, and he noted that “lower interest expense” had also contributed.5
That last clause is worth crediting. A CEO announcing record earnings could have attributed everything to operations; King named the financing tailwind in the same breath. It is a small sign, but a real one, that management is not hiding the moving parts.
What the record quarter is made of
The company’s own breakdown of the third-quarter margin is unusually detailed, and it repays reading. Gross margin rose 4.2 percentage points from a year earlier. About 1.3 points came from spreading labor and overhead costs over higher sales. About 0.6 points came from favorable medical expenses. About 1.6 points came from the absence of 2025 facility-optimization costs that did not recur. About 0.7 points came from a lower LIFO charge.5
Translate that into plain English. Of the gain, perhaps a third is durable operating leverage, which will persist if volumes hold. The rest comes from items that are either one-time (the facility costs), variable (medical expenses) or tied to the inflation cycle (LIFO). None of those are illegitimate. A company that consolidates factories should eventually stop paying for the consolidation, and a lower LIFO charge reflects calmer input costs. But they are not repeatable sources of margin expansion. A listener who extrapolates a 33% gross margin from that quarter is extrapolating several things that will not happen again.
The demand side has its own nuance. The company says sales grew on both volume and price increases taken in the first quarter of 2026.5 It does not quantify how much of the growth was price. And while third-quarter sales rose about 12%, incoming orders for the first nine months rose only about 2%.5 Backlog at September 30, 2026, was about $237 million, slightly above a year earlier but below the $244 million at the end of 2025.5 In other words, the company has been shipping slightly faster than it has been booking new work in 2026, drawing down the strong order book it built in 2025. That is normal behavior for a manufacturer after a strong order year, but it means the record shipments of 2026 were partly fed by 2025’s orders. King described orders and backlog as “healthy,” which they are in absolute terms; the direction is flatter than the record quarter implies.5
Gorman-Rupp speaks to investors mostly through its written releases and presentations, and across those materials the narrative has been notably consistent, which is itself evidence. In February 2026, the full-year release credited data-center construction with part of the growth in industrial and fire-suppression sales and said King expected several markets to continue to benefit from data-center demand.4 The investor presentation listed data centers among its favorable external trends, noting fire pumps, HVAC and liquid cooling applications.3 In July, the second-quarter release attributed a small OEM gain to data-center demand.17 By October, the third-quarter release tied industrial growth to HVAC demand and did not mention data centers by name.5
The useful observation is not that the language changed, but how small the data-center effect appears in the numbers. Fire-suppression sales, one of the markets most tied to data-center construction, actually fell by about $4 million in the first nine months of 2026, before recovering in the third quarter on international sales.5 Data centers are a real demand pocket inside existing markets. They are not a separately reported growth engine, and the company has not claimed otherwise.
On the larger promises, King’s record is good. On announcement day in 2022 he said the deal would take revenue over $500 million; it did, in the first year.141 He targeted leverage below 3.5 times by the end of 2024; the company reached about 2.9 times.142 Those are the two quantified commitments from the acquisition era, and both were met. Management’s forward goals are deliberately modest: the February 2026 presentation targets organic growth of “GDP+,” plus acquisitions, and continued margin expansion by leveraging growth in existing facilities.3 A management team that sets targets it can beat is not the same as one that has proven it can compound, but a five-year record of meeting quantified promises is worth something.
Investing or harvesting
The best test of whether a management team is building or harvesting is where the cash goes. Gorman-Rupp spent between about $14 million and $21 million a year on capital equipment from 2023 through 2025, roughly 2% to 3% of sales.618 It plans to spend $22 million to $24 million in 2026, mostly on machinery and equipment.5 That is the top of its recent range. Over the same period, headcount edged down, from about 1,450 employees in 2023 to about 1,415 in 2025, while sales rose.6 Revenue per employee rose accordingly. The company has also been consolidating facilities: the 2025 optimization added capacity at its Olive Branch, Mississippi, site for fire-suppression work, and management lists further optimization at National Pump Company as a margin initiative.3
Taken together, the evidence points to a company investing to make its factories more productive, not one starving them to flatter cash flow. Capital spending is rising rather than falling, and output per worker is improving.
Product development is a weaker spot in the record. Gorman-Rupp describes investment in R&D and new products as a pillar of its growth strategy, but it does not disclose R&D spending in its 2023, 2024 or 2025 annual reports.6 That matters, because new products are one of the few ways a pump maker can win share against larger rivals. Without a disclosed spending figure or a disclosed share of sales from new products, investors have only management’s word that product development is driving growth.
The incentive picture is conventional. King’s reported total compensation rose from about $1.95 million in 2024 to about $2.19 million in 2025, including about $609,000 of annual incentive pay and $750,000 of stock awards.19 Net income rose from about $40 million to about $53 million over the same period.2 The rise in pay was proportionate to results, and the proxy describes plan-based incentives with no exceptional one-off bonus.19 At the 2026 annual meeting, about 98% of votes cast supported the say-on-pay resolution.20
Ownership is where the company’s history still shows. Jeffrey Gorman beneficially owned about 10.5% of the shares as of February 2026, including family holdings in which he disclaims part of the economic interest; his sister, Gayle Green, owned about 9.5%.19 Combined, the family holds roughly a fifth of the company. That is meaningful influence, not control. Seven of the nine director nominees are independent.19 Family ownership tends to cut both ways. It can anchor a company to long-term thinking and a dividend tradition, and it can make a board more cautious than outside shareholders might want. In Gorman-Rupp’s case, the biggest decision of the modern era, the Fill-Rite purchase, was hardly cautious, and it happened with the family still in the chairman’s seat.
The finance function is also turning over. Chief financial officer James Kerr, who joined in 2016, retired effective October 1, 2026, and Ronald Stoops, previously vice president of finance, succeeded him.21 The company also appointed David Daniels as chief administrative officer effective January 4, 2027, with responsibilities that include workforce planning and the use of AI.22 The CFO succession was internal, which suggests continuity rather than a change of direction.
So the verdict on management is cautious but favorable. King’s team has met its quantified acquisition-era promises, invested in the factories while paying down debt, and described the moving parts in its results with reasonable candor. What it has not yet shown is a long record of guidance discipline through a downturn, because it has not yet faced one as a leveraged company. And one balance-sheet line in the September 2026 quarter suggests that not all of the record sales have yet turned into cash.
VII. The Receivables Build Behind the Record Quarter
Every manufacturer that ships a pump on credit carries a small act of faith on its balance sheet. The customer takes the pump; the invoice goes out; and for thirty, sixty or ninety days the company holds a promise to be paid, recorded as an account receivable. Usually the promise is kept. Sometimes the payment comes late. Occasionally it never comes. The size and direction of that line is one of the quickest ways to see whether sales are turning into cash on schedule.
At the end of 2025, Gorman-Rupp’s receivables were about $88 million, nearly unchanged from a year earlier, and its allowance for doubtful accounts had fallen from about $1.1 million to about $0.8 million.6 The company describes a strong collection history and bases its allowance on customers’ credit condition, past collection experience and current economic conditions.6 Against $682 million of annual sales, a reserve below $1 million is small, which implies either very reliable customers or a reserve that would need to rise quickly if conditions turned.
By September 30, 2026, receivables had climbed to about $109 million.16 Building receivables used about $21 million of cash in the first nine months of the year.16 That is the number that warrants attention.
Some of the increase is easy to explain. Quarterly sales move around, and the third quarter was a record. A company that ships more in September than it did in December will naturally carry more receivables at the end of September, because customers have not yet paid for the latest shipments. Third-quarter sales of about $193 million compared with fourth-quarter 2025 sales of about $167 million.53 Receivables rose by about a quarter from year-end, while quarterly sales rose by about a sixth. So receivables grew somewhat faster than the quarterly sales run-rate, though not dramatically.
What cannot be explained from the outside is the composition. Gorman-Rupp does not publish an aging schedule, overdue balances, write-offs or customer-specific payment delays in its 2025 annual report or its September 2026 quarterly filing.616 So an investor cannot tell whether the build reflects a few large project invoices that are simply current and due, a change in payment terms to support distributors, or slower payment from customers under strain. The likeliest explanation, given the record sales and the company’s history, is ordinary growth-related timing, but the company’s disclosures cannot prove that.
Two features keep this in proportion. First, operating cash flow in the first nine months of 2026 was still about $115 million, up from about $91 million a year earlier, even after absorbing the receivables build.5 The cash engine is working. Second, there is no disclosed customer above 10% of sales, so a single delinquent buyer is unlikely to create a large loss.6
The forward check is concrete. If the September receivables are collected in the fourth quarter as usual, year-end 2026 receivables should fall back toward the level implied by fourth-quarter sales, and cash from operations should show a working-capital release. If receivables at year-end remain elevated relative to sales, or the allowance rises, the build would deserve a harder look. Either way, the collection question is a narrow one about timing. The larger question about this company is whether its commercial position is strong enough to defend the bigger business that Fill-Rite created.
VIII. A Bigger Pump Maker, but Not Yet a Proven Moat
Return to the engineer at the desk, drafting the wastewater station. The specification lists acceptable pump manufacturers. Gorman-Rupp is on the list. So is a Xylem brand, perhaps Flygt. So is a regional private firm the engineer has used for years. The contractor who wins the job will buy through whichever distributor offers the best combination of price, delivery and confidence. Sometimes the specification is written so tightly around one manufacturer’s design that only that manufacturer can comply. More often, two or three can.
That moment, when a buyer chooses among qualified options, is where any moat must prove itself. A moat is a reason that a buyer keeps choosing the same supplier even when a cheaper or newer option is available, and that the supplier can keep earning above-average returns because of it. Gorman-Rupp’s management argues that its advantage lies in quality, service, a recognized family of brands and a knowledgeable distribution network.3 The question is how much of that is evidenced.
Start with the buyers. Gorman-Rupp’s customer base is fragmented: no customer over 10% of sales, no distributor over 5%, sales across eight end markets and about 140 countries.63 That limits the bargaining power of any single buyer. The company cannot be squeezed by one giant purchaser the way a supplier to a big-box retailer can. But fragmentation cuts both ways. Buyers who purchase pumps occasionally, through specifications written by engineers, are also not locked in. They can switch suppliers on the next project if a competitor offers a better price or delivery date.
Then the suppliers. For most materials, Gorman-Rupp has multiple sources and no single-supplier dependency, which limits supplier power.6 The exception is motors for large submersible systems, where a limited number of suppliers creates a pocket of supplier leverage.6 Steel, castings and copper prices also move with commodity cycles, which is why the LIFO charge swings.
The threat of new entrants is low in the engineered segments. Fire pumps need UL and FM approvals; municipal pumps need track records; flood-control pumps the size of a room require engineering expertise few firms have.3 It is higher in standardized segments like small transfer pumps, where a well-funded importer could compete on price.
Substitutes are limited in the obvious sense. There is no software that moves sewage. But within pumps, technologies substitute for each other: a submersible pump can replace a self-priming pump in some applications, a variable-speed drive can reduce the number of pumps needed. And rivalry is intense. The industry includes several companies many times Gorman-Rupp’s size, divisions of large diversified manufacturers and hundreds of private firms, according to management’s own competitor list.3
The powers Gorman-Rupp may hold
Run the business through Hamilton Helmer’s framework of seven durable powers and the result is narrower than the investor-presentation version.
Scale economies are not a Gorman-Rupp advantage. Xylem, Flowserve, Graco and Franklin Electric each report several times its revenue.1112[^13]13 Their mixes differ, so revenue size does not translate into pump-market share, but scale in purchasing, engineering and distribution generally favors the larger players.
Network effects do not apply to pumps.
Switching costs exist but are modest. Once a pump is installed, the owner tends to buy replacement parts from the original manufacturer, which is why repair parts make up about 12% of revenue.6 But switching pump brands on a new project costs little, and the company does not disclose retention data to show that customers come back.
Brand is the most plausible power. Gorman-Rupp, Patterson and Fill-Rite are recognized names in their niches, and management says customers in mission-critical applications tend to be brand-loyal when their needs are met.3 Brand power, however, should show up as pricing power, the ability to charge more than rivals for a comparable product. The company did raise prices in the first quarter of 2026, and gross margins have climbed from an average of about 26% in 2016–2020 to about 31% in 2025.53 That is suggestive. But some of the margin gain came from Fill-Rite’s higher-margin mix, cost control and operating leverage, and the company does not separate price realization from volume or mix. The margin record is consistent with pricing power without proving it.
Cornered resources, such as certifications and specialized know-how, exist in narrow niches like fire pumps and very large flood-control pumps. Process power, the kind of embedded operating know-how that rivals cannot copy quickly, is plausible in the company’s testing facilities and culture of long-tenured employees, but it is hard to evidence from outside. Counter-positioning does not apply.
Why win, and why not
So here is the honest case. Gorman-Rupp wins when a buyer needs a reliable pump for a specific application, quickly, through a distributor who knows the product, in a niche where the company’s engineering and certifications matter. It wins in fire suppression, where its approvals and Irish plant give it reach; in large municipal and flood-control projects, where its engineering capacity is rare; and in fuel transfer, where Fill-Rite’s brand carries weight with farmers and contractors. Its product breadth, more than 5,000 models, lets a distributor carry one supplier for many needs.2 Those are real reasons to win niches despite smaller scale.
The case against is equally specific. The public record does not show customer retention, market-share gains or price realization. The company relies on a narrow supplier base for some critical motors. And it competes with rivals that can outspend it on engineering, distribution and acquisitions. The decade of flat sales before Fill-Rite is the strongest piece of disconfirming evidence for a powerful moat: a company with strong pricing power and growing share should not shrink 3% a year for five years, even in a soft industrial cycle.3
Weighing it, the moat is real but narrower than management describes. It is a collection of niche positions protected by reliability, certifications and distribution, plus a modest aftermarket. It is not a broad competitive barrier that guarantees above-average returns across the business. The evidence that would confirm a stronger version is simple to name: sustained organic growth above the industry rate, disclosed price realization, and margins that hold when volumes soften.
The data-center story belongs in that frame. Data-center construction has produced real demand for fire pumps, HVAC pumps and cooling applications, and Gorman-Rupp has benefited.4 But it is a pocket of demand inside existing markets, not a new business line, and the company has not reported it separately. It can add to growth; it cannot by itself create a moat.
Which brings the analysis to the question every investor eventually has to answer: given a narrow but real moat, a larger business and a healthier balance sheet, what is the market paying for it?
IX. Analysis & Bear vs. Bull Case
At the close on November 13, 2026, Gorman-Rupp’s shares traded at $69.66.15 Market-data provider figures put that at about 23.6 times trailing earnings, below the provider’s five-year median of about 26.5 times.15 On the same provider’s numbers, the stock traded at about 14.1 times free cash flow and about 12.9 times enterprise value to EBITDA, both in line with their five-year medians.15 These are provider calculations, not filing metrics, and definitions may differ from the company’s own.
The context is useful. On the same provider’s figures, Graco traded at about 23 times earnings, Xylem about 21 times, Franklin Electric about 22 times and Flowserve about 42 times.23242526 Those businesses differ in mix, margin and growth, so the comparison is a reference point, not a verdict. Gorman-Rupp trades roughly in line with the larger fluid-handling peers on earnings, despite its smaller scale. The market is not pricing it as a distressed or neglected small-cap. Nor is it pricing it as a premium compounder.
What does that price appear to assume? At roughly thirteen times EBITDA, the market is valuing Gorman-Rupp at about the same multiple the company paid for Fill-Rite after the tax benefits. It is pricing a business that holds its current margins, grows modestly and continues to convert earnings into cash. It is not pricing a collapse, and it is not pricing a step change.
The case for a better pump company
The bull case starts with organic growth. Management reports 8.6% annual organic growth from 2021 through 2025, a sharp reversal from the 3% annual contraction of the prior five years.3 Nine-month 2026 sales rose almost 8%, with growth across most markets.5 The business is diversified enough that no single sector controls its fate, and it has exposure to several long-running demand themes: aging water infrastructure, stormwater management, data-center construction and U.S. manufacturing investment.3
Margins are rising. Gross margin averaged about 26% in 2016–2020 and reached about 31% in 2025, with the nine-month 2026 figure near 33%.35 Operating cash flow is strong, and it is being used sensibly. The company has paid down about $195 million of debt since the end of 2022, while increasing capital spending and maintaining its dividend streak.25 As debt falls, interest expense falls, and more of the operating profit reaches shareholders. A management team that met its acquisition-era promises is now in a position to choose between more debt reduction, more investment and, eventually, more acquisitions.
The case for merely a bigger one
The bear case starts with the same numbers, read differently. The 14.4% growth rate from 2021 through 2025 includes acquired revenue, and the organic portion includes a period of unusual industrial inflation. Strip out acquisitions and price, and the volume growth of the core business is unknown and may be modest. Incoming orders rose only about 2% in the first nine months of 2026, and backlog has edged down from year-end, which suggests the strongest sales growth may already be behind the company.5
Fill-Rite remains a material part of the enlarged company, and its standalone returns are not disclosed. About $231 million of goodwill rests on forecasts the auditor called sensitive.6 A downturn in agriculture or construction, both cyclical markets where Fill-Rite sells, could pressure those forecasts.
Margins have been helped by items that will not repeat: the absence of facility-optimization costs, a lower LIFO charge in a calmer inflation period, favorable medical costs.5 Earnings have been helped by falling interest expense. As debt approaches a stable level, that tailwind will fade. And the receivables build in 2026, while likely benign, is undisclosed in detail.16
An activist or a skeptical long-term holder would focus on one question: having bought growth once, will management do it again? The record so far is mixed in a specific way. The Fill-Rite deal was transformational and debt-funded, and it fit the company’s published acquisition criteria, which call for pump-related businesses with leading niche positions, attractive profitability and $25 million to $150 million of revenue.3 Management says that once it delevers, acquisitions will remain an important part of its growth strategy.3
Meanwhile, share buybacks have been small: about $1 million in 2023, $0.3 million in 2024 and $1.2 million in 2025, and about $2.6 million through September 2026.616 Dividends rose from $0.71 to $0.75 a share over 2023–2025.6 The capital-allocation stance is clear: reinvest, pay the dividend, reduce debt, then consider acquisitions. A skeptic would want to see management report a return on the capital it already deployed before deploying more. That means a disclosed return on the Fill-Rite investment, or at least a clear account of its cash earnings. The company has not provided one.
Three numbers will do most of the work of settling this debate.
The first is organic sales growth, paired with the order trend. The latest reading shows nine-month sales up about 8% and orders up about 2%, with backlog drifting slightly lower from year-end.5 The direction is decelerating. If orders reaccelerate, the bull case strengthens; if sales converge down toward the order trend, growth will slow.
The second is operating margin excluding nonrecurring items. The nine-month 2026 operating margin was about 16.5%, up from about 13.7%, but part of the improvement came from the absence of facility costs and lower LIFO.5 The direction is improving. The question is whether the margin holds when those items normalize.
The third is free cash flow after capital spending, set against debt repayment. Nine-month operating cash flow was about $115 million, and capital spending about $15 million, enough to fund a $58 million debt reduction plus dividends.5 The direction is strong. The question is what that cash funds once debt has stabilized.
Those three readings, more than any single record quarter, will tell investors whether the Fill-Rite bet produced a better business or just a bigger one. And the history of this company offers some lessons on how to tell the difference.
X. Business & Investing Lessons
The first lesson comes from the day the deal closed. On May 31, 2022, Gorman-Rupp became a much larger, more indebted company overnight.1 Within seven months it had passed the $500 million revenue milestone its CEO had promised.1 Yet its net income fell by almost two-thirds that year.2 The revenue milestone was real, but it was the start of the return, not the return itself. The return arrives only when cash from the acquired business exceeds the cost of the capital used to buy it, and that calculation takes years. A bigger revenue base is the beginning of the return, not the proof of it.
The second lesson comes from the decade before the deal. Gorman-Rupp’s products are mission-critical, yet its sales shrank for five years before 2021.3 Being essential to a customer does not mean the customer buys every year. It means the customer buys when a building goes up, when a farm expands, when a city funds a new pumping station. Mission-critical is a statement about the stakes of failure, not about the regularity of demand. A mission-critical product can still be a cyclical order.
The third lesson comes from the cash-flow statement. Gorman-Rupp generated about twice as much operating cash as it reported in net income from 2023 through 2025.6 That was a genuine strength, and it paid down debt. But a careful investor had to ask where the gap came from: amortization of acquired intangibles, which repeats; working-capital release, which does not repeat indefinitely; and a one-time tax adjustment, which does not repeat at all. Cash above earnings is useful, but only after you ask which parts repeat.
The fourth lesson comes from the record third quarter of 2026. The quarter’s detail showed margin gains partly from items that will not recur, earnings partly from lower interest, and orders growing far slower than shipments.5 Judge the plan by orders, normalized margins and debt, not by the record quarter alone.
And one final lesson, which belongs to Gorman-Rupp more than to any other company. Its first major acquisition under a new CEO put decades of financial steadiness to work.31 Steadiness had been the company’s identity. It turned out to be the asset that made the bet possible. The cleanest balance sheet in the industry is not an end in itself; it is an option, and the question is always whether it gets exercised well.
XI. Epilogue
Tonight, Gorman-Rupp is a different company from the one Scott King inherited. It is nearly twice as large by sales. Its margins are higher. Its debt, which peaked near $450 million, is down to about $253 million and falling.216 Its stock trades near its own historical valuation, neither discounted for risk nor priced for brilliance.15
The next several months will bring the evidence that decides whether the Fill-Rite bet was a durable transformation. The first moment is year-end collections. If the roughly $109 million of receivables on the September balance sheet turns into cash on schedule, the build will be revealed as ordinary timing, and the fourth quarter will show a working-capital release. If receivables stay high relative to sales, the company will owe investors an explanation.
The second moment is the 2026 annual report, expected in early 2027, and with it the next test of Fill-Rite’s $231 million goodwill balance.6 A comfortable pass, with stable assumptions, would support the case that the acquired business is earning its keep. Any narrowing of headroom, or any change in the auditor’s description of the sensitivity, would be the most important signal in the filing.
The third moment is the debt balance at year-end and the company’s choice about what comes next. As borrowings shrink, interest savings will taper, and the company will have to decide whether to keep paying down the term loan, invest more in its factories, return more cash to shareholders, or go shopping again. Management has said acquisitions remain part of its strategy once leverage is lower.3 The quality of that choice will say more about this management team than any quarterly result.
The fourth moment is the order trend into 2027. Nine-month orders grew about 2% in 2026, far slower than sales.5 If orders reaccelerate, the company’s organic growth has staying power. If they remain flat, 2027 sales growth will slow, and the operating leverage that powered 2026 margins will run in reverse.
What would confirm the case? Organic growth that continues at a healthy clip even without inflation; operating margins that hold near current levels after the one-time benefits fade; and free cash flow that keeps covering capital spending, dividends and debt repayment once interest savings stop growing. What would weaken it? Earnings growth that fades as interest savings level off, goodwill headroom that narrows, or receivables that convert slowly.
Some uncertainty will remain no matter what the next filing shows. Without standalone Fill-Rite financials or receivables-aging data, outsiders cannot calculate the deal’s return precisely or fully assess collection quality. Gorman-Rupp has chosen to report as a single segment and to disclose what the rules require. That leaves investors judging the acquisition by its shadow: the company’s total cash flow, its margins and its debt.
XII. Outro
Somewhere in Ohio tonight, a pump is coming off a test stand, crated and loaded for a customer who needs it to work and hopes never to think about it again. It is the same promise J.C. Gorman and Herb Rupp made in 1933 with $1,500 and a mission statement about quality and on-time delivery.3
Behind that pump, on the balance sheet, sits a $528 million bet still being measured in cash.1 Gorman-Rupp has made the bet look good so far: bigger, more profitable, with debt falling. What it has not yet done is settle the return question. A nearly century-old pump maker is still answering the question its own founders would have asked first: did it pay?
References
-
2022 Form 10-K — The Gorman-Rupp Company, 2023-02-24 ↩↩↩↩↩↩↩↩↩↩↩↩↩
-
2025 Company Overview — The Gorman-Rupp Company, 2026 ↩↩↩↩↩↩↩↩↩↩↩↩↩↩↩↩↩↩↩↩
-
February 2026 Investor Presentation — The Gorman-Rupp Company, 2026-02 ↩↩↩↩↩↩↩↩↩↩↩↩↩↩↩↩↩↩↩↩↩↩↩↩↩↩↩↩↩↩↩↩↩↩↩↩↩↩↩↩↩↩↩↩↩↩↩↩↩↩↩
-
Q4 and Full-Year 2025 Earnings Release — The Gorman-Rupp Company, 2026-02-06 ↩↩↩↩↩
-
Q3 2026 Earnings Release — The Gorman-Rupp Company, 2026-10-23 ↩↩↩↩↩↩↩↩↩↩↩↩↩↩↩↩↩↩↩↩↩↩↩↩↩↩↩↩↩↩↩↩
-
2025 Form 10-K — The Gorman-Rupp Company, 2026-03-02 ↩↩↩↩↩↩↩↩↩↩↩↩↩↩↩↩↩↩↩↩↩↩↩↩↩↩↩↩↩↩↩↩↩↩↩↩↩↩↩↩
-
NYSE Transfer Announcement — The Gorman-Rupp Company, 2017-05-03 ↩
-
Agreement to Acquire Fill-Rite — The Gorman-Rupp Company, 2022-04-27 ↩↩↩↩↩↩↩↩↩↩↩
-
2026 Q3 Form 10-Q — The Gorman-Rupp Company, 2026-10-26 ↩↩↩↩↩↩↩↩↩
-
Q2 2026 Earnings Release — The Gorman-Rupp Company, 2026-07-24 ↩
-
2026 Proxy Statement — The Gorman-Rupp Company, 2026-03-23 ↩↩↩↩
-
2026 Annual Meeting Results — The Gorman-Rupp Company, 2026-04-23 ↩
-
CFO Succession Form 8-K — The Gorman-Rupp Company, 2026-07-24 ↩
-
Officer Appointments Form 8-K — The Gorman-Rupp Company, 2026-10-28 ↩
 LinkedIn
 WhatsApp
 Reddit
 Hacker News
 Email
 Kindle
 RSS Feed
 Spotify
 Apple Podcasts
 Amazon Music
 Audible
 YouTube