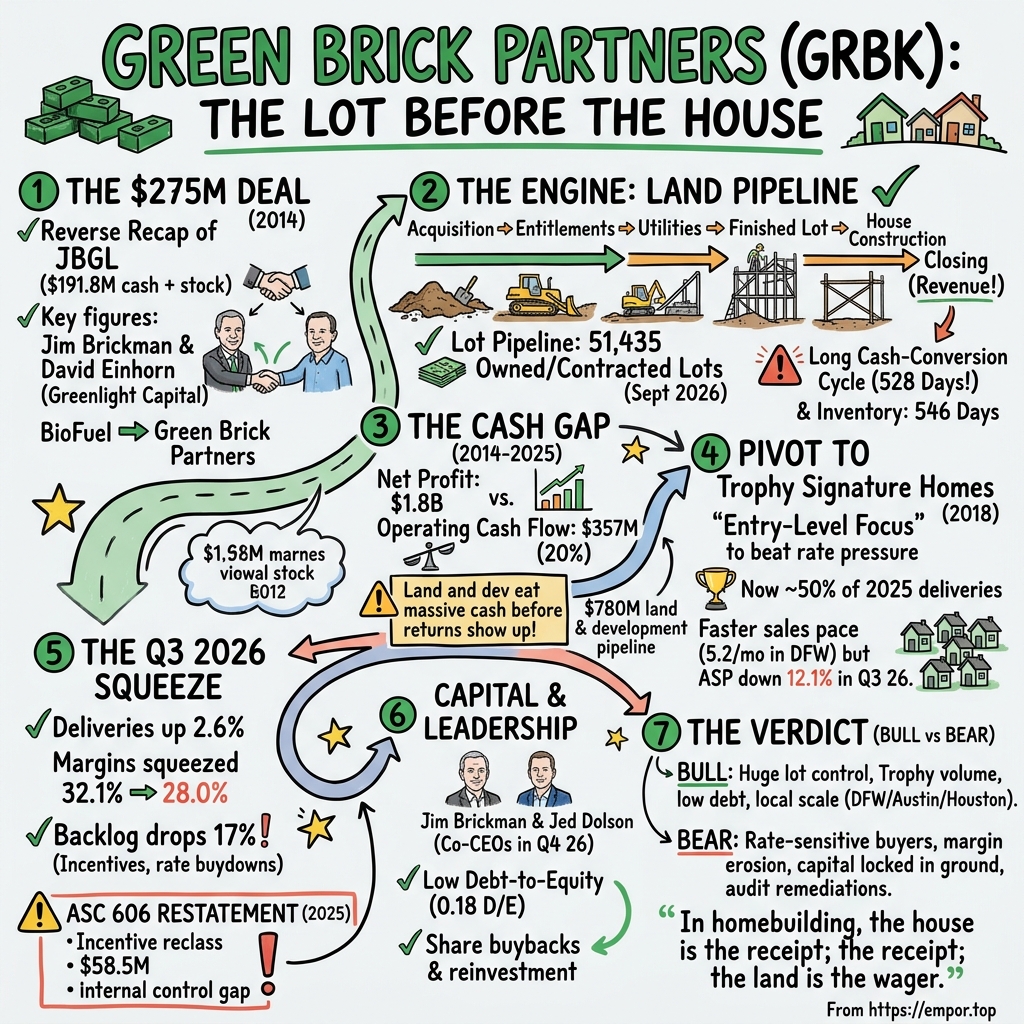
Green Brick Partners, Inc.: The Lot Before the House
I. A Housing Slowdown, and a Land Bet That Keeps Growing
On the morning of October 29, 2026, three men from a Dallas-area homebuilder dialed into a conference call to explain a quarter that would not resolve into a clean story. Jeffery Cox, the chief financial officer, read the numbers. Jim Brickman, the co-founder who had run the company for twelve years, talked about strategy. And Jed Dolson, who had held the title of co-chief executive for exactly two weeks, talked about land.1
The numbers Cox read pointed in two directions at once. Green Brick Partners had delivered 978 homes in the third quarter, a few more than a year earlier.1 Buyers were still signing contracts, too: net new orders rose about 3%.1 By the measure that matters most to a homebuilder's neighbors, the bulldozers and framing crews and moving trucks, the business was as busy as ever.
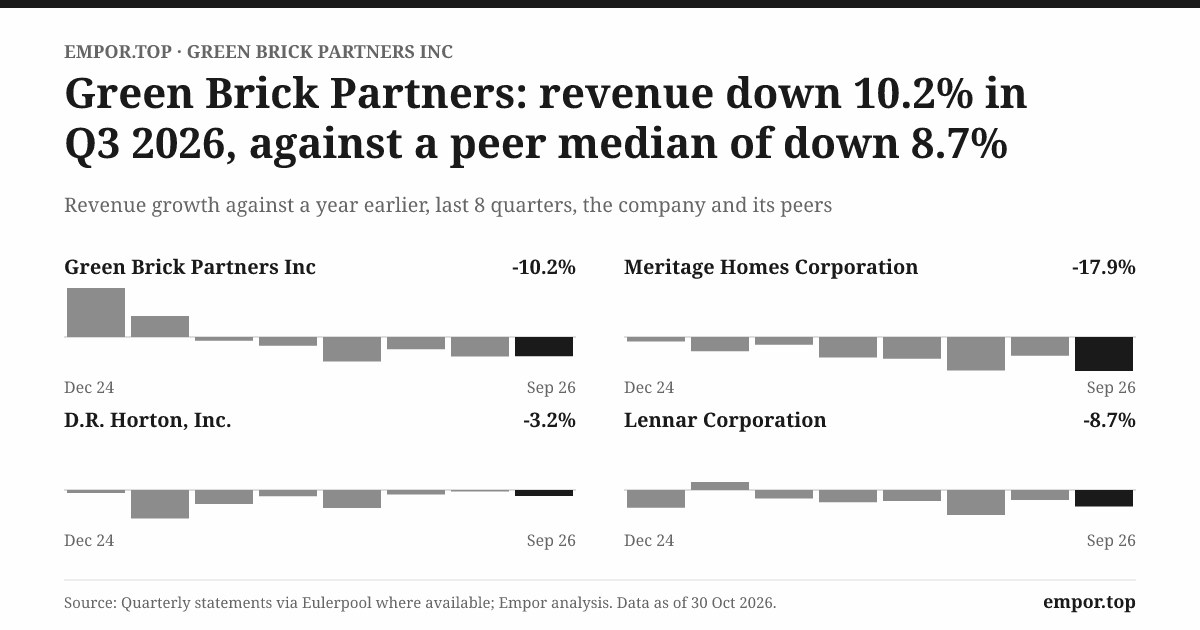
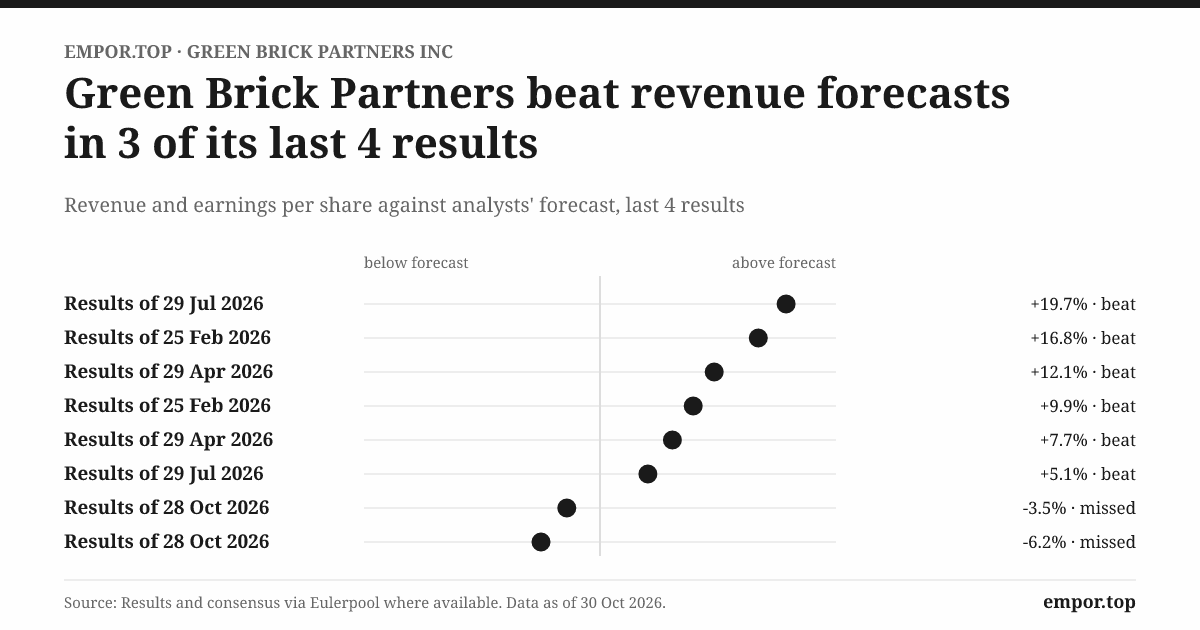
But almost every measure of what that activity was worth had moved the wrong way. The average delivered home sold for about $447,000, roughly 12% less than a year earlier.1 The homebuilding gross margin, the share of each sale left after paying for the lot and the sticks and bricks, fell from about 32% to 28%, a drop of 410 basis points.1 Net income fell 23% to about $59 million.2 The company was building and selling more homes and keeping meaningfully less from each one.
Then Dolson turned to land, and the story's other half came into view. Through September, Green Brick had already put about $597 million into buying and developing land in 2026, and it planned roughly $780 million for the full year.1 It owned or held contracts on more than 51,000 lots, enough ground for well over a decade of building at its current pace.3 Earnings were contracting. The land bet was not.
That mismatch is the subject of this story. Green Brick is not a builder that buys finished lots from a developer and flips them into houses as fast as it can. It is a land company that happens to build houses, or a homebuilder that insists on owning the dirt beneath its homes years before anyone wants to live there, depending on which way one squints. That choice made it one of the most profitable builders of the last housing boom. Whether it remains an advantage in a slower market is the question the quarter posed.
Three narrower questions follow from it. The first is whether a land-led model is a durable edge or simply a large, slow-moving bet on house prices that consumes cash while it waits. The second is whether Trophy Signature Homes, the lower-priced brand that now accounts for most of Green Brick's sales, can defend demand without giving away the margin that made the land valuable. The third is less comfortable: earlier in 2026 the company restated its 2025 revenue and disclosed a material weakness in its internal controls, and investors deserve to know whether that was a contained error or a sign of something wider.4
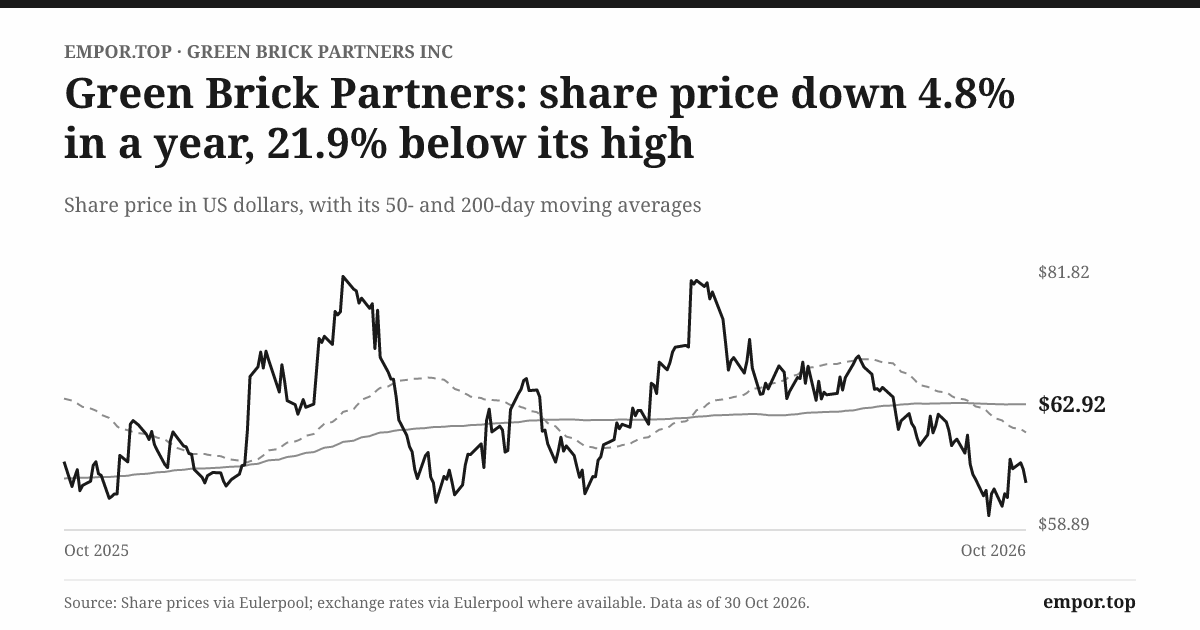
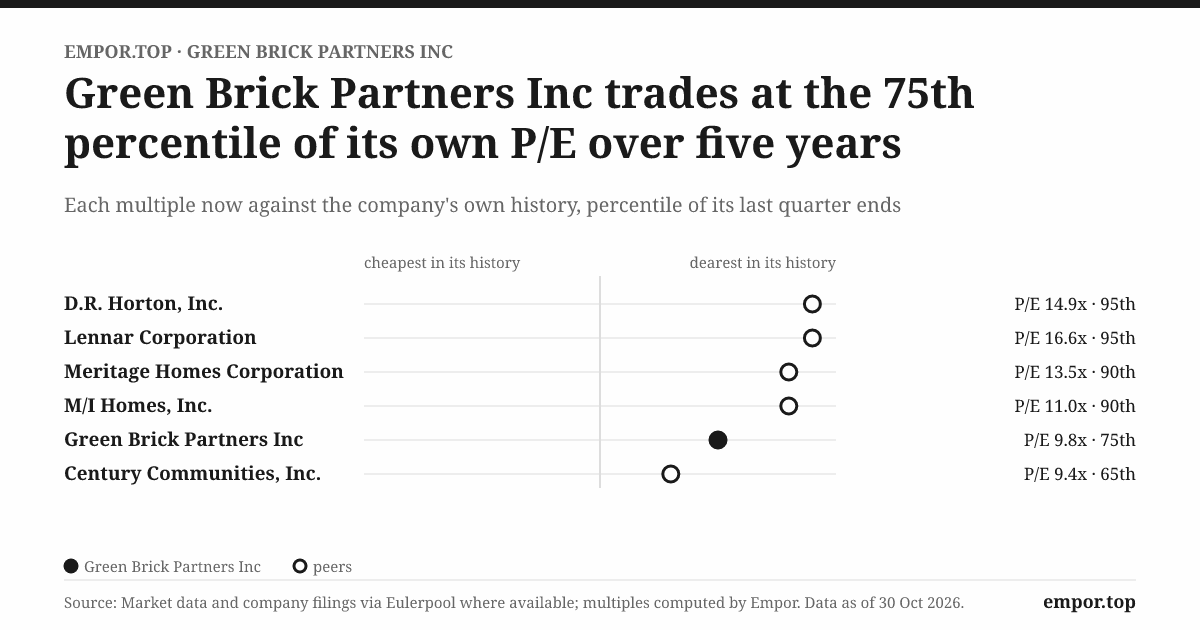
The stakes are visible in the share price. At about $63 on October 30, Green Brick trades roughly 22% below its 52-week high, yet at about 9.8 times trailing earnings it still sits above its own five-year median multiple of about 7.9 times.3 For a builder whose recent revenue and profit growth had slowed to a crawl, that is a market still paying for a recovery, not pricing in a reckoning. The price says investors believe the land will eventually pay. The quarter says the land is being asked to wait.
To understand why Green Brick holds so much of it, and why its owners have always been comfortable waiting, the story has to go back to a strange transaction in the autumn of 2014, when a bankrupt ethanol company became a Texas homebuilder.
 Subscribe on LinkedIn
II. The $275 Million Deal That Put Green Brick on the Map
In November 2013, BioFuel Energy Corp. handed its two ethanol plants, in Wood River, Nebraska, and Fairmont, Minnesota, to its lenders in full satisfaction of its debts.5 It had run those plants since mid-2008, through a commodity cycle that crushed much of the corn-ethanol industry. When the keys changed hands, what was left was a public company with a stock listing, a shareholder register and, as its own registration statement put it, no substantial operations of its own.5
Among the parties with a seat at that table was Greenlight Capital, the New York hedge fund co-founded by David Einhorn, who served as Greenlight's president and also sat on BioFuel's board.5 A listed shell is not worth much on its own. But to an investor who already owned a profitable private business and wanted to give it ongoing access to public capital, a clean shell with an existing shareholder base could be a useful vessel. Greenlight had exactly such a business, and it had been building it with a Dallas homebuilder since the depths of the housing crash.
That business was JBGL, the initials standing for Jim Brickman and Greenlight. JBGL Capital was formed in 2008, the year American housing fell off a cliff, and JBGL Builder Finance followed in 2010; Greenlight's affiliates provided most of the initial capital for both, with Brickman's interests supplying the rest.5 The timing was the whole idea. While banks were foreclosing on half-built subdivisions and many builders could not get credit at all, JBGL bought land and lots in Dallas–Fort Worth and Atlanta and financed builders who needed somewhere to build.5
Brickman was the operating half of the partnership. By 2016 the company described him as having more than 39 years of experience in real estate development and homebuilding, which meant he had been working Texas land since the late 1970s.6 He had lived through the savings-and-loan collapse that devastated Texas real estate in the late 1980s and the national bust two decades later. A builder who has seen two crashes tends to believe that the time to buy land is when nobody else can, and JBGL was built on that belief. The company later said plainly that it had made significant land investments during the downturn at prices it viewed as attractive.6
The structure Brickman and Greenlight designed was unusual. JBGL did not simply build homes. It owned 50% controlling stakes in a handful of local builders, developed land, sold lots to those builders and lent them money for land and construction.5 Its 2016 annual report spelled out the economics with unusual candor: the company financed its controlled builders' land purchases at a targeted unlevered internal rate of return of at least 20%, and charged them about 13.8% interest on construction loans.6 In other words, the parent was a land bank and a lender first, and a partner in builder profits second. Each layer earned its own return.
It is worth pausing on why that structure made sense in 2010 and why it would not last forever in that form. In the aftermath of the crash, small and mid-sized builders were starved of capital. Banks that had lent freely against land in 2006 would not lend at all by 2009, so a builder with good local knowledge and a sales team but no balance sheet had nowhere to turn. JBGL filled that gap, and the price of filling it was high: a 20% target return on land and double-digit interest on construction loans are the economics of a lender to borrowers with no alternatives. The arrangement also gave JBGL something more valuable than interest. By financing local builders and taking half of each one, it gained control of their operating know-how while keeping the land, the scarcest asset, at the parent. That is the first appearance of the idea that runs through this whole story: in Green Brick's world, whoever controls the lots controls the economics.
By 2014 that platform included The Providence Group in Atlanta, formed in 2011; CB JENI Homes and Centre Living Homes in Dallas, both formed in 2012; and Southgate Homes, a Dallas luxury builder formed in 2013.6 They spanned townhomes priced in the low $200,000s to luxury houses above $1 million.6 It was a portfolio of local brands sitting on a shared land bank, and it was about to become public.
On October 27, 2014, BioFuel completed its acquisition of JBGL for $275 million and renamed itself Green Brick Partners; its ticker changed from BIOF to GRBK.7 About $191.8 million of the price was paid in cash, and the rest in roughly 11.1 million new shares valued at about $7.49 each.7 Brickman became chief executive and a director, and Einhorn became chairman.7
The cash had to come from somewhere, and much of it came from Greenlight itself. A rights offering priced at $5 a share raised about $70 million, and Greenlight provided a five-year, $150 million term loan carrying 9% interest in the first year and 10% thereafter.7 That loan was expensive for a company whose assets were dirt and partly built houses, and it gave the largest shareholder a second role as the largest creditor. After closing, Greenlight was expected to own just under half of the company and Brickman's interests about 8%.5 This was not a conventional initial public offering of a builder. It was a reverse recapitalization: a private business pouring itself into a public shell, financed by its own sponsor.
Was $275 million a good price? The honest answer is that the filings do not let anyone say. A fair test would compare the price with what other builders and land developers sold for at the time, measured against book value, lots controlled and earnings, and would need the purchase-accounting detail of what was paid for land versus goodwill. Those comparisons are not in the record, so neither a bargain nor an overpayment can be claimed. What can be said is what the deal bought: a land bank accumulated at crisis prices, a set of local builder brands, an experienced operator, and a patient anchor investor willing to finance the transition.
The next step showed how the founders intended to treat that transition. On July 1, 2015, Green Brick sold 17 million shares to the public at $10 each, raising about $170 million net.6 The same day, it used about $154.9 million of the proceeds to repay the entire Greenlight term loan, including interest and a prepayment premium.6 The trade was clear. Existing holders took dilution, issuing new shares at a price above the deal's $7.49 valuation, and in return the company retired double-digit-cost debt owed to its own chairman's fund. The balance sheet that emerged was conservative: borrowings fell from about $176 million at the end of 2014 to about $58 million a year later, while shareholders' equity roughly doubled.6
That 2015 offering set the tone for how Green Brick would fund itself for the next decade, leaning on equity and retained profit rather than heavy borrowing. But before following the capital story further, it is worth understanding what Green Brick actually does with its money, because in this business, a house is the last thing that gets built.
III. The Home Starts as Inventory, Not Revenue
Picture a few hundred acres of North Texas pasture on the edge of a growing suburb. There is grass, perhaps some cattle, a creek and a county road. There are no streets, no sewer lines, no water mains, no zoning that permits houses. A homebuyer five years from now will see a cul-de-sac, a sidewalk and a front lawn. For the moment there is a parcel and a check.
Green Brick's model begins with that check. The company buys the raw land or contracts to buy it in phases. It then pays for entitlements, the approvals that let houses be built; for engineering; and for the roads, utilities, drainage and amenities that turn acreage into finished lots.4 Only then does a builder brand pour slabs and frame walls. Only when a buyer closes on a finished house does any of that spending show up as cost on the income statement. Until then, every dollar sits on the balance sheet as inventory.4
That accounting matters because it explains nearly everything strange about Green Brick's financial statements. A software company's spending on engineers hits the income statement right away. A homebuilder's spending on land, roads and lumber does not. It is capitalized into the cost of each lot and each house, then expensed when the home closes, so that revenue and its matching costs arrive together. The result is that reported profit can look excellent in a year when the company is spending heavily on dirt that will not become a closing for several years.
The scale of that pipeline is remarkable. At the end of September 2026, Green Brick owned about 40,900 lots and had another 10,600 under contract, for a total of roughly 51,400.1 Management said about 38,000 of those lots sit in master-planned communities that will be developed over five to ten years or longer.1 In 2025, the company delivered 3,943 homes across its seven builder brands.4 Divide the lot count by that pace of closings and the pipeline represents something like a dozen years of building. Few things in American business are as patient as a master-planned community.
The balance sheet carries the weight of that patience. Measured against the cost of homes sold, Green Brick's inventory represented about 546 days of cost at the end of 2025, and its cash-conversion cycle, the time between paying for inputs and collecting from customers, was about 528 days.4 Put plainly, the typical dollar Green Brick spends on land and construction takes about a year and a half to come back as a closing, and the dollars buried in a long-dated master plan take much longer. Both figures had risen sharply over the previous three years, from roughly 420 days of inventory in 2022.4
There are three ways that money returns. The first and most important is homebuilding: a buyer signs a contract, the company builds or completes the house, and revenue is recognized at closing.4 The second is land and lot sales to other builders, a smaller and lumpier stream that rises and falls with the company's decisions about which ground to build on itself. The third is financial services: mortgage origination, title and insurance offered to buyers of Green Brick's homes. In the third quarter of 2026, financial services produced about $11.2 million of revenue against about $437 million of home-closing revenue.1 It is growing fast, but it is a side dish.
None of this is recurring revenue in the way a subscription is. Each home is a single transaction with a single household, and the household can walk away. A signed contract becomes backlog, the stock of homes sold but not yet closed, and backlog is a promise, not a payment. Buyers cancel when they lose a job, fail to qualify for a mortgage, or find a better deal down the road. In 2025, Green Brick's orders rose about 3% to 3,795, but its year-end backlog fell about 22% to 520 homes, because the company closed homes faster than it sold new ones.4 Backlog, in other words, can shrink even when demand is steady, and the gap between the two is one of the cycle's earliest warnings.
The people on the other side of the business are just as diffuse. Green Brick does not disclose customer concentration, and there is little to disclose: its customers are individual households, each buying one home.4 It does not quantify supplier concentration either. Construction relies on independent subcontractors, the framers, masons, electricians and drywall crews who move from builder to builder, and on ordinary materials suppliers.4 That structure keeps fixed costs low, because Green Brick does not employ armies of tradespeople, but it also means the company competes with every other builder in town for the same crews when the market is busy.
The receivables tell the same story of a business paid at closing. Green Brick's receivables are small and consist mostly of rebates, joint-venture balances and escrow amounts; mortgages it originates are sold to investors, generally within 30 days.4 There is no customer credit book to worry about. The capital is not tied up in what customers owe. It is tied up in what the company owns.
It helps to put a rough shape on how one lot travels through the system. Suppose Green Brick buys a large tract, spends several years entitling it and building its first phase of roads and utilities, and then begins releasing lots to its own brands. Early in the life of the community, the company has spent heavily on land and infrastructure for hundreds of future homes and has closed none of them, so the project is deeply cash-negative. In the middle years, closings pay back the infrastructure while new phases are developed, and the community roughly funds itself. In the final years, the land and infrastructure are largely paid for and each closing throws off cash. A company with many communities at different stages blends these curves together. When it is adding communities faster than it is finishing them, the blend is cash-hungry; when it slows the pace of new land, the blend turns cash-generative. That simple picture explains most of what follows.
So the defining asset of Green Brick is not its brands, its sales offices or its model homes. It is that land pipeline. It can protect margins when lot prices rise, because the company bought its ground before they did. It also ties up an enormous amount of cash for a long time. Which raises the obvious question: after a decade of buying ground, has the scale of that investment paid?
IV. $1.8 Billion of Profit, and the Cash That Took Its Time
In 2024, Green Brick earned about $381 million of net profit, the best year in its history.4 It generated only about $26 million of operating cash flow.4 A year later, profit fell by nearly a fifth to about $313 million, and operating cash flow jumped to about $213 million.4 Profit went down and cash went up eightfold. For anyone who thinks of earnings and cash as the same thing, Green Brick's statements look like a riddle.
The answer is in the land. In 2024 the growth in inventory consumed about $403 million of cash; in 2025, about $160 million.4 When the company buys and develops more ground than it sells through closings, inventory swells and cash drains away even in a record year. When it slows its land spending relative to closings, cash comes rushing back even as profits fall. The income statement tells you what the homes that closed were worth. The cash-flow statement tells you how hard the company is leaning into the next ones.
Step back to the whole public-company era and the riddle becomes a theme. From 2014 through 2025, Green Brick reported about $1.8 billion of cumulative net profit.4 Over the same twelve years it generated about $357 million of cumulative operating cash flow, roughly 20 cents of cash for every dollar of profit.4 Subtract the trivial sums spent on offices and equipment, and free cash flow over the period was about $327 million.4 Most of the difference between those two totals, nearly $1.5 billion, did not vanish. It became land, lots and houses under construction, the inventory that sat on the balance sheet at the end of 2025.
That growth record is genuinely exceptional. From 2015 to 2025, revenue compounded at about 21.5% a year, rising from under $300 million to about $2 billion, while net profit compounded at about 35.5% a year.4 6 Operating margins roughly doubled over the decade, from the low teens to about 20%.4 Shareholders' equity grew from about $360 million at the end of 2015 to about $1.9 billion at the end of 2025, almost entirely from retained earnings rather than new share issues.4 6 Few homebuilders of any size compounded book value that quickly through a full decade.
The reinvestment that drove it was almost entirely in the ground. Green Brick spent only about $4.8 million on property and equipment in 2025, roughly 0.2% of revenue.4 It does not report research and development spending; it designs homes with outside architects and consultants.4 Its true capital expenditure is land acquisition and development, which runs through operating cash flow rather than investing cash flow, and it is enormous: the company planned to spend $780 million in 2026 alone, more than twice the year's expected net profit.1 An analyst who looks only at the 3.8% free-cash-flow yield and the tiny equipment budget would badly misunderstand where this company's money goes.
Where the cash that did come out has gone is equally telling. Over the dozen years from 2014 to 2025, the only cash dividends Green Brick paid totaled about $9 million, a few percent of its cumulative free cash flow, and all of it went to preferred holders rather than common shareholders.4 Cash and short-term investments rose from about $13 million before the deal to about $191 million at the end of 2025.4 Most of the rest of the free cash flow, along with retained profit that never became cash, was recycled into buybacks and back into land. In other words, Green Brick has functioned for most of its public life as a compounding machine whose output is more land, not more cash in shareholders' hands. That is a legitimate strategy, and it is how the company built its equity base. It also means shareholders have relied on the share price, not distributions, to realize any of the value, and the share price depends on the market believing the land will pay.
There is a fair defense of the cash gap, and it is the one management would make. A growing land developer will always report profit ahead of cash, because it is buying tomorrow's lots with today's earnings. If the land eventually closes at the margins the company has historically earned, the cash will come back, and the gap will look like an investment rather than a leak. The 2025 swing back to positive cash flow, when land spending moderated, is evidence that the machine can produce cash when it chooses to slow.
The defense has limits, and the recent record exposes them. Growth has cooled sharply. From 2022 to 2025, revenue grew only about 5% a year and net profit about 2.5% a year, a fraction of the decade's pace.4 Return on equity, which peaked above 27% in 2022, fell to about 17% in 2025 and to about 13% over the twelve months to September 2026.4 3 Meanwhile, inventory days rose by more than 120 over three years.4 The company is holding more land for each dollar of cost it sells, and earning less on each dollar of equity. Those two trends together are the signature of a land pipeline whose payback is lengthening.
And in 2026, the cash drain resumed. In the first nine months of the year, inventory consumed another $238 million, and accrued expenses fell by about $48 million, leaving operating cash flow slightly negative, at about minus $5 million, despite roughly $246 million of cash generated by the business before those working-capital movements.3 To bridge the gap while still repaying maturing notes and buying back stock, Green Brick drew $105 million on its revolving credit line.3
The historical record therefore narrows the claim rather than rejecting it. Green Brick has proved that its land bank can produce exceptional profits when house prices are rising and lot values appreciate under it. It has not yet proved, at its current scale, that the same pipeline can return its cash on schedule when prices are falling and incentives are rising. The 20% cumulative cash conversion is not proof of a broken model; it is proof that the verdict on the past decade's investment is still partly pending.
The question an investor should press is cohort-level and specific: for the land bought and developed in a given year, how much cash has come back through closings, and over what period? Green Brick does not publish its returns by land vintage, so outsiders must infer them from margins and inventory trends. That question becomes sharper, not softer, when the market starts asking the company to sell cheaper homes at lower prices, which is exactly what it has done.
V. Trophy Moves Down the Price Ladder
In October 2018, at the height of a long housing recovery, Green Brick did something its portfolio had never done: it launched a brand from scratch to sell homes to people who could not afford its existing ones.8 Its builders until then had been local, mid-market and luxury operators, from Atlanta townhomes to Dallas houses above $1 million.6 The new brand was Trophy Signature Homes, aimed at buyers looking for a more attainable price in Dallas–Fort Worth.8
It was a deliberate bet on where American housing demand was heading. Millennials were aging into their home-buying years, prices in close-in suburbs were climbing beyond the reach of young families, and the builders who could produce a decent house at an attainable price at volume were winning share. National giants such as D.R. Horton had built empires on that segment. Green Brick's answer was to use its land bank, much of it on the expanding edges of the Metroplex, to build its own entry-level engine rather than buy one.
The bet worked, measured by volume. By 2025, Trophy accounted for about half of Green Brick's deliveries, and the brand ranked as the sixth-largest builder by starts in Dallas–Fort Worth.4 By the third quarter of 2026, it accounted for about 60% of the company's orders and deliveries.1 In seven years, a start-up brand had become the company's center of gravity.
Its sales pace is the strongest operating evidence in Green Brick's favor. In the third quarter, Trophy sold about 5.2 homes per community per month, up from about 4.7 a year earlier, while the company as a whole sold about 2.8.1 That gap matters because sales pace, or absorption, is how a builder turns its lots into cash. A community that sells five homes a month works through its lots almost twice as fast as one that sells three, which means less time holding land and less interest and overhead per house. Trophy has also become faster to build: Trophy's Dallas homes took about 88 days to construct in the quarter, down from 97.1 For a company whose central problem is the time its capital spends in the ground, a brand that shortens that time is valuable.
Green Brick also operates in a competitive setting that flatters it and humbles it at once. The company is the third-largest builder in Dallas–Fort Worth, one of the most active housing markets in the country.4 It competes there against national builders such as D.R. Horton and Lennar, which operate at many times its scale, buy materials in greater bulk and run their own mortgage businesses across dozens of markets. Green Brick's argument for competing with them rests on local land positions, particularly infill and well-located suburban lots bought early, and on brands that fit particular neighborhoods. That argument is plausible. The company has not, however, published market-share data that shows a durable advantage over time, and a ranking among the top builders in one region, achieved during a boom, is not the same thing as a moat.
The pressure on Trophy's model became audible on the October call. Brickman described the brand's continued expansion in Austin and Houston as a clear path to growing deliveries.1 But when an analyst asked about Houston, Dolson acknowledged that it was still a small market for the company, with one community open and two more planned by the end of the following year.1 Brickman added a line that may prove to be the most important sentence of the call: Green Brick was not going to expand just to generate revenue.1 It is the right instinct for a land company. It is also an admission that new markets will not quickly replace the price weakness in old ones.
The cost of moving down the price ladder showed in the average selling price. Cox explained that roughly half of the year-over-year margin decline came from higher incentives, and the other half from the shift toward Trophy and reductions in base prices.1 In other words, Trophy is not just a volume engine. It is also, mechanically, a margin diluter. A company that sells a greater share of lower-priced homes will report a lower average price even if no individual house is discounted, and Trophy's homes tend to carry slimmer margins than the luxury and infill brands. When management asked about the fourth quarter, Dolson declined to give an average-price figure but said it could move slightly lower.1
Mortgage services offer a partial offset, and they are growing quickly. Financial-services pretax income rose about 69% in the quarter to roughly $5.6 million, and Green Brick's mortgage arm captured about 66% of eligible buyers, with management targeting about 70% over time.1 Mortgage capture matters strategically because the company's main tool for keeping buyers in contracts is the rate buydown, and owning the lender makes that tool easier to use and partly self-funding. But at about $11 million of quarterly revenue against more than $400 million of closings, financial services is a support beam, not a second engine.1
So the verdict on Trophy is a qualified one. It is a meaningful strategic answer to affordability, with a demonstrable sales-pace advantage and shorter build times. It has not insulated Green Brick from the market. The brand that keeps the communities selling is also one of the reasons the company's average price and margins are falling. The real test is what happens to the rest of the portfolio, and to the backlog, when sales hold up but prices do not.
VI. When Orders Rise but Backlog Shrinks
Imagine a model home in a new subdivision north of Dallas on a Saturday afternoon in September 2026. The sales counselor has a laminated sheet of incentives: thousands of dollars toward closing costs, and a mortgage rate bought down into the mid-5% range, well below what a buyer would find at a bank.1 A young couple signs. In the company's quarterly report, they become one of the 926 net new orders that rose about 3% from a year earlier.1 It looks like demand. It is demand. It is also a sale that cost more to make than it did a year before.
That contradiction runs through the whole quarter. Orders rose, yet backlog revenue, the dollar value of homes under contract but not yet closed, fell about 17% to roughly $379 million, and backlog units fell about 7% to 629 homes.1 More orders and less backlog can coexist for three reasons, and Green Brick's quarter had all three. The company closed homes quickly, partly because construction cycle times fell by about 25 days to an average of 116, which pulled homes out of backlog sooner.1 Cancellations rose, from about 6.7% of gross orders to about 8.2%, so more contracts fell away before closing.1 And the homes in backlog were worth less each, because the mix had shifted toward Trophy and prices had come down.1
Pace, too, told a subtler story than the order count. Green Brick had about 109 active selling communities, almost 6% more than a year earlier.1 Its companywide sales pace slipped slightly, from about 2.9 homes per community per month to about 2.8.1 Orders rose, in other words, because the company opened more places to sell, not because each community was selling faster. That is how a builder with a deep land bank defends volume: by putting more lots on the market. It is also why the land spending has not slowed as much as earnings.
The margin decline has a clear mechanism, and management was specific about it. Incentives rose to about 9.9% of home-closing revenue, up about 180 basis points from a year earlier.1 As Cox explained, incentives and the shift toward Trophy and base-price reductions each accounted for about half of the gross-margin decline.1 A rate buydown works like this: the builder pays a lender upfront so that the buyer's mortgage carries a lower rate, sometimes for the life of the loan. The buyer sees a lower monthly payment; the builder sees a smaller check at closing. It is a price cut in disguise, and when mortgage rates stay high, it can become a recurring feature of the sales office.
Here the question of a pricing moat has to be confronted directly. Homebuyers can visit a Green Brick community and a D.R. Horton community on the same afternoon. They have no recurring relationship with the builder, no switching cost before they sign a contract and, as the cancellations show, only a modest one afterward. The company does not report lost sales to competitors or changes in regional market share. Its margins were exceptional during the boom, but the past year demonstrates that they were at least partly a product of the boom: as soon as affordability tightened, Green Brick paid for its sales through incentives like everyone else. Its relative strength lies in owning lots bought at older, lower prices, which cushions margins while competitors pay today's land costs. The evidence does not show a broad, durable ability to hold prices when the market softens.
The supply side added its own uncertainty. Dolson told analysts that immigration enforcement had had a modest effect on labor availability among some construction trades, but that the company had not experienced a measurable impact on its operations to date.1 Brickman pointed to masonry, electrical and drywall work as the areas where crews were tighter.1 For a builder that depends entirely on subcontractors, labor tightness is a cost that tends to show up later, in bids and in cycle times, rather than immediately. The faster build times reported in the quarter suggest it had not yet bitten.
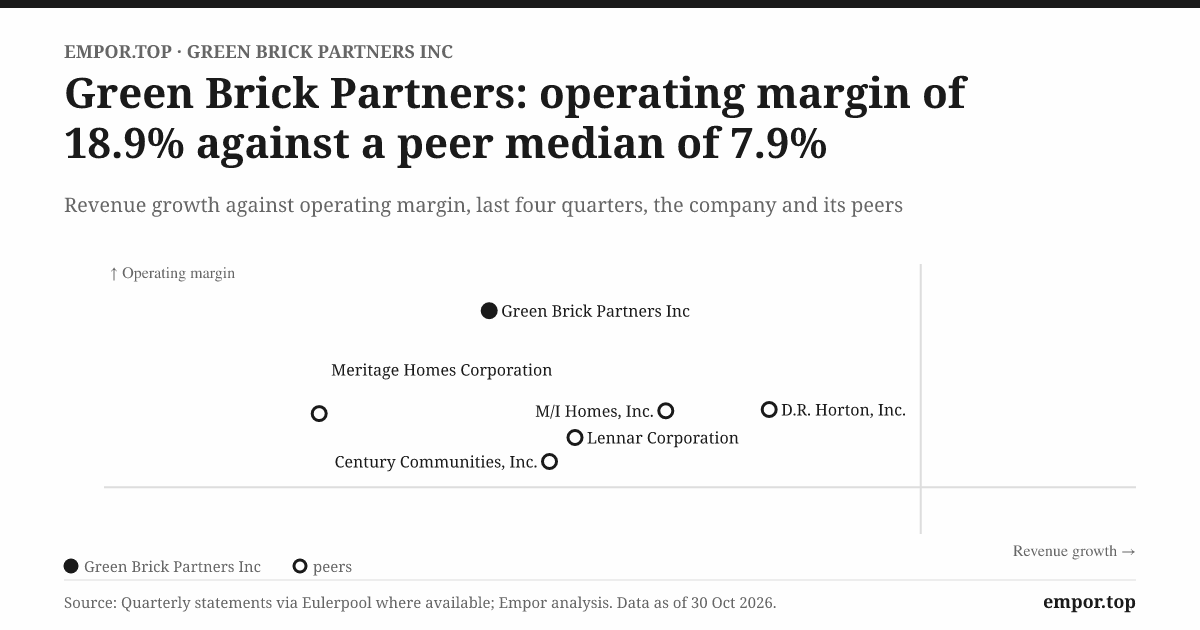
Overhead told the last part of the margin story. Selling, general and administrative expenses fell about 6% to roughly $51.8 million, but because revenue fell faster, they rose to about 11.8% of residential revenue from 11.4% a year earlier.1 This is operating deleverage in its plainest form. A builder's sales offices, managers and marketing do not shrink when the average house gets cheaper, so each lower-priced closing carries a heavier share of the fixed costs. Combine four points of gross-margin decline with nearly half a point of overhead deleverage, and the drop in operating margin, from about 19.5% to about 17%, follows almost arithmetically.3 Nothing in the quarter required an exotic explanation. Lower prices and higher incentives flowed straight through a cost base built for a richer market.
The analyst questions were revealing for what they asked and for how they were answered. Rohit Seth of B. Riley pressed on demand trends and whether the company would favor price or pace into 2027; Cox described a normal seasonal pattern with sales improving from July to September, while answers on future incentives stayed qualitative.1 Ryan Gilbert of BTIG asked about land spending and margin drivers, and got a concrete split of the margin decline but a more general answer on land: Brickman said high-margin deals were hard to find, and described the company's posture toward new land as "cautious, very cautious."1 He added that Green Brick now builds roughly 10% elevated incentives into its land underwriting models.1 Jay McCanless of Citizens asked about fourth-quarter prices and was told only that they could move slightly lower.1
That combination of concreteness on the past and vagueness on the future is not unusual for a builder in a turning market, and it is not evasive in itself. But it means investors have little to hold management to. There was no numeric guidance for the fourth quarter or for 2027 margins.1 The most important disclosed change, the cut in planned 2026 land investment from $850 million to $780 million, was modest: an 8% trim to a spending plan that still exceeded the year's likely earnings by a wide margin.1
The verdict on the quarter is therefore straightforward. Green Brick is still moving homes, and Trophy remains a bright spot. But price, backlog and margin all point to a harder market, and the company's main defense, incentives, is being paid for out of the margin that its land was supposed to protect. The market pressure is plain in the operating results. A separate story, told earlier in 2026, asked a different question: how clearly were those results being measured in the first place?
VII. The Restatement Changed Sales, Then Exposed a Control Gap
On May 11, 2026, Green Brick filed something no public company wants to file: an amended annual report.4 Its original 2025 Form 10-K had been out for less than three months.9 The amendment restated revenue for 2025, and it carried a second, heavier disclosure. The company's auditor, RSM, had concluded that Green Brick's internal control over financial reporting was not effective as of December 31, 2025, because of a material weakness.4
The error itself turned on the same incentives that dominated the October call. When a builder pays to reduce a buyer's closing costs or to buy down a mortgage rate, that payment is, in economic substance, a reduction in the price of the house. Under the revenue-recognition standard known as ASC 606, such consideration paid to a customer generally belongs in the calculation of the transaction price; it reduces revenue rather than appearing as a cost of building the home.4 For years, when incentives were small, the distinction made little practical difference. As incentives grew, the company's controls did not reassess whether they had become material enough to require that treatment.4
The fix reduced 2025 revenue and cost of revenue by about $58.5 million each.4 Because both lines fell by the same amount, gross profit, net income, earnings per share, cash flow and shareholders' equity were all unchanged.4 A reader who looked only at the bottom line would see nothing. A reader who computed gross margin as a percentage of revenue would see it rise slightly, because the same gross profit was now divided by a smaller revenue number. That is a subtle but real point: margin comparisons across the restatement are not perfectly like-for-like.
The same subtlety applies to the incentive figures management now discusses on its calls. When incentives are netted against revenue rather than booked as cost, both the reported average price and the reported incentive rate change meaning. An investor comparing a 2026 average selling price with a figure from an older presentation, or comparing today's incentive percentage with one quoted before the restatement, should check which convention each number uses. The difference is not large enough to change the direction of any trend in this story, but it is the kind of detail that matters when a company's margins are moving by a few points and investors are trying to tell how much of the move is incentives and how much is mix.
There is a reasonable case that this was a contained accounting error. No profit disappeared. No cash was misstated. The financial-statement audit opinion remained unqualified, meaning the auditor concluded that the restated numbers fairly presented the company's results.4 The error was a classification, the kind of problem that can arise when an obscure judgment, made once and never revisited, collides with a business that has changed under it.
The case for taking it more seriously is that the weakness was in the controls, not just the numbers. A material weakness means there was a reasonable possibility that a material misstatement would not be prevented or caught in time. The controls in question governed the treatment of incentives, one of the most important variables in the business, as the third quarter showed.1 A control that failed to notice the growth of the company's single most important pricing lever is not a cosmetic failure. It suggests that the finance function's review of accounting judgments had not kept pace with the business.
The timing adds context. The previous chief financial officer, Richard Costello, had resigned in March 2025, and Jeffery Cox moved from interim to permanent CFO.10 Finance leadership transitions do not cause control failures by themselves, but they are periods when institutional memory about why a policy was set a certain way can thin. Management said remediation was underway.4 It has not yet been tested.
The evidence that will close this chapter is specific. Investors should look for management's description of the remediated controls, the auditor's confirmation that they operated effectively, and a clean internal-control opinion in the 2026 annual report, expected early in 2027, with no further revenue-classification revisions in the meantime. Until then, the restatement leaves profit untouched and still changes how much trust the numbers deserve.
It is also the clearest recent contradiction to a simple story of strong execution. A company that is asking investors to trust its judgment about land worth well over a billion dollars, bought to be sold a decade from now, had a lapse in judging a far simpler matter. That makes the question of who runs the company, and how they are held accountable, matter more than it otherwise would.
VIII. Brickman, Dolson and the Test of Capital Discipline
On July 30, 2026, Green Brick announced that Jed Dolson, its president and chief operating officer, would become co-chief executive on October 15.11 Brickman kept the same title. The filing was brief: no new compensation terms, no family relationships, no related-party transactions.11 Dolson had spent more than a decade at the company before the promotion.10 The promotion was framed as planned succession, and its timing, months before it took effect, supports that description.
It did, however, create an unusual structure. Co-chief executive arrangements divide accountability in ways that can be useful during a handoff, when the founder's relationships and the successor's operating command are both needed. They can also blur responsibility, because it becomes harder for a board to say who owns a decision. On the October call, the division of labor was already visible: Brickman spoke to strategy, land discipline and expansion; Dolson handled land spending, incentives and operational detail.1 The question for the next year is not the titles. It is whether the person responsible for land underwriting is also the person responsible for its returns.
Ownership gives both founders and investors a direct stake in that question. In the May 2026 proxy, Greenlight Capital and its affiliates held about 9.5 million shares, or roughly 22% of the company; BlackRock held about 12%; Vanguard about 5%; and Brickman about 4.5%.10 Two years earlier, Greenlight had held about 23% and Brickman about 4.7%, while BlackRock's stake had been about 9%.12 Greenlight's position, in other words, eased modestly as index-oriented holders grew. Einhorn remains chairman, and the company itself warns that Greenlight and Brickman together have significant influence over corporate decisions.4 One more detail is worth tracking: in 2024, Greenlight disclosed that about 3 million of its shares were pledged or held in margin accounts, down from about 7.7 million a year earlier, and the 2026 proxy did not update that figure.12 Pledged shares are a classic source of forced selling if a holder's own finances come under pressure.
Alignment through ownership is real. Brickman's stake is worth roughly $120 million at current prices, enough that his personal wealth rises and falls with the stock. Greenlight's stake is the kind that a hedge fund cannot easily sell without moving the price. These are owners who have to live with the land they buy.
The arc of Greenlight's stake is itself a capital-markets story. When the deal closed in 2014, the fund was expected to own just under half of the company.5 By 2026 its share had fallen to about a fifth, through the 2015 offering that brought in new public holders, subsequent sales and the growth of index funds' positions.10 12 Greenlight has held registration rights to resell its shares under a shelf filed in 2023; the company said through early 2026 that it had not used that shelf to issue new securities.9 The gradual decline in the sponsor's stake has made Green Brick more like an ordinary public company, with five of its seven directors identified as independent.10 It has not changed the fact that Greenlight and Brickman together still hold enough shares to shape most outcomes.
Compensation is where alignment meets scrutiny. Brickman's reported total pay rose from about $8.2 million in 2024 to about $13.4 million in 2025, a year in which net profit fell about 18%.10 About $7.6 million of the 2025 figure was stock awards, valued at their grant-date price.10 Grant-date value is not realized pay; if the stock falls, those awards will be worth less. But the decision to grant more equity in a year of declining profit tells investors something about how the board weighed the year's performance. Shareholders nonetheless approved the say-on-pay resolution with about 33.1 million votes for and roughly 397,000 against, about 98.8% support among votes cast for and against.13 That vote should be read with the ownership structure in mind: the chairman's fund and the chief executive together control more than a quarter of the shares, which makes overwhelming approval easier to achieve.
Capital deployment across the full record is the best test of discipline, and it gives a mixed but mostly coherent picture. The 2015 equity raise repaid expensive sponsor debt and set a conservative balance sheet. In 2021, the company issued $50 million of 5.75% perpetual preferred stock.9 The only cash dividends in Green Brick's history have been on that preferred stock, about $2.9 million in 2025, which is almost exactly the preferred coupon; common shareholders receive no dividend.4 Instead, the company has returned capital through buybacks: about $83.8 million in 2025 and about $34.8 million in the first nine months of 2026, including roughly 264,000 shares in the third quarter for about $17.9 million.9 3 2 About $133 million remained on the repurchase authorization.1
That is where an activist's eye would settle. In 2026, the company is simultaneously investing about $780 million in land, generating slightly negative operating cash flow, drawing $105 million on its revolver, and buying back stock.3 1 None of those choices is reckless on its own; leverage remains low, and repurchasing shares at a modest multiple can be a sensible use of capital. But together they mean that buybacks are being funded, at the margin, with borrowed money while the land pipeline grows. A skeptical investor would ask why the company does not either slow land spending further or pause repurchases until operating cash turns positive, and would want to see management's answer framed in returns rather than in confidence.
The related-party arrangements are small but worth explaining clearly. Centre Living Homes, one of the original Dallas builders, is 90% owned and fully consolidated by Green Brick; the other 10% belongs to Trevor Brickman, the chief executive's son, who serves as its president.4 A separate set of office leases with entities affiliated with the president of the company's Treasure Coast operation, GRBK GHO, cost about $0.1 million a year.4 These amounts are immaterial against $2 billion of revenue. The governance point is not their size but the precedent: a family member holding a minority stake in a consolidated subsidiary of a public company creates a potential conflict over how land and capital are allocated among brands, and the company does not describe how such allocations are priced.
The succession will be judged less by titles than by three outcomes: whether land returns hold up, whether cash conversion improves, and whether the control weakness is cleanly remediated. Those are the same three tests that decide whether Green Brick is worth what the market pays for it.
IX. Analysis & Bear vs. Bull Case
On October 30, 2026, Green Brick's shares closed near $63, about 22% below their 52-week high of roughly $81 and not far above the year's low of about $60. The company was worth about $2.8 billion in the market and about $3.1 billion including debt net of cash. At about 9.8 times trailing earnings, 1.3 times book value and about 8 times EBITDA, it was not expensive in absolute terms. It was, however, more expensive than its own history: its five-year median earnings multiple was about 7.9 times.3 Peers tell a different story again: a MarketBeat snapshot in late October showed Green Brick at about 9.7 times earnings, against roughly 14 times for D.R. Horton, 13 times for KB Home and 16 times for Lennar.14 Those comparisons mix reporting periods and business models, but they frame the market's view. Investors pay less for Green Brick than for the national giants, and more for Green Brick than they used to.
There is a simple reading of that premium to history. Builder multiples tend to rise when earnings fall, because investors look through the trough to a recovery. A higher multiple on depressed earnings is not necessarily optimism; it can be the market declining to extrapolate the downturn. What it does assume is that today's earnings are closer to a bottom than a midpoint, and that the land pipeline will eventually produce margins nearer to the company's historical level.
The bull case is built on real evidence. Green Brick controls more than 51,000 lots, much of it bought years ago at lower prices, which gives it a cost advantage over builders who must buy finished lots at today's prices.1 Its brands are locally recognized, and Trophy sells nearly twice as fast per community as the rest of the portfolio.1 Its balance sheet is conservative: debt was about 18% of equity at the end of 2025, and homebuilding net debt was under 10% of capital in September 2026.4 1 Its decade-long growth record is among the best in the sector. And management's reaction to the slowdown, cutting land spending, building elevated incentives into underwriting and refusing to expand purely for revenue, is the reaction of a land company that has lived through cycles.1
The bear case is built on evidence too. Housing demand is acutely rate-sensitive, and incentives have become a structural cost of selling homes while rates stay elevated. Margins and returns have retreated from their peaks: the homebuilding gross margin fell about four points in a year, and return on equity has fallen by about half from its 2022 peak.1 3 The land pipeline ties up cash for years, and the cash drain resumed in 2026. The material weakness remains unresolved until it is demonstrably fixed. And the mix shift toward Trophy, while protecting volume, steadily lowers the average price and margin.
Porter's five forces help sort these facts. Buyer power is meaningful: homebuyers are individuals, but they can compare builders freely and face low switching costs before contract, which is why incentives spread so quickly across the market. Supplier power is concentrated in labor rather than materials; subcontractor availability can pressure costs and cycle times, and the immigration-related tightness Dolson described is a live example.1 Rivalry is intense: Green Brick competes in Dallas–Fort Worth against builders with far greater scale and lower costs of capital, and in a slowing market the largest builders can use incentives aggressively to protect volume. The threat of substitutes, chiefly existing homes and rentals, rises when resale inventory grows. Barriers to entry are the one place Green Brick has a defensible position: entitled, well-located land in attractive suburbs is scarce, slow to create and expensive to replicate. The company has not quantified that advantage, but it is the most credible source of whatever edge it has.
Hamilton Helmer's 7 Powers framework sharpens that conclusion. Green Brick has no network effects and few switching costs. It does not have scale economies comparable to the national builders. Its brands carry local recognition but not the kind of brand power that lets a seller charge more for an identical product, as the incentive spending shows. Its strongest claim is to a cornered resource: low-cost, well-located land controlled years ahead of need. Cornered resources are powerful when they are truly scarce and cannot be bought at a similar price by rivals. Land partly meets that test, because entitlement and development take years. But it is not permanent: every lot is used once, so the advantage must be renewed by buying more land at good prices, which is exactly what Brickman said was getting harder.1 A second, weaker claim is process power in Trophy's fast-building, fast-selling operating system. Shorter cycle times and higher absorption are real, but larger rivals run similar playbooks. The evidence leaves the moat intact but narrower than the boom-era margins suggested: a land-cost edge, not a pricing moat.
Mortgage and title deserve their proportionate place. Financial services is growing fast and helps the company deploy buydowns efficiently, but its revenue is a small fraction of home closings.1 Until mortgage capture and pretax income become material to group earnings, it is a tool of the homebuilding business rather than a second engine.
Credit history requires a brief note of caution. The company's investor-relations site still lists a Fitch rating of B+ with a stable outlook dated April 2020.15 That is a historical record, not a current credit opinion, and no newer agency rationale is published. The more useful credit evidence is current: about $338 million of debt at the end of September 2026, including $105 million drawn on a $330 million revolver and about $187 million of senior notes maturing in 2027 and 2028, against $100 million of cash and reported compliance with covenants.3 4 The revolver matures in December 2028.3 There is no visible refinancing wall, but the revolver draw makes the company's dependence on borrowed money more visible than it was a year earlier.
Two smaller signals point the same way. Homebuilding debt to total capital was about 13.1% in September 2026, down from about 15.3% a year earlier, and liquidity, cash plus undrawn revolver, stood at about $325 million.1 Letters of credit and performance bonds outstanding fell from about $20 million at the end of 2024 to about $0.2 million a year later, and the company said it did not expect material claims under them or from ordinary-course litigation.4 Book value per share, meanwhile, rose about 14% over the twelve months to September to roughly $46.1 Even in a weaker year, the company kept compounding its equity. The bears' argument is therefore not that Green Brick is fragile. It is that a sturdy balance sheet is being asked to carry a land position whose returns are falling.
Three measures can settle the argument between bulls and bears. The first is homebuilding gross margin, ideally read alongside average selling price by brand: it stood at 28% in the third quarter, down from about 32% a year earlier.1 The second is the trio of orders, cancellations and backlog conversion: orders were up about 3% but cancellations rose to 8.2% and backlog revenue fell 17%.1 The third is operating cash flow measured against inventory and land-development spending: nine-month operating cash flow was slightly negative after about $238 million of inventory growth.3 If margins stabilize, cancellations retreat and cash flow turns positive while the land pipeline holds, the bull case gains real support. If margins keep sliding while inventory keeps rising, the bears' reading of a cyclical land bet past its best years becomes harder to dismiss.
Green Brick, then, has a credible local land-and-brand strategy, low reported leverage and a strong historical growth record. The evidence does not yet show a durable pricing moat or prove that recent land spending will earn historical returns. The premium to its own historical multiple assumes a recovery that the latest quarter has not yet delivered. The investment case turns on whether the next land cohorts produce cash and margins, not on the decade's growth rate alone.
X. Business & Investing Lessons
Green Brick's story begins with a land bet made in 2008 and a public listing six years later.5 7 It continues with Trophy's rise into the majority of its sales.8 1 Between those two moments lie lessons that belong to this company and few others.
The first lesson is about what a homebuilder actually owns. In homebuilding, the house is the receipt; the land is the wager. The house is how the company records the outcome, the moment when revenue and cost finally meet on the income statement. The real decision was made years earlier, when someone signed a check for a pasture and bet that a family would want to live there at a price that would pay for the roads, the sewers and the waiting. Green Brick's growth came with slow cash conversion.4 That is not a contradiction. It is the wager still on the table. For founders, the lesson is that a business whose main asset is time must be judged on how much time its capital spends working. For investors, it is that a land developer's earnings are only as good as the cash that eventually follows them, and that one should ask when, not just whether.
The second lesson concerns affordability. A lower price point can widen the buyer pool, but it does not abolish the mortgage rate. Trophy's sales pace remained a genuine operating achievement.1 But its margin cost was clear.1 Moving down the price ladder solves the problem of who can buy a house; it does not solve the problem of what the house is worth. The wider lesson is that strategies built to defend volume in a downturn should be judged on what they cost, not only on what they keep.
The third lesson is about trust. Green Brick's restatement left earnings and cash unchanged, but exposed a control weakness in its most important pricing lever.4 The lesson for any company whose economics depend on judgment, as a land developer's do, is that the small accounting judgments are where investors test the big ones. If a finance team does not notice that incentives have become material, investors are entitled to ask what else in a ten-year land pipeline might be drifting unnoticed.
The fourth lesson is the one the founders taught by example in 2015. The company's offering helped repay an expensive loan from its chairman's fund and left it with a conservative balance sheet.6 The lesson is that patient capital is a strategy only when it is cheap capital; a land bank financed at 10% is a race against the interest meter, while one financed with equity and retained earnings can afford to wait.
None of these lessons means Green Brick's model is broken. They mean that the model earns its reputation only when lots become profitable closings and, finally, cash.
XI. Epilogue
Tonight, Green Brick stands at the beginning of its first full reporting cycle under two chief executives. It holds more than 51,000 lots, a backlog that is smaller in dollars than a year ago, an open remediation project in its finance department, and a land budget that has been trimmed but not cut.1 Its founder called himself cautious, very cautious, about new ground.1 Its new co-chief executive has two weeks of tenure in the role. And its shareholders are paying a multiple above the company's own history for the privilege of waiting to see how this turns out.
The next moments that will decide it are already on the calendar. The fourth-quarter report, due early in 2027, will show whether the average price slipped again, as Dolson warned it might, and whether incentives have stabilized.1 A falling price paired with steady margins would suggest the mix shift is ending; falling prices and falling margins together would suggest the incentive war is deepening. The same report will reveal what management plans to spend on land in 2027. A further cut would signal that the company is harvesting its pipeline for cash; a return toward 2025-era spending would signal confidence that the next cohort of lots will pay.
The 2026 annual report will carry the second verdict: whether the auditor confirms that the material weakness has been remediated. A clean internal-control opinion would close the restatement chapter and remove a discount that has quietly attached itself to every number the company reports. Another adverse opinion would turn a contained error into a pattern, and it would land squarely on the shoulders of a new leadership structure.
Further out, Austin and Houston will test whether Trophy's model travels. Dallas is where Green Brick bought its land at crisis prices; Houston is a market where it is still small and must compete for ground and buyers at today's prices.1 If Trophy can build the same fast-selling, fast-building communities there, the brand becomes a growth engine. If Houston becomes another source of lots waiting for buyers, it adds to the pipeline without adding to the cash.
The mortgage business has its own milestone. Management said that a mortgage expansion into Atlanta may occur in 2027.1 If it arrives, Green Brick will have a more efficient way to fund the rate buydowns that now keep its communities selling. If it slips, the company will keep paying outside lenders for the same tool. Neither outcome changes the core economics, but each will show whether the side business is maturing into something investors should value on its own.
And through all of it, investors will watch the simplest measure of a land company's health: whether operating cash flow turns positive while inventory stops climbing, and whether repurchases are funded from that cash rather than from the revolver. One quarter cannot settle any of this. Neither can one year, entirely. But the next twelve months will show whether the co-chief executives treat the slowdown as Brickman and Greenlight treated the last one, as a moment to be patient with land, or whether the company's patience has finally become its cost.
That is the tension Green Brick carries into 2027. It grew by holding land through time. The market is now charging it for that time, in cash and in incentives.
XII. Outro
Go back to the pasture at the edge of the suburb. The roads are in now, and the sewer lines, and the streetlights. The lots are graded and staked. A Trophy model home sits at the entrance with a banner advertising a bought-down rate. Somewhere in Green Brick's books, the cost of all of it sits as inventory, waiting for a buyer who has not yet signed, or who has signed and may still walk away.
That long wait is the defining feature of Green Brick's model: the lot before the house, and the cash after it.
References
-
Green Brick Partners (GRBK) Q3 2026 Earnings Call Transcript — The Motley Fool, 2026-10-29 ↩↩↩↩↩↩↩↩↩↩↩↩↩↩↩↩↩↩↩↩↩↩↩↩↩↩↩↩↩↩↩↩↩↩↩↩↩↩↩↩↩↩↩↩↩↩↩↩↩↩↩↩↩↩↩↩↩↩↩↩↩↩↩
-
Green Brick Partners, Inc. Reports Third Quarter 2026 Results — Nasdaq, 2026-10-28 ↩↩
-
Form 10-Q for the quarter ended September 30, 2026 — Green Brick Partners / SEC, 2026-10-28 ↩↩↩↩↩↩↩↩↩↩↩↩↩
-
Amended Annual Report on Form 10-K/A for FY2025 — Green Brick Partners / SEC, 2026-05-11 ↩↩↩↩↩↩↩↩↩↩↩↩↩↩↩↩↩↩↩↩↩↩↩↩↩↩↩↩↩↩↩↩↩↩↩↩↩↩↩↩↩↩↩↩↩↩↩
-
Registration Statement and JBGL Transaction Terms (Form S-1) — BioFuel Energy Corp. / SEC, 2014-06-10 ↩↩↩↩↩↩↩↩↩
-
Annual Report on Form 10-K for FY2016 — Green Brick Partners / SEC, 2017-03-10 ↩↩↩↩↩↩↩↩↩↩↩↩
-
Form 8-K on Completion of the JBGL Acquisition — Green Brick Partners / SEC, 2014-10-27 ↩↩↩↩↩
-
Green Brick Partners, Inc. Launches Trophy Signature Homes — GlobeNewswire, 2018-10-24 ↩↩↩
-
Annual Report on Form 10-K for FY2025 — Green Brick Partners / SEC, 2026-02-25 ↩↩↩↩
-
2026 Proxy Statement — Green Brick Partners / SEC, 2026-05-22 ↩↩↩↩↩↩↩
-
Co-CEO Appointment, Form 8-K — Green Brick Partners / SEC, 2026-07-30 ↩↩
-
Annual Meeting Voting Results, Form 8-K — Green Brick Partners / SEC, 2026-07-01 ↩
-
Green Brick Partners Competitors and Alternatives — MarketBeat, 2026-10-26 ↩
 LinkedIn
 WhatsApp
 Reddit
 Hacker News
 Email
 Kindle
 RSS Feed
 Spotify
 Apple Podcasts
 Amazon Music
 Audible
 YouTube