H.B. Fuller: The Glue Company That Became a Bet on Oil Prices, Then on Wound Closure
I. Introduction & Episode Roadmap
Pick up a disposable diaper and pull it apart. Under the soft outer layer, thin lines of hot-melt adhesive hold the absorbent core in place, keep the elastic stretched where it should be, and stop the whole thing coming apart when a toddler starts crawling. Now pick up a cereal box. The flaps that close at the factory and tear open at your breakfast table are held by a dab of glue that was put down in a fraction of a second on a packaging line. Then pick up your phone. Inside, a few milligrams of engineered adhesive keep the display, the battery and the frame together, and stop them rattling when the phone falls.
None of these products carries a brand on its glue. There is a decent chance that much of it came from a company in St. Paul, Minnesota, that most consumers have never heard of.
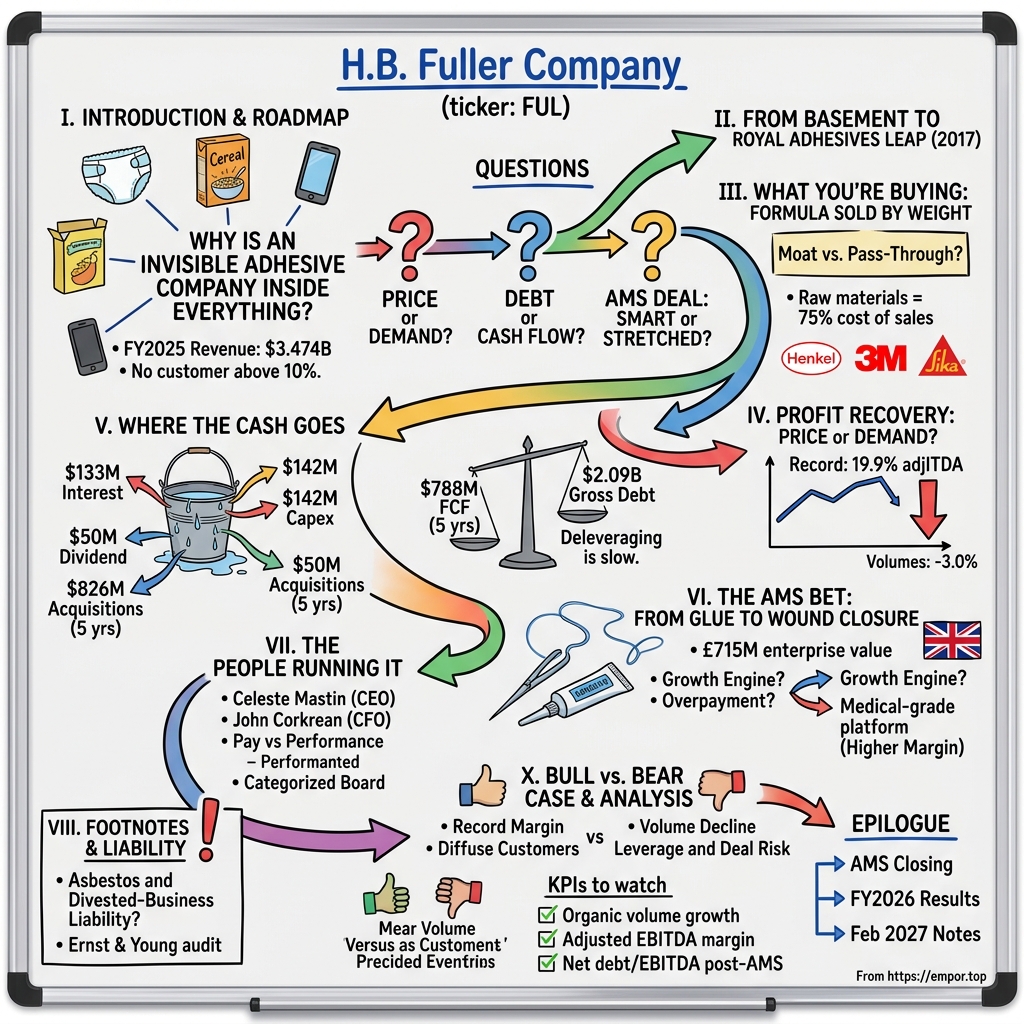
That company is H.B. Fuller. In fiscal 2025 it sold $3.474 billion of adhesives, sealants and coatings, employed about 7,100 people in 44 countries, and had no single customer accounting for even a tenth of its revenue.1 Those three facts already sketch the story. The company is big enough to matter and spread thin enough that no buyer can bully it. And what it sells is invisible: a formulation sold by weight, judged by whether it holds, and noticed only when it fails.
That last point shapes everything that follows. A company like this cannot charge for a brand. It cannot run a television campaign for its hot melts. Whatever pricing power it has comes from chemistry, service and the cost and risk of switching. Whatever value it creates for shareholders shows up in two places: the margin it keeps after passing through oil-derived raw materials, and the cash it turns that margin into. This is not a story about a logo. It is a story about pricing and cash.
The ownership is as diffuse as the customer base. There is no founding family in control, no private-equity sponsor and no parent. The three biggest holders are index giants: BlackRock with 14.29%, Vanguard with 11.92% and State Street with 5.48%.2 Together they own almost a third of the company, and none of them is going to show up at a plant in Germany to ask about volume. That puts the job of asking hard questions onto the reader.
So here are the questions this episode will try to answer.
First, H.B. Fuller has just reported record margins. Is that recovery real, or is it price rather than demand? Second, the company carries about $2 billion of debt and has agreed to buy a British medical-adhesives maker. Can its free cash flow carry both? Third, is that deal, the takeover of Advanced Medical Solutions (AMS), a growth engine or an expensive bet? Fourth, beneath all of it: does H.B. Fuller have a moat, or is it a well-run pass-through for petrochemical costs with a margin bolted on? And fifth, a smaller but stubborn question in the footnotes: how large is the asbestos and divested-business liability the company keeps paying for?
The road runs from a 19th-century glue shop, through a debt-financed leap in 2017 that still defines the balance sheet, into the economics of selling chemistry by the kilogram, and then into the cash flow statement, where the real arguments happen. It ends with surgical glue, because the company's next big bet is an adhesive that closes wounds instead of cereal boxes. That bet ties all five questions together.
To understand why a quiet glue maker now carries this much debt, the story has to start with the deal that changed its size.
 Subscribe on LinkedIn
II. From a 1887 Basement to the Royal Adhesives Leap
A wallpaper paste and a long, quiet century
In 1887 Harvey Benjamin Fuller started making flour-based paste in St. Paul.3 It was the kind of business that thousands of small American towns had: a practical man mixing a practical product for local trade, in this case wallpaper hangers and printers. What made this one unusual is that it survived. Over the following century the company moved from paste to industrial adhesives, from Minnesota to the world, and from family control to the public markets.
For an investor, the origin story matters for one reason. H.B. Fuller is a long-lived, family-founded industrial that is now fully institutional. Its culture was built on application engineering, on solving a specific customer's specific bonding problem, rather than on scale. That habit is still the company's sales pitch. But the modern balance sheet was built by a very different kind of decision.
The leap
By the mid-2010s H.B. Fuller was a steady, unspectacular grower. Revenue went from about $2.1 billion in fiscal 2014 to about $2.3 billion in fiscal 2017.4 That is a mid-single-digit pace over the long run, the kind of growth that comes from a mix of inflation, modest share gains and small deals.
Then, in 2017, the company bought Royal Adhesives & Sealants, a private American rival with strong positions in industrial and construction adhesives. Acquisition spending in that fiscal year came to about $1.75 billion.4 H.B. Fuller did not have that kind of cash. It borrowed it, through term loans and notes that still sit on the balance sheet in refinanced form today.
The effect on the top line was immediate. Revenue jumped from about $2.3 billion in fiscal 2017 to about $3.0 billion in fiscal 2018.4 Overnight, H.B. Fuller became a bigger, more industrial company with more exposure to engineering and construction customers.
Better, or just bigger?
Here is the uncomfortable part. Since fiscal 2018, revenue has grown about 1.9% a year, from $3.041 billion to $3.474 billion in fiscal 2025.41 Over the full span from fiscal 2014, including the acquired revenue, growth was about 4.7% a year. Take out the Royal step and the business underneath grew roughly at the pace of inflation.
That tells you what the 2017 deal was and was not. It bought scale, a broader product line and more industrial exposure. It did not buy a faster-growing company. The deal explains the debt, the interest bill and the large amortisation line that now separates H.B. Fuller's reported profit from its cash earnings. It does not explain any acceleration, because there wasn't one.
How should an investor judge whether the price was right? The cleanest test is return on the capital the company now employs. H.B. Fuller's own executive incentive plan provides one: performance share units for fiscal 2023 to 2025 vested at 80% of target on a return on invested capital of 9.5%.2 That is the company's chosen measure, under its own definition, and it lands in the high single digits.
Set that against the cost of the debt used to buy Royal. The Term Loan B carried an interest rate of about 5.67% at the end of fiscal 2025, and the fixed notes carry 4.00% and 4.25% coupons.1 After tax, the debt is cheap relative to a 9.5% return. Against a full cost of capital that includes equity, which for a cyclical, leveraged industrial is plausibly in the high single digits, a 9.5% return is close to break-even. The deal did not destroy value on this evidence. It also has not visibly created much.
Benchmarking the price against comparable deals is harder than it sounds. The obvious comparison is Arkema's 2015 purchase of Bostik's peer business and the trading multiples of RPM, Sika and Henkel at the time, but H.B. Fuller did not publish Royal's EBITDA at signing in a form that makes a clean multiple easy. The better test is the one above: eight years later, the combined company earns a single-digit return.
The smaller deals
Royal was the big bet, but it was not the last one. Acquisition spending ran at $251 million, $205 million, $273 million and $92 million across fiscal 2022 to 2025.41 The names include ND Industries, a maker of pre-applied thread-locking adhesives for fasteners; GEM, a Japanese adhesives business; HS Butyl, a UK maker of butyl tapes for construction; and the ADCO and China adhesives units.1 Each is a bolt-on, adding product lines or geography to a segment.
Together they total more than $800 million over four years. That is a lot of capital for a company whose revenue fell over the same stretch, and it means part of the reported revenue in recent years was bought rather than grown. The company has not reported impairments of these bolt-ons as a headline item in recent annual results, which suggests none has gone badly wrong. But a deal that avoids impairment is not the same as a deal that earns its cost of capital. The 9.5% ROIC sits across all of them.
The verdict on the acquisitive era is measured. Management turned H.B. Fuller into a larger and more diversified company. It did not turn it into a faster-growing one, and the returns on all that capital are adequate rather than impressive. That matters because the AMS deal asks investors to trust the same team's judgement once more.
To judge whether that trust is warranted, it helps to understand what H.B. Fuller actually sells, and why customers pay for it.
III. What You're Actually Buying: A Formula Sold by Weight
The moment of truth in a procurement office
Picture a procurement manager at a diaper maker in Ohio or a window-frame producer in Poland. Raw-material costs are up. Her CFO wants savings. A competing adhesive supplier has offered a hot melt at a lower price per kilogram. What happens next is the entire moat question in miniature.
She cannot simply swap glue. A new adhesive must be tested on her lines, at her speeds and temperatures, against her substrates. It must survive her customer's quality checks. If it fails, the cost is not the price of the glue. It is a recall, a line shutdown, a lost retail contract or, for a window, a seal that fails in a winter storm. The adhesive is a tiny share of her product's cost and a large share of its risk.
That asymmetry is the heart of H.B. Fuller's business. It explains why customers stay. It also explains the limit of the moat: if the competitor's product is qualified, or if she already buys from two suppliers, the switch is easy and the price war begins.
Three segments
Since fiscal 2025 the company has reported three segments: Hygiene, Health and Consumable Adhesives; Engineering Adhesives; and Building Adhesive Solutions.1
Hygiene, Health and Consumable is the diaper and cereal-box business: adhesives for nonwovens, packaging, labels, tapes and medical products. Volumes are steady and tied to everyday consumption, but the products face the most direct price comparison.
Engineering Adhesives serves electronics, automotive, appliances, aerospace, solar and industrial assembly. The phone in your pocket lives here. So do the fastener adhesives that came with ND Industries. This is where formulation matters most, because each application has its own requirements for heat, flexibility and durability.
Building Adhesive Solutions serves construction: roofing, flooring, insulated glass, sealants, and the butyl tapes that came with HS Butyl. It tracks the housing and construction cycle.
The margins tell you which segment carries the value. In the third quarter of fiscal 2026, Engineering's adjusted EBITDA margin was 23.8%, Building's was 18.2%, and Hygiene, Health and Consumable's was 17.6%.5 Engineering earns the most per dollar of sales because its customers are buying a specific solution, not a commodity, and because the cost of failure in a car or a phone is so high. That is the segment closest to a genuine moat.
The raw-material reality
Now the less flattering part. Raw materials make up about 75% of H.B. Fuller's cost of sales, and most are derived from petroleum and natural gas.1 The company itself calculates that a 1% move in raw-material costs changes net income by about $12.6 million, or about $0.23 a share.1
Put that in perspective. Net income in fiscal 2025 was $152 million.1 A 10% swing in input costs, which is not unusual in a bad year for oil or resins, would move net income by more than $120 million before any price response. Almost the whole year's profit depends on the company's ability to pass costs on, and on how fast it does so.
That is the deep structure of this business. H.B. Fuller adds formulation and service on top of a commodity input. When prices of inputs rise, it must chase them with price increases, and there is a lag. When input prices fall, customers press for cuts, and the company tries to hold price long enough to rebuild margin. Profits swing on that lag more than on volume.
Who else is on the field
The adhesives industry is fragmented. Henkel is the global scale leader, with an adhesive technologies business several times H.B. Fuller's size. Sika dominates construction chemicals and is a strong rival in building. Arkema owns Bostik, a major competitor across industrial and construction markets. And 3M, Avery Dennison and Dow play in adjacent niches such as tapes, labels and the raw polymers themselves. H.B. Fuller is a strong mid-sized player, large enough to serve global customers, much smaller than Henkel.
How does it win? Application engineers who work on the customer's line. Speed in tailoring a formulation. A manufacturing footprint across 34 countries of operation, which lets it serve a multinational in several regions.1 And a customer list long enough that no single buyer can hold it hostage.1
How does it lose? An oil spike that it cannot pass on fast enough. Tariffs that change the cost of imported inputs or finished goods. And large customers who deliberately qualify two or three suppliers so they can play them off against each other.
Arguing the moat, once
Take Porter's five forces in turn.
Buyer power is moderate. No customer exceeds 10% of revenue, which limits any one buyer's leverage.1 But big hygiene and packaging companies buy in volume and run formal procurement, and they can multi-source.
Supplier power is high. H.B. Fuller buys commodity chemicals from petrochemical giants that set prices by global markets. It has little influence over them. This is the single most important force against the company.
Threat of substitutes is low to moderate. Mechanical fastening (screws, rivets, welds) is the main alternative, and in many applications, such as lightweight electronics and modern vehicles, adhesives are replacing fasteners rather than the reverse. New bonding chemistries are a threat only if a rival owns them.
Threat of new entrants is low at global scale. Building a qualified product line, a global plant network and the application-engineering bench takes decades. Local formulators do compete at the low end.
Rivalry is real. Henkel, Sika and Bostik compete hard on the same accounts.
Now Hamilton Helmer's 7 Powers. Switching costs are the clearest power: re-qualification risk keeps customers in place, though the company does not disclose contract lengths, minimum volumes or retention rates, so the evidence is indirect. Process power, the tacit know-how of formulating for thousands of applications, is plausible and shows up in the Engineering margin. Scale economies are modest; H.B. Fuller is smaller than Henkel, so scale is a defence against small rivals, not an edge over the leader. There is no network effect, no brand power with end consumers, and no cornered resource.
The falsification test
If H.B. Fuller had strong pricing power independent of inputs, its revenue would hold up when input costs eased. History says otherwise. Revenue peaked at $3.749 billion in fiscal 2022, when raw-material inflation was passed through as price, and then fell to $3.511 billion in fiscal 2023.4 Part of that drop was weaker volume and part was price giving back as inputs fell.
Against that, the margin story is more encouraging. Net income fell less sharply than the fall in input costs would have permitted if customers had squeezed the company hard, and margins have since reached records. The company kept a good part of the spread.
The verdict: the moat is real but narrower than the margin suggests. It is a switching-cost and know-how moat that protects margin percentage over a cycle. It is not a pricing moat that lets the company grow revenue independent of oil. Engineering is where it is deepest; Hygiene is where it is thinnest.
That distinction is exactly what matters for reading the latest results.
IV. The Profit Recovery: Price or Demand?
A record on a falling volume line
On 23 September 2026 H.B. Fuller reported its third quarter of fiscal 2026. Adjusted EBITDA margin was 19.9%, a record for the company.5 Revenue was $938 million, up 5.2% on the year before, and organic revenue rose 4.4%.5 Adjusted earnings per share rose about 21%.5 By the usual standards of a mid-cap industrial, that is a strong print.
Then look at what drove the revenue. Price and mix added 7.4%. Currency added 0.7%. Acquisitions added 0.1%. Volume subtracted 3.0%.5
That is the whole debate in four numbers. The company sold less product, by weight, than a year earlier. It charged meaningfully more for what it sold. Revenue rose, and margin rose faster.
Walking the revenue line
The longer trend makes the same point. Revenue went from $3.749 billion in fiscal 2022 down to $3.474 billion in fiscal 2025, a decline of 2.7% in the last of those years alone.41 Net income over the same years ran from $180 million at the peak, down to $130 million in fiscal 2024, and back to $152 million in fiscal 2025.41
So the company has spent three years with a shrinking top line and a recovering bottom line. In the first nine months of fiscal 2026 revenue rose 3.1% to $2.659 billion, and earnings per share reached $3.05 against $2.21 a year earlier.6 The profit recovery is now visible in reported, not only adjusted, numbers.
What "price/mix" hides
"Price/mix" is one line that combines two very different things. Price is what the company charges for the same product. Mix is the shift toward higher-value products and segments: selling more electronics adhesives and fewer commodity packaging glues, for example.
Mix improvement is the good kind of revenue growth. It suggests the company is moving up the value chain. Price that simply recovers a higher raw-material bill is neutral at best: it protects margin but does not prove that customers value the product more.
H.B. Fuller does not split price from mix in its quarterly bridge, and it does not separate raw-material pass-through from genuine price realisation. That is a meaningful gap in disclosure. Without it, investors cannot tell how much of the 7.4% is durable.
There are clues. The margin expansion is too large to be pure pass-through, which would hold margin percentage roughly flat rather than lift it to a record. Some of the gain is the company holding price as certain inputs eased, which is real profit but tends to be competed away over time. Some is mix toward Engineering. Some is cost-cutting.
The restructuring lever
That cost-cutting is a formal programme. H.B. Fuller expects total restructuring costs of $45 million to $50 million, and had recorded $3.8 million of that in the first nine months of fiscal 2026.6 Most of the programme's cost is therefore still ahead, which suggests most of its savings are too.
Is it a margin driver or noise? The scale suggests a real but moderate driver. A programme costing about $50 million in a company with adjusted EBITDA guidance of $655 million to $670 million is meaningful; if it pays back in a few years, as most industrial restructurings aim to, it could add a point or so of margin.5 But it is a one-time lever. Once plants are consolidated, the savings are banked and cannot be repeated.
What management says, and how it has changed
In the third-quarter results, management guided to fiscal 2026 adjusted earnings per share of $4.70 to $4.85 and adjusted EBITDA of $655 million to $670 million.5 The tone was confident about margin and cautious about end markets.
The pattern across recent years is that management has consistently framed volume weakness as a function of soft markets, particularly construction and some industrial segments, rather than share loss, and has pointed to margin as the proof of strategy. That framing may be correct. But it has been the framing for several years now, through a peak in fiscal 2022, a decline in fiscal 2023 and a soft fiscal 2025. At some point the "markets are soft" explanation must be tested by a period in which markets recover. If they do and volume still lags, the answer changes.
On guidance discipline, the record is mixed but not alarming. The company has reached its adjusted EBITDA targets more reliably than its revenue targets, which is consistent with a management team that controls cost and price well and controls demand not at all.
The verdict
The profit is real. Margin and cash both rose, so this is not an accounting illusion. But it comes from price, mix and cost, not units. It is not yet evidence of demand.
The single fact that would settle it is volume turning positive while adjusted EBITDA margin holds near or above 20%. If that happens, the company has shown that it can grow and keep its spread. If volume keeps falling while price does the work, the margin is borrowed from the next downturn.
A margin, though, is only as good as the cash it produces, and the cash is where the balance sheet starts to bite.
V. Where the Cash Goes
A CFO's arithmetic
Imagine CFO John Corkrean at the end of fiscal 2025, looking at one page. Operating cash flow: $263 million. Capital expenditure: $142 million. Dividends: about $50 million. Interest expense, already deducted above but present in every conversation: about $133 million.14 What is left for paying down debt? Very little.
That is the cash story in one picture. H.B. Fuller generates meaningful cash. It also commits most of it before deleveraging begins.
Profit into cash
Over fiscal 2021 to 2025, H.B. Fuller reported $769 million of net income and $1.414 billion of operating cash flow.41 Cash beat profit by about $645 million, a large and consistent gap.
The main reason is non-cash charges. Depreciation and amortisation totalled about $803 million over those five years, much of it amortisation of the intangible assets bought with Royal and the bolt-ons.4 Amortisation reduces reported profit without costing cash, so a company with large acquired intangibles will always look better on a cash basis.
Working capital adds noise. In fiscal 2021, as raw-material prices surged, inventory and receivables absorbed about $212 million. In fiscal 2023, as prices eased, about $123 million was released, flattering that year's cash.4 In the first nine months of fiscal 2026, receivables fell by $79 million, inventory rose by $106 million and payables rose by $94 million.6 The inventory build and payables stretch largely offset each other, which helped nine-month operating cash flow rise 17% to $183 million.6 Full-year guidance is for $300 million to $325 million.5
Where five years of cash went
Subtract capex from operating cash flow and the five-year free cash flow is about $788 million.4 Over the same period about $215 million went to dividends.4 Over fiscal 2022 to 2025, about $826 million went to acquisitions and about $107 million to buybacks.4
Add those up and the uses exceed the free cash flow. The gap was funded by debt and modest cash drawdowns. In other words, H.B. Fuller spent the last five years buying growth with borrowed money while its own business shrank slightly. That is not reckless, but it is not deleveraging either.
Rising capex
Capex has risen sharply as a share of revenue: from about 2.1% in fiscal 2019, to about 4.1% in fiscal 2025, and about 5.3% in the first nine months of fiscal 2026.416 Research and development has stayed near 1.4% of revenue.4
Management has tied the higher capex to plant consolidation, automation and capacity in higher-growth areas, which links it to the restructuring programme. If it is cost-saving, it should show up in margin and later fall back. If it is capacity for growth, it should show up in volume. Volume, so far, has not risen. The capex is a bet that has yet to be paid out in units.
The debt stack
At the end of fiscal 2025, H.B. Fuller owed about $2.09 billion: a $500 million Term Loan A, a $994 million Term Loan B priced at SOFR plus 1.75%, $300 million of 4.00% notes due February 2027 and $300 million of 4.25% notes due October 2028.1 Interest expense was about $133 million against operating income of about $399 million, cover of roughly three times.1
In July 2026 the company amended its credit agreement. The Term Loan A was refinanced at $420 million, the revolving credit facility was increased from $700 million to $800 million, both now mature on 17 July 2031, and borrowing margins were cut by 25 basis points.7 At the same time the company terminated a Goldman Sachs bridge facility of up to $2.086 billion that it had arranged for the AMS deal, without drawing on it.7
The third-quarter 10-Q describes the financing arrangements for AMS as reaching "up to $3.0 billion", a figure larger than the terminated bridge.6 The likeliest reading is that the larger figure describes the total committed capacity across the amended facilities, including the revolver and existing loans, rather than new borrowing. Either way, the AMS purchase will be funded with debt, and the company has not yet issued new long-term bonds for it.
At August 2026, net debt was $1.957 billion and net debt to adjusted EBITDA was 3.0 times, down from 3.3 times a year earlier.5 That improvement is real, and it came mostly from higher EBITDA, not lower debt.
The credit lens
H.B. Fuller is rated by Moody's and S&P in the speculative-grade range, consistent with a leveraged industrial at about three times EBITDA.8 The rating agencies' central concern for any company in this position is straightforward: a large debt-funded acquisition will push leverage back up, and the agencies will want to see a path back down within a couple of years.
Discipline or mixed signals?
In the first nine months of fiscal 2026, H.B. Fuller repurchased $48.9 million of its own stock, about 356,000 shares, while leverage sat at 3.0 times and a large acquisition was pending.6 Shares outstanding fell only from 54.17 million to 53.82 million.6
There is a defensible argument for this: modest buybacks offset dilution from employee stock awards, and the amount is small relative to the debt. There is also a sharper argument against: every dollar spent on buybacks is a dollar not used to pay down debt before a debt-funded deal. A management team that wants the market to trust its leverage target should be seen prioritising it.
The verdict: cash earnings run well above reported profit because of amortisation. But capex and interest absorb most of the cash, deleveraging is slow, and the buffer for AMS is thin. The balance sheet can carry the deal; it cannot carry a bad year at the same time.
That makes the price paid for AMS a central question, not a side detail.
VI. The AMS Bet: From Glue to Wound Closure
A vote in August
On 12 August 2026, shareholders of Advanced Medical Solutions, a British company that makes surgical tissue adhesives, sutures and wound-care products, voted to accept H.B. Fuller's offer.6 The offer was 285 pence a share in cash, valuing AMS's equity at about £659 million and its enterprise value at about £715 million.9 The premium was reported at 34.8% to AMS's undisturbed share price.10 Completion is expected by the end of 2026.9
For a company that made its name with diaper glue and cereal-box hot melts, it is a striking move. AMS's products close surgical incisions, seal skin and dress wounds. The customers are hospitals and surgeons, not factory managers, and the gatekeepers are regulators, not procurement teams.
Why now
The strategic logic, as management presents it, is mix. The Hygiene, Health and Consumable segment has the lowest margin of the three.5 Medical adhesives are a higher-value niche within it, protected by regulatory approvals and clinical acceptance. Owning AMS gives H.B. Fuller a medical-grade platform, regulatory know-how and a portfolio of approved products.
The size matters too. AMS is small next to H.B. Fuller's $3.5 billion of revenue. This is not a bet on scale, as Royal was. It is a bet on mix and margin: a small, premium business that could lift the average if it grows.
The price
The key question is what H.B. Fuller paid per dollar of AMS's earnings. AMS's annual revenue in recent years has been in the low hundreds of millions of pounds, which puts the £715 million enterprise value at several times sales. On EBITDA, the deal implies a mid-to-high-teens multiple on AMS's pre-synergy profit.9 That is a premium price, well above where H.B. Fuller itself trades on the market's implied valuation, and above the typical price for an industrial adhesives deal.
Medical-technology deals routinely command higher multiples than industrial deals because their earnings are seen as more stable and their growth more durable. But the comparison investors should make is with H.B. Fuller's own cost of capital and with the Royal record. Paying a high multiple for a business means the return on the purchase price starts low and must be built up by growth and synergy.
Testing the synergy claim
H.B. Fuller has targeted $55 million of run-rate synergies by 2031.10 Set that against AMS's own profit base. If AMS earns EBITDA in the region of tens of millions of pounds, then $55 million of synergies would add a large fraction of the target's profit. That is ambitious.
Synergies of this kind usually come from three sources: cost savings (shared procurement, plants and overhead), revenue cross-selling (H.B. Fuller's medical adhesives through AMS's hospital channel, AMS's products through H.B. Fuller's global sales force) and raw-material purchasing scale. Cost synergies are usually more reliable. Revenue synergies are often promised and rarely delivered in full. The company has not split the $55 million between the two in detail. That split matters, because the more of it relies on cross-selling, the more it should be discounted.
The timeline also matters. Five years is a long runway. Synergies promised for 2031 will be measured against a company and a market that will have changed a lot by then.
A hedge, not a profit
In the third quarter of fiscal 2026, H.B. Fuller recorded a $19.7 million unrealised gain on a forward contract it bought to lock in the dollar cost of the sterling purchase price.6 Because the price is fixed in pounds and H.B. Fuller reports in dollars, a move in the exchange rate changes what the deal costs. The forward contract offsets that.
The gain is not earnings from the business. It reflects sterling's move against the dollar since the hedge was placed. If the pound weakens before closing, the gain shrinks or reverses. When the deal closes, the gain or loss effectively adjusts the purchase price. Investors should strip it out of any reading of operating performance.
Approval is not commercialisation
The medical opportunity carries a trap that industrial companies sometimes fall into. Regulatory approvals, clinical evidence and product launches are milestones, not revenue. Selling into hospitals requires relationships with surgeons and procurement committees, reimbursement and a sales force that understands clinical settings. That is a different discipline from selling hot melts to a factory.
AMS has been building that capability for years, which is part of what H.B. Fuller is buying. But the claim that H.B. Fuller can scale AMS's medical business faster than AMS could on its own is unproven. The evidence will be AMS's growth rate and margin in the first two years of ownership.
The track record test
The closest evidence of management's judgement on a large deal is Royal Adhesives. That deal bought scale and produced a company with a 9.5% ROIC and roughly 2% annual organic growth since.24 It did not destroy value, but it also did not create much.
AMS is a different kind of bet: smaller, higher-margin and more strategic. But it is again being bought at a meaningful premium, with debt, by the same company and much of the same leadership team culture. The history narrows the claim. AMS is a coherent strategic move, but its returns are unproven, and the price makes the hurdle high.
The verdict: strategically coherent, priced richly, and too small to transform the group on its own. The deal will be judged on two numbers: AMS's revenue growth under H.B. Fuller ownership, and the share of the $55 million that actually arrives.
The people making these calls are the next part of the story.
VII. The People Running It
The CEO who inherited the hangover
Celeste Mastin became chief executive in 2022, at almost exactly the moment H.B. Fuller's revenue peaked.1 She came from the chemical industry, with a background in operations and commercial leadership rather than finance, and she inherited a company that had just enjoyed a pricing windfall and was about to see volume soften.
Her years in charge have been defined by a consistent message: margin over volume, portfolio simplification, operational efficiency. The segment reorganisation into three businesses, the restructuring programme, the bolt-on acquisitions and now AMS all follow that line. Whatever investors think of the results, the strategy has been coherent.
John Corkrean, the CFO, has been the steady hand on the balance sheet, overseeing the refinancings and the leverage target.1 His job in the next two years will be harder than in the last two: financing AMS without letting leverage drift too far above three times.
What they are paid for
In the 2026 proxy, Mastin's reported compensation was about $8.8 million, up about 13% on the prior year, and the ratio of her pay to the median employee's was about 137 to 1.2 The short-term incentive paid out at 99% of target for fiscal 2025, and the fiscal 2023 to 2025 performance share units vested at 80% on that 9.5% ROIC.2 Shareholders approved the pay plan with about 97% support in both 2024 and 2025.2
The structure is conventional: an annual bonus tied mostly to EBITDA and cash or revenue targets, and long-term share awards tied to ROIC and revenue growth.
The incentives are mixed. The PSU payout shows some linkage: when returns were soft, the long-term award paid out below target. The 99% short-term incentive in a year when revenue fell 2.7% is more generous. It reflects targets set around margin and EBITDA rather than growth. Pay rose 13% in a year when revenue fell and net income rose about 17%. Whether that is fair depends on whether the board was paying for margin, which improved, or growth, which did not.
Skin in the game
Directors and executive officers together own about 1.83% of the company.2 That is a meaningful sum in dollar terms but not a large stake. Management's wealth is more tied to its pay than to the share price over a long horizon.
The board
The board has nine directors, about 89% of whom are independent, and it is classified, meaning directors are elected in three staggered classes rather than all at once.2 A classified board makes it harder for shareholders to replace a majority quickly. Many governance advocates oppose it, and it is one of the first things an activist would target.
Capital allocation against promises
Management has said leverage reduction is a priority. Leverage has fallen, from 3.3 to 3.0 times, mostly through EBITDA growth.5 At the same time the company has bought back stock and committed to a large debt-funded acquisition. The record is consistent with a team that wants to do everything at once: reduce leverage slowly, return some cash, and keep acquiring. That works only if EBITDA keeps growing.
The investor-day targets of earlier years set ambitions for organic growth and margin. Margins have broadly arrived; organic volume growth has not. That pattern runs through every section of this story.
What an activist would say
No activist has publicly targeted H.B. Fuller. But one would not have to look far for a script. Leverage of three times. A ROIC in the single digits after eight years of acquisitions. A classified board. Organic volume shrinking. A new premium-priced acquisition. Buybacks while borrowing.
The activist's pitch would be simple: declassify the board, stop buying companies until the ROIC on existing ones rises, and use cash to pay down debt. Management's answer would be that the margin record shows the strategy is working and AMS is the next step. The answer will be judged on whether volume turns.
The final piece of the risk picture sits in a place most investors never read.
VIII. The Liability in the Footnotes
Claims that outlive a business
Somewhere in the long middle of H.B. Fuller's annual report is a short line about charges for "ongoing litigation and product claims related to a divested business".1 It does not jump out. It should not be skipped.
How can a company still pay for a business it sold? Liability for a product follows the company that made it, at the time it was made, regardless of who owns the business later. If a product contained asbestos decades ago, and someone who was exposed develops an illness today, the claim can be brought against the original maker. Selling the unit does not end the exposure. In many deals, the seller keeps it.
H.B. Fuller has carried asbestos-related claims for many years, tied to products sold long ago. The company records charges as claims are settled or reserved, and offsets them with insurance recoveries where it has cover.1 In its results narrative the company folds these charges into a single line of adjustments rather than presenting them as a prominent item, and the third-quarter 10-Q reported no material development.6
The verdict is that this is a long-tailed, manageable liability rather than an existential one. It has been present for decades without threatening the company. But it is open-ended, it does not go away, and its size depends on insurance recovery that could shrink over time. Investors should check the commitments and contingencies note each year for the accrual and the claim trend, because that is where any change will show first.
Environmental
H.B. Fuller expects to spend about $2.6 million on environmental compliance over two years, and about $22.6 million on environmental-related spending in total.1 Against a company of this size that is small.
The auditor
Ernst & Young LLP audits H.B. Fuller.1 For a company with this many acquisitions, the auditor's critical audit matters typically centre on the valuation of acquired intangible assets and goodwill impairment testing, which are judgement-heavy areas. H.B. Fuller has not reported a material weakness in internal controls in its recent annual filings.1
Receivables and currency
Trade receivables were $648 million at August 2026, with an allowance for doubtful accounts of $13.3 million, about 2.0%.6 For a company with thousands of industrial customers, that is unremarkable.
Currency matters more. Operating in 34 countries means exchange rates move reported results each year: the effect on cash was about +$14.5 million in fiscal 2025 and about −$23.4 million in fiscal 2022.41 The company uses cross-currency swaps, net-investment hedges and forwards to dampen the swings.1 Neither receivables nor currency is a major risk.
With the risks laid out, what has this company taught?
IX. Playbook: Business & Investing Lessons
Lesson one: price is cost recovery until volume proves otherwise
The third-quarter bridge, with price and mix up 7.4% and volume down 3.0%, is the clearest teaching moment in the whole story.5 A record margin built on falling units is a skill, not a franchise. It shows a management team that can hold price against suppliers and customers at the same time. It does not show customers buying more of the product.
The wider lesson for any investor looking at a commodity-linked manufacturer: separate price from volume before celebrating a margin. In a business whose inputs follow oil, every margin is borrowed from the next raw-material cycle until units confirm it.
In a glue business, price is a cost recovery until volume proves it isn't.
Lesson two: big deals buy scale; only returns tell you whether they bought value
Royal Adhesives turned a $2.3 billion company into a $3 billion one overnight.4 It looked like a transformation. Eight years later, the evidence is a 9.5% return on invested capital and organic growth of about 2% a year.24
That is the lesson for founders and boards: the press release measures the size of a deal, but only the return on capital measures its quality. A bigger company is not the same thing as a better one.
Royal bought H.B. Fuller its size; it is still paying for whether it bought value.
Lesson three: when amortisation is large, profit and cash are different animals
Over five years, H.B. Fuller reported $769 million of net income and generated $1.414 billion of operating cash.4 Reading only the income statement, a skeptic would think the company was barely earning its keep. Reading only operating cash, an optimist would think it was swimming in money. Neither is right. The truth sits after capex and interest, where the free cash is modest.
Amortisation makes the profit look smaller than it is, and capex and interest make the cash smaller than it looks.
Lesson four: the footnote you skip is the one that lasts
The divested-business claims are a single line in a long annual report. They have outlived the businesses that created them, several management teams and many strategic plans. Liabilities attached to old products do not care about new strategies.
A company can sell a business; it cannot sell its history.
Lesson five: refinancing buys time, not growth
The July 2026 amendment pushed maturities to 2031 and lowered borrowing costs.7 That is good treasury work. But the refinancing changed when the debt is due, not whether the business can grow into it. Time is valuable only if it is used.
A longer maturity is a gift of time, and time is only worth what volume does with it.
Those lessons set the stakes for the real debate.
X. Analysis & Bull vs. Bear Case
Two analysts, one release
Two analysts read the same third-quarter release on the same morning. One underlines the 19.9% adjusted EBITDA margin, the 21% rise in adjusted earnings per share and the 17% rise in operating cash flow.56 The other underlines the 3.0% fall in volume and a leverage ratio of 3.0 times on the eve of a debt-funded deal.5 Both are right. The question is which set of facts will dominate the next two years.
The bull case
The bull sees a company that has learned to earn more per kilogram. Margins are at records, and the Engineering segment, at nearly 24%, shows what the business can earn when formulation matters most.5 Cash flow is rising. Maturities have been pushed to 2031 at lower margins.7 Customers are diffuse, so no buyer can crush pricing. And AMS adds a higher-margin, medical platform with regulatory barriers that industrial competitors cannot easily match.
In the bull's world, volume returns as construction and industrial markets recover, the restructuring delivers its savings, AMS grows and delivers synergies, and leverage falls back toward the low two-times range. Operating leverage on recovering volume would then push earnings well beyond the fiscal 2026 guidance of $4.70 to $4.85 a share.5
The bear case
The bear sees a company that has lived on price for four years. Revenue is below its fiscal 2022 peak.41 Volume is falling. Free cash flow in fiscal 2025 was only about $121 million against interest of about $133 million.14 Leverage is three times and will rise when AMS closes. The AMS price is high, the synergy target ambitious and the commercialisation risk real. Input costs are oil-linked and tariffs are unpredictable. And the asbestos liability is an open-ended drag.
In the bear's world, the margin peaks as input costs rise or competitors chase share, volume keeps sliding, AMS disappoints, and the company is left with higher debt and the same low-single-digit growth.
The material risks, with mechanisms
Oil-derived input spikes. A sharp rise in petrochemical prices hits costs within months, while price increases take longer to negotiate. Every 1% of raw-material inflation is worth about $12.6 million of net income before price responds.1
Housing and construction. Building Adhesive Solutions tracks construction activity. A slowdown in housing starts or commercial building reduces volume directly.
The February 2027 notes. The $300 million of 4.00% notes mature in four months.1 The company classes them as long-term because it has the capacity to refinance, which the larger revolver supports. But any refinancing will be at current market rates, higher than 4%, and it lands at the same time as AMS funding.
AMS integration. Medical-device integration involves regulatory compliance, quality systems and a hospital sales channel. Any disruption to AMS's customer relationships or product approvals would cost revenue fast.
Tariffs. Changes to trade policy can raise the cost of imported raw materials or affect customers' own export volumes.
The moat, revisited briefly
The moat analysis in Section III holds: switching costs and formulation know-how protect margin, especially in Engineering, while supplier power from petrochemical giants caps it. Against peers, H.B. Fuller is smaller than Henkel and less construction-focused than Sika, which leaves it a strong mid-sized specialist rather than a scale leader. AMS does not change that structure; it adds a small regulatory moat inside one segment.
The KPIs that matter
Three numbers will tell investors whether the bull or the bear is right.
Organic volume growth. The latest reading is −3.0% in the third quarter of fiscal 2026.5 It is the single most important number, because it answers whether customers are buying more.
Adjusted EBITDA margin. The latest reading is a record 19.9%, up on the year.5 It shows whether the company is holding its spread.
Net debt to adjusted EBITDA. The latest reading is 3.0 times, down from 3.3 times.5 After AMS closes, it will rise, and its path back down will show whether the cash flow can carry the deal.
Return on invested capital, last at 9.5% on the company's own measure, is a useful fourth check over a longer horizon.2
Valuation as data
At 31 May 2025, the market value of H.B. Fuller's shares held by non-affiliates was about $3.0 billion.1 Add net debt of nearly $2 billion and the enterprise value was around $5 billion. Against fiscal 2026 adjusted EBITDA guidance of $655 million to $670 million, that implies an enterprise value multiple in the high single digits, before any move in the share price since.5
That is a cheaper multiple than premium specialty-chemical peers such as Sika and Avery Dennison have commanded in recent years, and closer to Henkel and RPM. It appears to assume that H.B. Fuller remains a low-growth, cyclical specialist, with modest credit for margin improvement and little for AMS. If volume returns and AMS works, that assumption looks conservative. If neither happens, it looks fair.
The verdict: a credible margin-improvement story with a thin cash cushion. The case turns on volume and on AMS returns, not on price.
XI. Epilogue
Tonight, H.B. Fuller stands at a hinge. It has a record margin, a refinanced balance sheet, a signed acquisition and a volume line that keeps pointing down. The next twelve months will decide which of those facts defines the story.
The first moment comes at the end of 2026, when AMS is expected to close.9 That is when the leverage ratio jumps, when the forward-contract gain becomes part of the purchase price, and when H.B. Fuller becomes, for the first time, a medical-device company as well as an industrial one. The first full year of combined numbers, probably in fiscal 2027, will show whether AMS keeps growing under new ownership. If it does, the deal looks like a sensible step up the value chain. If AMS's growth slows as it is absorbed, the premium will look expensive very quickly.
The second moment is the fiscal 2026 annual report, due early next year. Management has guided to $300 million to $325 million of operating cash flow.5 Hitting the top of that range with capex near current levels would show the company can fund AMS and still deleverage. Missing it would mean the buffer is thinner than the margin suggests.
The third moment is a quarter that has not yet come: the first one in which volume turns positive. Every margin gain since 2022 has come with flat or falling units. A single quarter of positive volume with margins near 20% would do more for the bull case than any guidance raise. A run of more negative volume quarters would push the debate toward the bear.
The fourth moment is February 2027, when the $300 million of 4.00% notes fall due.1 A clean refinancing, perhaps rolled into an AMS-related bond issue, would confirm that credit markets trust the plan. A messy one, at a high rate or with tight terms, would be the first sign that the leverage is starting to cost something real.
Each outcome maps onto one of the central questions. Volume answers whether the profit is price or demand. Cash flow answers whether the balance sheet can carry the deal. AMS answers whether management has learned from Royal. And the footnotes will keep answering, quietly, whether the past stays manageable.
What remains is a single tension. H.B. Fuller has earned its margin through discipline and pricing skill. It has not yet shown it can grow. A company can keep a spread for years by being good at negotiation. It cannot compound without customers buying more of what it makes.
XII. Outro
Go back to the diaper, the cereal box and the phone. Nobody who uses them thinks about the glue. That is the point: an adhesive succeeds when it is forgotten, and a company that makes adhesives succeeds when its customers never have a reason to call.
Now H.B. Fuller is buying a company whose glue closes surgical wounds, where the stakes are not a box flap that pops open but a patient on an operating table. It is the most visible bet this invisible company has ever made.
For 139 years, H.B. Fuller's best work has been the work nobody sees. Its next chapter asks for something harder: a company whose best work is invisible has to make its returns visible.
References
-
H.B. Fuller Form 10-K FY2025 — SEC, 2026-01-22 ↩↩↩↩↩↩↩↩↩↩↩↩↩↩↩↩↩↩↩↩↩↩↩↩↩↩↩↩↩↩↩↩↩↩
-
H.B. Fuller 10-K filing list — SEC EDGAR ↩↩↩↩↩↩↩↩↩↩↩↩↩↩↩↩↩↩↩↩↩↩↩↩
-
H.B. Fuller Reports Third Quarter 2026 Results — H.B. Fuller Investor Relations, 2026-09-23 ↩↩↩↩↩↩↩↩↩↩↩↩↩↩↩↩↩↩↩↩↩
-
H.B. Fuller Form 10-Q for quarter ended 2026-08-29 — SEC ↩↩↩↩↩↩↩↩↩↩↩↩↩
-
H.B. Fuller Form 8-K (credit agreement Amendment No. 3) — SEC, 2026-07-20 ↩↩↩↩
-
AMS Rule 2.7 announcement — Advanced Medical Solutions, 2026-06 ↩↩↩↩
-
Advanced Medical Solutions recommends £659m cash offer from HB Fuller — The Business Desk, 2026-06 ↩↩
 LinkedIn
 WhatsApp
 Reddit
 Hacker News
 Email
Email Kindle
 RSS Feed
 Spotify
 Apple Podcasts
 Amazon Music
 Audible
 YouTube