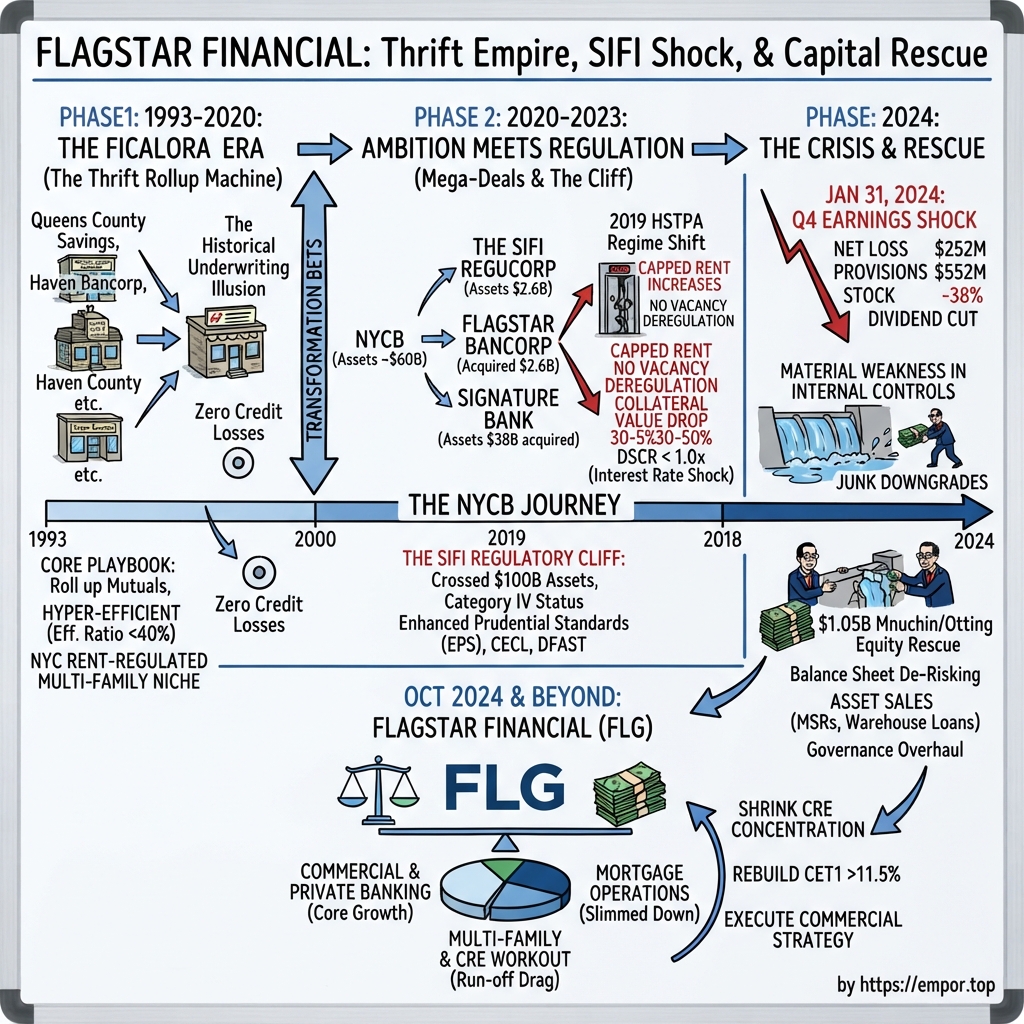
Flagstar Financial: From Thrift Empire to SIFI Shockwave and Capital Rescue
I. Introduction & Episode Roadmap
At 7:00 a.m. Eastern on Wednesday, January 31, 2024, New York Community Bancorp issued a press release headlined with record full-year results for 2023. The underlying financials revealed a sharp contraction: a fourth-quarter net loss of $252 million, driven by a provision for credit losses that jumped to $552 million from $62 million in the previous quarter. Concurrently, the board reduced the common dividend from $0.17 to $0.05 per share — a 70% cut for an institution that had maintained steady payouts for two decades and whose retail shareholder base relied on those dividend distributions.1
Market reaction was swift and negative. Shares of NYCB dropped 37.7% during that session, the largest single-day decline in the institution's public history, dragging down the KBW Regional Banking Index. Less than a year after Silicon Valley Bank collapsed due to unhedged interest rate risk on its bond portfolio, a suburban Long Island thrift with a historical record of minimal credit losses informed investors that it needed to build substantial reserves against commercial real estate and rent-regulated multi-family properties in Queens. Reuters reported the dividend reduction and net loss within the hour, and by the afternoon, trading desks were evaluating whether the liquidity strain could trigger a deposit run.2
The underlying crisis extended beyond a single adverse quarter. For nearly twenty-five years, NYCB operated a focused and cost-efficient business model: originating loans against rent-regulated multi-family residential buildings in New York City, maintaining low efficiency ratios, and reporting minimal net charge-offs. That strategy relied on structural mechanisms within New York State rent control laws. In June 2019, state legislative changes eliminated key provisions supporting property valuation growth, yet the bank continued its lending practices. NYCB subsequently completed two transformative acquisitions — Michigan-based Flagstar Bancorp and assets from the FDIC receivership of Signature Bank — pushing total assets past $100 billion. Crossing this threshold subjected the institution to Category IV regulatory standards and heightened supervision for which its risk management infrastructure was unprepared. Paired with a 525-basis-point rate hiking cycle by the Federal Reserve, these three distinct factors converged on the balance sheet.
The resulting liquidity and capital pressure led to a major recapitalization in March 2024: a $1.05 billion emergency private placement led by former Treasury Secretary Steven Mnuchin's Liberty Strategic Capital. Former Comptroller of the Currency Joseph Otting assumed the role of chief executive officer to oversee a restructuring that included winding down the mortgage originations and servicing division, executing a one-for-three reverse stock split, and rebranding the company in October 2024 from New York Community Bancorp to Flagstar Financial, Inc., trading on the NYSE under the ticker FLG.
By mid-2026, the bank operates with a restructured balance sheet and altered capital profile. As of June 30, 2026, Flagstar reported $87.7 billion in total assets, $61.0 billion in loan balances, and $67.5 billion in total deposits, supported by a Common Equity Tier 1 capital ratio of 13.16% — among the highest in its regional peer group. The institution recorded its third consecutive quarter of net profitability and authorized a $250 million share repurchase program.3 At the same time, operational headwinds remain evident: management lowered full-year 2026 earnings guidance three times over a six-month period, non-accrual loans totaled $2.8 billion, and the stock traded at approximately $14 per share relative to a tangible book value per share of $17.51. While balance sheet stabilization has been achieved, evaluating the long-term investment case requires examining the fundamental trade-off between equity valuation and credit risk normalization.
The analysis proceeds through the following sections: the mechanics of the original thrift business model; the 2019 rent regulation changes that impacted collateral valuations; the rapid asset expansion across regulatory thresholds; the January 2024 reporting detonation and internal control deficiencies; the Mnuchin-led recapitalization and its dilutive impact on common shareholders; the segment economics of the current operating model; a structural strategic assessment using Hamilton Helmer’s 7 Powers and Michael Porter’s Five Forces; broader implications for regional bank regulation; and an investment evaluation of the bank's forward equity value.
 Subscribe on LinkedIn
II. The Ficalora Era: The Serial Thrift Rollup Machine (1993–2020)
Joseph R. Ficalora entered a branch of Queens County Savings Bank in 1965 at age eighteen and spent fifty-five years at the institution. He rose from an entry-level clerical role to lead a company with tens of billions in assets — a career arc that by the 2010s was increasingly rare in American finance and shaped how the bank was managed.4
The institution was originally chartered in 1859 as a mutual savings bank serving Queens households. In 1993, it converted to a public stock company with Ficalora serving as chief executive officer of the new holding company. At conversion, the bank held less than $1 billion in assets across eight branches. By Ficalora's retirement at the end of 2020, total assets had grown to roughly $55 billion and 236 branches across five states.4
Growth was driven by a serial acquisition strategy. Through the late 1990s and 2000s, NYCB absorbed a series of mutual and converted thrifts across the New York metropolitan area, including Haven Bancorp, Richmond County Financial, Roslyn Bancorp, and Synergy Financial. While thrift consolidation was common during this era, NYCB followed a distinct model: rather than developing acquired targets into full-service commercial banks, management stripped out non-core operations and concentrated resources on a single asset class.
The strategy relied on capital arbitrage. Converting mutual thrifts often reached public markets over-capitalized — holding decades of accumulated retained earnings without dividend commitments — and under-levered relative to their deposit capacity. NYCB acquired these entities, eliminated duplicate administrative overhead, and deployed the excess capital into multi-family residential loans. These acquisitions provided predictable cost reductions, lowering the bank's cost of equity and supporting further dealmaking. For fifteen years, this consolidation mechanism drove the company's expansion.
The cheapest bank in America
NYCB's primary operational metric was its efficiency ratio, which measures operating expenses as a percentage of revenue. Throughout much of the 2000s and 2010s, the bank maintained an efficiency ratio below 40%, compared to a regional bank peer group average of 55% to 65%. For every dollar of revenue generated, NYCB spent under forty cents in overhead, while competitors spent between fifty-five and sixty-five cents.
This efficiency advantage was achieved through operational austerity. Branch facilities were minimalist, technology investments remained modest, and corporate staffing was lean. Crucially, the multi-family lending model required minimal operational infrastructure. A small team of relationship lenders extended large-balance loans to established New York property owners, many with long-standing ties to the bank. A single loan officer could originate more balance-sheet asset volume than an entire consumer lending division, eliminating the need for mortgage servicing platforms, credit card operations, or extensive branch networks.
The niche: non-luxury, rent-regulated multi-family
The collateral base focused on five- and six-story walk-ups and mid-rise apartment buildings in Queens, Brooklyn, the Bronx, and upper Manhattan, where most units were rent-stabilized. Rather than luxury properties, these assets were cash-flow-driven housing where regulated rents sat below market rates, ensuring high occupancy across economic cycles. During downturns when luxury occupancy fell, demand for rent-stabilized housing remained steady. Management presented this portfolio to investors as recession-resilient, a positioning supported by minimal credit loss rates during the 2001 downturn and the 2008 financial crisis.
The underwriting illusion
However, the portfolio's long-term credit performance depended on New York State's regulatory framework rather than traditional underwriting metrics alone.
Prior to June 2019, rent-stabilized properties functioned as options on future deregulation. State law permitted property owners to raise legal rents upon tenant turnover and following capital improvements. Individual Apartment Improvements allowed landlords to renovate vacant units and add a portion of the expenditure permanently to monthly rents. Major Capital Improvements permitted owners to pass building-wide upgrades, such as roof or boiler replacements, onto tenants. Once a unit's legal rent crossed a statutory threshold upon vacancy, it exited rent stabilization and transitioned to market-rate pricing.
Under this legal structure, borrowers operated a clear business model: acquire rent-stabilized properties at low initial yields, renovate vacant units, raise rents, deregulate units, increase net operating income, and refinance at higher valuations. Properties were priced as conversion projects rather than static cash-flow assets, with buyers paying a premium for deregulation potential.
NYCB provided the debt financing for those conversions. This dynamic explains why the bank recorded negligible multi-family credit losses for twenty-five years. Low loss rates reflected steady collateral appreciation driven by statutory rent increases. When borrowers experienced financial stress, properties were typically sold or refinanced rather than defaulted upon, as incoming buyers sought the underlying deregulation option. The bank benefited from policy-driven collateral appreciation, which both management and regulators interpreted as evidence of superior credit underwriting discipline.
This policy-driven performance created secondary balance sheet vulnerabilities. Minimal credit losses allowed NYCB to maintain leaner loan loss reserves than peers while reporting high net income. Strong earnings supported a premium valuation and a substantial dividend payout. In turn, the elevated dividend attracted a retail shareholder base reliant on distributions, creating strong internal resistance to dividend reductions. Consequently, management delayed balance sheet adjustments until severe capital pressure forced action.
This reliance on statutory rent increases also weakened risk management infrastructure. Because historical loss data indicated minimal credit risk, NYCB maintained thin credit monitoring systems and risk oversight operations, leaving the institution unprepared for fundamental regulatory shifts.
In June 2019, the New York State legislature altered those rent regulations, removing the mechanism supporting property valuation growth.
III. The 2019 Regime Shift: HSTPA and the Collateral Time Bomb
On June 14, 2019, New York State enacted the Housing Stability and Tenant Protection Act. Passed by a legislature where tenant advocates held a working majority for the first time in decades, the statute was framed as housing reform rather than banking regulation. In practice, however, it represented the largest single collateral repricing event in the modern history of New York commercial real estate.5
For lenders, the statutory changes dismantled the core assumptions of multi-family underwriting. Vacancy deregulation was eliminated, preventing stabilized apartments from exiting rent control regardless of rent thresholds or vacancy events. Rent increases tied to Individual Apartment Improvements (IAIs) and Major Capital Improvements (MCIs) were sharply capped, with IAI rent add-backs converted from permanent increases to temporary surcharges. Vacancy bonuses were also repealed, effectively eliminating the statutory mechanisms that had driven property valuation growth.
For property owners, real estate conversion projects were transformed into fixed-revenue utilities facing unconstrained operational costs. For lenders, the law invalidated existing property appraisals across their multi-family portfolios. A building underwritten in 2017 at a 55% to 60% loan-to-value ratio had been appraised based on projected cash flows driven by unit deregulation. Without that growth trajectory, collateral values defaulted to static net operating income capitalized at prevailing rates. While loan balances remained unchanged, underlying property valuations shrank.
The economics after the escalator
The subsequent years underscored this economic imbalance. Between 2020 and 2026, operating expenses for rent-stabilized buildings climbed roughly 28%, while cumulative rent increases approved by the Rent Guidelines Board totaled about 10.5%. This 17-percentage-point gap directly eroded net operating income. Key cost drivers included insurance premiums rising about 115%, fuel expenses up 42%, maintenance costs increasing 33%, utilities rising 29%, labor expenses up 19%, and property taxes increasing 16%.6
Property market transactions reflected this operational margin squeeze. Portfolios traded prior to HSTPA and resold after 2023 cleared at steep discounts to previous valuations. A 2025 transaction involving five buildings closed at approximately 45% of its 2015 purchase price, while a 2,000-unit Bronx portfolio traded for $192.5 million in 2025, down from the $253 million paid in 2014.6 Industry estimates indicated valuation declines of 30% to 50% across heavily regulated properties, with certain distressed assets experiencing even steeper write-downs.
Then the rates moved
While HSTPA compressed operating cash flows, macroeconomic policy shifted property capitalization rates. Between March 2022 and July 2023, the Federal Reserve raised the benchmark federal funds rate by 525 basis points. NYCB's multi-family portfolio was primarily structured with five-year fixed or capped interest periods before resetting—a standard structure in New York commercial real estate. Consequently, a loan originated in 2019 at an interest rate near 3.5% and resetting in 2024 faced contractual resets between 7% and 8%, based on management's formula of a five-year benchmark rate plus 300 basis points or prime plus 275 basis points.7
When applied to properties with stagnant or declining net operating income, these higher interest rates nearly doubled annual debt service. A property that maintained a healthy debt service coverage ratio of 1.3x in 2019 fell below 1.0x upon reset, leaving the building unable to generate sufficient cash flow to cover debt obligations. Borrowers faced three primary alternatives: inject additional equity into an asset valued below its debt, surrender the collateral to the bank, or negotiate loan modifications. Most property owners chose negotiation, leading management to classify substantial portions of the portfolio as criticized assets well before formal contractual defaults occurred.
The concentration nobody adjusted for
Despite shifting credit fundamentals, these loans remained on the balance sheet at legacy carrying values. NYCB entered the downturn with more than $18 billion in New York rent-regulated multi-family exposure. Combined multi-family and commercial real estate assets represented the vast majority of its lending portfolio, pushing the bank's commercial real estate concentration ratio above 500% of total risk-based capital by early 2024—substantially exceeding the 300% threshold established by regulatory guidance.7
Throughout 2022 and 2023, management's public communications emphasized historical loan-to-value ratios of 55% to 60% at origination. However, origination metrics reflected property valuations based on deregulation assumptions that state law had since abolished. Under post-HSTPA operating cash flows and higher capitalization rates, effective loan-to-value ratios on the most heavily regulated assets climbed toward and past 100%. The Financial Times subsequently cited NYCB's rent-stabilized portfolio as a bellwether for systemic vulnerabilities across U.S. commercial real estate lending.8
The structural vulnerability demonstrated that an institution can adhere to historical underwriting standards and remain severely exposed if those standards rely on a regulatory framework subject to legislative repeal. Following the June 2019 statutory shift, the economic foundation of NYCB's core asset class was fundamentally altered. What exacerbated the eventual balance sheet strain was that between 2019 and 2023, the institution focused its strategic capital on rapid balance sheet expansion rather than adjusting to its changed regulatory reality.
IV. Ambition Meets Regulation: The Flagstar & Signature Mega-Deals (2020–2023)
Thomas Cangemi assumed the role of chief executive officer on January 1, 2021. Having served as NYCB's chief financial officer since 2005, he possessed deep familiarity with the thrift ecosystem, paired with a clear-eyed assessment of its structural limitations.4
The legacy model had reached its operational limit. NYCB’s funding costs were elevated due to a reliance on retail certificates of deposit rather than commercial operating accounts. Fee income was minimal, and multi-family origination volumes were contracting as rent regulation changes suppressed transaction activity. Management recognized that funding long-term assets with high-cost CDs while lending at narrow spreads against a shrinking market presented a clear constraint on growth. To pivot, the bank sought to transition into a commercial institution with diversified revenue, broader fee generation, and a larger base of commercial deposits.
While the strategic direction was clear, the execution presented major operational challenges.
Deal one: Flagstar Bancorp
On April 26, 2021, NYCB announced an agreement to acquire Michigan-based Flagstar Bancorp in an all-stock transaction valued at approximately $2.6 billion, with Flagstar shareholders receiving 4.0151 NYCB shares per share held.9 The strategic rationale centered on adding a major national residential mortgage originator and servicer, expanding deposit density through a Midwest branch network, and introducing fee-based revenue streams.
However, the transaction required more than eighteen months to secure regulatory approvals, closing on December 1, 2022. The extended timeline coincided with a sharp shift in the macroeconomic environment, requiring NYCB to integrate a mortgage banking operation during a severe contraction in residential origination volume. Mortgage banking introduced cyclical earnings volatility, substantial capital requirements, and operational complexity, while warehouse lending to third-party originators added secondary credit exposure. Following the merger, the combined company adopted the Flagstar Bank name for its primary banking subsidiary.
Deal two: Signature
On March 12, 2023, state regulators closed Signature Bank. One week later, on March 19, the FDIC announced that Flagstar Bank, N.A. would assume substantially all of Signature Bridge Bank's deposits and acquire a portion of its assets. Under the transaction terms, Flagstar acquired approximately $38.4 billion in assets, including $12.9 billion in loans purchased at a $2.7 billion discount, while roughly $60 billion in loans remained in FDIC receivership. Forty Signature branches transitioned to Flagstar on March 20, excluding approximately $4 billion in deposits associated with Signature's digital-asset banking unit. The FDIC received equity appreciation rights in NYCB common stock valued at up to $300 million and estimated the failure's cost to the Deposit Insurance Fund at approximately $2.5 billion.10
The transaction structure reflected the emergency conditions of a weekend receiver auction during broader industry deposit stress. The candidate pool was restricted to institutions capable of executing a rapid balance sheet expansion and acquiring forty branch locations without immediate operational conversion. While the $2.7 billion discount provided initial compensation for limited due diligence, the FDIC retained equity upside through appreciation rights. More critically, the addition of $38 billion in assets accelerated the bank's transition across regulatory size thresholds before its oversight infrastructure was fully established.
From an asset quality perspective, the acquired operations offered strategic benefits. Signature's commercial and private client banking teams provided access to low-cost commercial operating deposits, non-interest-bearing balances, middle-market lending relationships, and treasury management fee streams that bolstered the bank's core commercial franchise.
The consequence nobody priced
Through these consecutive transactions, NYCB's total assets expanded from approximately $60 billion to over $114 billion in fifteen months. This growth pushed the bank above the $100 billion asset threshold, subjecting it to Category IV enhanced prudential standards under the regulatory tailoring framework established by the 2018 Economic Growth, Regulatory Relief, and Consumer Protection Act.[^11]
Crossing this threshold altered the institution's supervisory framework. Below $100 billion, thrifts and regional institutions operate under standard community bank supervision. Above that line, banks face heightened regulatory requirements, including mandatory supervisory stress testing cycles, formal capital planning, resolution plan submissions, and enhanced liquidity management mandates that required holding substantial low-yielding cash and Treasury buffers. Crucially, the regulations mandated fully independent risk management and internal audit frameworks capable of evaluating credit risk across business lines.
In practice, the operational challenge mirrored a localized business suddenly required to implement the complex compliance and inspection protocols of a global enterprise. Establishing independent validation procedures, audit documentation, and enterprise risk management requires significant capital investment and multi-year execution timelines.
During the January 2024 earnings call, management acknowledged that building required liquidity buffers created immediate margin pressure, outlining plans to hold approximately $7.5 billion in additional cash reserves above year-end levels and noting the resulting headwind on net interest margin.1
Organizational integration posed additional risk. NYCB's legacy credit review procedures, developed around a historically low-loss thrift portfolio, were assigned to evaluate a $114 billion multi-asset portfolio comprising residential mortgages, commercial middle-market loans, and a deteriorating rent-regulated multi-family portfolio. The infrastructure was inadequate for Category IV risk-grading standards, leading to internal control deficiencies disclosed in subsequent regulatory filings.
The expansion combined three distinct operating structures: a cost-sensitive Long Island thrift, a volume-driven mortgage banking operation, and a relationship-focused commercial bank, none of which had previously operated under Category IV supervisory oversight.
The timing also compounded accounting complexities. Crossing the $100 billion threshold enforced full application of Current Expected Credit Losses (CECL) accounting guidelines, requiring lifetime loss provisioning at loan origination rather than waiting for loss events. Because NYCB's historical credit loss metrics on multi-family loans were near zero, qualitative management overlays were required to adjust reserve models for changed regulatory and economic conditions. Consequently, loan loss provisioning shifted from automated model outputs to significant discretionary adjustments, accentuating the timing and scale of reserve increases.
Ultimately, the institution's regulatory status evolved faster than its risk management capabilities. The underlying credit risk was compounded by the administrative and capital burden of meeting enhanced regulatory standards, creating an operational shortfall that culminated in the internal control revisions and reserve adjustments of early 2024.
V. The January 2024 Crisis: Earnings Shock, Control Failures, & Junk Downgrades
The 8:30 a.m. conference call on January 31, 2024, provided a clear view of a management team confronting a sudden loss of market credibility.
The headline results were severe. Against consensus expectations of positive earnings, the company reported the fourth-quarter net loss of $252 million, the $552 million credit provision, and the 70% dividend reduction announced earlier that morning. Two specific exposures drove a substantial portion of the quarterly charge-offs: an office loan and a multi-family co-operative loan placed on non-accrual status. Management framed the dividend cut as a capital preservation measure, explaining that the institution needed to raise its Common Equity Tier 1 capital ratio toward Category IV regulatory standards, and reducing the dividend offered the fastest means to retain capital.1
What the Q&A revealed
Bank of America analyst Ebrahim Poonawala opened the question-and-answer session by asking what the elevated reserve build implied for future credit performance and whether management anticipated losses in multi-family lending. Chief financial officer John Pinto emphasized past performance, stating, "we have not seen significant losses in multi-family," and adding, "we're still very comfortable in the quality of the multi-family portfolio."1 The response relied on historical loss data rather than addressing forward-looking credit exposure under higher interest rates and post-HSTPA property valuations.
Chief executive officer Thomas Cangemi provided additional detail regarding the reserve adjustments, explaining that management had stress-tested the portfolio for payment and interest-rate risk. That exercise revealed that higher interest rates had reduced debt service coverage ratios on a significant portion of performing loans toward 1.0x, and "in some cases, slightly below on a pro forma basis." Concurrently, the allowance for credit losses on the office portfolio was raised from roughly 200 basis points to 800 basis points — an increase from 2% to 8% of office loans in a single quarter — explicitly to align reserves "in line with our current peer group, which is a new peer group, Category IV banks."1
That rationale signaled that the reserve build was driven by regulatory re-categorization rather than a proactive re-evaluation of underlying credit risk. Operating under Category IV requirements forced the institution to adopt reserve methodologies suited to a $100 billion bank, revealing that legacy reserve levels had reflected thrift-era assumptions rather than current portfolio risks. The admission prompted analysts to question whether additional assets remained un-adjusted on the balance sheet.
Tensions increased during an exchange with J.P. Morgan analyst Steven Alexopoulos. While the bank had provided net interest margin ranges and balance sheet targets, management declined to provide net interest income guidance. Alexopoulos noted that the stock was trading around $7 in pre-market activity — near a 25-year low — and observed that analyst projections implied an approximate 40% reduction in earnings, asking if that matched management's outlook. When executives declined to confirm the estimate, Alexopoulos pressed for explicit guidance, asking, "why not just give us the number and make life easy?" and suggesting, "maybe you do your shareholders a favor and tell us."1 Executive management maintained that specific guidance would not be provided, with Cangemi responding that "the market will reset itself when it understands the strategy."
For institutional investors, the exchange highlighted underlying analytical uncertainty. A management team with clear visibility into its forward cash flows can typically provide earnings guidance. Declining to provide net interest income projections on the same day an institution cuts its dividend by 70% suggested either incomplete financial modeling or an outlook more adverse than consensus estimates. Both interpretations were soon validated.
From bad quarter to solvency question
Over the subsequent five weeks, operational concerns shifted into a broader liquidity and capital crisis.
On February 6, 2024, Moody's Investors Service downgraded NYCB's long-term issuer credit rating by two notches to Ba2 from Baa3, dropping the bank below investment grade into junk status, and maintained a review for further downgrades. Moody's cited governance vulnerabilities rather than immediate asset write-downs, highlighting elevated risks stemming from executive turnover in the bank's key risk management and internal audit functions during a critical transition period.11
On February 29, 2024, the company submitted amended regulatory filings disclosing material weaknesses in its internal controls over financial reporting, specifically citing ineffective oversight, risk assessment, and loan monitoring processes. The filing also recognized a $2.4 billion non-cash goodwill impairment charge related to historic acquisitions dating back to 2007 and earlier, effectively writing down the recorded accounting premium of the legacy thrift expansion strategy. Reflecting the goodwill impairment, the reported fourth-quarter net loss expanded from $252 million to approximately $2.7 billion. Concurrently, Cangemi resigned as chief executive officer and was replaced by executive chairman Alessandro "Sandro" DiNello, the former Flagstar Bancorp chief executive who had joined the board following the 2022 merger.12
While non-cash goodwill impairments do not directly reduce regulatory capital or cash reserves, the write-off carried significant signal value for investors. Eliminating two decades of accumulated acquisition premiums in the same filing that disclosed control deficiencies in loan review signaled that prior franchise valuations were no longer supported by underlying cash flows.
Securities litigation followed, with class action lawsuits filed on behalf of shareholders who purchased stock between July 27, 2022 — prior to the Flagstar merger approval — and February 29, 2024. The complaints alleged that management made materially false and misleading statements regarding the bank's internal risk controls and commercial real estate exposure.13 That legal overhang continued to affect investor sentiment after the rebrand.
The selection of DiNello reflected the board's immediate turn toward crisis management. Having guided Flagstar through restructuring following the 2008 financial crisis before its eventual sale to NYCB, DiNello brought specific experience in managing distressed financial institutions. Appointing an executive from the acquired entity rather than promoting from the legacy thrift management team reflected an acknowledgment of the operational vulnerabilities within legacy oversight structures.
By early March 2024, market focus had moved beyond earnings performance to address the bank's capital adequacy and standalone viability.
VI. The $1.05B Rescue: Mnuchin, Otting, & Capital Restructuring (March 2024)
On Wednesday, March 6, 2024, New York Community Bancorp experienced a severe intraday contraction in equity value.
Following a second credit rating downgrade by Moody's and media reports indicating deposit instability, market pressure intensified. That morning, Reuters reported that the institution was actively seeking an emergency capital infusion. Shares dropped more than 40% intraday to a low of approximately $1.70, triggering multiple volatility trading halts as market participants evaluated the risks of potential deposit flight or regulatory intervention. An institution whose market capitalization exceeded $9 billion two years earlier was being priced based on the likelihood of regulatory forbearance.
Trading resumed in the afternoon following an official capital announcement.
The terms
An investor syndicate agreed to inject more than $1 billion in new capital. Liberty Strategic Capital, the private equity firm founded by former Treasury Secretary Steven Mnuchin, committed $450 million. Hudson Bay Capital Management provided $250 million, while Reverence Capital Partners contributed $200 million. Additional commitments from Citadel Securities, other institutional investors, and bank management brought the total equity private placement to $1.05 billion.14
The structure of the transaction reflected the steep cost of emergency bank recapitalizations. Investors acquired common stock at $2.00 per share alongside a series of convertible preferred shares with a matching $2.00 conversion price—aligning the entry valuation with the morning's panic low rather than historical book value metrics. Furthermore, investors received 60% warrant coverage to purchase non-voting common-equivalent stock at $2.50 per share, representing a 25% premium to the transaction strike price.14
For shareholders who held NYCB prior to the announcement, the terms resulted in significant equity dilution. By issuing substantial equity and warrants at distressed valuation levels, the bank secured essential liquidity to stabilize its balance sheet and mitigate FDIC intervention risk, while shifting a major portion of future equity recovery to the rescue syndicate.
The preferred equity was structured as non-voting, with each preferred share convertible into 1,000 common shares and eligible for non-cumulative quarterly dividends if declared.14 This non-voting structure enabled Liberty Strategic Capital to remain below regulatory ownership thresholds that would trigger bank holding company registration for the fund. In August 2024, Liberty requested Federal Reserve approval to convert its preferred holdings into voting common stock, raising its voting stake to approximately 22.9%—remaining below the 25% control threshold—in a transaction a company spokesman characterized as converting existing economic exposure into voting rights rather than expanding its capital commitment.15
The people
Following the transaction, four new members joined the board of directors: Mnuchin, Joseph Otting, Allen Puwalski of Hudson Bay, and Milton Berlinski of Reverence. Alessandro DiNello transitioned to non-executive chairman, while Otting was appointed chief executive officer.14
Otting brought direct experience in managing distressed banking institutions and navigating federal oversight. He previously served as chief executive officer of OneWest Bank—the entity formed from the assets of IndyMac by an investor group led by Mnuchin—leading the bank through restructuring until its sale to CIT Group in 2015. Subsequently, Otting served as Comptroller of the Currency from 2017 to 2020. This background provided leadership familiar with OCC supervisory standards and capital restoration protocols, though governance observers noted the recurring movement of leadership between federal regulatory agencies and private financial institutions.
The leadership transition re-established an operational partnership between Mnuchin and Otting modeled on their prior restructuring experience at OneWest, signaling to market participants a strategic focus on balance sheet remediation and asset optimization.
Rebuilding the capital structure and the name
Management subsequently initiated structural and corporate adjustments to position the balance sheet for institutional market access.
On July 11, 2024, the company executed a one-for-three reverse stock split after market close, with shares trading on a split-adjusted basis beginning July 12. The corporate action reduced authorized common shares from 2 billion to approximately 667 million.16 While economically neutral to total market value, elevating the share price out of single-digit territory addressed institutional investment mandates and index inclusion criteria that restrict holdings of low-priced securities.
On October 25, 2024, New York Community Bancorp, Inc. formally changed its corporate name to Flagstar Financial, Inc., with its ticker symbol transitioning from NYCB to FLG on the New York Stock Exchange on October 28.17 Industry trade publications framed the renaming as marking the formal end of the NYCB era.[^19] Aligning the parent entity name with its primary banking subsidiary consolidated brand identity while distancing the institution from legacy reporting disclosures and credit downgrades.
Further corporate consolidation occurred in 2025. In July, the board authorized merging the parent holding company directly into Flagstar Bank, N.A., establishing the operating bank as the surviving public entity under the FLG ticker. Regulatory approvals were granted in October 2025.1819 The collapse of the holding company structure eliminated redundant administrative overhead and streamlined regulatory oversight by consolidating primary supervision under the Office of the Comptroller of the Currency.
While the capital injection and structural reorganization resolved short-term liquidity and regulatory pressures, restoring fundamental operating profitability remained an ongoing requirement.
VII. Segment Economics & Strategic Transformation (2024–Present)
By August 2026, Flagstar Financial operates essentially as three distinct business lines moving on separate trajectories: one expanding, one contracting in a managed runoff, and one already liquidated.
The business being built: commercial and private banking
The commercial and private banking unit, inherited from Signature Bank, represents management's primary growth thesis. Chief executive officer Joseph Otting recruited Richard Raffetto to lead the division in early 2024; by 2026, Raffetto had been elevated to co-president, co-chief operating officer, and chief banking officer, sharing the co-president title with chief financial officer Lee Smith. Otting's employment contract was extended through March 2028, with his base salary rising to $1.4 million in March 2027 alongside a $10 million restricted stock unit award vesting quarterly through March 2028.20
The commercial expansion proceeded rapidly. In the second quarter of 2026, the bank generated $4.2 billion in new and expanded credit commitments, yielding a record $2.8 billion in closed commercial and industrial (C&I) originations while adding 75 new commercial client relationships. Total C&I loan balances increased from $16.6 billion to $18.6 billion during the quarter, representing a 12% sequential gain. Specialized lending verticals expanded by $1.7 billion, or 34%, driven primarily by energy, financial institutions, healthcare, technology, and entertainment segments. Flagstar hired 32 producers and underwriters during the quarter—bringing its first-half commercial additions to 62—while establishing new lending groups for food and beverage, hospitality, and non-profit institutions, alongside a new regional commercial banking hub in Texas.7
The division demonstrated clear commercial traction: new originations carried an average yield spread of 226 basis points over SOFR, and associated deposit inflows totaled $900 million during the second quarter. Over the first half of 2026, net commercial and private banking loan growth reached $3 billion against $1.4 billion in net deposit growth.7 That roughly two-to-one loan-to-deposit expansion ratio highlights an ongoing funding constraint. Relationship commercial banking typically relies on core operating deposits to fund loan growth; at Flagstar, credit expansion has outpaced client deposit gathering. Management acknowledged that deposit growth occurred disproportionately in interest-bearing accounts, admitting that the timeline for expanding non-interest-bearing balances had been pushed out.7
The business being drained: multi-family and CRE
The legacy multi-family and commercial real estate portfolio remains in managed runoff, with contraction pacing ahead of internal projections. Total commercial real estate balances fell by $14.9 billion, or 28%, from 2023 levels through mid-2026. This reduction lowered the CRE concentration ratio to 350% of total risk-based capital, down from 367% in the prior quarter and over 500% when Otting assumed leadership. In the second quarter of 2026, multi-family and CRE loan payoffs totaled $1.5 billion, of which $1.1 billion occurred at par—with substandard-rated loans accounting for 39% of those full-balance payoffs.7
That metric serves as a key indicator of underlying asset quality. A par payoff means the borrower fully satisfied the contractual principal balance. The bank's ability to recover full principal on loans graded internally as substandard indicates that risk-grading methodologies adopted during the 2024 restructuring were conservative relative to realized cash recoveries. Consistent par payoffs across eight consecutive quarters suggest that internal loan marks accurately reflected collateral recovery values rather than cosmetic balance sheet adjustments.
As of June 30, 2026, remaining legacy holdings included $26.9 billion in multi-family loans, $8.2 billion in commercial real estate, and $5.8 billion in one-to-four family residential mortgages.3 Within the multi-family portfolio, New York City rent-regulated properties accounted for $13.4 billion, while the subset of heavily regulated assets—where rent control governs at least half the units—stood at $8.5 billion, down 4% sequentially. This regulated subset maintained a 97% occupancy rate and a reported average loan-to-value ratio of 70%. Of that $8.5 billion segment, $4.1 billion remained pass-rated, while $4.4 billion was classified as criticized or non-performing. Within the criticized bucket, $1.7 billion sat on non-accrual status and had been written down to at least 90% of appraised collateral value, reflecting $351 million in cumulative charge-offs and $76 million in specific reserves—providing total reserve coverage above 20% for that population.7
The portfolio faces an upcoming maturity wall: approximately $11 billion in multi-family loans carrying a weighted average interest coupon near 3.90% reset or mature between June 30, 2026, and December 31, 2027. The heaviest concentration occurs in 2027, when roughly $9 billion in CRE loans undergo contractual reset or reach maturity. Management currently retains between 35% and 40% of resetting loans upon refinancing.7
The business already sold
The residential mortgage banking franchise—originally framed as the strategic centerpiece of the 2022 Flagstar acquisition—was liquidated within two years of the emergency recapitalization. In July 2024, the bank agreed to sell its residential mortgage servicing and third-party origination operations to Mr. Cooper Group for $1.4 billion, completing the transaction in the fourth quarter.21 Concurrently, Flagstar transferred $5.9 billion in mortgage warehouse loans to JPMorgan Chase.22
These divestitures achieved three structural objectives: converting capital-intensive, volatile mortgage operations into regulatory capital; shrinking overall balance sheet assets; and eliminating associated operating overhead. However, the transactions permanently removed a core fee-income stream, leaving forward profitability heavily dependent on net interest spreads. In total, the holding company paid $2.6 billion for Flagstar Bancorp, only to sell its principal mortgage operations for $1.4 billion plus a warehouse loan transfer within twenty-four months. While branch networks, deposit bases, and brand identity were retained, the original acquisition logic was effectively abandoned.
The quiet third leg: the consumer bank
Beneath the commercial expansion and real estate runoff sits a retail branch network that receives little investor attention despite serving as a major operational anchor. Flagstar operates approximately 340 branches across nine states with 5,631 employees, combining the legacy Queens and Long Island footprint, the Midwest network acquired from Flagstar Bancorp, and former Signature Bank locations.323
Strategically, the retail branch network functions primarily as a deposit funding engine, albeit an expensive one. Retail deposit balances contracted by $290 million during the second quarter of 2026, even as commercial and private banking deposits grew by $900 million—reflecting a planned mix shift, but also highlighting steady runoff in retail branch accounts.7 Management's long-term target calls for an asset mix balanced evenly across commercial real estate, C&I lending, and consumer loans.24 However, consumer lending remains the least developed segment of the business plan, representing an initiative whose credit performance across full economic cycles has yet to be established.
Where the numbers stand
Reported financial results reflect a gradual operational recovery. Flagstar recorded net losses of $1.118 billion in 2024 and $177 million in 2025, before returning to quarterly profitability in the fourth quarter of 2025 with $29 million in net income.25 The first half of 2026 yielded net income of $21 million in the first quarter and $34 million in the second.3 Operating expenses fell by roughly $700 million in 2025 compared to 2024, and declined an additional 3% sequentially in the second quarter of 2026 to $427 million.243
As of June 30, 2026, the Common Equity Tier 1 capital ratio reached 13.16%—an increase of nearly 400 basis points from its pre-crisis low, generating an estimated $1.6 billion in after-tax excess capital above the lower bound of management's 10.5% target range. Cash and liquid securities were rebuilt to represent approximately one-quarter of total assets, while high-cost brokered deposits were reduced by nearly $8 billion during 2025. The overall cost of interest-bearing deposits declined by 65 basis points year-over-year, supported by retaining roughly 85% of $4.8 billion in maturing retail certificates of deposit at yields 15 to 25 basis points below expiring terms.2473
In a notable strategic shift, total assets stood at $87.7 billion as of mid-2026, positioning the bank comfortably below the $100 billion Category IV regulatory threshold that exacerbated its 2024 liquidity crisis. Management's forward financial targets project asset expansion to between $91.5 billion and $92 billion by year-end 2026, with total assets approaching $100 billion by late 2027—deliberately approaching the Category IV threshold once again, this time with higher capital reserves and updated risk management protocols in place.7 Whether this expansion represents disciplined growth or renewed regulatory exposure depends on the efficacy of internal risk controls instituted since 2024. For outside investors, evaluating that risk relies on tracking control disclosures, criticized loan migration patterns, and management's execution against disclosed guidance.
VIII. Strategic Frameworks: 7 Powers & Porter's 5 Forces
Strip away the drama and the underlying question is structural: does this business possess any durable advantage, or is it a commodity lender operating with a restructured balance sheet and a compelling turnaround narrative?
Hamilton Helmer's 7 Powers
Scale economies — currently a penalty, not a power. In banking, scale is intended to spread fixed overhead across a broader revenue base. Between roughly $100 billion and $250 billion in total assets, however, scale often produces the opposite outcome. An institution within that threshold carries most of the compliance, stress-testing, liquidity, and resolution infrastructure required of a large bank without the massive revenue base of money-center institutions like JPMorgan Chase or Bank of America to absorb those costs. Research from the Federal Reserve Bank of Cleveland on the 2019 tailoring framework examined this specific operational discontinuity across regulatory size thresholds.26 Flagstar experienced that regulatory penalty directly when its rapid expansion pushed it across the $100 billion line before establishing the necessary compliance infrastructure. While management's plan to re-cross that threshold deliberately sequences investments appropriately, it does not eliminate the underlying regulatory overhead.
Switching costs — real but narrow. A middle-market commercial borrower integrating payroll, receivables, foreign exchange, and revolving credit facilities through a single institution rarely shifts providers over marginal pricing differences; unwinding treasury management infrastructure imposes meaningful operational cost and risk. That operational integration represents genuine switching-cost strength, which legacy Signature Bank client relationships provide. The 130 new-to-bank commercial and industrial client relationships added in the first half of 2026 offer potential to build further switching costs over time.7 However, the overall deposit base remains heavily weighted toward rate-sensitive retail balances, highlighted by $4.4 billion in retail certificates of deposit repricing in a single quarter.7 Retail depositors face minimal switching costs in an environment of digital transfers and elevated money market yields.
Process power — destroyed, and being rebuilt as something different. The legacy underwriting model reflected regulatory arbitrage under state rent laws rather than structural process power, an advantage that expired upon the enactment of the Housing Stability and Tenant Protection Act. What Flagstar has established instead is specialized workout capability: a dedicated special assets team resolving criticized assets, an eighteen-month forward review process for loans approaching interest resets or maturities, and systematic collection of annual borrower financials. Management reported running pro forma reset calculations across every loan scheduled to reset through year-end 2027 and updating risk classifications accordingly.7 While this enhanced oversight represents a clear improvement over legacy thrift monitoring, workout capability functions as an operational tool to remediate troubled assets rather than a durable moat to expand market share.
Cornered resource — fading, with one partial exception. The legacy Long Island and Queens branch network historically provided a low-cost, stable deposit franchise. Heightened rate competition and public headlines during early 2024 accelerated deposit runoff across those retail locations. The primary partial exception rests in the commercial banking teams recruited from Signature Bank, who hold deep relationship capital. However, human capital remains mobile, and management's strategy of recruiting talent from consolidating competitors applies equally to rivals targeting Flagstar's own key bankers.7
Counter-positioning, branding, network economies — non-existent. Counter-positioning does not apply, as incumbent regional banks can replicate Flagstar's commercial lending model. Brand equity remains neutral following two years of corporate restructuring, while middle-market commercial lending generates no direct network effects.
The structural verdict is clear: Flagstar currently operates without a durable competitive moat. It maintains a capital surplus, a track record of cost reduction, a functional asset workout capability, and an active hiring pipeline. These attributes represent tactical execution capabilities rather than structural powers, requiring continuous operational performance to maintain earnings growth.
Porter's Five Forces
Threat of new entrants: low. Constructing de novo commercial bank charters remains a lengthy, highly regulated process. Low threat of entry represents a favorable dynamic, though it benefits all established incumbents equally.
Bargaining power of depositors: very high. Depositor pricing power presents the primary constraint on forward earnings expansion. Retail depositors encounter negligible switching friction and readily accessible alternatives. Flagstar's average cost of deposits stood near 2.49% in mid-2026, with management acknowledging that further reductions become increasingly challenging without broader interest rate cuts.7 A net interest margin of 2.13% remains below regional peer benchmarks, making margin expansion central to the institution's 2027 profitability targets.3
Bargaining power of borrowers: mixed, and shifting. Distressed commercial real estate borrowers facing interest resets hold minimal bargaining leverage, as contractual reset dates arrive regardless of broader market rate movements. Conversely, prospective commercial and industrial borrowers face intense competition among regional institutions pursuing similar diversification strategies. Management noted that regional peers across the sector are actively targeting commercial loan growth, creating a crowded competitive environment.7
Threat of substitutes: high and rising. Non-bank lenders and private credit funds have captured significant market share in commercial real estate refinancing and middle-market corporate lending, operating unencumbered by bank capital requirements or commercial real estate concentration limits. Simultaneously, government-sponsored enterprises continue to absorb eligible multi-family mortgages, matching management's observations of active demand from institutional buyers and agencies for multi-family assets.24 This substitution dynamic explains why loan payoffs have proceeded ahead of initial projections, aiding balance sheet de-risking while reducing total net interest income.
Rivalry: intense. Flagstar competes directly against regional peers such as M&T Bank, Valley National, Webster Bank, Citizens Financial, and Dime Community Bank across its core geographic footprint, while competing against money-center institutions for premier commercial relationships. Unlike Flagstar, major competitors are executing growth plans without recovering from a recent recapitalization.
In aggregate, the industry exhibits strong depositor pricing power, expanding non-bank substitution, and aggressive peer rivalry, operating in an environment where Flagstar holds no structural moat. This assessment does not preclude attractive investment returns, as financial institutions trading below tangible book value can generate shareholder value through balance sheet normalization and earnings recovery. However, the investment thesis relies entirely on disciplined operational execution and valuation, rather than structural competitive protection.
IX. Playbook: Business & Investing Lessons
1. Regulatory thresholds are cliffs, not slopes. Crossing $100 billion in assets did not gradually increase New York Community Bancorp's cost of doing business; it immediately imposed an enhanced operating regime that the institution had not pre-funded. The broader lesson is that when a business model intersects a discrete regulatory step function—such as asset size tiers, systemic risk designations, or heightened prudential standards—the necessary compliance and risk infrastructure must be built before crossing that boundary, treating those expenditures as part of the transaction cost. NYCB acquired Flagstar Bancorp for $2.6 billion and purchased Signature Bank's assets at a discount, only to discover that the true cost of both transactions included the enhanced regulatory framework triggered by their combined scale. When evaluating an acquisitive institution approaching such a threshold, analysts must scrutinize the pro forma compliance costs and verify whether they are accounted for in expected cost synergies.
2. Never underwrite long-duration assets on the assumption that local law is permanent. NYCB's quarter-century record of minimal credit losses was, in substance, a bet on the permanence of New York State's rent deregulation framework. That assumption proved valid for twenty-five years before being invalidated by statutory reform, with retroactive effects that repriced legacy loans across the portfolio. Any institution whose collateral or enterprise values depend on a statutory environment must be evaluated under scenarios where that framework changes. A sound analytical approach separates the portion of an asset's valuation derived from immediate operating cash flow from the portion tied to policy-dependent future upside, assessing collateral viability if only current cash flow remains.
3. A clean loss history can be a misleading risk indicator. Decades of negligible charge-offs persuaded management, the board, auditors, and regulators that the bank's multi-family underwriting was intrinsically low-risk. This historical record discouraged investment in credit monitoring systems because there appeared to be little risk to monitor. When the regulatory and economic environment shifted, the institution possessed neither the risk management infrastructure nor the institutional experience to respond promptly. A prolonged record of zero credit losses in a single asset class should prompt investigation into the structural reasons behind that performance, rather than serving as proof of superior credit discipline.
4. Integrating disparate operating cultures is a control challenge, not a synergy objective. Combining a cost-focused thrift, a volume-driven mortgage originator, and a relationship-oriented commercial bank creates conflicting incentive structures, distinct risk tolerance levels, and differing underwriting definitions. The internal control deficiencies disclosed in February 2024 emerged at the intersection of these disparate systems. For serial acquirers, integration vulnerabilities typically manifest first in internal controls, risk grading, and governance oversight before appearing in credit loss metrics. Consequently, audit committee disclosures and turnover in key risk or audit leadership serve as earlier indicators of distress than formal loan performance data—a signal Moody's identified weeks before internal control weaknesses were formally acknowledged.11
5. Crisis capital is priced by the provider of liquidity, not the seeker. The March 2024 recapitalization established conversion terms at a distressed valuation and attached substantial warrant coverage. Rather than representing predatory pricing, these terms reflected market requirements when the alternative was regulatory intervention, providing immediate capital during severe market stress. The lesson for equity investors is straightforward: in a highly leveraged, regulated institution, dilution risk is not a remote tail scenario but a central operational risk that materializes when equity holders possess minimal negotiating leverage. Holding shares in a levered financial institution during a liquidity shock requires recognizing that equity ownership can be substantially diluted by an emergency capital announcement.
X. Analysis & Bull vs Bear Investment Case
Why FLG could win from here
The bull case rests first on capital strength. A 13.16% Common Equity Tier 1 ratio places Flagstar in the top quartile of regional banks, with management calculating approximately $1.6 billion in after-tax excess capital above its operating target.37 Trading at roughly $14 per share against a tangible book value of $17.51 — a multiple of approximately 0.8 times, well below historical averages — share repurchases are immediately accretive to tangible book value per share.3 The $250 million buyback authorized in July 2026 marks the bank's first capital return since the crisis and is incremental to management's published earnings guidance.7
The second bull argument is that credit re-marking has held. Following more than $900 million in charge-offs and reserve builds during the 2024 restructuring, the allowance for credit losses has stabilized without requiring secondary builds.7 Consistent par repayments on substandard-rated loans suggest conservative internal risk classifications, while roughly 40% of non-accrual loans remain current on payment obligations, having been classified based on forward-looking interest reset calculations rather than contractual defaults.7
Third, commercial banking expansion has provided measurable momentum. The franchise achieved four consecutive quarters of net commercial and industrial loan growth, record origination volume, a $2 billion forward pipeline, and 130 new commercial relationships during the first half of 2026.7
Fourth, the upcoming multi-family maturity wall presents a structural repricing opportunity. Approximately $11 billion in multi-family loans with coupons below 4% are scheduled to reset or mature by year-end 2027. Refinanced loans reset to prevailing market rates, while loan payoffs allow capital redeployment into commercial lending at average spreads of 226 basis points over SOFR or enable the retirement of wholesale funding costing roughly 3.95%.7 This balance sheet turnover provides the mechanical foundation for projected net interest margin expansion.
Fifth, execution on operational restructuring targets has aligned with prior commitments. Management liquidated mortgage operations, reduced annual operating expenses by approximately $700 million, eliminated nearly $8 billion in high-cost brokered deposits, lowered commercial real estate concentration by 150 percentage points of total risk-based capital, and restored quarterly profitability on schedule.247
Why it may not
The bear case centers first on declining earnings guidance. Management lowered forward financial targets three times over a six-month period. On January 30, 2026, the company projected 2026 adjusted earnings per share of $0.65 to $0.70 and 2027 EPS of $1.90 to $2.00.24 By April 24, guidance was reduced to $0.60–$0.65 for 2026 and $1.80–$1.90 for 2027.27 On July 24, targets were lowered further to $0.40–$0.50 for 2026 and $1.60–$1.70 for 2027, representing a one-third reduction in the 2026 midpoint across two quarters.7
Management attributes the guidance cuts to accelerated real estate loan payoffs—running at $1.5 billion quarterly versus modeled expectations of $600 million to $800 million—which reduced interest income while accelerating balance sheet contraction, alongside slower non-interest-bearing deposit accumulation and elevated benchmark interest rates. Co-president Lee Smith characterized operational performance by stating that management was delivering on controllable initiatives and suggesting that targets might simply require additional time to materialize.7 However, rapid loan payoffs stem directly from the bank's de-risking efforts, making the variance a forecasting shortfall rather than an external disruption, and leaving forward earnings targets subject to ongoing revision risk.
A second key concern involves reserve coverage trajectories. Total allowance for credit losses as a percentage of loans declined from 1.79% at year-end 2025 to 1.52% at June 30, 2026. Multi-family reserve coverage dropped from 1.83% to 1.63%, while coverage on New York City multi-family loans where at least half the units are regulated decreased from 3.44% to 2.87%.247 Over the same six-month period, non-accrual loans increased 5% sequentially to $2.8 billion, and special mention loans rose by $100 million.37
Management attributes reserve reductions to lower total loan balances, charge-offs against pre-established reserves, and updated property appraisals that reduced qualitative overlays. While technically valid, releasing reserves against heavily regulated New York collateral while criticized loan balances expanded and municipal authorities instituted rent freezes highlights ongoing reliance on management judgment, particularly for an institution that disclosed material weaknesses in loan oversight two years prior.
That dynamic underscores heightened political and regulatory risk. On June 25, 2026, New York City's Rent Guidelines Board voted 7–1 to institute a 0% increase on both one-year and two-year renewal leases effective October 2026—the first simultaneous dual freeze in the board's history.28 The vote reflected appointments made by Mayor Zohran Mamdani following an election campaign centered on rent regulation. Property owner groups filed suit in July 2026 challenging the board's composition and methodology, though prior legal challenges to municipal rent freezes were unsuccessful.29
Addressing the potential financial impact during the July 2026 earnings call, Otting cited internal allowance review procedures and localized capitalization rate modeling, reporting a minor upward adjustment in credit loss reserves for rent-regulated multi-family assets.7 Smith outlined scenario modeling incorporating a hypothetical three-year rent freeze with annual operating cost inflation of 2.75% against market rent growth of 2.1%. That analysis indicated a clear threshold at 70% regulation: properties with lower regulatory concentration could offset frozen units through market-rate leases, whereas properties above 70% regulation experienced a 7% to 8% cumulative decline in net operating income over three years.7
While management's sensitivity testing provides transparency, a four-year mayoral term paired with continued operating expense inflation could exacerbate cash-flow pressures on heavily regulated assets. Flagstar holds $8.5 billion in loans backed by properties that are at least 50% rent-regulated. Cumulative reserve coverage exceeds 20% on the non-accrual portion of that portfolio, but stands at approximately 5% across $2.7 billion in special mention and substandard loans that remain current.7 Sustained rent freezes could require higher credit loss provisions across that performing criticized portfolio.
A third structural issue involves medium-term returns on capital. At the upper bound of 2027 guidance, a return on average assets of 0.90% to 1.00% and a return on tangible common equity of 10.75% to 11.25% would roughly match the bank's estimated cost of equity rather than generate economic surplus. Mid-single-digit returns during the restructuring phase explain why equity markets continue to price the stock at a discount to tangible book value.
The activist stress test
Evaluating Flagstar's strategic positioning requires examining five central analytical questions.
First, given $1.6 billion in excess capital and a stock trading at 0.8 times tangible book value, why is capital return limited to a $250 million buyback authorization? Otting identified core earnings trajectory, credit trends, and the capital requirements of commercial loan growth as the primary constraints.7 That approach reflects a decision to prioritize balance sheet expansion over retiring discounted shares, though Otting acknowledged that a lower equity valuation would represent an attractive entry point for more aggressive repurchases.7
Second, does commercial loan expansion reflect durable relationship banking or transient asset growth driven by team recruitment? Deposit gathering patterns and the delay in non-interest-bearing balance expansion suggest that relationship depth across newly acquired commercial accounts remains developing.
Third, does rapid credit expansion across new specialized verticals—including energy, entertainment, and fund finance—introduce unpriced credit risk? Initial credit loss reserves on new commercial lending average approximately 1% at origination.7 While standard for established underwriting platforms, expanding multiple specialized verticals simultaneously creates seasoning risk that will only be tested over a full credit cycle.
Fourth, how should investors assess a governance framework dominated by a private equity sponsor holding a 22.9% voting stake, board representation, and executive leadership ties?15 While low recapitalization entry prices align sponsor incentives toward stock appreciation, private equity investment horizons typically emphasize de-risking for eventual exit, which may not coincide with long-term value maximization for public common shareholders.
Fifth, what are the residual risks associated with pending securities litigation and internal control remediation? Verifying the complete resolution of legacy loan review weaknesses relies on future credit performance and audit disclosures rather than immediate external confirmation.
The three KPIs that matter
Evaluating Flagstar's turnaround trajectory centers on three key performance metrics.
1. Reserve coverage ratios relative to non-accrual balances on rent-regulated multi-family loans where at least 50% of units are regulated. This metric evaluates legacy credit risk remediation. Declining coverage ratios alongside rising non-accrual balances signal potential reserve underfunding, whereas stable coverage ratios paired with contracting non-accrual balances indicate effective balance sheet de-risking.
2. The cost of interest-bearing deposits and the non-interest-bearing share of total deposits. Funding metrics indicate whether commercial expansion is generating sticky relationship deposits. Sustained loan growth without corresponding gains in non-interest-bearing balances would indicate reliance on rate-sensitive wholesale or retail funding.
3. Net interest margin trajectory. Management identified a 2.19% net interest margin in June 2026 as an operational baseline.7 The pace of margin expansion serves as the primary indicator of whether multi-family loan repricing, commercial loan deployment, and debt reduction are delivering projected earnings recovery.
Quarterly earnings per share and Common Equity Tier 1 capital ratios remain secondary tracking metrics, as capital is already abundant and short-term earnings remain subject to restructuring adjustments.
XI. Outro & Outlines Wrap-Up
The Flagstar story is, at its core, a case of mistaking a regulatory subsidy for underwriting skill. For twenty-five years, the Long Island thrift generated strong returns by lending against New York apartment buildings, while executives, investors, auditors, and regulators interpreted a pristine loss record as proof of underwriting discipline. In practice, that performance relied on state rent regulations that supported predictable collateral appreciation. When those statutory mechanisms were eliminated in June 2019, that policy support vanished. It then took four years, two major acquisitions, a $100 billion regulatory threshold, 525 basis points of monetary tightening, and a severe earnings shock in January 2024 for balance sheet accounting to catch up with market economics.
By mid-2026, Flagstar operates as a fundamentally altered institution: smaller, more heavily capitalized, increasingly diversified, and led by executive leadership experienced in bank turnarounds. Restructuring efforts have produced measurable results, including three consecutive profitable quarters, an authorized $250 million share repurchase program, a one-third reduction in commercial real estate concentration, and steady expansion across commercial and industrial lending verticals.
Yet the operational recovery remains incomplete. Net interest margins remain compressed, projected return on equity barely matches the cost of capital, and management reduced forward earnings guidance three times over a six-month period. Furthermore, $8.5 billion in loans remain exposed to apartment buildings subject to municipal rent freezes, even as reserve coverage against that regulated multi-family collateral has trended downward rather than upward. The equity continues to trade at a discount to tangible book value because market participants remain divided on whether near-term balance sheet stabilization or persistent credit and margin headwinds will dictate forward value.
For market participants tracking the institution from here, three primary performance metrics will determine the outcome: the trajectory of reserve coverage on the rent-regulated multi-family book, the bank's ability to attract low-cost commercial deposits, and the expansion of its net interest margin. These core operational readings, updated quarter by quarter, will settle the investment case long before any corporate narrative does.
References
-
New York Community Bancorp, Inc. Reports Fourth Quarter and Full Year 2023 Results — New York Community Bancorp, Inc., 2024-01-31 ↩↩↩↩↩↩
-
NYCB Slashes Dividend, Surprises with Loss on CRE Loan Stress — Reuters, 2024-01-31 ↩
-
Flagstar Bank Reports Second Quarter 2026 Net Income Attributable to Common Stockholders of $0.06 Per Diluted Share — Flagstar Bank, N.A. / PR Newswire, 2026-07-24 ↩↩↩↩↩↩↩↩↩↩
-
New York Community Bancorp, Inc. Announces Leadership Transition Plan — PR Newswire, 2020-12-28 ↩↩↩
-
New York's Housing Stability and Tenant Protection Act of 2019 — What Lawyers Must Know — New York State Bar Association ↩
-
Six Years After HSTPA, New York City Owners Face Escalating Costs, Falling Values — Ariel Property Advisors, 2025-06-04 ↩↩
-
Flagstar Bank Second Quarter 2026 Earnings Conference Call — Flagstar Bank, N.A., 2026-07-24 ↩↩↩↩↩↩↩↩↩↩↩↩↩↩↩↩↩↩↩↩↩↩↩↩↩↩↩↩↩↩↩↩↩↩↩
-
NYCB's Exposure to Rent-Stabilised Housing Signals Broader US Real Estate Pain — Financial Times, 2024-02-07 ↩
-
New York Community Bancorp, Inc. Completes Acquisition of Flagstar Bancorp, Inc. — PR Newswire, 2022-12-01 ↩
-
FDIC Formally Approves Purchase and Assumption Agreement for Signature Bank Assets — Federal Deposit Insurance Corporation, 2023-03-19 ↩
-
NYCB Names New Chairman After Moody's Downgrades Bank's Credit Rating to Junk — CNBC, 2024-02-07 ↩↩
-
NYCB Names DiNello as CEO, Takes $2.4B Impairment Charge — Banking Dive, 2024-03-01 ↩
-
New York Community Bancorp, Inc. (NYSE: NYCB) Securities Fraud Class Action — Kessler Topaz Meltzer & Check, LLP ↩
-
New York Community Bancorp, Inc. Announces Over $1 Billion Equity Investment Anchored by Former U.S. Treasury Secretary Steven T. Mnuchin's Liberty Strategic Capital, Hudson Bay Capital and Reverence Capital — Flagstar Financial, Inc., 2024-03-06 ↩↩↩↩
-
Ex-Trump Treasury Secretary Eyes More Voting Power at Flagstar — American Banker, 2024-11-01 ↩↩
-
New York Community Bancorp, Inc. Announces Effectiveness of One-for-Three Reverse Stock Split — Flagstar Financial, Inc., 2024-07-11 ↩
-
New York Community Bancorp, Inc. Changes Name to Flagstar Financial, Inc. and Stock Symbol to FLG — PR Newswire, 2024-10-15 ↩
-
Flagstar Financial, Inc. Announces Actions to Enhance Its Corporate Structure by Merging Holding Company into the Bank — PR Newswire, 2025-07-24 ↩
-
Flagstar Financial, Inc. Announces Receipt of Required Regulatory Approvals to Merge Holding Company into Its Bank — PR Newswire, 2025-10-06 ↩
-
Amid Turnaround, Flagstar Rewards CEO Otting, Names Co-Presidents — American Banker, 2026 ↩
-
Flagstar Bank, N.A. Announces Sale of Its Mortgage Servicing Business — PR Newswire, 2024-07-25 ↩
-
NYCB Offloads Mortgage Servicing to Mr. Cooper for $1.4B — Banking Dive, 2024-07-25 ↩
-
Flagstar Bank, N.A. 2025 Annual Report on Form 10-K — Flagstar Bank, N.A., 2026 ↩
-
Flagstar Bank Returns to Profitability in Fourth Quarter 2025 — Flagstar Bank, N.A., 2026-01-30 ↩↩↩↩↩↩↩
-
Flagstar Financial Q4 Earnings Beat, NII Rises Y/Y, Expenses Fall — Zacks via Yahoo Finance, 2026-01-30 ↩
-
The Effect of Size Thresholds on Large Banks under the 2019 Tailoring Framework — Federal Reserve Bank of Cleveland, 2026 ↩
-
Flagstar Q1 2026 Slides: Profitability Continues, C&I Growth Offsets CRE Runoff — Investing.com, 2026-04-24 ↩
-
Landlords Sue Rent Guidelines Board Over Mamdani's Rent Freeze — The Real Deal, 2026-07-22 ↩
-
NYC Landlords Sue Rent Guidelines Board Over Rent Freeze — Commercial Observer, 2026-07 ↩
 LinkedIn
 WhatsApp
 Reddit
 Hacker News
 Email
Email Kindle
 RSS Feed
 Spotify
 Apple Podcasts
 Amazon Music
 Audible
 YouTube