Fastenal Company: The Nuts & Bolts Empire
I. Introduction & Episode Roadmap
On the morning of July 14, 2026, an executive who had spent three decades explaining a nuts-and-bolts business to Wall Street picked up the phone for his final earnings call as chief executive. Daniel L. Florness had joined Fastenal in June 1996, served as chief financial officer for nearly twenty years, and led the company for a decade. On his final call, Florness skipped a valedictory address to focus on an operational shortfall.
"If I was being 100% candid," Florness told analysts, "I would have felt a hell of a lot better about the quarter if our incremental margin would have been 24%."[^1] By most external measures, the quarter had been strong: daily sales rose 14.7 percent, operating margins expanded slightly, and return on invested capital reached a decade-plus high. Yet the outgoing chief executive spent his final hour on the call dwelling on the two to three percentage points of contribution margin the company failed to capture.
That focus offers a clear view into Fastenal, a business built on testing how much operational discipline is worth when selling commodity products. Fastenal distributes hex bolts, washers, cutting tools, nitrile gloves, and janitorial supplies. Nothing in its catalog is proprietary or difficult to source. Yet, from a single rented storefront in Winona, Minnesota, it has grown into an enterprise generating roughly $8.2 billion in annual sales, nearly $1.3 billion in net income, and a return on invested capital that Florness described on that call as sitting "in the low-30s" — a number that would flatter a software company.[^1]1
The core paradox
How does a distributor whose average line item costs less than a cup of coffee generate those economics? The explanation lies in a shift in value proposition: Fastenal does not simply sell fasteners; it sells supply-chain reliability. A stalled assembly line can cost a manufacturer thousands of dollars per minute, and a missing 40-cent bolt can cause the stoppage. Fastenal embeds inventory, hardware, and often its own employees directly inside customer facilities so parts never run out — charging for that certainty through gross margins on commodity parts.
That model has sustained the business for four decades, but it faces pressure in gross margin efficiency. Fastenal's gross margin was 45.0% in 2025, down from levels in the low 50s two decades ago, and it contracted another 75 basis points year over year in the second quarter of 2026.[^1]1 Management presents this compression as intentional — arguing that trading gross margin percentage for larger customer accounts and higher total profit dollars is a deliberate strategy rather than an execution failure. Evaluating whether that tradeoff holds over time requires examining how sales channels have evolved.
The 2026 turning point
Florness stepped down as CEO on July 16, 2026, handing leadership to Jeffery M. Watts, a thirty-year Fastenal veteran who had served as president and chief sales officer. The board had telegraphed the move on December 19, 2025, and Florness agreed to stay on as a strategic adviser into early 2028; he also resigned from the board on the transition date, with Watts appointed to fill the seat.23 The leadership change followed an established transition period: Watts had co-led quarterly earnings calls as president since 2024 and opened the July 2026 call himself.
Roadmap
The story unfolds across five main sections. First, the origin: a failed vending machine prototype in 1967 and the pivot that established a branch network. Second, the branch network — the expansion of small-town industrial storefronts through the 1980s, 1990s, and 2000s, alongside sub-brand and international experiments that yielded mixed results. Third, the channel shift: Fastenal closing more than a third of its retail branches while roughly doubling revenue, as vending machines, RFID bins, and in-plant Onsite locations moved the point of sale from the store to the factory floor. Fourth, operating mechanics — the captive trucking fleet, unit economics, and an incentive structure tying compensation to returns on capital. And fifth, competitive dynamics: evaluating how the business holds up against rivals like W.W. Grainger and Amazon Business, as well as its resilience across industrial cycles.
The central question is whether Fastenal operates as a structurally advantaged compounder or an exceptionally disciplined cyclical distributor benefiting from favorable end markets.
 Subscribe on LinkedIn
II. Origins: Winona, the 11-Year-Old's Dream, & the First Vending Failure (1967–1986)
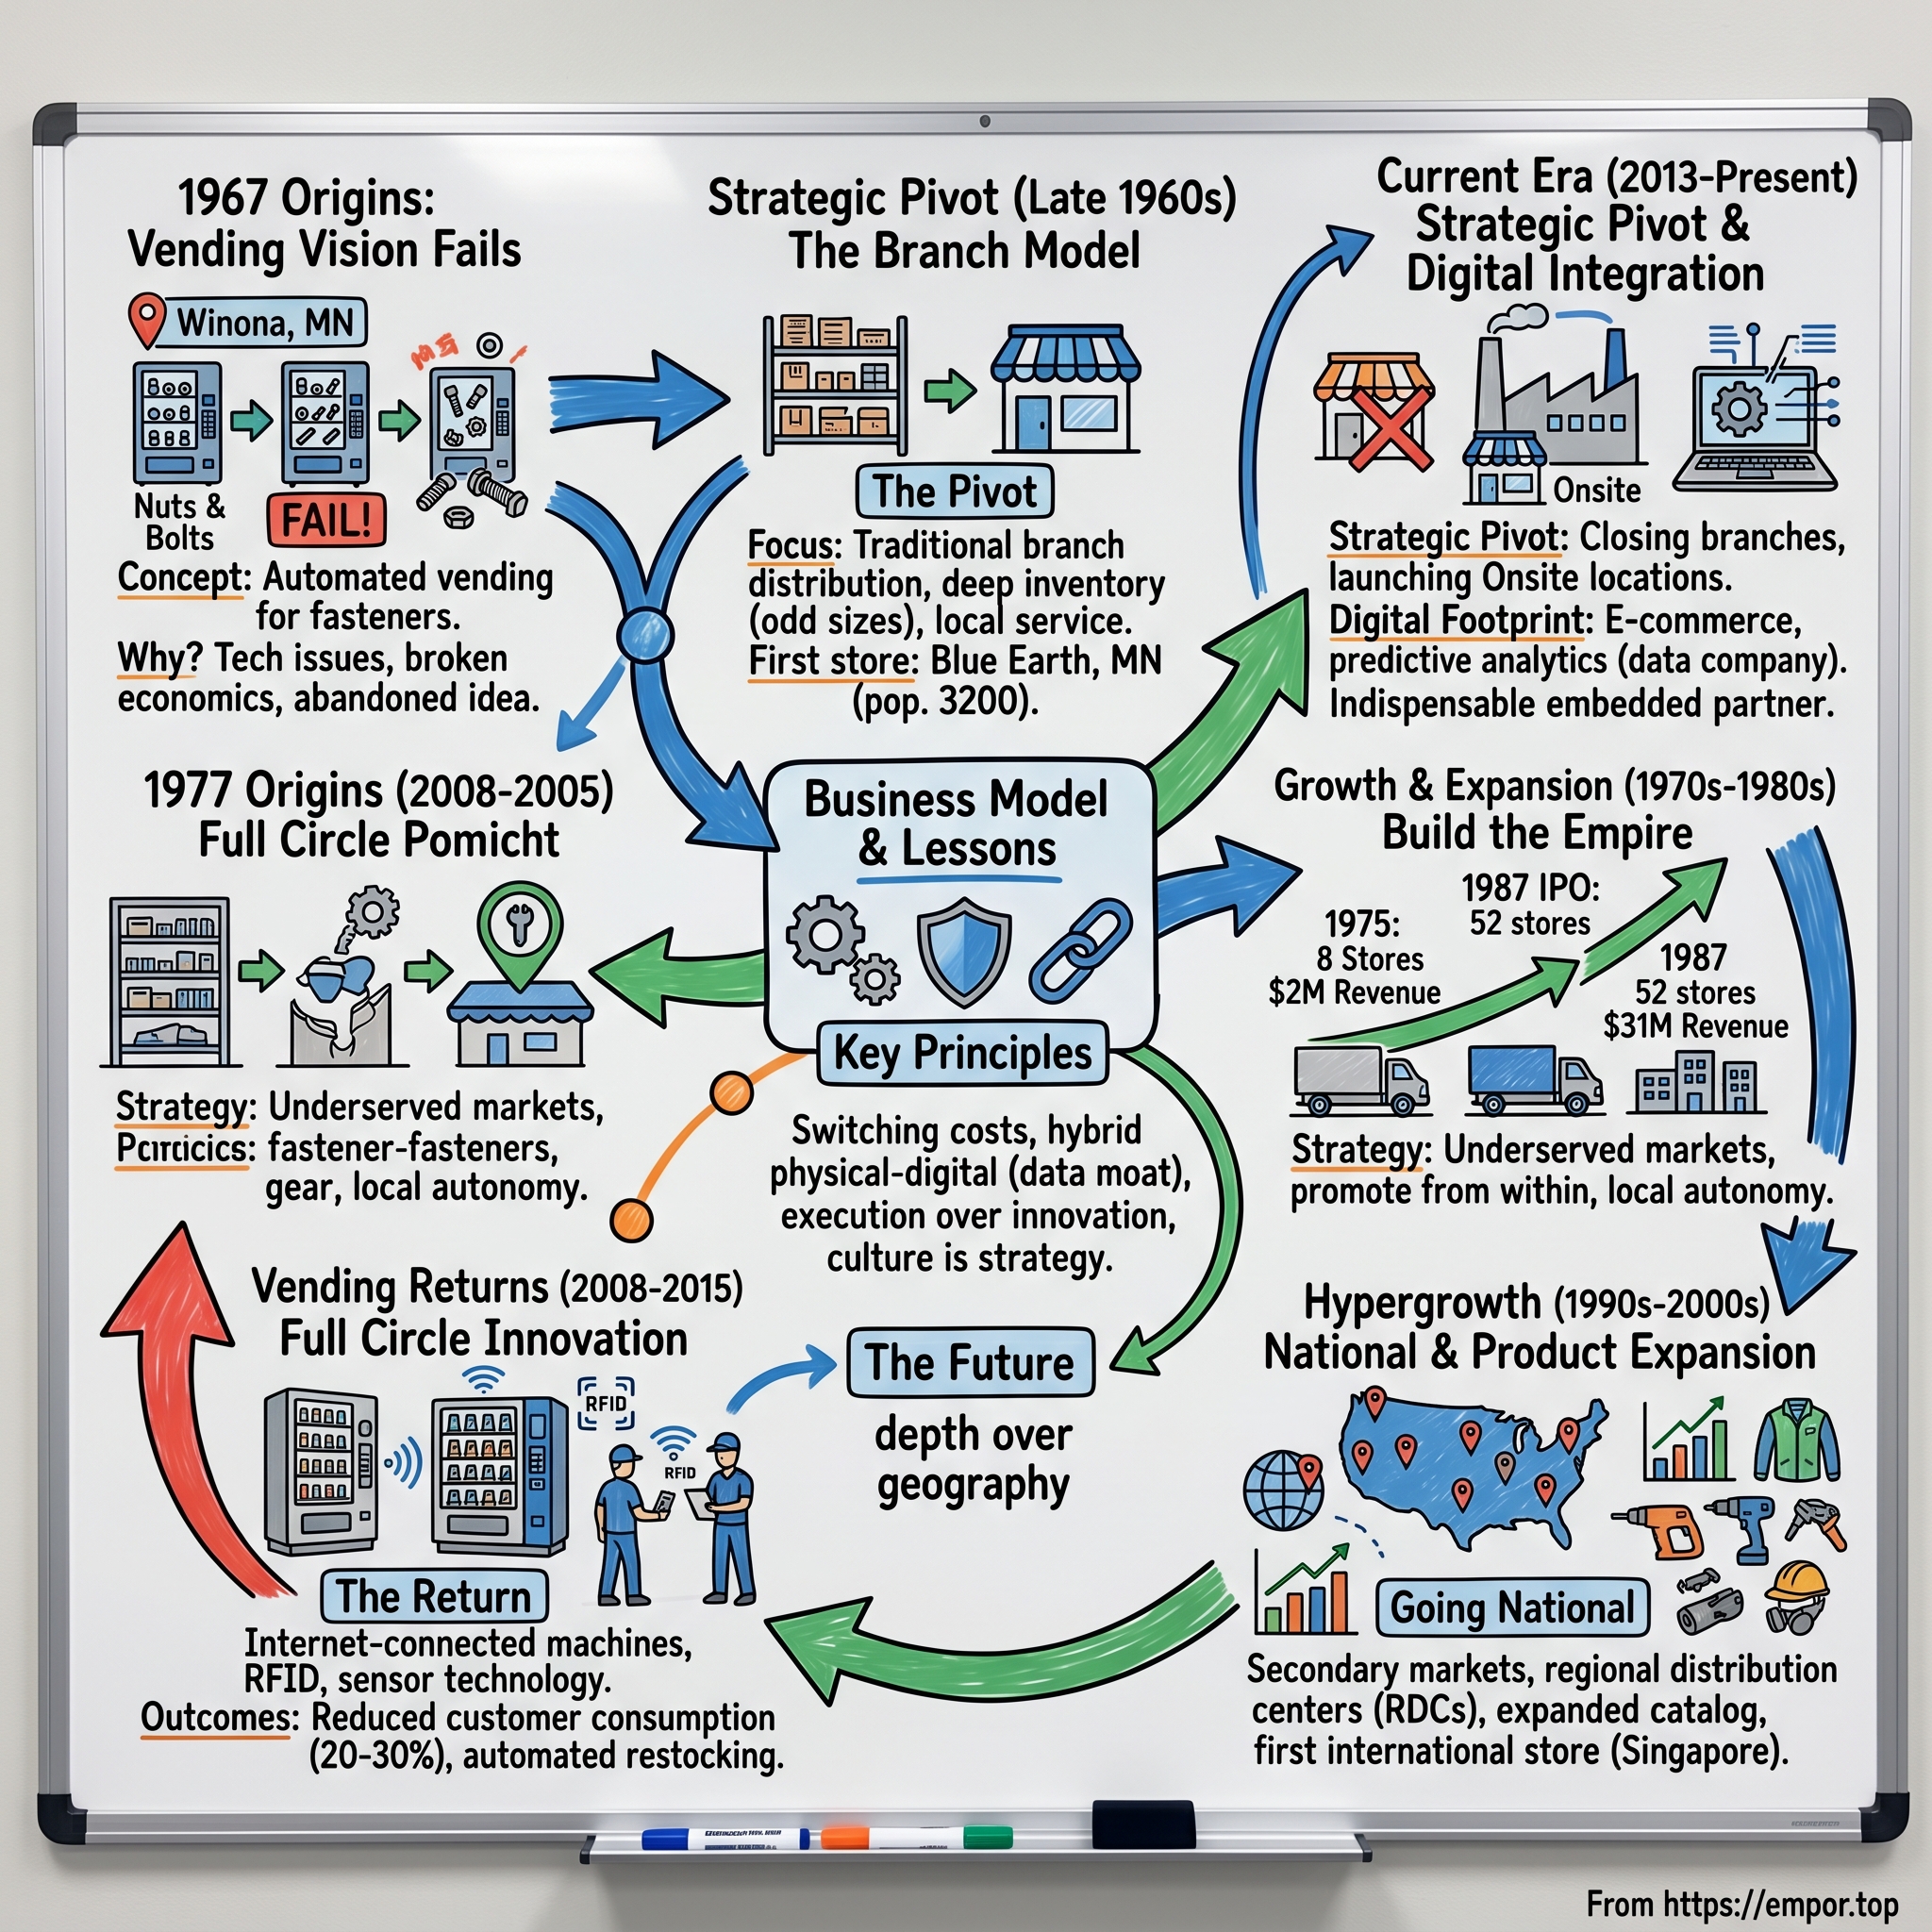
As an eleven-year-old working behind the counter of his father's auto supply shop in Winona, Minnesota — a Mississippi River town of about 25,000 people with a dense industrial base — Robert A. Kierlin observed a recurring problem. Farmers and machinists frequently came in seeking specific threaded fasteners that the shop lacked, forcing them to drive to the next town. Watching customers leave empty-handed formed a conviction that would take Kierlin forty-three years to fully execute: the primary issue was not price, but availability, and availability could be solved by a machine.4
Kierlin studied mechanical engineering, earned an MBA, and joined IBM. While there, he wrote a business plan for the idea he had contemplated since childhood — selling threaded fasteners through vending machines, eliminating the overhead of a staffed store entirely.45 In 1967, his sketches for automated dispensing sat roughly twenty years ahead of affordable sensor technology and forty years ahead of the digital connectivity needed to run such a network.
The five partners and $31,000
In 1967, Kierlin recruited four partners: IBM colleague Jack Remick and Winona associates Van McConnon, Steve Slaggie, and Mike Gostomski. The five pooled roughly $31,000 and opened in Kierlin's father's former auto shop in downtown Winona.45 The initial strategy relied on unmanned retail, setting up small storefronts lined with franchised vending machines dispensing nuts and bolts.
The concept failed almost immediately for reasons that echo throughout Fastenal's history. Unlike uniform consumer items, fasteners vary in weight by two orders of magnitude, feature irregular shapes, tangle easily, and sell in unpredictable quantities ranging from four units to four thousand. Mechanical dispensing technology in the late 1960s could not handle that operational variance reliably. The founders switched to a traditional retail model after running into execution problems they could not engineer around.4
The accidental model
The branch business that replaced the vending concept proved far better suited to the era. Fastenal developed a service-intensive model built around small storefronts, branch managers with deep local relationships, a broad bin inventory of hard-to-find parts, and rapid delivery directly to customer sites. Kierlin targeted small industrial towns ignored by national distributors — places with active manufacturing or construction sites but insufficient overall demand to justify a large regional sales office. By establishing storefronts in those underserved markets, Fastenal often became the only local industrial supplier within an hour's drive, securing a durable form of localized pricing power.
Kierlin managed the business with disciplined frugality, establishing a culture based on internal promotion, modest executive compensation, and decentralized branch authority. He remained with the company for decades until his death on February 10, 2025, at age 85, by which time he had become one of Minnesota's prominent philanthropists, having funded schools, a marine art museum, and community programs in Winona.4
Testing the origin story
A common narrative suggests Fastenal was simply a visionary idea ahead of its time. A closer examination reveals a more complicated reality. The initial vending experiment consumed a significant portion of the founders' limited seed capital before generating revenue and ultimately delayed automated dispensing at the company by four decades — Fastenal did not deploy vending at scale until around 2010.5 The early vision did not accelerate the company's path to scale; rather, the concept required decades of external technological advances — including low-cost sensors, connected devices, and cheap computing power — before becoming commercially viable.
A second structural vulnerability marked Fastenal's early years: the company relied entirely on third-party regional wholesalers for inventory. This dependence made Fastenal a price-taker on goods sold and left its availability subject to external fill rates. Building captive sourcing and internal distribution infrastructure throughout the 1970s transformed a loose group of hardware stores into an integrated distribution system with a distinct cost advantage. The initial lesson of Fastenal's origin is that distribution moats stem not from novelty, but from the physical and logistical network built beneath the business model.
By the mid-1980s, Fastenal possessed that infrastructure in embryonic form alongside a repeatable branch template. What it lacked was the capital required to scale it. That limitation was ultimately solved in the most ordinary way available.
III. Building the Branch Empire & Going Public (1987–2007)
Fastenal listed on NASDAQ under the ticker FAST in 1987, just weeks before the October crash wiped out roughly a fifth of U.S. equity market value in a single session.4 For a newly public company operating a few dozen stores across Minnesota and neighboring states, the market turmoil created an immediate test of financial resilience.
Fastenal was insulated, however, by a defining feature of its financial strategy: it carried virtually no debt. Robert Kierlin’s balance-sheet conservatism ensured the crash remained a stock quotation rather than a solvency crisis. By funding store expansion entirely out of operating cash flow, Fastenal opened locations one at a time, scaling strictly at the pace cash generation allowed.
The flywheel, such as it was
The branch expansion relied on a straightforward unit-economic loop. Fastenal selected towns with populations between 5,000 and 50,000 anchored by manufacturing or construction employment. Each store opened with two or three employees, typically promoted from existing locations, and a localized inventory of fasteners. The branch manager built relationships with local plants, adjusted inventory to match regional demand, and brought the store to profitability within two years—generating cash flow to fund subsequent branch openings.
Two structural dynamics compounded this growth. First, each additional branch increased regional distribution density, lowering logistics costs across nearby stores—a route-density advantage unmatchable by single-location competitors. Second, Fastenal steadily broadened its inventory. While fasteners initially attracted industrial buyers, the company added hand tools, power tools, cutting equipment, abrasives, safety gear, and janitorial products, expanding average basket size per customer.
This network model drove rapid physical expansion. From several dozen stores at its initial public offering, Fastenal surpassed 2,000 locations by 2007 and continued toward a peak of roughly 2,700 branches early in the following decade.6 For years, store count served as the primary benchmark of growth for both management and Wall Street—a focus that would later prove misaligned with evolving customer requirements.
The economics nobody put in a press release
Understanding the economics of the traditional branch reveals why the model succeeded so dramatically—and why it eventually required restructuring.
Fasteners present a distinct inventory challenge. Stock keeping units span hundreds of thousands of variations across diameter, thread pitch, length, head style, material, and grade. Manufacturing facilities relying on specific fasteners require complete availability; a shortage of a single 40-cent bolt can shut down an entire assembly line. Because manufacturers seek to minimize working capital and broad catalog distributors avoid holding low-turnover inventory, a supplier holding local inventory commands significant pricing power.
Consequently, fasteners historically commanded gross margins far above general industrial distribution categories, anchoring Fastenal’s high returns. The individual branch operated as an efficient working-capital asset: modest inventory housed in low-cost real estate with small headcount, generating attractive return on capital despite small transaction sizes.
However, the model contained a structural assumption that remained unchallenged for decades: customers were paying for product proximity, but Fastenal was funding physical retail storefronts. As long as physical branches were necessary to provide local availability, the economics compounded cleanly. Once digital logistics and automated inventory systems enabled proximity without dedicated retail space, physical storefronts shifted from competitive assets into fixed overhead.
Going abroad
Initial international expansion targeted Canada and Mexico as direct extensions of Fastenal's North American trucking routes. In 2001, the company opened a site in Singapore, establishing its first presence outside North America. By 2025, Fastenal operated branches across 25 countries.1 Yet international operations remained a minor contributor to total revenue, offering clear evidence about the underlying mechanics of Fastenal's business model.
What the expansion era disconfirms
Two operational limitations from this era clarify the true nature of Fastenal's competitive moat.
The first was the FastTool experiment. During the 1990s, Fastenal launched standalone retail stores dedicated to power tools and hand tools. The format failed to generate acceptable economics: tooling inventory turned far more slowly than fasteners, dedicated store overhead squeezed margins, and locations frequently cannibalized sales from nearby standard Fastenal branches. Management eventually closed the standalone concept and reintegrated tool inventory into primary branches. The failure demonstrated that Fastenal's advantage was not merchandising capability or retail branding, but rather high inventory velocity paired with local route density. Without that logistical backbone, standalone storefronts faced standard retail pressures.
The second limitation involves international margin drag. Branches in Europe and Asia consistently struggled to match North American operating margins. Fastenal's core advantage relies on a dense network of distribution centers, captive trucking routes, and clustered branches that minimize marginal delivery costs. In international markets lacking that network density, isolated branches functioned as high-cost standalone operations. This structural dynamic indicates that Fastenal's moat is geographic and logistical rather than brand-driven, making regional network density difficult to export without substantial capital deployment over extended periods.
By 2007, Fastenal operated a highly profitable network of more than 2,000 stores. However, two impending shifts were about to alter its trajectory: the 2008 global financial crisis and the maturation of digital technologies that finally enabled automated inventory dispensing at scale.
IV. The Great Pivot: From Stores to Onsite & Digital FMI (2008–2025)
The operational shift is best understood on the factory floor. In the traditional distribution model, a maintenance technician needing a specific grade-8 bolt walks to a supply crib, searches through bins, or drives several miles to a local storefront—spending forty minutes of paid time retrieving a part worth less than a dollar. In the automated model, the technician walks twenty feet to an inventory dispensing unit, scans a badge, enters a code, and retrieves the hardware. Fastenal's system logs the transaction against the employee ID, tracks inventory levels in real time, and triggers automated replenishment before the dispensing coil empties.
This system—FASTVend—realized Robert Kierlin's 1967 vision four decades later. The primary barrier in 1967 was not mechanical design, but the absence of low-cost, networked, and accountable monitoring technology. Because the platform records every transaction by user, installing these machines typically reduces customer product consumption significantly; when workers must scan an ID to retrieve safety gloves or cutting tools, operational waste declines.
The counterintuitive bargain
The commercial strategy carries an inherent tension: Fastenal approaches customers with a proposal to reduce their total spending on the products it sells. Item consumption frequently drops by 20 to 30 percent following machine installation.
A distributor accepts lower per-unit volume because the technology secures a larger share of the customer's overall industrial supply budget. A manufacturing plant using Fastenal for automated inventory management rarely splits purchase orders among multiple regional suppliers. Fastenal captures a larger share of wallet while embedding its operations deeply into the customer facility—making supplier replacement difficult, as doing so requires removing physical hardware, redesigning replenishment workflows, and unwinding enterprise resource planning integrations.
By the end of 2025, Fastenal's installed base reached approximately 124,000 FASTVend devices, while total Fastenal Managed Inventory installations—combining FASTBin and FASTVend units—measured 136,638 machine-equivalent units; sales through these systems reached $3.71 billion, representing 44.7 percent of total company revenue.1 FASTBin forms the secondary component of the platform, utilizing radio-frequency identification tags and infrared sensors to monitor bin levels or weight without manual keypad entries, accommodating high-frequency, low-value items where badge scanning creates unnecessary friction.
How the plumbing actually works
Strip away corporate branding, and Fastenal's technology architecture operates across three core functions.
The first function is sensing. FASTVend records inventory movement through badge scans and selection inputs. FASTBin performs the same function without manual intervention, deploying infrared sensors to detect bin depth, scales to measure weight, or radio-frequency identification tags that workers flip when a bin empties—deploying lower-cost sensing methods on lower-value parts.
The second function is translation. Consumption data automatically generates replenishment orders without manual purchase order creation. Sales representatives no longer conduct manual bin counts, and customer purchasing departments receive consolidated electronic invoices rather than processing hundreds of individual orders each month.
The third function is accountability, which provides the primary commercial value for enterprise customers. Detailed dispensing logs transform consumable items into tracked operational costs. Plant managers gain visibility into usage patterns across shifts and departments—delivering management data previously unavailable to industrial buyers.
Understanding this architecture is essential for evaluating Fastenal's competitive position. Sensing technology is largely commoditized and available from hardware manufacturers. Order translation requires software and workflow integration, which presents a higher barrier but remains replicable. Defensible switching costs reside primarily in the third layer: historical consumption data, deep integration into customer enterprise systems, and established operational routines.
The Onsite trade, in plain numbers
An Onsite placement represents a deeper operational commitment than a dispensing machine. Fastenal positions inventory, dedicated personnel, and square footage directly within a customer's facility. In exchange, the company captures a dominant share of that facility's industrial supply purchases, gains real-time consumption visibility, and secures multi-year customer commitments.
The trade-off involves accepting lower gross margin percentages and reduced labor leverage. Large enterprise customers leverage their volume to negotiate lower pricing, while dedicated onsite staff cannot serve adjacent accounts. Consequently, an Onsite deployment transforms a high-margin, low-volume account into a lower-margin, high-volume relationship. The economic model relies entirely on volume expansion sufficient to offset dedicated operating expenses.
While large manufacturing plants generate sufficient volume to justify these fixed costs, smaller facilities eventually hit a threshold where unit economics deteriorate. Fastenal has not disclosed the precise revenue threshold required for Onsite profitability, leaving open questions regarding the total addressable market remaining for profitable Onsite expansion.
Closing a third of the stores
As inventory relocated directly to customer floors, the role of traditional retail branches diminished.
Management responded by restructuring the retail network. From a peak near 2,700 locations, Fastenal systematically consolidated its footprint, ending 2025 with 1,595 branches across 25 countries.1 This represented a reduction of more than one-third of its physical stores. Over the same timeframe, annual revenue grew from $3.3 billion in 2012 to $8.2 billion in 2025.1
Expanding revenue while reducing store count required management to pivot away from branch growth—the primary performance metric that had defined the company's capital allocation strategy for more than two decades.
Onsite, and the reporting change nobody should skip past
The deployment of customer-dedicated Onsite locations expanded rapidly, surpassing 2,000 active sites by the end of 2024.6
In 2025, Fastenal altered its financial reporting structure. Beginning that fiscal year, the company discontinued separate count disclosures for public branches and dedicated Onsites, transitioning to a reporting metric based on monthly customer spend tiers. Under this new format, Fastenal reported a monthly average of 98,361 sites served and 250,845 unique sites served across the full year.1 By the second quarter of 2026, management reported that total contract counts rose over 7 percent, while customer sites spending at least $50,000 per month grew 16.5 percent, driving a revenue increase of over 26 percent from that high-volume cohort.[^1]
While spend-per-site metrics provide insight into account economics, the change eliminated standalone Onsite location counts. That metric had served as the primary benchmark for tracking the expansion rate of Fastenal's embedded distribution model across multi-year periods.
Where the pivot narrative overstates itself
Three aspects of Fastenal's operating record qualify the narrative of a seamless strategic transformation.
First, branch consolidation reflected necessary network correction as well as forward planning. Management acknowledged that the prior focus on store-count expansion led to overbuilding in locations where customer density failed to justify fixed overhead. Consequently, store closures represented the cost of earlier overexpansion.
Second, the automated vending deployment encountered operational hurdles. Early FASTVend installations experienced hardware reliability issues and elevated field service costs, while low-volume placements at smaller customer facilities failed to generate sufficient gross profit to offset hardware capital costs. Fastenal subsequently instituted minimum spend thresholds for machine installations, establishing an operational lower bound that limits automated dispensing penetration among smaller accounts.
Third, management adjusted its digital revenue targets. On the July 2026 earnings call, Chief Executive Officer Jeffery Watts revised the 2026 digital footprint projection to between 63 and 64 percent of sales, noting it was "modestly below our original target of 66%."[^1] Watts attributed the revision to rapid growth in non-digital sales from large account wins—a broader revenue denominator—rather than slowing adoption. While this explanation aligns with the reported 16.2 percent growth in digital daily sales, long-term trajectory depends on whether digital sales growth consistently outpaces overall company growth, as it did in the second quarter of 2026.
Fastenal's strategic pivot has restructured its distribution model, but the transition involved substantial capital investment, network rationalization, and ongoing adjustments to customer eligibility thresholds.
V. Current Management, Leadership Succession, & Governance (2026–Present)
Daniel Florness brought an unconventional communication style to executive leadership. On the July 2026 earnings call, he moved from historical return on invested capital to an anecdote about twice urging his chief financial officer to raise the dividend, before disclosing that Fastenal spends roughly $1.6 billion annually on personnel costs and pondering how much the company should invest in artificial intelligence tools that might boost workforce productivity by 5 to 10 percent.[^1] Though circuitous, the candor provided analysts with detailed operational insight.
The handover
Florness notified the board of his decision on December 19, 2025, and stepped down as chief executive officer on July 16, 2026, ending a ten-year tenure as CEO and three decades of executive service that included serving as chief financial officer from 1996 to 2015.239 Jeffery M. Watts, a thirty-year company veteran who advanced through the sales organization, assumed the chief executive role the same day.
The transition followed deliberate long-term planning. Watts was appointed president in August 2024 after serving as chief sales officer since roughly 2023—a role in which he initiated personnel realignments that Florness credited directly for accelerating revenue growth in 2026.[^1]3 Florness framed the 2026 market share gains as the direct result of leadership decisions executed during 2023 and 2024.
Watts inherits a strategy he helped execute—including the key-account expansion, the growth of the Fastenal Managed Inventory device base, and the shift toward higher-volume customer facilities. While he inherits a highly profitable business rather than a turnaround, he faces a distinct strategic challenge: with the shift from traditional branches to in-plant locations largely complete, future growth depends on whether embedded distribution can sustain market share gains once the largest and most profitable manufacturing plants are fully converted.
The finance department also experienced leadership turnover. Max H. Tunnicliff served as chief financial officer through the transition, succeeding Holden Lewis, whom Florness credited with instilling the capital discipline that drove strong returns on invested capital over the preceding decade.[^1] Attributing the company's benchmark financial metric to his predecessor underscored the institutional emphasis on return discipline.
Pay that actually bites
Fastenal's compensation structure serves as an important driver of its operating discipline. Florness noted that proxy disclosures show employees receive "a piece of pretax growth," an arrangement extending "very deep into the organization."[^1]7 During the July 2026 earnings call, Florness illustrated the mechanism: operating income increased by $45.3 million in the first quarter of 2026 and $65.7 million in the second quarter—a 45 percent rise in dollar growth—with company-wide bonus pools expanding in direct proportion.
This incentive model generates three distinct operating effects. First, because incentives are tied to absolute profit growth rather than margin percentages, field managers prioritize total dollar profitability over defending percentage margins. Second, aligning compensation with return on invested capital and working capital efficiency penalizes excess capital deployment, directly discouraging field managers from carrying redundant inventory. Third, the structure renders selling, general, and administrative expenses variable, suppressing incremental margins during periods of strong performance. Fastenal's second-quarter 2026 incremental margin fell short of internal targets partly because higher profit growth triggered larger bonus accruals, absorbing potential margin expansion by design.
Capital allocation, and the honest version
Fastenal's approach to capital allocation distinguishes it from industrial distribution peers. Rather than relying on large acquisitions, the company developed its Onsite locations, FASTVend dispensing machines, FASTBin monitoring technology, and captive trucking fleet entirely through organic investment. In the second quarter of 2026, Fastenal returned approximately $350 million to shareholders—representing roughly 80 percent of net income—primarily through dividends alongside modest share repurchases.[^1] Management raised the quarterly dividend to $0.26 per share, establishing a $1.00 annualized rate following a 2-for-1 stock split executed in May 2024.[^1]6
This capital allocation strategy presents two key considerations. First, the reliance on organic development leaves the company without experience in large-scale corporate integration should it ever need to acquire external capabilities. Second, capital intensity is increasing. Management projected full-year 2026 net capital expenditures of approximately $320 million, or roughly 3.5 percent of sales, compared with a five-year average near 2.5 percent and a historical decade average near 4.0 percent.[^1] CFO Max Tunnicliff characterized the increase as a normal cyclical investment phase for distribution hubs, automation, and dispensing hardware, though the resulting free cash flow impact will precede the financial returns by several years.
Guidance discipline as a two-sided trait
Fastenal abstains from providing quarterly earnings-per-share forecasts, and management explicitly declined on the second-quarter 2026 call to project gross margins without significant market shifts.[^1] While this approach avoids short-term management of expectations, it increases equity price volatility around quarterly earnings announcements. During the 2015–2016 industrial downturn and the 2022–2024 manufacturing contraction, quarterly results missing consensus estimates triggered sharp stock pullbacks. Withholding formal guidance does not eliminate cyclical demand volatility; rather, it shifts market reactions directly to quarterly financial releases.
Employee productivity metrics further illuminate the trade-offs of the embedded model. Sales per employee rose substantially during the 2010s as Fastenal consolidated retail branches and automated routine transaction processing. With 24,489 employees generating $8.2 billion in sales at year-end 2025, revenue per employee reached approximately $335,000.1 However, productivity growth has slowed relative to historical trends due to the operational demands of Onsite locations, which require dedicated on-site personnel. While Onsite conversions drive top-line expansion and strengthen customer retention, they require proportional headcount additions, placing a structural limit on long-term operating leverage.
VI. Business Model Deep-Dive: Distribution as a Service & Economic Moats
At three in the morning somewhere in the Midwest, a Fastenal semi runs a lane from a regional distribution hub toward a cluster of local branches and in-plant customer sites. The vehicle looks ordinary, but its operation is central to Fastenal's business model: it is a company-owned truck carrying captive freight along a custom route. Roughly 90 percent of the company's tonnage moves through this captive network rather than via UPS, FedEx, or third-party less-than-truckload carriers.6
This captive logistics infrastructure represents one of the company's most essential operational assets.
The freight arbitrage, explained simply
Most industrial distributors rely on third-party parcel shipping. When a customer orders eleven items, eleven individual boxes move through a parcel network at a fixed per-package fee regardless of item value. On a nine-dollar box of washers, parcel shipping fees can absorb the entire gross profit.
Fastenal avoids this cost structure for the vast majority of its product volume. Instead, the company consolidates orders into reusable totes, moves them on scheduled internal line-haul routes between regional distribution hubs, delivers them to local branches and Onsite locations, and completes final-mile deliveries using company vans. Because the marginal cost of adding an extra tote to an active route is negligible, Fastenal can profitably deliver low-value items in small quantities at price points that competitors cannot match.
This route-density structure generates three operational advantages. First, it shelters the company from third-party freight rate spikes, keeping Fastenal's cost structure stable when parcel and less-than-truckload rates increase. Second, it shifts diesel inflation into cost of goods sold rather than selling, general, and administrative expenses, as Florness highlighted on earnings calls.[^1] Third, it preserves delivery schedules, supporting the supply-chain reliability that underpins Fastenal's customer relationships.
However, captive logistics requires high route density. A private fleet represents a fixed-cost asset that requires a minimum threshold of stops per route to outperform commercial parcel rates. This requirement explains why Fastenal's international branches have historically underperformed North American operations and why smaller regional distributors have struggled to replicate the model. The logistics barrier protects dense markets while restricting profitable expansion into low-density regions.
What Fastenal actually sells, by category
Fasteners accounted for 30.5 percent of 2025 sales, safety supplies generated 22.2 percent, and the remainder spanned cutting tools, abrasives, janitorial supplies, and material handling equipment.1 This product mix highlights an important margin dynamic. Fasteners command the highest gross margins because they represent a fragmented, service-intensive, and infrequently comparison-shopped category; however, they are highly cyclical because consumption ties directly to factory production volumes. By contrast, safety products and general maintenance items generate lower gross margins but produce steadier demand, remaining necessary whenever a facility is open. Fastenal's emphasis on categorizing sales into direct production materials and indirect facility supplies reflects this distinction. In the second quarter of 2026, sales across both categories grew in the mid-teens, with direct production supplies expanding slightly faster—indicating that top-line growth was driven by active factory output rather than baseline facility maintenance.[^1]
Exclusive brands and the second margin pool
Fastenal also generates margin expansion by selling an increasing share of products under its exclusive private brands. On his final earnings call, Florness highlighted exclusive-brand penetration as a structural capability that would strengthen the company's operating position over the next five to ten years.[^1]
The economic mechanism relies on direct sourcing. By procuring items directly from manufacturers and distributing them under private labels, Fastenal captures the profit margin typically retained by brand-name suppliers while offering lower prices to customers. This private-label strategy serves as a key counterweight to gross margin compression from large enterprise accounts, as it represents an internal lever fully within Fastenal's operational control. In addition, qualifying exclusive-brand parts into a customer's production specifications creates product-level switching costs, making supplier replacement more difficult.
However, exclusive brands face category limitations. Private labels perform well in commoditized categories with flexible specifications—such as abrasives, protective gloves, and general maintenance items—but face resistance in precision production fasteners, where customer engineering schematics often require specific approved manufacturers. While exclusive brands expand profitability in select categories, they cannot fully offset broader margin compression across the business.
Working capital: the part that does not show up in the story
Managing working capital presents a continuous challenge for industrial distributors. Fastenal's value proposition requires maintaining extensive local inventory of low-turnover parts, a requirement that can depress returns on capital if inventory control weakens. As a result, return on invested capital reflects a structural tension between customer demands for immediate part availability and an internal compensation structure designed to penalize excess inventory.
Recent financial results demonstrate how management balances this tension. In the second quarter of 2026, operating cash flow reached $266 million, representing approximately 70 percent of net income. This cash conversion rate fell below prior-year levels, which management attributed to higher accounts receivable following a 20 percent year-over-year sales surge in June, while noting that inventory efficiency improved without compromising fill rates.[^1] This shortfall stemmed from top-line expansion and trade credit rather than unsold inventory accumulation.
Nevertheless, rapid revenue expansion continuously consumes working capital. Periods of high cash conversion often coincide with slowing sales growth, as working capital requirements shrink alongside decelerating order volumes. Consequently, cash flow conversion at Fastenal often functions as an inverse indicator of near-term sales momentum, requiring analysts to evaluate cash generation alongside top-line trajectory.
The seven powers, honestly scored
Evaluating Fastenal through Hamilton Helmer's strategic framework reveals a distinct concentration of economic moats.
Process power represents Fastenal's most defensible advantage. The combination of captive line-haul routes, regional distribution centers, automated tote handling, and integrated branch and Onsite locations reflects fifty years of cumulative capital deployment and operational refinement. The system cannot be quickly replicated by competitors, as it requires both substantial capital and established regional customer density to operate efficiently.
Switching costs provide significant protection within managed customer accounts. Integrating FASTBin sensors and FASTVend dispensing units into a customer's facility—and connecting them to the enterprise resource planning system via electronic data interchange—creates substantial operational friction. Replacing Fastenal requires removing physical hardware, reconfiguring replenishment workflows, retraining workers, and risking production interruptions. However, these switching costs apply primarily to embedded inventory management; for unmanaged catalog purchases, customer switching costs remain minimal.
Counter-positioning offered historical advantages that have diminished over time. Fastenal intentionally cannibalized walk-in branch traffic to establish customer-embedded locations—a transition that traditional branch-focused distributors hesitated to make and online distributors could not execute physically. However, competitors such as W.W. Grainger and MSC Industrial Direct have since deployed vendor-managed inventory and automated dispensing systems of their own. As competitors adopted similar models, Fastenal's advantage shifted from structural counter-positioning to operational execution and logistics cost discipline.
Scale economies manifest primarily in procurement and exclusive-brand sourcing. By purchasing at volume and distributing private-label products, Fastenal captures both manufacturing and distribution margins, a benefit Florness highlighted as an explicit growth driver on his final call.[^1] Conversely, brand equity, cornered resources, and network effects contribute minimally to the company's competitive position, as industrial buyers select suppliers based on availability and landed cost rather than distributor brand recognition.
The margin question, unflinched
Fastenal's gross margin sat at 45.0% in 2025, against low-50s levels two decades earlier, and contracted about 75 basis points year over year in Q2 2026, of which roughly 40 basis points was net price/cost from tariffs and inflation, with smaller drags from customer mix, transportation, and rebates.[^1]1
Management maintains that the mix-driven component of gross margin compression is intentional: larger enterprise customers carry lower gross margin percentages but generate higher incremental profit dollars, improve fixed-cost leverage, and add to operating margins.[^1] Chief Financial Officer Max Tunnicliff noted that customer mix shifts can moderate gross margin percentage while supporting absolute dollar profitability.
The operational record offers partial support for management's position. In the second quarter of 2026, selling, general, and administrative expenses improved to 23.5 percent of sales from 24.4 percent in the prior-year period, more than offsetting gross margin contraction and generating five basis points of operating margin expansion.[^1] Over a ten-year period, Florness described a long-term trajectory of roughly 60 basis points of gross margin contraction alongside stable to expanding operating margins.[^1] This trade-off between gross margin percentage and operating profit growth has held across multiple operating cycles.
However, two qualifications complicate management's narrative. First, management estimated the ongoing drag from customer mix shift at approximately 15 basis points of gross margin contraction per year.[^1] This dynamic requires continuous selling, general, and administrative expense leverage simply to keep operating margins flat. Second, the price/cost drag reflects unrecovered tariff and input inflation, and management explicitly declined to commit to closing that gap in the second half of 2026.[^1] Attributing the entire gross margin decline to strategic repositioning conflates intentional customer mix tradeoffs with unrecovered input costs.
Fastenal has demonstrated an ability to convert gross margin percentages into operating profit dollars through operational leverage—provided top-line growth remains strong enough to leverage fixed overhead. In periods of flat or declining revenue, however, customer mix contraction operates without the benefit of fixed-cost leverage, making margin stability dependent on industrial volume cycles rather than structural guarantees.
VII. Competitive Landscape & M&A Benchmarking
In North American industrial distribution, no single distributor commands a dominant market share. The sector remains vast, deeply fragmented, and populated by thousands of family-owned regional suppliers. Consequently, competition centers less on capturing share in a static market and more on which distribution architecture will ultimately prevail.
W.W. Grainger is the scale leader in maintenance, repair, and operations (MRO) supplies, operating a fundamentally different business model centered on large centralized distribution centers, an extensive digital catalog, and high-growth e-commerce platforms like Zoro in the United States and MonotaRO in Japan. Grainger's model targets buyers seeking broad selection and digital ordering. In contrast, Fastenal relies on localized physical presence; while a Grainger customer orders from a screen, a Fastenal customer often triggers no manual order at all because an automated bin sensor handles replenishment.
MSC Industrial specializes in metalworking and cutting tools, offering deep technical expertise and its own vending and in-plant programs. However, MSC lacks Fastenal's captive logistics fleet and extensive network of physical customer endpoints, resulting in a structurally higher cost-to-serve on small orders.
Motion Industries, a subsidiary of Genuine Parts Company, focuses on power transmission, bearings, and industrial automation—competing for the same customer maintenance budgets from an adjacent product entry point.
The remainder of the market consists of a long tail of thousands of local distributors competing on regional relationships and same-day availability within a single metropolitan area. These independent suppliers represent the primary source of Fastenal's market share gains. When a manufacturing facility consolidates multiple local vendors into a single Onsite contract, revenue shifts directly from independent distributors to Fastenal.
Build versus buy
The strategic contrast between Fastenal and its national peers is distinct. While Grainger acquired and scaled Zoro and MonotaRO, and MSC acquired Barnes Distribution, Fastenal expanded organically. Every core component of its distribution infrastructure—including its private trucking fleet, regional distribution hubs, vending hardware, bin sensors, and proprietary software—was developed internally.
This organic approach directly supports Fastenal's financial returns. The company's return on invested capital in the low 30s is difficult to replicate with a balance sheet carrying substantial goodwill from corporate acquisitions, which permanently capitalize a seller's franchise value.[^1] Fastenal's invested capital consists primarily of inventory, fleet vehicles, facilities, and dispensing hardware acquired or built at cost.
However, an internal development strategy presents clear trade-offs. Building capabilities organically is slower than acquiring them, leaving Fastenal without a major presence in endless-assortment e-commerce, without an international growth driver comparable to MonotaRO, and with limited reach in channels capturing small-order digital purchases. On a return on capital comparison, operational discipline and a missing channel capability produce similar metrics.
The real battlefield is the fragmented tail
Industry coverage often frames competition as a direct contest among Fastenal, Grainger, and Amazon Business. In practice, daily market dynamics follow a different pattern.
Fastenal's reported market share gains rarely come directly from national peers like Grainger. Instead, share is captured from independent regional distributors—such as local bearing suppliers, family-owned safety houses, or specialized cutting-tool distributors lacking succession plans. While these local firms compete effectively on personal relationships and immediate responsiveness within a single city, they cannot bid on national contracts requiring standardized pricing, consolidated invoicing, electronic data interchange integration, automated device deployment, and dedicated staffing across dozens of customer facilities.
Fastenal's key-account strategy shifts the competitive criteria from local personal relationships to multi-site operational integration. Few distributors possess the physical and digital infrastructure required to fulfill enterprise-wide contracts.
This structural shift toward multi-site suppliers provides a long-term tailwind in a market that is consolidating slowly. However, market consolidation is a finite opportunity. Although the fragmented tail remains large, incremental share gains become progressively harder to achieve over time as remaining independent distributors tend to hold the most defensible local positions.
Tariffs and the sourcing question
Import cost dynamics represent an ongoing operational challenge. Because fastener supply chains are globally integrated, trade tariffs directly affect the landed cost of a significant portion of Fastenal's inventory. In the second quarter of 2026, net price and cost pressures generated a 40 basis point headwind to gross margin, representing a 10 basis point improvement from the first quarter. On the quarterly earnings call, management explicitly framed its pricing adjustments as cost-mitigation measures rather than opportunistic margin expansion.[^1]
This margin dynamic highlights two key operational realities. First, Fastenal demonstrated meaningful pricing power within its embedded accounts by realizing price increases of roughly 2.9 percent during the quarter, or about 4.5 percent on a stacked basis, without causing customer churn.[^1] Second, the company has not fully offset input cost increases, and management declined to commit to fully closing the gap before the end of 2026. Pricing power that lags input cost inflation protects transaction volumes but leaves percentage gross margins compressed in the short term.
This pricing lag reflects a broader industry condition rather than a firm-specific vulnerability. Nevertheless, it illustrates the position of an industrial distributor operating between external component suppliers and increasingly sophisticated enterprise buyers.
Amazon Business: where the threat is real
A common assumption in industrial distribution is that e-commerce generalists like Amazon cannot compete effectively in the sector. Fastenal's disclosed operational results present a more nuanced picture.
Amazon Business captures market share in unmanaged, ad-hoc purchasing—such as maintenance supervisors making spot purchases with corporate cards, facility consumables, and small buyers without formal supply contracts. In these transactions, purchasing decisions depend on catalog search, price transparency, and rapid delivery—core strengths of Amazon's fulfillment model. Fastenal's non-contract, walk-in business offers minimal structural protection against digital generalists, lacking high switching costs or service differentiation on single-parcel shipments.
Conversely, Amazon faces structural barriers in deeply integrated plant workflows. Amazon's self-service fulfillment model is not designed to maintain badge-controlled dispensing hardware on assembly lines, integrate real-time bin sensors into customer enterprise resource planning software, staff dedicated inventory rooms inside secure facilities, or guarantee local availability of specific production fasteners prior to shift startup.
Fastenal's financial disclosures reflect this operational division. On the second-quarter 2026 earnings call, Florness noted that daily sales grew at double-digit rates across all geographic regions, end markets, and customer types except non-contract customer sales, which management designated as outside its primary go-to-market focus.[^1] Although non-contract sales growth doubled relative to the prior-year period, the category remained the slowest-growing segment of Fastenal's business.
Fastenal's competitive moat provides strong defense for the 60 to 70 percent of its revenue generated through contracted, embedded customer accounts, while leaving unmanaged spot purchases exposed to digital competition. Consequently, expanding key-account contracts serves both as an offensive growth driver and as a defensive necessity to migrate revenue out of uncontracted channels.
VIII. Playbook: Business & Investing Lessons
1. Selling to a customer and operating inside a customer are different businesses. The single most consequential strategic decision in Fastenal's modern history was recognizing that a customer's convenience is measured in feet, not miles. Under that premise, the traditional branch is no longer the endpoint of distribution—it becomes an intermediate waypoint that adds overhead. The broader lesson applies across distribution: when a buyer's true cost is operational downtime rather than item price, market leadership accrues to whichever supplier achieves the closest physical or operational proximity, even if doing so cannibalizes existing retail channels.
2. Incentive architecture is strategy. Fastenal's structure of sharing pretax profit dollars across a broad tier of employees—and weighting returns on invested capital and working capital efficiency in executive pay—drives daily execution more effectively than formal strategic planning. This mechanism makes excess inventory personally costly to field managers, discourages acquisitive empire-building, and aligns decentralized decisions across thousands of employees. For investors, the corresponding tradeoff is that a portion of operational outperformance is distributed as compensation rather than flowing directly to net income.
3. A good idea at the wrong time is indistinguishable from a bad idea. The automated vending concept was conceptually sound in 1967 but operationally unbuildable with the technology of the era. It evolved into a multi-billion-dollar revenue engine only after low-cost sensors, connected devices, and cheap computing power matured around 2010. Early founder vision did not bypass those technological constraints; it simply positioned the company to deploy automated hardware once enabling components became commercially viable. For investors, early initiatives that consume capital and delay execution across decades function less as vision and more as premature deployment.
4. The discipline to shrink is rarer than the discipline to grow. Consolidating more than a third of the branch network while more than doubling annual revenue required management to move past its primary long-standing growth metric. Few corporate leadership teams make that transition cleanly once an expansion metric becomes embedded in corporate identity. A reliable indicator of management flexibility is whether leadership willingly retires a legacy growth statistic that no longer reflects operational reality.
5. Owning the last mile is a cost advantage only within a specific density envelope. Fastenal's captive trucking fleet creates a structural cost advantage, but only where route density supports it. Vertical integration into logistics yields financial returns primarily when an order profile faces disadvantageous third-party shipping economics—specifically, high volumes of small, low-value, high-frequency deliveries. Where average orders are large and infrequent, maintaining a private transportation network represents unnecessary fixed overhead.
6. Evaluate disclosure changes alongside operational results. Fastenal's 2025 reporting change—replacing standalone Onsite and branch counts with monthly customer spend tiers—offered detailed insight into account economics. Simultaneously, it eliminated the clearest historical benchmark for tracking the physical expansion pace of the embedded model. Sophisticated analysis requires evaluating both the utility of new disclosures and the visibility lost from retired metrics.
7. Identify which segment of the business holds the moat. Fastenal's competitive protection is concentrated within contracted, device-managed, in-plant customer accounts. The uncontracted segment grows more slowly and competes directly against digital generalists like Amazon Business and W.W. Grainger's Zoro platform. The appropriate framework is not a single enterprise with a uniform moat, but two distinct operating models under one roof with contrasting competitive dynamics.
IX. Analysis & Bull vs. Bear Case
The bull case
The bull case rests on a structural mechanism rather than market sentiment. Fastenal's key-account strategy is transferring revenue from thousands of fragmented local distributors into contracted, embedded relationships. Customer sites spending $50,000 or more per month grew 16.5 percent in the second quarter of 2026, driving a revenue increase of over 26 percent from that cohort, while total contract counts rose over 7 percent.[^1] A 14.7 percent increase in daily sales against a U.S. Purchasing Managers' Index averaging just above 53 indicates that market share gains, rather than cyclical expansion, drove most of the growth.[^1]
The second pillar rests on customer retention. With Fastenal Managed Inventory accounting for 44.7 percent of sales and the digital footprint reaching 61.4 percent in 2025, the revenue base is largely reordered automatically.1 Chief Executive Officer Jeffery Watts characterized newly installed devices as deposits securing future sales and customer retention.[^1]
The third pillar is capital efficiency. With return on invested capital in the low 30s—up 180 basis points year over year on a trailing twelve-month basis in the second quarter of 2026—and roughly 80 percent of net income returned to shareholders alongside a self-funded capital program, the business grows without requiring external capital.[^1]
The fourth pillar is end-market alignment. Heavy manufacturing represented 44 percent of sales in the second quarter of 2026 and grew 18 percent, while construction expanded approximately 17 percent, driven by demand in electrical, utility, infrastructure, and data center projects.[^1] Industrial reshoring across North America and data center construction directly drive consumption of Fastenal's core catalog.
The bear case
Cyclicality is not diversifiable here. Fastener demand remains tied directly to manufacturing output. The 2015–2016 energy downturn and the 2022–2024 industrial contraction slowed Fastenal's growth to low single digits, while the acceleration in 2026 coincided with six consecutive months of manufacturing PMI above 50.[^1] Although management attributes outperformance to market share gains, top-line growth remains bound to broader industrial production cycles. A distributor expanding at 14.7 percent during an industrial expansion faces substantial deceleration during a contraction.
Gross margin faces structural drag. Management estimates that shifting customer mix compresses gross margin by roughly 15 basis points annually, while net price and tariff cost pressures created a 40 basis point negative headwind in the second quarter of 2026, with no commitment from management to close the gap in the second half of the year.[^1] Offsetting this contraction requires selling, general, and administrative expense leverage, which depends on strong top-line growth. During periods of flat revenue, mix contraction continues while operating leverage disappears, creating a key structural vulnerability in the financial model.
Onsite and FMI returns face diminishing marginal yields. Fastenal previously instituted minimum spend thresholds for automated device installations after low-volume placements failed to cover capital costs. As embedded distribution moves from major manufacturing hubs into smaller facilities, average revenue per site declines while the fixed overhead of hardware and dedicated personnel remains constant, threatening unit economics.
Uncontracted sales remain vulnerable to digital generalists. Non-contract customer sales represented the only category failing to achieve double-digit growth in June 2026.[^1] This unmanaged segment lacks embedded hardware or high switching costs, leaving it directly exposed to digital competitors like Amazon Business and W.W. Grainger's Zoro platform.
Valuation offers a narrow margin of safety. Fastenal has historically traded at a premium to industrial distribution peers. Based on 2025 diluted earnings per share of $1.09 and second-quarter 2026 performance, the stock's valuation multiple has historically assumed sustained market share gains and margin stability.1 If top-line growth decelerates toward baseline industrial output or gross margin compression outpaces expense leverage, valuation multiples could contract even without operational failure.
Porter's five forces, applied
Rivalry is fragmented rather than concentrated. No single distributor holds a dominant market share, and share gains come primarily at the expense of thousands of independent local suppliers rather than major national peers. Buyer power is significant and expanding by design; courting large enterprise accounts requires negotiating with corporate procurement departments that demand volume pricing and rebates, directly exerting downward pressure on gross margins. Supplier power remains low, as fasteners and maintenance items are globally sourced commodities, and expanding private-label offerings further dilutes vendor leverage. Threat of substitutes is minimal within embedded customer facilities, where Fastenal's automated inventory replaces manual crib management, but remains high across unmanaged catalog purchases. Threat of new entrants is low for the integrated business model; while hardware is commercially available, replicating a captive transportation fleet, a regional branch network, and over a hundred thousand in-plant endpoints presents an exceptionally high capital and operational barrier.
The activist's angle
An institutional investor evaluating the business model would scrutinize four primary operational questions. First, how does site productivity under the revised customer spend disclosures compare to historical Onsite location metrics? Second, why did second-quarter 2026 incremental margins fall below the mid-20 percent target management historically established for high-growth periods, given that explaining factors such as net price/cost deficits and performance-based bonus pools reflect the company's own compensation structure?[^1] Third, what specific return on capital timeline is expected for distribution hub automation and hardware deployment when capital expenditures step up to roughly 3.5 percent of sales in 2026?[^1] Fourth, will market share gains persist during an industrial downturn, or will revenue growth revert to baseline manufacturing production?
Management's disclosures on recent earnings calls have provided detailed operational metrics. Chief Financial Officer Max Tunnicliff detailed the basis-point factors affecting incremental margins, while outgoing Chief Executive Officer Daniel Florness addressed the margin shortfall directly during his opening remarks.[^1] This quantitative transparency offers investors clear visibility into executive decision-making relative to industry peers.
The three KPIs that matter
- Daily sales growth rate, split between fasteners and non-fasteners. Fastener revenue provides a direct measure of customer manufacturing output. Comparing fastener sales against non-fastener categories clarifies whether top-line expansion reflects underlying industrial production or market share gains.
- Net price/cost spread and gross margin trajectory. With management estimating a structural customer mix drag of approximately 15 basis points annually, gross margin contraction beyond that baseline signals unrecovered input inflation or expanding buyer pricing power.
- Growth in customer sites spending $50,000 or more per month, and revenue per site. Serving as the primary replacement for standalone Onsite location counts, this spend tier measures whether embedded distribution expansion continues to compound among enterprise accounts or is encountering saturation among top-tier facilities.
X. Epilogue & Recent Developments
The executive transition proceeded without spectacle. On July 14, 2026, Jeffery Watts opened the second-quarter earnings call, presented the strategic slides, and handed the discussion to Chief Financial Officer Max Tunnicliff. Daniel Florness spoke third, reflecting on operational milestones—noting that four Fastenal sales districts were each averaging more than $8 million in monthly sales, up from zero five years earlier, and that June sales grew by more than 20 percent, pushing the annualized sales run rate past $10 billion.[^1] Two days later, Florness formally stepped down as chief executive.
Watts took leadership of an enterprise operating near historical highs: $8.2 billion in 2025 revenue, a 45.0 percent gross margin, net income near $1.26 billion8, a return on invested capital in the low 30s, approximately 124,000 automated vending devices in the field, and roughly 24,500 employees serving a quarter-million unique customer sites over the course of a year.[^1]1
The leadership handover leaves several underlying strategic tensions unresolved.
The first involves margin arithmetic. Customer mix shifts compress gross margin by roughly 15 basis points each year, requiring continuous leverage in selling, general, and administrative expenses to maintain operating margins. That trade-off has held through a pandemic demand surge and an industrial reshoring wave, but it remains untested through a multi-year revenue contraction under the current account mix.
The second tension is account saturation. Expanding Onsite locations and managed inventory devices has succeeded primarily among large manufacturing hubs. Replicating that growth requires moving deeper into mid-sized and smaller facilities, where identical hardware costs generate lower revenue. Fastenal's minimum spend requirements acknowledge that low-volume placements fail to cover capital costs, establishing a structural ceiling on profitable device expansion.
The third tension concerns uncontracted sales. Roughly a third of Fastenal's revenue stems from unmanaged, non-contract purchases lacking embedded hardware or high switching costs. This segment grows at the slowest rate across the business and faces direct competition from digital e-commerce platforms like Amazon Business. In this context, the key-account strategy functions partly as a defensive repositioning away from vulnerable spot-market transactions toward deeply integrated enterprise relationships.
The fourth tension centers on operational technology. Fastenal takes a pragmatic approach to artificial intelligence, evaluating tools based on direct labor savings. With roughly $1.6 billion in annual personnel expenses, management evaluates technology investments by how much capital is required to make that workforce 5 to 10 percent more productive.[^1] However, quantifiable efficiency gains remain unproven; Fastenal has disclosed no metrics on AI-driven cost savings, providing only management observations that large account implementations have accelerated relative to prior years.
Fifty-nine years after five founders in Winona pooled $31,000 to sell fasteners through a failing automated prototype, the technology has matured, the enterprise holds a multi-billion-dollar valuation, and founder Robert Kierlin passed away in early 2025. The modern distributor looks drastically different from its initial business plan, yet it remains anchored to the foundational insight behind it: in industrial supply, customer value stems not from the physical part itself, but from the certainty that the part will be there when needed.
References
-
Fastenal Company Form 10-K Annual Report for Fiscal Year Ended December 31, 2025 — SEC EDGAR, 2026-02-05 ↩↩↩↩↩↩↩↩↩↩↩↩↩
-
Fastenal Announces CEO Transition, Form 8-K Exhibit 99.1 — SEC EDGAR, 2025-12-22 ↩↩
-
Fastenal names new CEO, signals continuity in ecommerce — Digital Commerce 360, 2025-12-22 ↩↩↩
-
Benefactor, Fastenal founder Bob Kierlin dies — Winona Post, 2025-02 ↩↩↩↩↩↩
-
Made in Winona: Fastenal's vending machines put countless products just a scan away — Winona Daily News ↩↩↩
-
Fastenal Company Form 10-K Annual Report for Fiscal Year Ended December 31, 2024 — SEC EDGAR, 2025-02-06 ↩↩↩↩
-
Fastenal Company Annual Report and Proxy Materials (DEF 14A) — Fastenal Investor Relations ↩
-
Fastenal Company Reports 2025 Annual and Fourth Quarter Earnings — Business Wire, 2026-01-19 ↩
-
Florness to Step Down as Fastenal CEO in July — Modern Distribution Management, 2025-12 ↩
 LinkedIn
 WhatsApp
 Reddit
 Hacker News
 Email
 Kindle
 RSS Feed
 Spotify
 Apple Podcasts
 Amazon Music
 Audible
 YouTube