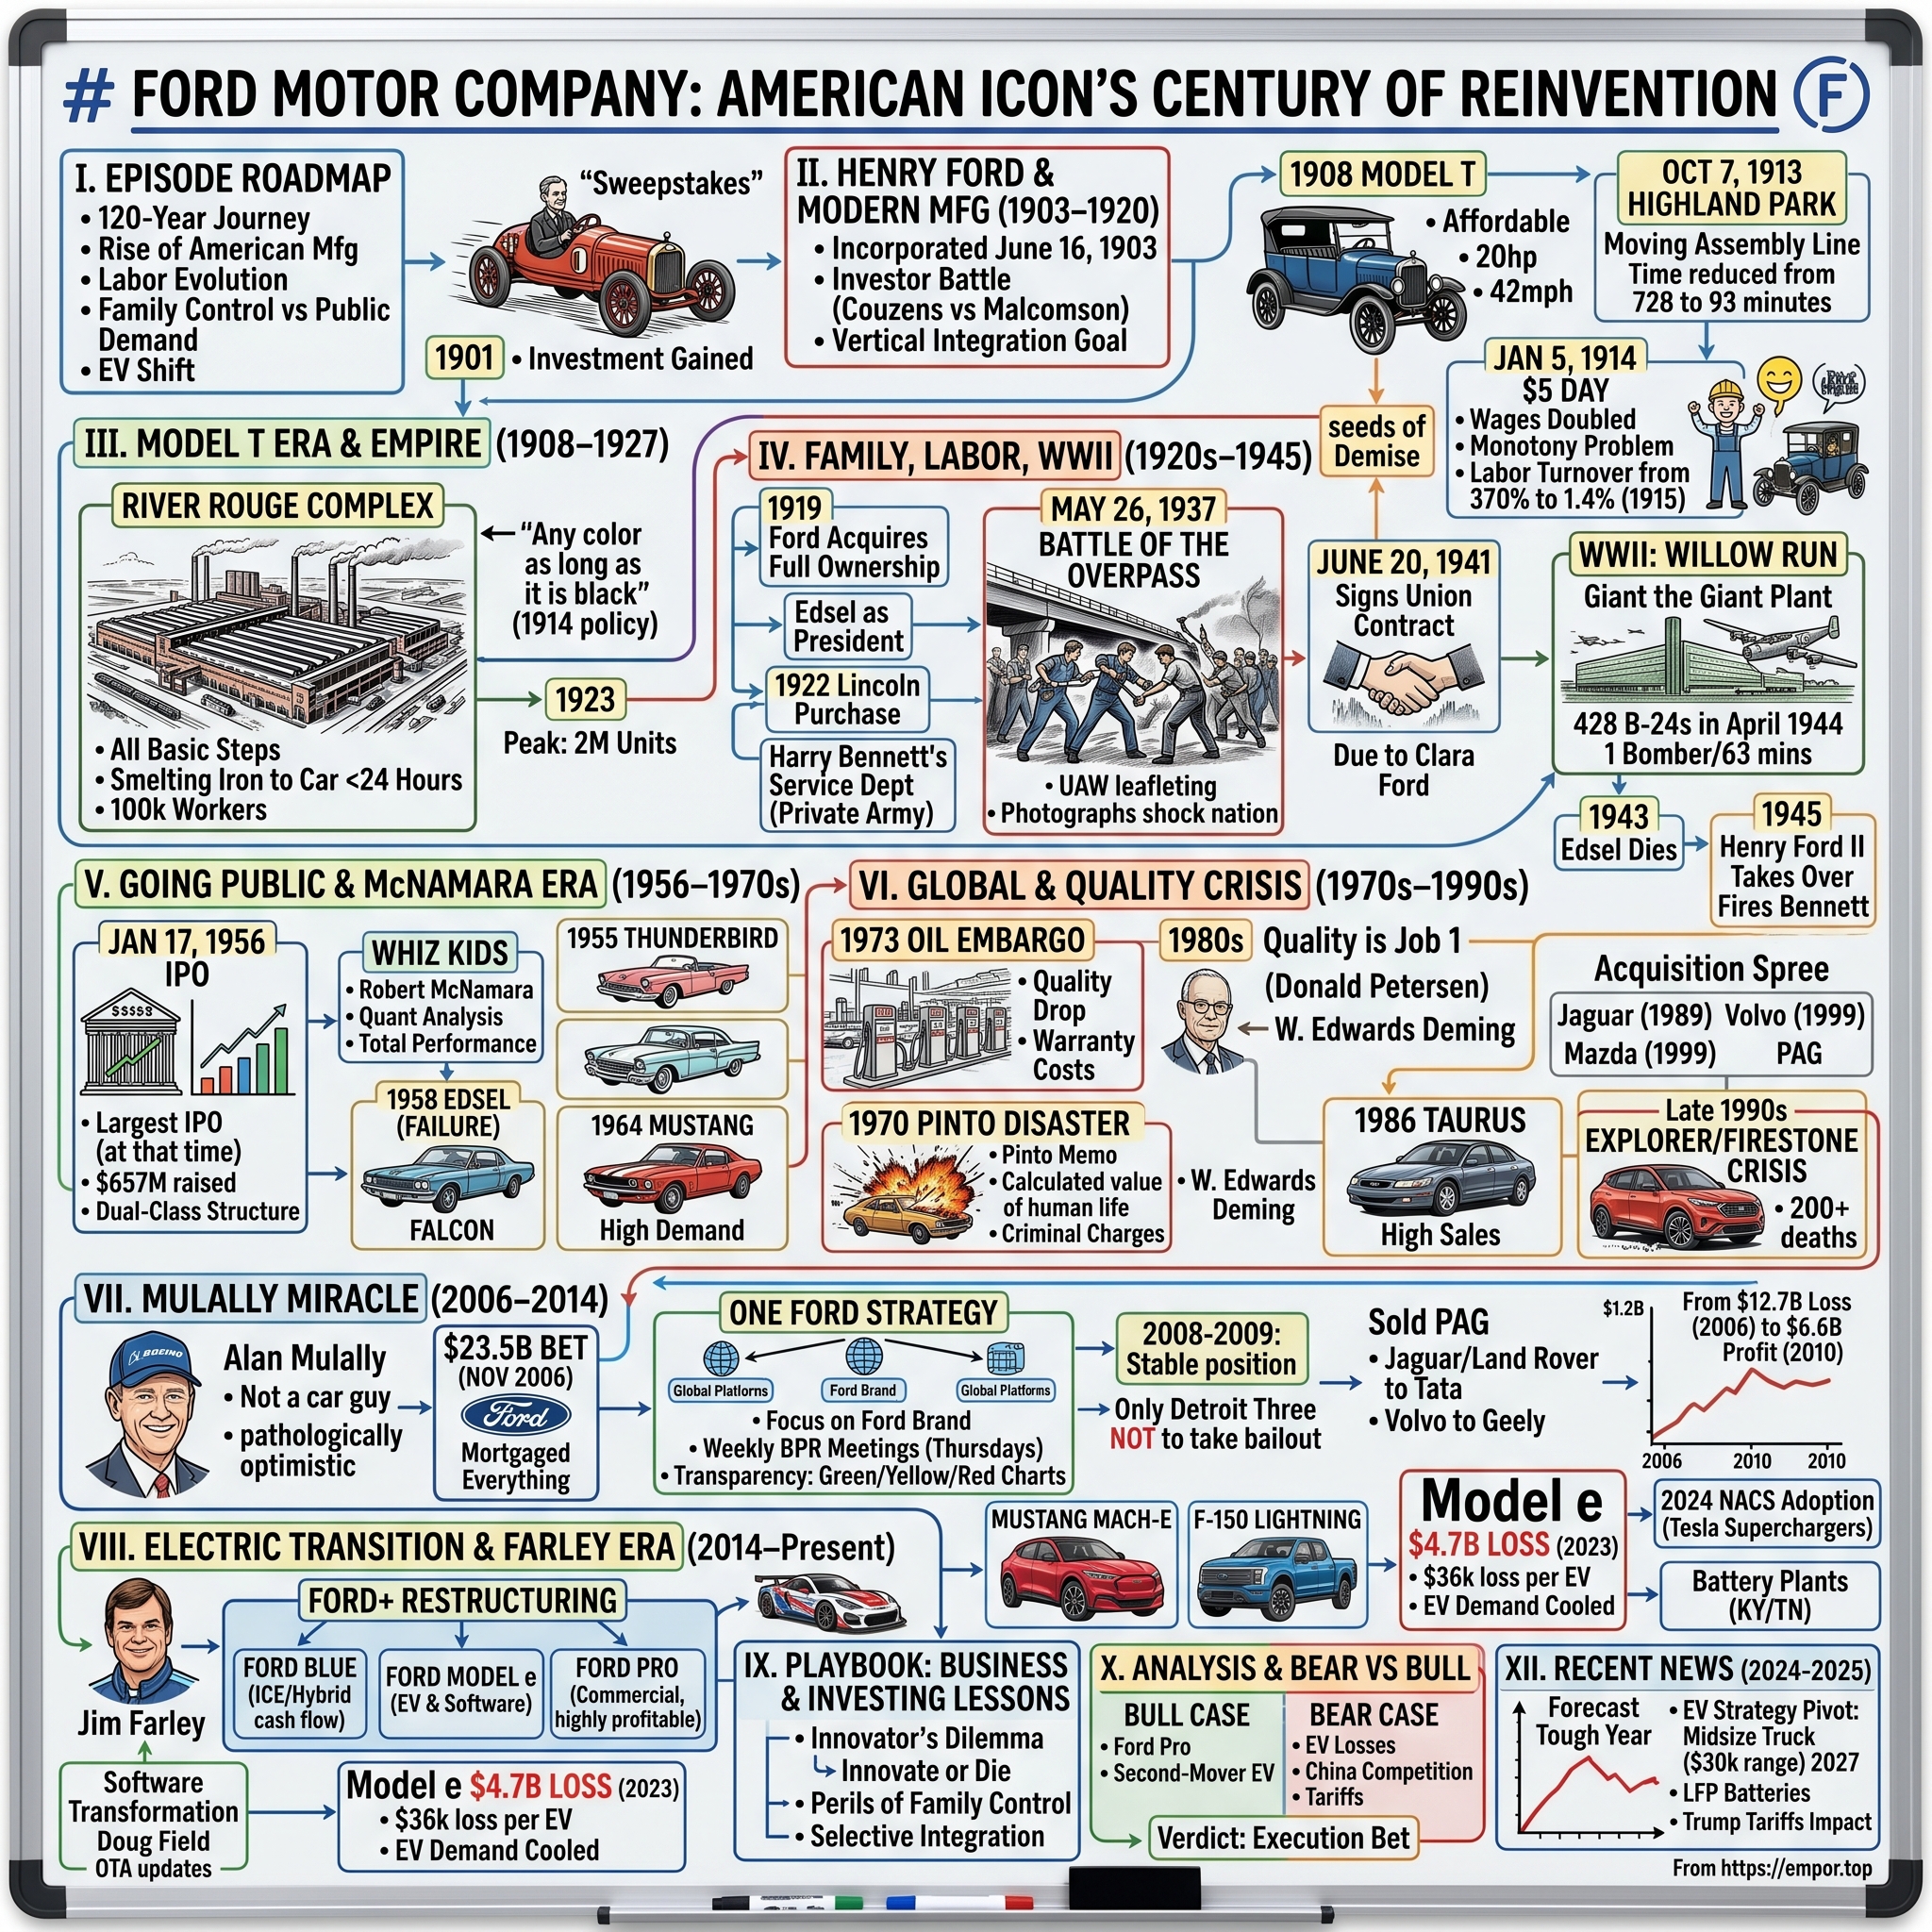
Ford Motor Company: The American Icon's Century of Reinvention
I. Introduction & Episode Roadmap
A specific corporate dilemma afflicts legacy enterprises old enough to have survived multiple technological eras: determining how to manage a core business that remains highly profitable even as it faces long-term obsolescence, while the exact timeline for that transition remains uncertain.
That question sits at the center of Ford Motor Company in 2026. Incorporated on June 16, 1903, the automaker still sells more full-size pickup trucks in the United States than any competitor, retains the founding family's name, and reports revenue that ranks it among the largest industrial enterprises on earth.1 Yet Ford continues to spend billions of dollars annually on a powertrain transition whose ultimate destination and timing management has struggled to forecast accurately for four consecutive years.
The company's financial structure highlights this operational tension. When Ford voluntarily split into three primary reporting segments, the disclosures revealed contrasting performance profiles:
- Ford Pro, the commercial-fleet business, generated $9.015 billion in earnings before interest and taxes (EBIT) during fiscal 2024 on roughly $67 billion in revenue—producing a mid-teens operating margin rarely achieved by legacy vehicle manufacturers.1[^5]
- Ford Blue, the internal-combustion and hybrid retail business, earned $5.284 billion on approximately $102 billion in revenue, reflecting thin but positive margins.1
- Ford Model e, the electric-vehicle unit, lost $5.076 billion on under $4 billion in revenue.1
- Ford Credit, the captive finance arm that underwrites dealer inventory and consumer leases, contributed $1.654 billion in pre-tax earnings.1
Read together, those four figures outline the company's underlying business model: a strong commercial fleet operation and a legacy truck franchise funding an internal electric-vehicle initiative, with a captive finance bank smoothing cash flows. Whether this arrangement represents disciplined capital allocation or an extended subsidy of an unprofitable segment remains a central debate for investors.
Underpinning the organization is an unusual corporate governance model among large U.S. industrial companies. The Ford family holds Class B shares that grant a fixed 40% voting power despite owning an economic stake below 2% of total equity.2 Proponents argue this structure shields multi-year strategic initiatives from short-term market pressures. Critics contend that an ownership group whose economic interest centers on dividend income may lack the incentive to support aggressive reinvestment or painful structural changes.
Compounding these challenges are persistent warranty expenses. Spending billions of dollars annually repairing previously sold vehicles imposes a recurring tax on operational efficiency gains elsewhere, creating a long-standing financial burden that can no longer be characterized as a temporary issue.9
This analysis unfolds across six movements. First, the history of how Ford established its operational scale and dual-class voting structure. Second, the expansion of the Premier Automotive Group and the subsequent restructuring led by Alan Mulally. Third, the Ford+ segment architecture and the operational realities revealed by disaggregation. Fourth, an audit of management's core commitments against historical performance. Fifth, the company's competitive moats and market vulnerabilities. Finally, the primary bull and bear investment cases, the metrics required to evaluate progress, and potential strategic alternatives.
The narrative begins with the historical foundation of Ford's competitive advantages and structural constraints.
 Subscribe on LinkedIn
II. Succinct History & The Governance Blueprint (1903–1990s)
Henry Ford was not an overnight success. Two earlier automotive ventures collapsed before Ford Motor Company was incorporated on June 16, 1903—establishing a recurring cycle of near-collapse followed by structural reinvention.1
The definitive reinvention arrived in 1913 at Highland Park through a revolution in production methodology rather than vehicle design. By breaking chassis assembly into sequenced stations and moving the work past stationary laborers, Ford compressed chassis assembly time from roughly twelve hours to ninety-three minutes. The financial impact was dramatic: Model T pricing fell from around $850 in 1908 to under $300 by the mid-1920s—a nominal price decline of roughly two-thirds during a period when little else in the consumer economy was becoming cheaper.
That breakthrough demonstrated an enduring truth of automotive manufacturing: unit costs decline steeply with production volume. Because fixed investments in tooling, stamping dies, engine lines, and plant overhead are substantial, spreading those expenses across higher volume sharply reduces per-unit costs. Economies of scale formed the industry's foundational competitive moat—explaining why an automaker selling hundreds of thousands of pickup trucks off a shared architecture can generate far higher profits than a producer of low-volume niche vehicles.
The $5 daily wage introduced in January 1914 is often romanticized as an effort to build a customer base among Ford's own workers. In reality, it was a pragmatic response to severe operational friction. The relentless pace of the assembly line drove annual labor turnover to nearly 370%, forcing the company to replace its workforce more than three times a year. The training expenses and lost efficiency from that churn threatened to erode the assembly line's gains. Doubling daily pay served primarily as a labor-retention expenditure that incidentally expanded consumer purchasing power—a cost-accounting decision that yielded lasting brand equity.
Vertical integration eventually turned from competitive strength to structural handicap. The River Rouge complex was designed for total self-sufficiency: raw iron ore and coal entered at one end while finished automobiles emerged at the other, supported by Ford-owned mines, forests, cargo ships, glass facilities, and steel mills. For a single-model business, controlling every stage of production made operational sense. However, as consumer preferences diversified and independent component suppliers reached their own economies of scale, extensive vertical integration created rigid capital burdens. Dedicated manufacturing assets could not be easily reallocated across a broader product portfolio. A century later, Ford faces a similar dilemma in battery cell manufacturing, illustrating how vertical integration can constrain strategic flexibility.
The company's governance architecture took shape in 1956. Ford's initial public offering—the largest in U.S. history up to that time—ended sole family ownership while preserving family control. The Class B stock structure fixed the Ford family's voting power at 40%, insulating its governing influence from the dilution of subsequent equity issuances.2
This dual-class voting system produced mixed long-term consequences. On one hand, it shielded Ford from hostile takeovers, allowing management to execute a multi-year restructuring from 2006 to 2009 without activist disruption. On the other hand, it concentrated voting power among shareholders whose financial interests prioritized consistent dividend income over long-term equity appreciation—creating an institutional bias toward cash distributions over aggressive capital reinvestment. Consequently, family control has functioned as a stabilizing force during corporate crises and as a restraint on structural transformation during periods of stability.
Another enduring legacy of this era is a documented history of quality control vulnerabilities under financial pressure. The Pinto fuel-tank controversies of the 1970s became a case study in corporate risk management when internal analyses weighed design modifications against potential legal liabilities. Two decades later, the Explorer-Firestone tread-separation crisis led to widespread recalls, congressional hearings, and executive restructuring. Viewed collectively alongside Ford's contemporary warranty expenses, these episodes reflect a persistent operational vulnerability: rigorous cost discipline has repeatedly come at the expense of product quality and long-term reliability.
This tension between ambitious expansion and cost discipline set the stage for an expensive new chapter, beginning with a major acquisition spree in Europe.
III. The PAG Misstep & The Mulally Miracle (1990s–2014)
The strategic logic appeared compelling in the 1990s: Ford's leadership observed thin margins on mass-market vehicles while European luxury automakers earned high returns on far lower volume. Management pursued what seemed like a clear arbitrage: acquire premium brands, apply Ford's global manufacturing scale beneath them, and capture the margin spread.
Over more than a decade, Ford assembled these acquisitions into the Premier Automotive Group (PAG). The expansion began with Jaguar in 1989 for approximately $2.5 billion, followed by Aston Martin, acquired in stages between 1987 and 1994. Ford then added Volvo's passenger car business in 1999 for roughly $6.45 billion and bought Land Rover from BMW in 2000 for about $2.73 billion.
The core synergy thesis depended on two key assumptions, both of which failed in execution. The first was platform sharing: placing multiple luxury brands on shared Ford architectures to amortize development costs across higher unit volumes. The primary failure was the Jaguar X-Type, engineered on the same platform as the mass-market Ford Mondeo. Consumers recognized the common underpinnings. Because a luxury brand's pricing power depends on perceived exclusivity, exposing shared mass-market architecture diluted the brand equity Ford had purchased. The second assumption was operational efficiency. Instead of streamlining operations, PAG multiplied engineering organizations, regulatory compliance programs, dealer networks, and manufacturing footprints across multiple countries—creating overhead that scaled with brand count rather than vehicle volume.
The ultimate unwinding of the portfolio generated steep financial losses. Ford sold Aston Martin in 2007 for about $925 million. In 2008, Jaguar and Land Rover were sold to Tata Motors for roughly $2.3 billion—less than Ford had paid for Land Rover alone eight years prior, before accounting for years of subsequent development spending.7 Volvo was sold to Geely in 2010 for about $1.8 billion, less than one-third of its original purchase price.8 In total, the PAG strategy destroyed more than $10 billion in capital when combining acquisition costs and ongoing investments against realized sale proceeds.
The takeaway extends beyond the general risk of corporate diversification. When an acquirer attempts to extract value by imposing its mass-market cost structure and architectures onto a premium brand, it often erodes the very pricing power that justified the acquisition. This pattern provides a useful lens for evaluating Ford's modern assertions that its commercial-vehicle operations can seamlessly translate into high-margin software subscriptions.
This structural strain set the stage for a critical pivot in Ford's modern financial history, led by an executive from outside the automotive industry.
Alan Mulally took over as CEO in September 2006 after leading Boeing's commercial airplane division through the post-9/11 aviation crisis. He inherited an automaker that recorded a $12.7 billion loss in 2006 and faced junk credit ratings. As an outsider entering a corporate culture divided into entrenched regional fiefdoms, his disciplined, plain-spoken management style initially met with skepticism in Dearborn.
In November 2006, Mulally executed a decisive balance-sheet intervention. Ford pledged virtually all of its assets as collateral—including manufacturing plants, inventory, subsidiary equity, and the Blue Oval trademark—to secure approximately $23.5 billion in debt financing.11 While mortgaging core assets produced harsh headlines, the transaction established a crucial liquidity buffer. When global credit markets froze in 2008, this reserve allowed Ford to avoid the government-funded bankruptcies that befell General Motors and Chrysler.
For investors in capital-intensive cyclical industries, the episode highlighted an enduring reality: debt capacity is accessible when market conditions permit, not when distress takes hold. Mulally secured liquidity before credit channels closed, insulating Ford's equity holders from the total dilution suffered by competitors. However, Ford's survival was not exclusively the result of strategic foresight. The federal bailouts of General Motors and Chrysler stabilized the shared automotive supply base, preventing systemic supplier insolvencies that would have halted Ford's operations. Ford avoided direct government intervention, but benefited significantly from the broader industry rescue.
Mulally paired balance-sheet management with the "One Ford" operational strategy, which focused on simplification. Ford reduced its global vehicle platforms from 27 to 9, consolidated regional engineering units that had previously developed redundant models, and divested the remaining PAG assets. To address cultural rigidity, Mulally introduced mandatory weekly Business Plan Reviews where executives evaluated operations using red, yellow, or green status indicators. The process shifted corporate culture when executive Mark Fields flagged a critical tailgate latch issue as red and received praise rather than reprimand. In an organization where concealing operational flaws had been common practice, encouraging transparent reporting improved information flow across manufacturing divisions.
By his departure in 2014, Mulally had successfully stabilized the company's balance sheet and operational structure. Nevertheless, Ford remained structurally reliant on internal-combustion vehicles with modest retail margins. The turnaround ensured survival, but deferred comprehensive reinvention to future leadership—a challenge that later materialized through segment reporting changes with far-reaching strategic consequences.
IV. The Ford+ Restructuring & Segment Disaggregation (2020–Present)
Jim Farley assumed the role of CEO in October 2020. In contrast to Alan Mulally's methodical demeanor, Farley brought a directive, outspoken style and a willingness to publicly critique Ford's operational shortcomings. Having a familial connection to the company—as the grandnephew of an early Rouge plant worker—he positioned himself as a leader rooted in Ford's institutional history while pushing for rapid structural change.
Farley's most consequential strategic decision was organizational rather than product-driven. In March 2022, Ford announced it would reorganize its automotive operations into three primary reporting units: an electric-vehicle division, a legacy internal-combustion business, and a standalone commercial fleet unit.4 The company formalized this structure under the "Ford+" banner and began financial reporting under the new framework, providing a detailed investor presentation in March 2023 to explain the disaggregated valuation model.3
This accounting shift held major strategic implications. Historically, Ford reported financial results primarily by geographic region. That consolidated structure masked individual unit dynamics, allowing highly profitable commercial truck sales and substantial electric-vehicle losses to offset one another within the North American regional line. Consequently, external analysts could not evaluate the true earnings power or cash burn of specific vehicle programs, enabling management to present EV investments as manageable transition costs.
Disaggregation eliminated this consolidation filter. The new transparency revealed that electric-vehicle losses were significantly larger than consensus estimates had assumed, while simultaneously highlighting the exceptional profitability of Ford's commercial operations.
The fiscal 2024 disclosures established a clear empirical baseline for evaluating these segments. Ford Pro generated approximately $66.9 billion in revenue and $9.015 billion in earnings before interest and taxes (EBIT), yielding an operating margin of nearly 13.5%.1 The commercial segment relies on high-demand, specialized products, including Super Duty trucks spanning the F-250 to F-600 series, Transit vans, telematics software, maintenance contracts, and an established network of third-party vehicle upfitters.
Meanwhile, Ford Blue reported roughly $101.8 billion in revenue and $5.284 billion in EBIT, representing an operating margin of approximately 5.2%.1 Comprising retail sales of consumer F-150 pickups, traditional SUVs, the Bronco, and hybrid models, Ford Blue remains a large but highly cyclical division. It earned roughly one-third of Ford Pro's operating margin while generating one and a half times its revenue, illustrating the financial advantage of serving captive commercial buyers over retail consumers.
In contrast, Ford Model e recorded approximately $3.9 billion in revenue alongside a $5.076 billion EBIT loss.1 The segment incurred expenses that exceeded its total revenue collection—a deficit driven by aggressive industry price discounting, high initial bill-of-materials costs, underutilized manufacturing capacity at lower sales volumes, and long-term battery supply contracts negotiated under higher demand forecasts.
In addition, Ford Credit contributed $1.654 billion in pre-tax earnings.1 The captive finance subsidiary serves a dual operational role: it earns interest spreads on consumer and fleet financing while providing floor-plan financing for dealer inventory, effectively supporting Ford's wholesale distribution network. However, its business model introduces distinct financial risks, as credit loss rates and lease residual values depend heavily on used-vehicle market dynamics rather than new manufacturing output.
Collectively, these disaggregated results clarify Ford's internal cash flows. Ford Pro and Ford Blue generated more than $14 billion in combined EBIT during fiscal 2024. Model e absorbed roughly one-third of that operating profit, while the remaining cash flow funded ongoing capital expenditures and a dividend policy featuring regular quarterly distributions alongside periodic special payouts.[^5]
This structure prompts an obvious capital allocation question for investors: if the commercial fleet unit commands a higher valuation multiple as a standalone entity while the electric unit burns capital, does combining them within a single corporate shell suppress total enterprise value? Management contends that the segments share critical operational synergies, including plant infrastructure, component purchasing power, dealer networks, and engineering expertise. While plausible, similar integration arguments were made during the Premier Automotive Group expansion, suggesting that management must demonstrate true operational cost sharing rather than simple corporate co-location.
Evaluating that synergy claim requires examining Ford's most profitable asset in detail—and assessing whether its commercial competitive moat remains as durable as market valuations assume.
V. Segment Deep Dive: Ford Pro — The Commercial Cash Machine & Moat Engine
Unlike retail vehicle buyers, commercial fleet operators evaluate automobiles primarily as revenue-generating production assets. For a regional contractor or commercial services fleet, every hour a vehicle spends in a service bay represents lost billable labor, delayed customer commitments, and operational disruption. Consequently, purchase decisions prioritize total cost of ownership and vehicle uptime over styling or acceleration.
This functional calculus explains why Ford Pro generates nearly three times the operating margin rate of Ford Blue on comparable vehicle hardware. Commercial customers are price-rational, rewarding manufacturers capable of minimizing fleet downtime. Furthermore, once an operator integrates a specific vehicle platform into its daily operations, switching costs compound across multiple operational layers.
The first layer of defense rests in physical upfitter integration. Commercial vans and work trucks are rarely deployed in their factory configurations. Instead, independent upfitters customize them with specialized shelving, refrigeration units, aerial lifts, utility bodies, or auxiliary electrical systems. Over decades, this third-party ecosystem has engineered its standardized equipment around Ford's exact frame dimensions, mounting points, power take-off specifications, and electrical architecture. For a fleet operator, changing vehicle brands requires far more than replacing rolling stock; it invalidates compatible equipment catalogs, forces technician retraining, and duplicates spare parts inventory—creating a high structural switching cost borne entirely by the customer.
The second competitive layer involves Ford's specialized commercial service network. The company has established dedicated commercial service bays, extended operating hours, and a fleet of mobile service units capable of performing on-site maintenance at customer job sites or fleet yards. This represents capital-intensive infrastructure that consumer-oriented EV entrants have struggled to match. While competitors like Tesla and Rivian offer commercial vehicles, neither has established a comparable nationwide commercial service footprint—a capability that requires years of dedicated capital deployment and deep dealer alignment.
The third layer—and the foundation for management's highest-margin growth projections—is digital software integration. Through Ford Pro Intelligence, the automaker provides commercial telematics offering real-time vehicle tracking, remote diagnostics, driver behavior monitoring, predictive maintenance scheduling, and EV charging management. Ford has disclosed over 600,000 active paid software subscriptions and has targeted gross margins above 50% on digital services revenue.[^5]3
Fleet telematics creates significantly higher retention than consumer software applications because it embeds directly into core operational workflows. When a fleet manager configures dispatch routines, automated maintenance triggers, payroll verification, and regulatory compliance reporting around Ford's software platform, replacing the system requires restructuring daily business operations rather than simply switching mobile applications. This deep workflow integration provides a rare form of operational lock-in within a traditional hardware sector.
However, the investment thesis surrounding Ford Pro's software growth and margin profile faces three notable analytical limitations.
First, the telematics platform does not possess true network economies. Under standard competitive strategy frameworks, a true network effect requires that each new user directly increases the utility of the network for existing users. While Ford's aggregated telematics data helps refine its internal predictive maintenance algorithms, an expanding fleet in one region provides no direct operational benefit to an unrelated fleet elsewhere. Describing this telemetry loop as a network effect conflates high customer switching costs and data scale with true network dynamics—a distinction that impacts how equity markets should value the revenue.
Second, software adoption remains fundamentally tied to hardware cycles. Because Ford Pro Intelligence is sold almost exclusively alongside Ford commercial vehicles, subscription revenue depends directly on new vehicle deliveries and fleet capital expenditure cycles. A standalone software enterprise can maintain expansion during automotive downturns; Ford Pro's digital revenue remains vulnerable to macroeconomic contractions in construction, skilled trades, and municipal spending.
Third, the segment's 13.5% operating margin reflects an exceptionally favorable pricing environment. Supply chain bottlenecks following the COVID-19 pandemic constrained vehicle availability, extending fleet order backlogs and supporting elevated pricing power. As vehicle production normalizes, competition is intensifying across key segments. General Motors has consolidated its commercial offerings under GM Envolve while expanding its BrightDrop electric delivery platform, Stellantis continues to target fleet buyers through Ram Commercial, and specialized manufacturers like Isuzu and Daimler Truck maintain strong positions in heavier vehicle classes. Consequently, while Ford Pro's structural moats in upfitter relationships and service network density are durable, its mid-teens operating margin may prove to be a cyclical peak rather than a permanent structural baseline.
Evaluating the long-term sustainability of Ford Pro's profitability requires monitoring two operational benchmarks: whether paid software subscriptions can compound beyond one million while maintaining low-teens segment operating margins—signaling genuine pricing power independent of vehicle sales cycles—or whether margins compress toward high single digits as supply normalizes and fleet backlogs clear.
While Ford Pro demonstrates strong operational execution and durable competitive moats, the company's broader financial trajectory depends equally on its retail operations, where these commercial advantages do not apply.
VI. Segment Deep Dive: Ford Blue vs. Model e — ICE Engine, EV Reality, & Hybrid Pivot
The F-Series has been America's best-selling truck for 48 consecutive years by the company's counting.[^5] At that duration, sales dominance moves beyond marketing and reflects a fundamental structural manufacturing advantage. Operating facilities like the Dearborn Truck Plant at high capacity allows Ford to negotiate component pricing that low-volume competitors cannot match, amortize tooling across a massive vehicle base, and maintain high plant utilization—the single largest driver of manufacturing margins.
That scale is reinforced by strong consumer brand equity. The "Built Ford Tough" campaign functions primarily to retain an established customer base rather than acquire new buyers. Full-size pickup buyers exhibit some of the highest brand loyalty in the automotive industry, driven by identity as well as pragmatic factors such as familiarity with towing specifications, payload capacities, and dealer service networks. That loyalty allows Ford to command pricing power and vehicle margins that are largely unachievable in the mass-market passenger car segment.
These dynamics set the foundation for the strategic pivot defining Ford Blue: the expansion of hybrid powertrains.
Management recognized that consumer hesitancy regarding battery-electric vehicles was driven primarily by external barriers rather than product quality—specifically inadequate charging infrastructure, substantial price premiums over internal-combustion alternatives, and cold-weather range degradation. Hybrids offered a practical compromise, delivering improved fuel efficiency without requiring changes in driving habits or charging behavior. Consequently, Ford expanded hybrid options across high-volume platforms, including the Maverick and F-150.
The financial rationale behind the hybrid pivot illustrates a key operational distinction within Ford's segment structure. A hybrid vehicle adds a small battery pack and electric motor to an existing internal-combustion architecture. This introduces an incremental cost of a few thousand dollars per unit while reusing fully depreciated tooling and manufacturing platforms, allowing Ford to capture premium pricing for fuel savings. Conversely, a battery-electric vehicle replaces the traditional powertrain with a massive battery pack accounting for a third or more of total vehicle cost, requiring dedicated manufacturing plants, supply chains, and specialized service training. While hybrids generate immediate, high-margin cash flows on legacy assets, electric vehicles consume capital in pursuit of long-term scale.
Ford's initial electric strategy sought to leverage existing brand equity by electrifying iconic nameplates—most notably the Mustang Mach-E and F-150 Lightning. While this approach enabled rapid market entry and earned favorable initial product reviews, it generated severe financial losses. With Ford Model e generating under $4 billion in revenue against an EBIT loss exceeding $5 billion in fiscal 2024, per-unit losses averaged tens of thousands of dollars on every vehicle delivered.1
Three factors compounded these losses. First, industry-wide price cuts initiated by Tesla compressed realized selling prices across all electric vehicle lines. Second, Ford's first-generation electric platforms carried high bill-of-materials costs established prior to price compression. Third, Ford committed to joint-venture battery production capacity, such as BlueOval SK with SK On, based on aggressive volume forecasts that failed to materialize, leaving high fixed costs spread across lower-than-planned production volumes.
The segment also highlights a fundamental product-architecture compromise common among legacy automakers. Building the F-150 Lightning on a shared body-on-frame architecture saved development capital and accelerated time-to-market. However, adapting an internal-combustion frame for an electric vehicle required packaging compromises in battery placement, aerodynamics, and weight distribution that dedicated electric platforms avoid. This choice illustrates the incumbent's dilemma: a capital-efficient shared platform yields a compromised electric vehicle, whereas a clean-sheet design demands capital investment that legacy margins cannot easily sustain during a slow adoption curve.
In response, Ford established a California-based engineering team to develop a low-cost, second-generation electric platform. Functioning independently from traditional Dearborn processes, the team adopts startup engineering practices to reduce manufacturing complexity and bill-of-materials costs. While this initiative directly addresses the company's structural cost challenges, its commercial viability remains unproven until vehicles enter mass production at disclosed cost structures.
Beyond domestic execution, Ford faces an intensifying global competitive threat from Chinese EV manufacturers, including BYD, Geely, and NIO. Chief Executive Jim Farley has noted that Chinese competitors hold a 25% to 30% structural cost advantage over Western automakers. This edge stems from deep vertical integration in battery cell manufacturing through suppliers like CATL and BYD's internal Blade cell production, lower labor costs, faster software development cycles, and substantial domestic production scale.
While a 100% U.S. tariff on Chinese electric vehicles protects Ford's core domestic truck and commercial franchises, trade policy does not constitute a permanent competitive moat. Tariffs remain subject to legislative and administrative shifts, and they offer limited protection in overseas markets across Europe, South America, and Southeast Asia. As a result, Ford's North American positions remain shielded in the short term, but its international consumer business faces long-term margin pressure from lower-cost global entrants.
This disparity between strategic intent and financial execution highlights a central question for investors: how reliably has Ford's leadership executed on its public commitments? Assessing that track record requires auditing management's historic targets against realized performance.
VII. Capital Allocation, M&A Record, & The Falsification Audit
Any investment case for Ford rests on a small number of core operational claims. The most productive analytical exercise is to test each claim against the strongest disconfirming evidence in Ford's own operating history—and to determine whether that evidence rejects the claim, narrows it, or leaves it unproven.
Claim one: Ford can rapidly scale software-defined vehicles and autonomous technology.
The disconfirming evidence is direct and recent. Ford invested over $1 billion in Argo AI, the Level 4 autonomous-driving venture it backed alongside Volkswagen. In October 2022, Ford announced the shutdown of the business and recorded a $2.7 billion impairment.5[^10] Chief Executive Jim Farley offered a specific rationale on the third-quarter earnings call: profitable, fully autonomous vehicles at scale were further away than anticipated, prompting Ford to redirect resources toward Level 2 and Level 3 driver-assistance systems it could monetize sooner—specifically its BlueCruise hands-free technology.
While recognizing a failed venture within four years and closing it represents disciplined governance compared to industry norms, the claim being tested centers on deployment speed—and empirical evidence rejects the aggressive timeline. A similar pattern emerged in electrification. Ford abandoned its initial target of two million units of annual EV capacity by 2026. In August 2024, the company canceled a planned three-row electric SUV, delayed its next-generation electric pickup program, and recorded restructuring charges associated with the strategic shift.10 Earlier, management reduced planned battery capacity at its Marshall, Michigan facility and deferred timing for its joint-venture BlueOval SK plants.
The calibrated conclusion: the claim must be narrowed rather than accepted. Ford has demonstrated competence in deploying incremental software features attached to existing vehicles—BlueCruise and Ford Pro telematics generate real revenue. However, management has shown limited ability to forecast or achieve multi-year targets in frontier technologies. Valuation models that capitalize future software or autonomy revenue on management's timeline rely on a track record that has yet to materialize. The primary falsifying benchmark going forward is whether Ford's second-generation EV platform arrives within its announced timeframe and target cost structure.
Claim two: minority investments in electric-vehicle startups create valuable strategic optionality.
Ford invested $500 million in Rivian in 2019, later expanding the stake alongside announced plans to co-develop vehicles. That co-development was subsequently canceled. Ford booked a $7.4 billion mark-to-market gain in 2021 as Rivian's post-IPO share price surged, only to record multi-billion-dollar write-downs in 2022 when the stock collapsed, ultimately selling down essentially its entire position by early 2023.6
The strategic yield of that investment was minimal: no shared vehicle platform, no shared technology, and no lasting operational partnership. Ford effectively held a volatile equity position that inflated reported net income in one year and depressed it the next. This highlights a critical accounting dynamic for investors: mark-to-market adjustments on equity holdings flow directly through net income, making reported earnings a poor indicator of core operational performance. The record rejects the claim as originally framed. The surviving takeaway is far narrower: Ford traded a financial security whose ultimate return was dictated by equity market fluctuations rather than industrial strategy.
Claim three: quality initiatives protect margins.
"Quality is Job 1" served as Ford's primary marketing slogan for over a decade, and it has since been replaced by internal operational fitness programs under Ford+. Yet the recent empirical record remains unambiguous: Ford has topped U.S. vehicle recall tables for multiple consecutive years, with annual warranty expenses approaching and exceeding $4.8 billion—a recurring outlay that meaningfully suppresses Ford Blue's reported EBIT.9 In July 2024, analysts pressed management regarding a quarterly warranty spike that dragged down operating profits; executives attributed the charge to older model-year vehicles clearing their warranty windows rather than current manufacturing quality.9
That explanation is only partially convincing. While warranty expenses lag vehicle production by several years—meaning current costs reflect legacy manufacturing—Ford management has offered similar explanations across multiple operating cycles. At a certain point, a temporary lag morphs into a persistent structural pattern. Viewed against Ford's fifty-year history from the Pinto through the Explorer-Firestone recall, the baseline suggests a deep-seated operational issue.
The calibrated conclusion: the claim is rejected in its current form. Warranty expense does not function as a one-time charge; it operates as a structural tax of 2.0% to 2.5% of automotive revenue, compared to an industry benchmark closer to 1.0%. Closing that gap represents billions of dollars in annual profit—an amount larger than Ford Credit's total pre-tax earnings. Reducing warranty expense as a percentage of revenue over coming reporting periods represents the clearest quantitative test of whether Ford's quality initiatives are taking hold.
Claim four: international expansion diversifies profits.
Ford spent decades and substantial capital attempting to establish mass-market manufacturing bases in India and South America. Both initiatives ended in complete withdrawal. Ford ceased manufacturing in India in 2021 and closed its Brazilian assembly operations the same year, taking billions of dollars in restructuring charges alongside cumulative operating losses that far exceeded those exit costs. In Europe, the company substantially retrenched, scaling back its broad passenger-car lineup to focus primarily on commercial vehicles.
The disconfirming evidence here is definitive: sustained capital deployment into markets where Ford failed to achieve the scale required by its cost structure, concluding in asset write-downs and exit. The diversification claim is rejected. The surviving narrative—which is far more defensible—is that Ford's international value rests almost entirely on its commercial vehicle franchise, where the Transit van maintains a strong European market position. Investors should model Ford's international operations not as a diversified consumer growth engine, but as a focused commercial business with a tariff-exposed retail periphery.
Taken together, these four case studies reveal a consistent pattern. Ford management has demonstrated a pragmatic willingness to recognize failed initiatives and cut losses—as seen with Argo AI, Rivian, India, Brazil, and the three-row electric SUV. However, management has consistently struggled with long-term operational forecasting. The capital discipline highlighted in recent investor communications is genuine in its willingness to write down bad assets, but unproven in preventing over-expansion in the first place. Describing this pattern as surgical discipline overstates the case; recognizing it as a willingness to acknowledge error and take write-downs is an accurate reflection of the historical record.
That balance of strategic candor and operational execution is best evaluated through the leadership team directing the company.
VIII. Management Credibility, Governance, & Labor Dynamics
Chief Executive Jim Farley is, by the standards of large-cap corporate leaders, unusually willing to criticize his own company's operational weaknesses in public. He has openly praised Chinese competitors, characterized their cost advantage as structural, and acknowledged that Ford's electric-vehicle strategy required major adjustments. That candor provides genuine analytical value: leadership that explicitly identifies operational flaws is more likely to address them. Furthermore, Ford's disclosure quality under Farley—most notably the disaggregation of its operating segments—is materially higher than under previous management.34
Evaluating management credibility, however, requires weighing candor against operational execution. Farley has demonstrated a strong willingness to course-correct: he canceled a planned three-row electric SUV, delayed the next-generation electric pickup, trimmed EV capital spending, and redirected investment into hybrid models when market demand shifted.10 While abandoning public commitments imposes a short-term credibility cost on leadership, avoiding unremunerative capital spending preserves long-term shareholder value—a trade-off Farley has repeatedly chosen to make.
That willingness to pivot stands in contrast to a weaker record in initial target-setting. Key performance milestones announced at the company's 2023 investor day—including an annual production capacity target of two million electric vehicles, the original profitability timeline for Model e, and an 8% EV operating margin goal—have all been abandoned or deferred.3 This pattern of ambitious public targets followed by subsequent downward revisions requires investors to discount forward-looking guidance even while recognizing management's responsiveness to market reality. Moreover, on persistent operational issues like warranty expenses, the management team's course-correction reflex has failed to produce results at the pace demonstrated in strategic capital reallocations.
John Lawler, initially as chief financial officer and later as vice chair, has served as the enforcer of this capital framework. By instituting strict return hurdles on electric vehicle programs, Lawler oversaw the removal of roughly $12 billion in planned electric capital expenditures and managed the delayed timeline for joint-venture battery plants. This willingness to curtail planned spending marks a clear departure from the capital allocation patterns of the Premier Automotive Group era. However, this discipline primarily manifests at the cancellation stage rather than during initial project approval.
As executive chair, Bill Ford occupies a structurally complex position. Representing the founding family's interests, he has championed environmental and electrification initiatives longer than most industry executives while simultaneously presiding over a Class B share structure designed to maintain dividend income. Ford has sustained regular quarterly dividends alongside special distributions even as the Model e unit absorbed billions in operating losses.[^5] Critics contend that distributing cash to shareholders while funding a loss-making strategic transition favors voting share owners over long-term enterprise equity growth. However, given that several early EV investments failed to earn their cost of capital, returning cash via dividends may ultimately have represented a more efficient allocation of capital.
Executive compensation is tied directly to Ford+ segment EBIT performance, quality and warranty metrics, software subscription growth, and relative total shareholder return.2 While incorporating warranty performance directly into executive incentive structures aligns management compensation with operational health, tangible quality improvements remain a key metric for investors to monitor.
Beyond executive leadership and governance, labor dynamics represent a central driver of Ford's cost structure relative to its industry peers.
In late 2023, the United Auto Workers executed targeted strikes across all three Detroit automakers simultaneously. For Ford, the six-week strike reduced EBIT by approximately $1.3 billion and resulted in roughly 100,000 units of lost production. The contract ratified in October 2023 provided a 25% wage increase over four and a half years, reinstated cost-of-living adjustments, and eliminated the multi-tiered wage structure established during the 2008 financial crisis.12
The strategic implications of this agreement exceed its immediate financial cost. Because Ford maintains a larger domestic manufacturing footprint, it employs more UAW-represented hourly workers in the United States than its Detroit competitors. Consequently, the agreement increased Ford's labor costs by an estimated $850 to $900 per vehicle—a larger absolute increase than that borne by competitors with smaller union footprints. Non-union domestic manufacturers, including Tesla and the U.S. assembly operations of foreign automakers, did not incur a corresponding cost increase.
However, this cost disadvantage must be evaluated in context. Direct labor represents a relatively small fraction of total vehicle production costs compared to raw materials and components. Furthermore, Ford's highest-volume products—full-size trucks and commercial vehicles—command sufficient pricing power to absorb several hundred dollars in incremental costs per unit. The UAW contract presents a manageable margin headwind, though its impact is felt most acutely in lower-priced vehicle segments. This dynamic reinforces the company's strategic emphasis on larger, higher-margin vehicles over low-margin entry-level automobiles.
This ongoing portfolio drift toward protected commercial and truck segments, and away from price-sensitive retail categories, reflects the broader strategic logic shaping Ford's modern operational framework.
IX. Strategic Frameworks: Helmer's 7 Powers & Porter's 5 Forces
Behind Ford's unified logo sits a portfolio of distinctly different competitive positions. Hamilton Helmer's 7 Powers framework provides a useful analytical tool here because it focuses on mechanism—asking not merely whether an enterprise holds an advantage, but what specific structural barrier prevents competitors from eroding it.
Scale economies represent Ford's strongest and most verifiable power, concentrated in two key platforms: the F-Series and the Transit van. Both are manufactured at volumes that allow Ford to spread fixed tooling costs and negotiate component pricing on terms unavailable to smaller rivals. However, this power remains specific to the internal-combustion and hybrid architectures that Ford has already fully amortized. It does not transfer automatically to electric vehicles, where Ford operates as a sub-scale entrant while producers like BYD and Tesla command volume advantages. Consequently, Ford's scale economies are concentrated in legacy businesses rather than its growth initiatives.
Switching costs constitute a second genuine power, located primarily within Ford Pro. As detailed in the commercial segment analysis, these costs stem from deep integration with third-party upfitters and embedded telematics workflows. While these barriers are durable, they remain narrow and tied strictly to commercial operations.
Branding provides pricing power in North American full-size trucks, but offers minimal advantage elsewhere. While the Ford badge supports premium pricing on an F-150 in Texas, it commands little pricing leverage on passenger sedans or SUVs in Europe, where the company has scaled back its retail footprint.
Counter-positioning—the structural advantage where an incumbent cannot imitate a newcomer without damaging its own core business—places Ford at a distinct disadvantage in electrification. Pure-play electric vehicle makers like Tesla and Chinese entrants can design vehicles on clean-sheet architectures without protecting an internal-combustion profit pool. By contrast, Ford must fund electric development using cash generated by legacy margins that electric adoption threatens to erode. Conversely, Ford holds a minor counter-positioning advantage in commercial fleet software, where consumer-focused electric vehicle startups lack the established B2B service infrastructure required to serve commercial buyers.
Process power—the specialized organizational capabilities that competitors cannot easily replicate—is moderate and resides within Ford Pro's commercial dealer and service network. Decades of institutional experience in managing commercial fleet relationships represent an operational asset that new entrants cannot build quickly.
Network economies remain weak due to the isolated nature of fleet telematics data, while cornered resources are essentially absent. Ford possesses no proprietary battery chemistry, no exclusive mineral supply agreements, and no essential patent portfolio that competitors must license. Its battery capabilities depend entirely on joint-venture partnerships with suppliers that also serve competing automakers.
This audit yields a clear strategic diagnosis: Ford holds two genuine competitive powers, both anchored in its traditional commercial and truck franchises, but possesses almost no structural advantage in electric vehicles. While not fatal, this imbalance defines management's core challenge: Ford must fund a costly transition into a market where it lacks structural protection using profits from legacy segments whose long-term dominance is eventually threatened.
Michael Porter's Five Forces framework further clarifies this dynamic by illustrating how industry pressures vary across Ford's operating units.
Threat of new entrants is low in commercial fleets and heavy trucks, where capital intensity, specialized service networks, and upfitter relationships create formidable barriers. Conversely, the threat is high in electric vehicles, where capital requirements are offset by state support for entrants like Chinese manufacturers that possess both capital and advanced battery technology.
Buyer power is high in the retail market, where consumers face numerous substitute vehicles and shop aggressively on monthly finance terms in a higher-interest-rate environment. In contrast, buyer power is moderate in the commercial segment, where high switching costs cushion pricing power. This structural divergence explains the operating margin gap between Ford Blue and Ford Pro far more effectively than vehicle quality comparisons alone.
Supplier power is elevated and expanding in the electric era. The concentration of battery cell manufacturing and critical raw material supply grants upstream vendors leverage that traditional component suppliers rarely held when Ford manufactured its own internal-combustion engines. Electrification effectively transfers value from vehicle assemblers to battery manufacturers—a structural shift in margin distribution independent of operational execution. Compounded by semiconductor concentration and organized labor contracts, Ford's supplier exposure is materially higher in electric vehicles than in legacy platforms.
Substitutes remain a low-to-moderate threat overall. While public transit, micro-mobility, and emerging robotaxi services may reduce urban passenger vehicle demand, commercial contractors and rural truck owners have no viable alternatives to full-size utility vehicles.
Rivalry is intense across all segments. Ford faces traditional competition from General Motors and Stellantis in pickup trucks, Toyota in hybrids, Tesla and Rivian in electric vehicles, and increasingly efficient Chinese manufacturers in international markets outside tariff barriers.
The strategic synthesis highlights a fundamental tension: Ford's competitive position is strongest in mature, defended markets and weakest in high-growth segments. The central investment question is therefore one of timing—whether Ford's commercial profit engine can generate sufficient cash flow for long enough to establish a defensible, profitable position in the electric era.
X. Playbook: Business & Investing Lessons
Four core lessons generalize well beyond Ford, each anchored in corporate execution rather than executive messaging.
Borrow before you need it. The $23.5 billion secured financing executed in November 2006 remains a definitive illustration of a principle capital-intensive cyclical businesses relearn every downturn: credit availability is inversely correlated with credit need.11 Ford pledged its trademarks and major operational assets while financial markets remained accessible. Two years later, competitors that had deferred borrowing faced frozen credit markets without unencumbered collateral to pledge. For investors, balance sheet quality is best evaluated by what an enterprise can borrow during severe industry stress rather than its liquidity during peak operating conditions.
Disaggregation forces discipline. Ford's decision to report Ford Pro, Ford Blue, and Model e as separate business units created direct financial accountability.4 Disaggregation made a $5 billion annual electric-vehicle operating loss impossible to mask within consolidated regional results—and, once exposed, impossible to sustain at original spending levels. Subsequent capital expenditure reductions, project delays, and platform cancellations flowed directly from that accounting disclosure. The broader lesson is that consolidated reporting allows underperforming divisions to hide inside profitable segments; voluntarily increasing financial granularity often signals management's intention to restructure exposed units.
The innovator's dilemma is a capital problem before it is an imagination problem. Ford recognized the shift toward electric vehicles well before execution began. The primary obstacle was capital allocation: adapting existing vehicle architectures offered a lower short-term investment requirement but produced structural design compromises, whereas building clean-sheet electric platforms required massive capital outlays that legacy operating margins could not support during a prolonged adoption ramp. Incumbents rarely fail because they overlook technological transitions; they struggle because the cash flow from a maturing profit pool cannot comfortably finance the transition scale required. Investors evaluating a legacy manufacturer's strategic pivot must model the cash source as rigorously as the vehicle roadmap.
Quality is a margin line, not an engineering line. A recurring warranty expense exceeding $4 billion annually represents far more than a series of isolated defects.9 It functions as a persistent tax on operating profit, neutralizing efficiency gains across manufacturing divisions. Furthermore, warranty expenses compound through resale values: elevated recall rates depress vehicle residual values, which inflates consumer lease payments and reduces vehicle affordability. When an automaker's warranty costs remain roughly double industry benchmarks over multiple operating cycles, the financial drag reflects systemic operational processes rather than temporary misfortune.
These four lessons frame the fundamental disagreement between Ford's optimists and skeptics.
XI. Analysis & Bear vs. Bull Case
The bull case, stated at its strongest, is a sum-of-the-parts argument. Ford Pro produced over $9 billion of EBIT in fiscal 2024 with a growing, high-gross-margin software attachment and genuine customer switching costs.1 Comparable commercial-vehicle and fleet-services businesses—Daimler Truck and Traton among them—trade at valuation multiples that, applied to Pro's earnings, would approach or exceed Ford's entire enterprise value. On that arithmetic, an investor purchasing Ford acquires the commercial business at market price while effectively receiving the world's best-selling truck franchise, a captive finance company earning over $1.6 billion before taxes, and an EV option for nothing.13
The second bull leg is the hybrid bridge. If consumer adoption of pure battery-electric vehicles proceeds more slowly than the 2021 consensus assumed—and subsequent market data has consistently pointed in that direction—then Ford's decision to expand hybrid options across its highest-volume products captures the profitable middle of the transition for a decade, leveraging depreciated tooling and existing supply chains.
The third leg is capital discipline: Ford has demonstrated a willingness to curtail spending on programs that fail return hurdles, with roughly $12 billion in removed EV capital serving as empirical evidence rather than executive rhetoric.
The bear case attacks each leg directly. On the sum of the parts, the objection is not that Pro's earnings are illusory—they are real—but that a conglomerate discount exists for a clear structural reason: those earnings are not accessible to equity holders independently of the loss-making unit consuming them, and management has signaled no intention to spin off the commercial division. A valuable asset that permanently subsidizes a value-destroying segment is worth less than its standalone valuation, with the market discount reflecting that ongoing cash transfer.
On Model e, the bear argument contends that losses are structural rather than developmental. They stem from a persistent battery cost disadvantage against vertically integrated Asian competitors, pricing pressure from rivals operating at lower gross margins, and fixed-cost commitments scaled for volumes that failed to materialize. None of those three factors can be easily resolved through internal operational execution alone.
On warranty, the bear case is the most direct: expenses have failed to normalize despite years of management focus, executive incentive alignment, and public analyst scrutiny.9 A financial drag that persists through such sustained focus reflects embedded engineering and supplier management flaws rather than an easily remediable subsystem issue.
On international markets, the bear case notes that domestic tariff protection is a policy shield rather than an enduring competitive moat, leaving Ford's overseas positions exposed to structural market share loss regardless of internal execution.
And on labor, the 2023 UAW contract permanently widened an already meaningful cost gap against non-union domestic producers and foreign importers.12
Weighing it. The evidence supports a more nuanced conclusion than either side suggests. Ford Pro's competitive advantage is real, mechanistically grounded, and unlikely to dissipate—yet its current mid-teens operating margin was achieved during a favorable supply environment and should not be viewed as a permanent baseline. Ford Blue's truck franchise remains defended in North America by scale, brand loyalty, and an absence of direct substitutes. Conversely, Model e has yet to demonstrate a clear path to profitability, making continued losses the reasonable baseline assumption until the second-generation platform launches and its cost structure is disclosed. Warranty costs remain a confirmed, unresolved structural tax. Finally, the family's Class B voting structure ensures that major portfolio restructuring—such as spinning off Ford Pro—will not occur without family consent.
The central question for investors reduces to a single inquiry: if the commercial business is the primary value driver, what mechanisms guarantee that shareholders capture its returns rather than watching them fund a strategic transition that has already been rescoped twice?
The three metrics that actually settle this. Amid hundreds of disclosed figures, three primary metrics govern the investment outcome.
First, Ford Pro's EBIT margin alongside paid software subscriptions. If paid subscriptions compound past one million while segment operating margins hold in the low teens, the software-plus-switching-cost thesis is validated, justifying a premium valuation multiple. If margins compress toward high single digits as fleet supply normalizes, recent performance will prove to have been cyclical rather than structural.
Second, Model e's EBIT loss per unit. Isolating per-unit operating losses rather than total losses clarifies whether second-generation platform architectures and battery cost reductions are bending the cost curve toward breakeven, or whether deficits simply scale alongside production volume.
Third, warranty expense as a percentage of automotive revenue. This metric provides the cleanest quantitative test of Ford's quality initiatives. Reducing warranty costs from over two percent of revenue toward the industry benchmark of roughly one percent would release billions of dollars in annual cash flow—exceeding the expected yield of any single strategic program. Conversely, a failure to narrow this gap ensures operational gains elsewhere will continue to be absorbed before reaching net income.
Evaluating management's progress against these metrics requires reviewing several key disclosures. The fourth-quarter and full-year 2024 earnings call in February 2025 established current segment baselines and forward guidance.[^5] The July 2024 earnings call provides detailed analyst exchanges regarding warranty spikes and management's explanation of operational lags.9 The March 2023 investor presentation detailed Ford Pro software unit economics and early Model e margin targets, offering a benchmark for tracking narrative consistency against subsequent results.3 Finally, the October 2022 earnings call outlined the rationale for exiting Argo AI, illustrating management's capital allocation framework when terminating underperforming technology investments.[^10]
XII. Strategic Watchlist & Guidance for Article Writer
That core watchlist remains concise because Ford's investment outcome turns on a small number of critical variables. Much of the secondary financial reporting—regional sales volumes, product pricing mix, dealer incentive spending, and inventory turnover—represents operational noise around those primary signals.
A fourth element warrants close monitoring alongside those core metrics: the credit performance of Ford Credit. The captive finance arm generated $1.654 billion in pre-tax earnings during fiscal 2024, but its operating risks differ fundamentally from those of the manufacturing segments.1 Default rates on retail and commercial loans track broader economic stress and employment trends. Simultaneously, residual values on leased vehicles depend on used-car pricing dynamics—where electric vehicle value depreciation has proven especially volatile, exposing the unit to lease-return losses that are only partially visible in current operating results. Any significant deterioration in Ford Credit's earnings would erode a financial buffer that has historically cushioned automotive cyclicality.
Evaluating segment results also requires accounting for management discretion in financial reporting. Key disclosures rely on significant estimations: warranty reserves reflect management assumptions about future repair expenses for vehicles already delivered, restructuring provisions depend on timing determinations, and joint-venture battery plants involve complex consolidation accounting. Furthermore, non-operational swings—such as the mark-to-market adjustments on equity holdings illustrated by the Rivian investment—can swing consolidated net income without reflecting core manufacturing performance.6 Consequently, segment EBIT provides a clearer measure of operational health than net income, while warranty accruals require continued scrutiny to ensure expenses are recognized accurately rather than deferred.
In addition, regulatory policy presents a substantial, two-sided variable. Government emissions and fuel-economy standards directly affect product economics, as hybrid-heavy fleets receive different compliance credit than internal-combustion lines. Similarly, consumer EV tax credits drive retail adoption rates, while international trade policy and tariffs on imported vehicles, components, and battery raw materials determine both market protection and production costs. Because these regulatory shifts remain outside management's control, financial models must treat policy changes as scenario variables rather than fixed assumptions.
Finally, the central strategic variable facing Ford remains inherently uncertain: the pace and price points of consumer electric-vehicle adoption. Given that the automotive industry's multi-year forecasts have repeatedly required revision—leading Ford to abandon its own annual production capacity targets—long-term projections in either direction carry substantial forecast risk. Evaluating Ford's outlook requires recognizing that the exact timeline and economics of the powertrain transition remain unresolved across the global automotive sector.
XIII. Epilogue & "If We Were CEO"
A photograph from November 2006 captures a defining moment in modern industrial history: the legal documentation of Ford pledging the Blue Oval trademark itself as loan collateral.11 An enterprise founded on democratizing mass production had, a century later, mortgaged its own name to ensure survival. The transaction succeeded, establishing a liquidity buffer that carried the automaker through the global financial crisis and illustrating a recurring pattern in Ford's history: severe operational distress followed by structural reinvention.
The central question facing the enterprise in 2026 is whether a fourth structural reinvention is under way or merely under discussion. Three distinct strategic options exist, each carrying distinct capital requirements and trade-offs.
Separate Ford Pro. The cleanest valuation thesis involves spinning off the commercial fleet business into an independent entity while retaining a majority equity stake, mirroring European commercial-truck restructurings. Equity markets would then value a high-margin commercial vehicle and software business on its standalone metrics rather than applying a consolidated legacy automaker multiple. The primary counterargument is operational: Ford Pro's cost structure relies heavily on shared manufacturing, component purchasing, and platform engineering with Ford Blue—the relationship between the F-150 and Super Duty represents an industrial synergy rather than a simple marketing overlap. Splitting the units risks inflating overhead while eroding the scale efficiencies supporting current margins. Furthermore, the family's Class B share structure ensures that any structural separation requires explicit approval from shareholders who have historically prioritized governance continuity and dividend stability.
Go all-in on hybrids. Pausing first-generation retail electric-vehicle expansion to convert the core light-truck and SUV lineup to hybrid powertrains would maximize near-term cash generation from fully depreciated manufacturing assets. However, this strategy risks leaving the automaker without competitive electric architectures or battery supply chains when consumer adoption accelerates—repeating the pattern of legacy incumbents whose core profit pools eroded before alternative capabilities were established.
Partner on the platform. Sharing a low-cost electric platform with another legacy automaker would allow Ford to concentrate capital on its proven core competencies: body-on-frame trucks and commercial telematics software. While Ford has prior partnership experience with Volkswagen on commercial vehicles and previously collaborated on autonomous technology, the dissolution of Argo AI highlights the governance risks inherent in joint technology ventures.5 Nevertheless, sharing a hardware architecture presents far simpler engineering and operational alignment challenges than co-developing frontier software.
Empirical evidence points to a conclusion less dramatic than any of the three strategic pivots: Ford's near-term financial outcome depends far more on reducing warranty expenses and defending Ford Pro's operating margins than on selecting an immediate structural path. The billions of dollars in annual cash flow released by narrowing the warranty gap to industry benchmarks represent a larger, more predictable, and direct operational improvement than any potential gain in the electric roadmap. Yet internal operational discipline receives far less market attention than corporate restructuring narratives.
Henry Ford's foundational insight centered on manufacturing economics rather than automotive design: unit cost, driven by scale and standardized process, serves as the primary competitive weapon in industrial manufacturing. Ford Pro demonstrates that principle effectively, applying scale advantages to commercial fleet buyers who evaluate vehicles on uptime and total cost of ownership. Conversely, Ford Model e illustrates the failure of that framework when an incumbent lacks the scale and cost structure of dedicated competitors.
Ford has bought itself time during previous crises—through balance-sheet leverage, operational simplification, and divesting non-core acquisitions. Whether its commercial moat remains strong enough for long enough to fund another successful reinvention will be determined by operating results and cost execution rather than strategic presentations.
References
-
Ford Motor Company Form 10-K for Fiscal Year Ended December 31, 2024 — SEC EDGAR, 2025-02-06 ↩↩↩↩↩↩↩↩↩↩↩↩↩↩
-
Ford Motor Company 2024 Definitive Proxy Statement (Form DEF 14A) — SEC EDGAR, 2024-03-29 ↩↩↩
-
Ford Teaches Wall Street How to Value Its EV and Commercial Units — Bloomberg, 2023-03-23 ↩↩↩↩↩↩
-
Ford Restructuring Plan Creates Separate EV and ICE Businesses — Reuters, 2022-03-02 ↩↩↩
-
Ford and VW-Backed Argo AI Shutting Down — The Wall Street Journal, 2022-10-26 ↩↩
-
Ford Sells Remaining Stake in Rivian After $7.4 Billion Profit Turns to Loss — Reuters, 2023-02-10 ↩↩
-
Ford Sales of Jaguar and Land Rover to Tata Motors Completed — Financial Times, 2008-06-02 ↩
-
Ford Completes Sale of Volvo to China's Geely for $1.8 Billion — Reuters, 2010-08-02 ↩
-
Ford Warranty Expenses Drag Down Quarter Profits as Quality Issues Persist — Bloomberg, 2024-07-24 ↩↩↩↩↩↩
-
Ford Retrenches on EV Plans, Cancels Electric SUV and Delays Pickup — Reuters, 2024-08-21 ↩↩
-
Ford Pledges Assets for $23.5 Billion Financing Package — The Wall Street Journal, 2006-11-28 ↩↩↩
-
UAW Reaches Tentative Agreement with Ford to End 6-Week Strike — Associated Press, 2023-10-25 ↩↩
 LinkedIn
 WhatsApp
 Reddit
 Hacker News
 Email
Email Kindle
 RSS Feed
 Spotify
 Apple Podcasts
 Amazon Music
 Audible
 YouTube