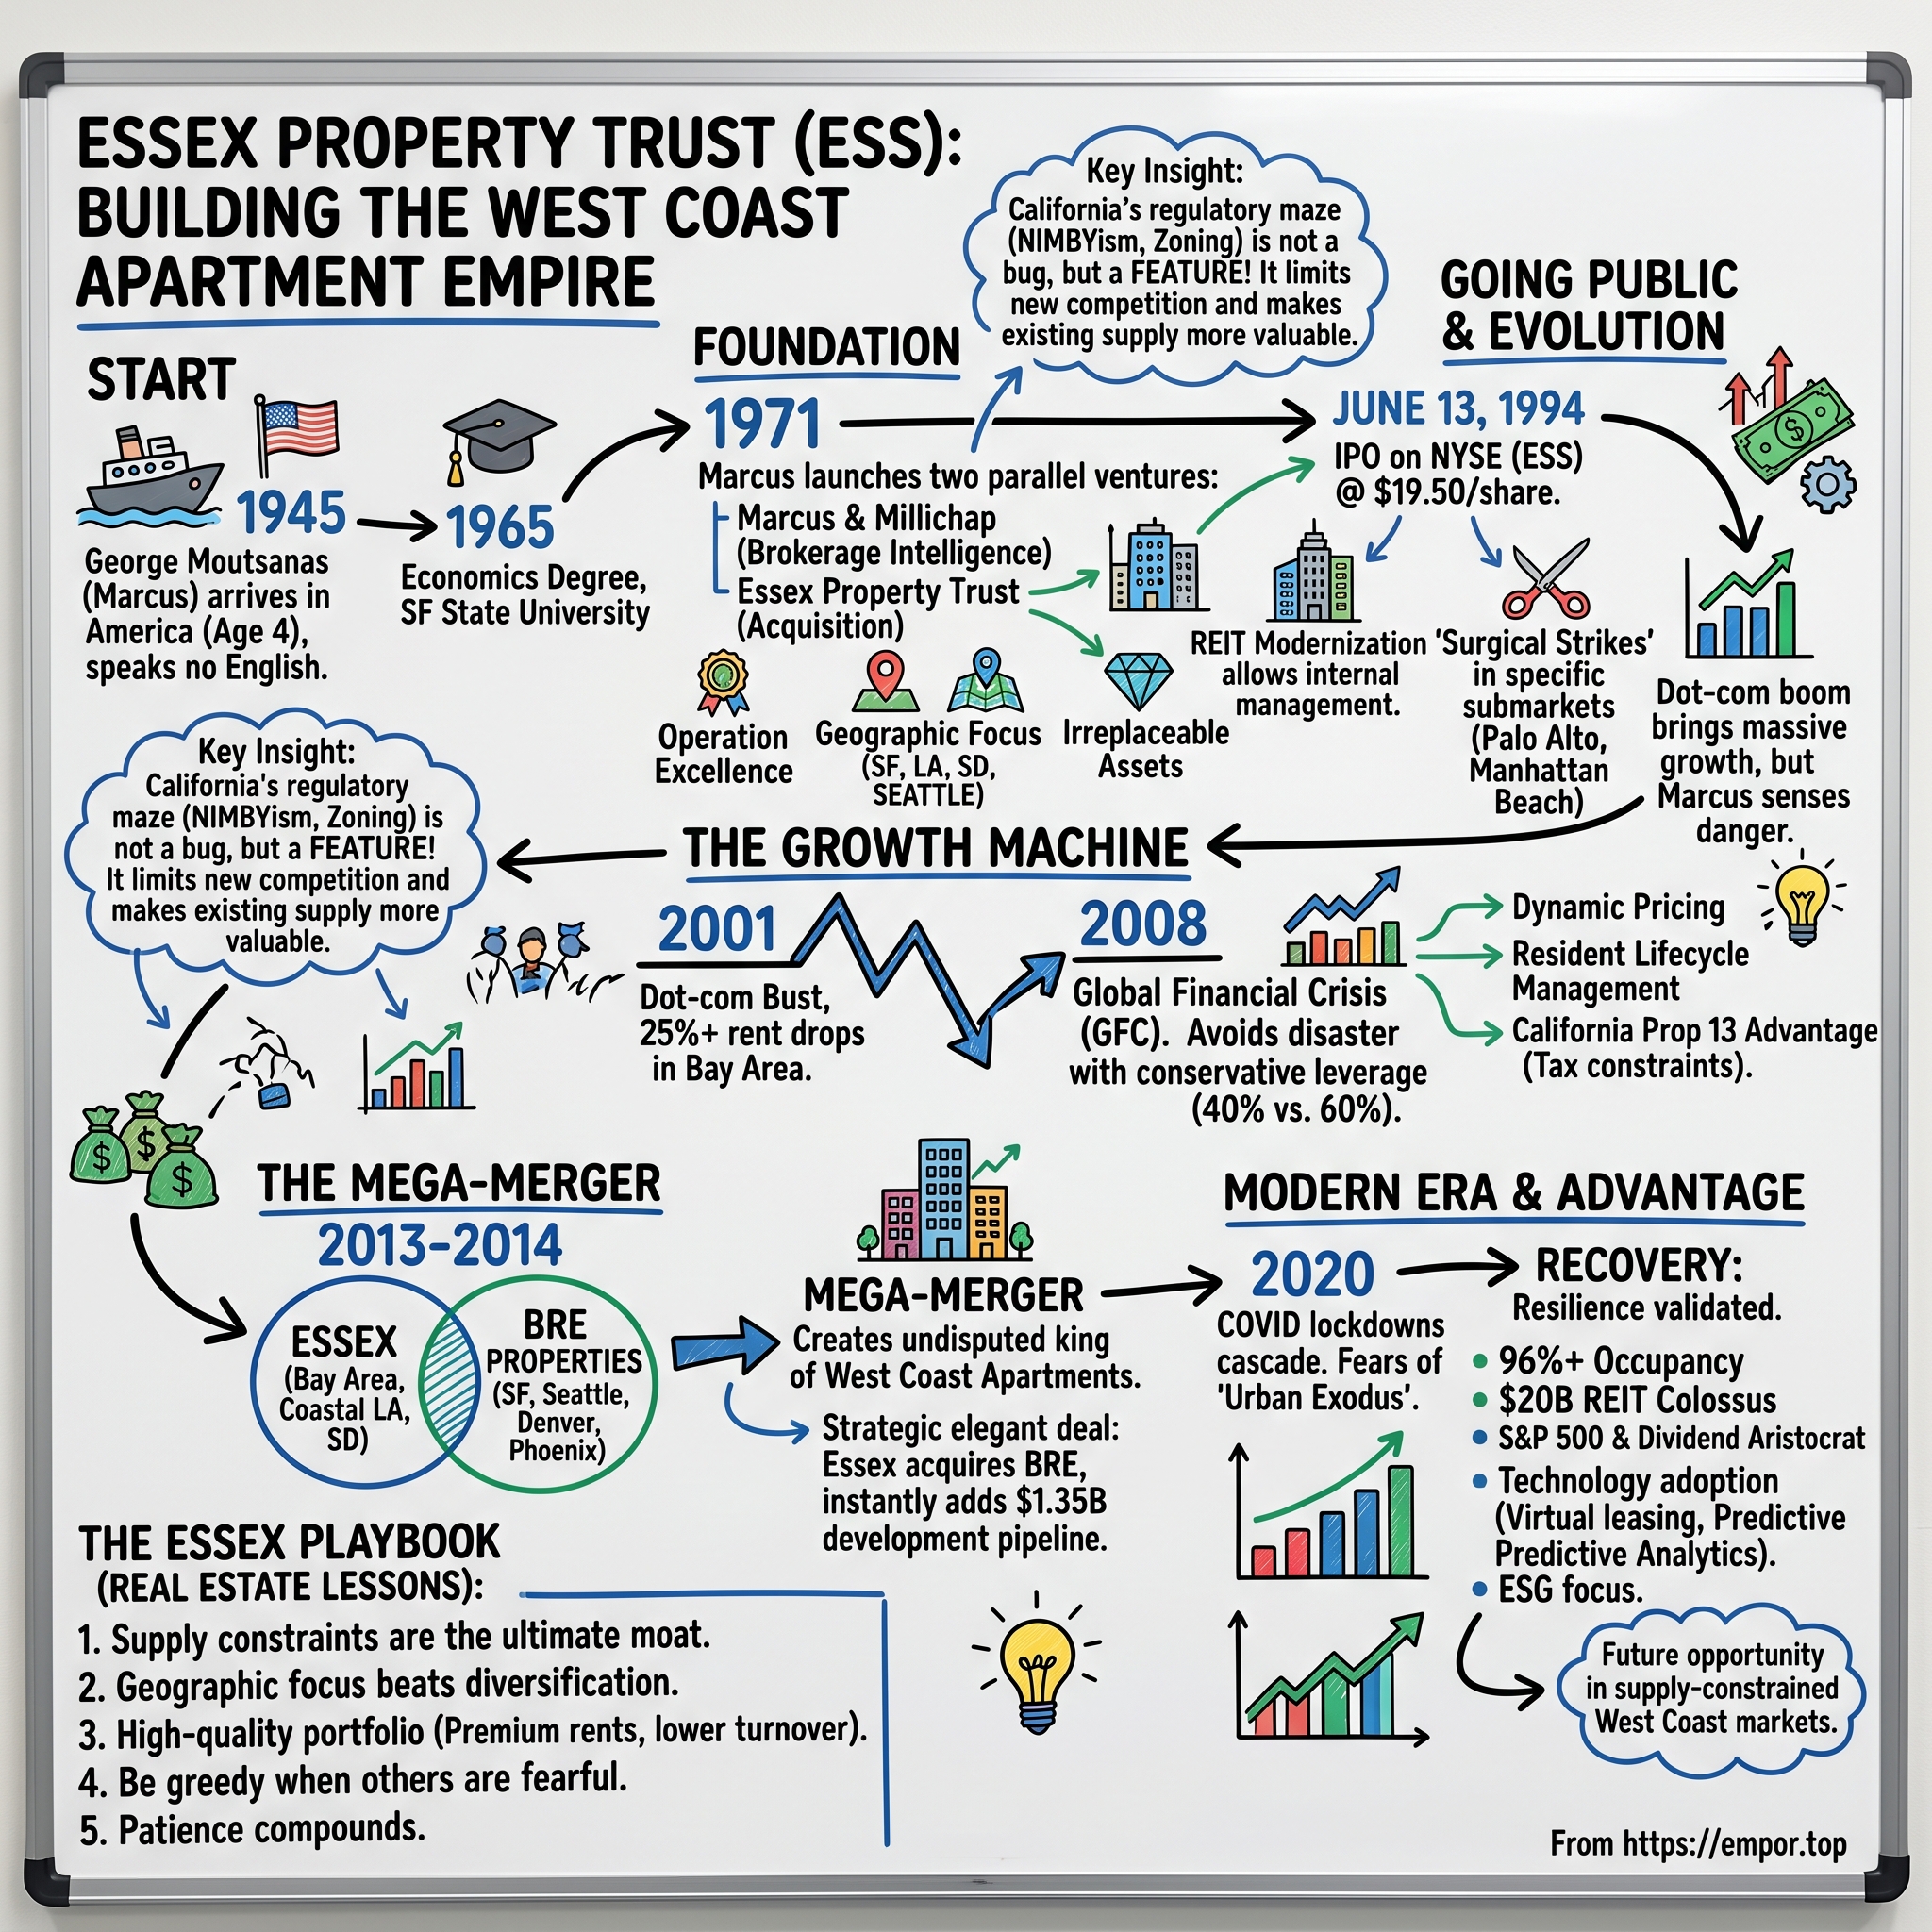
Essex Property Trust: Building the West Coast Apartment Empire
I. Introduction & Episode Roadmap
There is a particular kind of drive you can take on a weekday morning in September 2026 that explains Essex Property Trust better than any slide deck. Start in Redwood City, head south on U.S. Route 101 past the Meta campus, cut across to Sunnyvale and Santa Clara, then loop back up the Peninsula. Along that corridor you pass garden-style apartment communities with names like Hillsdale Garden, Marina Cove, and Esplanade — low-rise, stucco, unremarkable. Many of them were built between 1960 and 1990. Almost none of them could be built today. That last sentence is the core investment thesis — and also its central risk.
Essex Property Trust, Inc. trades on the New York Stock Exchange under the ticker ESS, sits in the S&P 500, and owns or holds interests in more than 250 apartment communities containing roughly 62,000 homes, concentrated in three West Coast clusters: Northern California, Southern California, and the Seattle metro area.12 It is the only large public real estate investment trust (REIT) that has refused to own property outside those markets. Peers such as AvalonBay Communities and Equity Residential — both larger and older — long ago diversified into the Sunbelt and the East Coast. Essex did not. That refusal is not an accident of history; it is the core thesis.
The economic engine is straightforward to describe and surprisingly hard to replicate. Annual revenues run in the neighborhood of $1.8 billion, with net operating income — rent collected minus property operating expenses, before interest, depreciation, and corporate overhead — in the $1.2 billion range.1 Northern California and Southern California each contribute roughly two-fifths of that net operating income, with Seattle supplying most of the balance.1 There is no fourth leg. When the Bay Area economy slows, Essex does not have Sunbelt markets like Phoenix to offset the drop.
Two smaller operations sit alongside the core property portfolio. The first is a structured finance and preferred equity program: Essex writes checks into the capital stacks of third-party West Coast developers, positioning its capital above common equity and below senior mortgages to earn low-double-digit returns with contractual redemption dates.1 The second is the Essex Innovation Hub, a modest venture program that invests in property-technology startups and uses Essex's own portfolio as a testbed. Both programs are real, but neither is large. Together, they contribute a low-single-digit share of core funds from operations, serving as tactical yield and strategic optionality rather than a second business.1
The central question this story examines is narrower and sharper than whether West Coast real estate is a good asset class. It asks whether Essex's structural thesis holds up under stress. The company's investment case relies on supply scarcity — the premise that the California Environmental Quality Act, Proposition 13 tax mechanics, and restrictive municipal zoning make it functionally impossible for competitors to build an apartment building next door. That claim has been tested three times during the company's public history, and it did not survive all three intact. Supply scarcity protected Essex in 2009 and again in 2015. It provided little protection in 2020, however, when remote work severed the link between high-wage regional jobs and local apartments, causing Bay Area rents to drop sharply despite zero new competing supply. A moat that functions only when demand is geographically captive is a real moat with a specific failure mode — and defining that failure mode is essential to evaluating the company.
What follows traces four main threads: how the mechanics of supply constraints generate cash flow; how Essex allocated capital across five distinct cycles and where that allocation stumbled; what the $4.3 billion BRE Properties merger of 2014 actually delivered versus what was pitched; and how a company heavily discounted during the 2021 "San Francisco is over" narrative found itself, by 2026, sitting atop the highest concentration of artificial-intelligence capital formation in the world. It begins with a Greek immigrant who recognized something about California real estate in 1971 that took the public market another thirty years to price.
 Subscribe on LinkedIn
II. The Founder & The West Coast Thesis: George Marcus & Early Real Estate (1971–1994)
He was born George Moutsanas in 1941 on the island of Euboea, off the eastern coast of Greece, and arrived in the United States at the age of four, part of a family that would settle in California and Americanize the surname to Marcus.3 The biographical facts are thin and he has never been an especially confessional public figure, but the shape of the formation is clear enough: an immigrant childhood in postwar California, a state that was in the middle of the most explosive population expansion in American history, and an economics degree from San Francisco State University in 1965.3
What George Marcus saw in the mid-1960s was not a real estate opportunity in the ordinary sense. California in that decade was adding people faster than it was adding buildings, and a young man selling apartment buildings for a living had a front-row seat to the gap. In 1971 he did two things in the same year that, in retrospect, functioned as a single idea. He founded Marcus & Millichap, the commercial real estate brokerage that would grow into one of the largest private-capital investment sales platforms in the country, and he founded Essex Property Corporation, the private vehicle that eventually became Essex Property Trust.3
Understanding why those two businesses belonged together is the key to the early story. A brokerage is a listening post. Marcus & Millichap agents were, every day, learning what a garden apartment in Hayward actually traded for, which owner was tired, which lender was nervous, and which submarket had quietly run out of developable parcels. That flow of information is not a legal moat and it was not exclusive — plenty of brokers knew the same things. But it is a genuine informational edge when the counterparties are individual owners rather than institutions, and West Coast multifamily in the 1970s and 1980s was overwhelmingly owned by individuals. Essex was buying from people whose broker was, structurally, on the same side as Essex.
There is one more feature of the brokerage-plus-owner structure worth naming, because it is also the first governance question in the Essex story. Marcus & Millichap and Essex Property Trust were two separate businesses sharing a founder, and for decades the relationship between them was a related-party consideration that public investors eventually had to take on trust: a brokerage that sources deals and an owner that buys them sit on opposite sides of a price. Essex has disclosed the relationship and governed it through independent board processes, but the structural point stands — the founder's dual role has been simultaneously the company's informational edge and a standing conflict that requires disclosure rather than elimination. Investors who value founder alignment should price both halves of that arrangement, not just the flattering one.
The choice of multifamily over office or retail deserves a moment, because it is the decision that has aged best. An apartment lease typically runs twelve months. An office lease runs ten years. In an inflationary world, the twelve-month lease is a feature: the landlord reprices the entire portfolio every year, which makes apartment rents an unusually direct inflation pass-through. The same structure cuts the other way in a downturn — you reprice into weakness just as fast — but over a fifty-year span in a state with chronic housing shortage, the annual reset compounded in Essex's favor. Retail depends on merchant health; office depends on corporate headcount decisions made in boardrooms. Housing depends on people needing somewhere to sleep, which is about as durable a demand driver as exists.
Then there is the regulatory accident that Marcus arguably understood earlier than most. The California Environmental Quality Act, signed in 1970, required environmental review for discretionary projects — a statute written for freeways and refineries that became, over subsequent decades, the single most effective tool available to any neighbor who wished to stop an apartment building. Layer on Proposition 13 in 1978, which capped property tax increases on long-held assets, and municipal zoning regimes in which a single-family-home majority votes on multifamily entitlements, and you get a system that systematically under-produces housing in exactly the places where wages are highest. Marcus did not create that system. He simply bet, early, that it would not be fixed.
The 1970s and 1980s tested whether the bet could be held. Mortgage rates in the late 1970s ran into the high teens, an environment in which leverage is not a strategy but a solvency question. Essex operated in that era primarily through joint ventures and partnerships with conservative loan-to-value ratios and seller financing, keeping the balance sheet survivable rather than maximizing returns. Then came the Tax Reform Act of 1986, which gutted the passive-loss deductions that had powered a decade of tax-shelter real estate syndications, followed by the Savings & Loan crisis, which removed the lenders who had financed the froth. Sponsors who had bought buildings for the tax deductions rather than the cash flow were wiped out. Essex, which had bought buildings for the cash flow, was not.
Falsification: was the early California focus really a clean run?
The tempting version of this history is that Marcus identified high-growth markets and never looked back. The record does not support it. In the early 1990s, the end of the Cold War triggered a defense-industry drawdown that fell disproportionately on Southern California, where aerospace and defense contractors in Los Angeles and Orange County shed large numbers of high-wage jobs. Essex's Southern California holdings went through a period of falling effective rents and softer occupancy in the years immediately preceding the IPO, forcing property-level management changes and deferred capital spending.
The analytical point is not that Essex made a mistake. It is that the mechanism was already visible thirty years before COVID: Essex's portfolio is levered to a small number of concentrated, high-wage employment clusters, and when the industry anchoring a cluster contracts, land scarcity provides no floor. Aerospace in 1992 and remote work in 2020 are the same failure mode wearing different clothes. Marcus's insight was real, but it was an insight about supply. Demand was always going to be someone else's variable — which is precisely what the public markets were about to start pricing, because in June 1994 Essex went public.
III. Going Public & The REIT Modernization Era (1994–2008)
On June 13, 1994, Essex Property Trust priced its initial public offering on the New York Stock Exchange at $19.50 per share. The portfolio it carried into the public markets was small by modern standards: sixteen multifamily communities containing roughly 4,000 apartment homes—essentially a regional operator with a conservative balance sheet and a clear strategy.
The timing was strategic. The early 1990s reshaped the real estate investment trust industry. Private real estate partnerships had been devastated by the Savings and Loan collapse, traditional bank lending tightened, and public equity markets became the primary source of capital for property owners. Dozens of family-controlled property firms converted into public REITs between 1993 and 1994, trading illiquidity and private control for permanent capital and acquisition equity. Legislative changes through the decade, culminating in the REIT Modernization Act, loosened operational restrictions and institutionalized the structure. Essex went public at the beginning of that expansion, securing a runway of public capital for growth.
What Essex built over the following fourteen years was less a simple collection of properties than a systematic discipline built on three core rules.
Rule one: buy within commuting distance of a high-wage employment node. Essex targeted submarkets roughly thirty minutes from major concentrations of technology, biotechnology, healthcare, and aerospace jobs across Silicon Valley, the San Francisco Peninsula, West Los Angeles, Orange County, and the Seattle Eastside. Rent is fundamentally a function of household income, which is anchored by local wages. A $3,200 monthly rent may be unsustainable in lower-wage markets, yet remains standard in Sunnyvale.
Rule two: buy, don't build, unless the math is overwhelming. Essex's primary discipline was acquiring existing communities at a significant discount to replacement cost. Purchasing below construction cost accomplishes two objectives: it lowers the acquisition basis, and it signals that competitors cannot economically construct new units at current rent levels. Replacement cost functions as a supply indicator. When market values sit below construction costs, new development stalls, strengthening the pricing power of existing owners.
Rule three: exploit Proposition 13 as an operating-cost advantage. This mechanism provides a durable cost edge in California. Under Proposition 13, a property's assessed value is set at acquisition and rises at a capped annual rate until ownership changes. An apartment community Essex acquired in 1996 carries a property tax assessment anchored to that year's valuation, whereas a competitor purchasing an identical property today resets the tax assessment to current market value. Because property taxes represent one of the largest operating expenses for a stabilized community, long-held Essex assets maintain a structural cost advantage over newly acquired peer properties, independent of operational efficiency. This dynamic creates a strong financial incentive to hold rather than trade California assets.
The dot-com cycle provided the first major public test of this strategy. Between 1997 and 2000, Bay Area apartment rents surged as venture capital flowed into the region and job creation far outpaced housing construction. When the tech bubble burst, hiring stopped, and supply constraints provided no floor for falling demand. Bay Area same-property revenues fell by more than 8 percent year over year during the 2001–2003 downturn—a severe decline for a sector often valued for income stability.
Falsification: does geographic concentration guarantee resilient pricing?
It does not, as Essex's performance during the 2001 downturn demonstrated. The evidence refutes the claim that concentrating in high-barrier, high-wage technology corridors guarantees pricing power across all economic conditions. Geographic concentration generates amplitude: greater upside during expansions, offset by steeper drawdowns during regional contractions. The core thesis for Essex relies not on smooth cash flows, but on peak earnings and rapid recoveries that outpace broader market averages over full cycles. That approach requires investors to underwrite cyclical volatility rather than assume downside insulation.
Notably, Essex maintained its dividend throughout the 2001–2003 downturn, reflecting disciplined debt management and debt maturity scheduling that more leveraged peers failed to match. Whether that capital discipline would survive a systemic financial crisis remained to be tested five years later.
IV. The GFC Pivot & The Playbook: Operating in High-Barrier Markets (2008–2013)
By the autumn of 2008, the apartment industry had divided into two distinct groups. The first had spent 2005 to 2007 building merchant-development pipelines in Phoenix, Las Vegas, Atlanta, and the Inland Empire, financed with construction loans that assumed a buyer would be waiting at completion. The second group had not. When credit markets froze, that distinction stopped being a matter of corporate style and became a matter of survival.
Essex fell squarely into the second group. The company maintained a conservative balance sheet, keeping net debt to EBITDA generally below six times — a buffer designed to absorb earnings declines without breaching covenants. Real estate leverage looks deceptively benign during expansions because rising revenue masks debt risk. The true test of a leverage policy is whether it survives when net operating income falls.
That balance-sheet strength allowed Essex to capitalize on the most productive acquisition window in its history. Through 2009 and 2010, the company acquired properties from distressed lenders and overextended developers at prices well below replacement cost. For an operator anchored to the principle of buying below construction cost, a market where new development stalled and existing assets traded at deep discounts represented an ideal buying environment.
Leadership transitioned during this expansion. Michael J. Schall, who had previously served as chief operating officer and chief financial officer, became chief executive officer in 2010. Schall brought a quantitative discipline that formalized the analytical framework previously guided by George Marcus's intuition.
The job-to-permit ratio, explained simply
The core metric behind this framework is best understood through a simple comparison. Consider a city that adds fifty jobs and fifty new apartment units in a single year. Housing supply matches demand, keeping rents flat. Now consider a city that adds fifty jobs but only five apartments. Ten new workers compete for every new home, pushing rents higher until wages plateau or residents relocate.
Essex institutionalized this dynamic through the job-to-permit ratio, screening for submarkets that generated significantly more than five new jobs per residential permit. West Coast coastal markets consistently posted ratios in the high single digits due to slow permitting, scarce land, and pervasive litigation risk. By contrast, Sunbelt markets — where developers could entitle and build garden apartments on open land in eighteen months — routinely logged ratios at or below two. In those expansion markets, robust job growth failed to yield strong rent growth because new housing supply rapidly absorbed demand.
This dynamic explains a recurring paradox in apartment investing: a city like Austin can generate jobs at triple the pace of San Jose yet yield weaker rent growth. Job creation alone does not drive pricing power; job creation relative to construction barriers creates scarcity. Essex prioritized owning supply-constrained scarcity over raw economic growth.
However, this analytical model carries a critical assumption: workers must remain physically tied to their local employment hubs. The job-to-permit ratio is a supply-side metric dependent on captive regional demand, making geographic attachment a central point of sensitivity.
To improve capital efficiency, Essex also expanded its operational toolkit during this era. The company established a co-investment platform with institutional partners to acquire larger property portfolios while retaining asset-management fees and promote structures. Alongside it, the company launched the preferred equity and structured finance program, providing gap capital to third-party West Coast developers at low-double-digit yields.1 These initiatives broadened Essex's footprint without overextending its balance sheet. Developers assumed construction risk, while Essex secured senior positioning and steady cash flow. The structure functioned for years as an effective spread trade on Essex's cost of capital and underwriting expertise, though subsequent market stress in 2023 would test its resilience.
By 2013, Essex possessed a fortified balance sheet, an institutional platform, and a tested underwriting playbook. What it still lacked was market scale — an opportunity that would soon emerge across the bay.
V. The Landmark Deal: Acquiring BRE Properties for $4.3B (2013–2014)
The West Coast apartment landscape was redrawn twice in eighteen months, with the first realignment setting up the second. In late 2012, Archstone — a major private apartment portfolio owned by the estate of Lehman Brothers — was acquired and split between Equity Residential and AvalonBay Communities. For the two largest public apartment REITs, that joint acquisition delivered a step-change in West Coast market density. For smaller operators, it served as a clear signal that institutional consolidation of coastal apartments was accelerating, placing subscale companies under increasing pressure when competing against balance sheets several times their size.
BRE Properties emerged as the next logical candidate for consolidation. A San Francisco–headquartered REIT with a West Coast apartment portfolio valued at roughly $5 billion, BRE owned quality real estate paired with distinct operational challenges: an operating cost structure that lagged peers, a heavy speculative development pipeline that consumed capital without generating immediate income, and an activist investor — Jonathan Litt's Land & Buildings — publicly agitating for a sale.4 While activist pressure did not create the underlying strategic logic of combining BRE and Essex, it compressed the execution timeline.
The acquisition was announced in December 2013 and completed on April 1, 2014.45 Total transaction value reached approximately $4.3 billion, creating a combined entity with an enterprise value of roughly $16 billion.4 The consideration was structured as 0.2971 Essex shares plus $7.18 in cash for each BRE share, alongside a pre-closing special distribution of $5.15 per share — a structure enabling BRE shareholders to receive most of their value in Essex equity while securing sufficient cash to cover tax obligations.45 By adding roughly 14,500 apartment homes, Essex became the clear scale leader and sole pure-play owner of West Coast apartments among public REITs.4
Was it a good price?
The transaction's implied capitalization rate — first-year net operating income divided by purchase price — landed in the mid-4 percent range, matching prevailing market pricing for prime West Coast apartments in 2014. Essex did not secure a bargain purchase. Instead, it acquired three strategic advantages that a simple price discount could not provide.
First, it acquired assets that could not be easily replicated. Purchasing an established portfolio of entitled, well-located West Coast communities in a single transaction avoided a decade of competing against institutional buyers for individual properties.
Second, the merger allowed immediate overhead elimination. Running a $5 billion public REIT requires corporate leadership, board governance, auditing, regulatory filings, investor relations, and office space — infrastructure Essex already maintained. Eliminating duplicate general and administrative costs generated $35 million to $40 million in annualized savings with minimal execution risk, providing a permanent margin boost in an industry where 3 percent annual same-property net operating income growth represents a strong result.
Third, Essex executed an operational arbitrage. Management argued — and subsequent property performance confirmed — that BRE's communities were underperforming their potential, and that applying Essex's proprietary pricing systems, operating platform, and regional density would expand net operating income margins across the acquired buildings.
Falsification: was the merger the clean win it is usually described as?
The transaction outcome fell short of a flawless victory, and the gap between initial pitch and actual execution remains instructive. Essex struggled to seamlessly integrate BRE's inherited development pipeline — roughly $1.35 billion in active projects concentrated in Seattle and Southern California. Development carries structural cost and timing risks that Essex had spent two decades minimizing. Through 2015 and 2016, those inherited projects faced construction cost inflation and schedule delays, yielding returns on invested capital below initial underwriting targets. Consequently, Essex spent several years executing a portfolio cleanup to prune non-core assets, land positions, and out-of-market holdings.
The historical record narrows the narrative surrounding Essex as an acquirer. The core thesis on stabilized assets — acquiring irreplaceable properties, eliminating duplicate corporate overhead, and improving operational margins — proved valid and executed on schedule. Conversely, inheriting an active development pipeline proved to be a liability rather than a growth driver, requiring more than three years of asset sales and write-downs to resolve. This distinction offers a clear benchmark for future acquisitions: management's synergy targets on stabilized real estate carry strong credibility, whereas development and joint-venture return projections warrant higher scrutiny against historical yields.
Essex emerged from the integration with its core modern portfolio established and its operational footprint solidified. By the mid-2010s, the central question facing the company shifted from whether Essex could scale to whether its market thesis and competitive advantages remained as durable as investors assumed.
VI. Micro-Economics, Helmer's 7 Powers & Porter's 5 Forces: Why Essex Wins (and Where It's Vulnerable)
                   ESSEX PROPERTY TRUST: COMPETITIVE POWER MATRIX

   +-------------------------------------------------------------------------+
   | HAMILTON HELMER'S 7 POWERS                                              |
   |                                                                         |
   |  [Cornered Resource]  --> Coastal West Coast Land & Entitlements        |
   |  [Scale Economies]    --> Local Density: Submarket Maintenance & Mgmt   |
   |  [Counter-Positioning]--> 100% Pure-Play Focus vs. Sunbelt Expansion    |
   +-------------------------------------------------------------------------+
                                       |
                                       v
   +-------------------------------------------------------------------------+
   | PORTER'S FIVE FORCES ANALYSIS                                           |
   |                                                                         |
   |  - Threat of New Entrants:  EXTREMELY LOW (CEQA, Zoning, Permitting)    |
   |  - Buyer Power:             LOW/MODERATE (Mortgage Gap: Rent vs. Own)   |
   |  - Threat of Substitutes:   MODERATE (Out-Migration / Single Family)    |
   |  - Supplier Power:          HIGH (Construction Labor, Taxes, Insurance) |
   |  - Competitive Rivalry:     MODERATE (AVB, EQR, Institutional Private)  |
   +-------------------------------------------------------------------------+
Real estate is often characterized as a business without moats — land is commoditized, capital is abundant, and any entity with funding can purchase a building. That assumption holds across much of the country, but it proves meaningfully less true in coastal California. Applying competitive strategy frameworks to Essex clarifies where its structural edge originates and where its model remains exposed.
Cornered resource. In Hamilton Helmer's framework, a cornered resource represents preferential access to a valuable asset on terms competitors cannot obtain. For Essex, the resource is not raw land, but the combination of location, vested legal entitlements, and a grandfathered property tax basis. Across San Jose, Los Angeles, Orange County, and the Seattle Eastside, advancing a parcel from unpermitted land to an entitled, litigation-cleared construction site routinely takes five to ten years and carries substantial execution risk. The primary asset Essex holds is effectively a completed regulatory entitlement that has survived a approval process few projects navigate successfully. That regulatory hurdle is difficult to replicate and represents the strongest of Essex's structural advantages.
Scale economies, but local rather than national. Operational leverage in apartment management stems less from owning 62,000 units nationwide than from controlling 2,000 units within a tight geographical radius. Submarket density enables a single maintenance team to service multiple properties, allows leasing operations to centralize off-site, increases the span of control for regional managers, and grants negotiating power with local service vendors. A national competitor holding 500 units dispersed across a broad metropolitan area lacks these operational efficiencies. Consequently, Essex's geographic clustering operates as a core efficiency strategy rather than a simple asset-selection preference, explaining the operational synergies realized in major acquisitions.
Counter-positioning, with an asterisk. Essex has consistently declined to follow peers into high-growth Sunbelt markets, accepting California's tax and regulatory climate in exchange for structural supply limits. Strictly defined, counter-positioning requires that an incumbent cannot replicate a model without harming its core business. That definition does not perfectly fit Essex's position, as national REITs like AvalonBay and Equity Residential maintain coastal West Coast portfolios alongside their Sunbelt assets. Instead, Essex's approach represents a focused portfolio construction choice that yields a distinct risk-return profile: higher regional earnings volatility and elevated regulatory exposure, offset by structural supply protections unmatched in expanding markets.
The five forces, with the numbers explained rather than listed
Threat of new entrants: very low. The primary barrier to new development is economic rather than purely financial. Land costs in Essex's core submarkets frequently reach six-figure sums per apartment unit before ground breaking, while total construction costs for new coastal units significantly exceed the prevailing market values of existing communities. When building new properties costs substantially more than purchasing comparable operational assets next door, development slows. This valuation gap reinforces supply constraints, widening further after 2022 as construction expenses and debt financing costs rose.
Bargaining power of buyers — meaning residents: low to moderate. Tenant retention is heavily driven by the financial gap between renting and buying. With median single-family home prices in San Jose and San Francisco remaining in seven-figure territory, the monthly cost of owning a median home substantially exceeds the rent for a comparable high-end apartment. That affordability gap expanded significantly when benchmark mortgage rates rose from roughly 3 percent to the 6 to 7 percent range after 2022. As a result, higher-earning residents who might typically transition to homeownership remain in the rental market. While this dynamic provides short-term pricing stability, it remains rate-sensitive: a sustained decline in mortgage rates would narrow the gap and restore homeownership as an exit option for top-tier renters.
Bargaining power of suppliers: high, and rising. Supplier pressure represents an ongoing cost constraint on Essex's operating model. Key external suppliers include municipalities, insurance underwriters, and utility providers. Property tax rates remain subject to municipal budget demands, while West Coast property insurance premiums repriced sharply upward following re-assessments of regional wildfire and seismic risks, generating double-digit percentage increases in operational insurance overhead. Additionally, skilled construction and trade labor remains expensive across major West Coast metros. Because operators possess minimal bargaining leverage over these fixed expenses, property expense growth frequently serves as the primary variable impacting annual net operating income performance.
Threat of substitutes: moderate, and structurally higher than pre-2020. Substitutes take the form of alternate geographies and housing formats, including relocation to lower-tax states such as Nevada, Texas, Arizona, or Idaho, single-family rental homes in secondary submarkets, and remote-work flexibility. While geographically captive demand previously anchored tenant retention, expanded remote-work options permanently broadened the range of living alternatives available to high-wage tech workers.
Competitive rivalry: moderate. Institutional peers like AvalonBay and Equity Residential operate at similar standards and compete primarily for institutional property acquisitions rather than individual renters. At the property level, Essex's primary competition comes from fragmented private and family landlords. Private owners often lack automated revenue-management platforms, self-guided touring systems, and centralized maintenance infrastructure — creating an operational gap that Essex leverages to maintain higher occupancy rates and faster unit turnover.
Taken together, Essex's competitive matrix demonstrates a fortified supply position paired with clear sensitivities on operating costs and regional demand. That operational balance faced its next major structural test as macroeconomic conditions shifted.
VII. The Modern Crucible: COVID Exodus, Tech Downturn, and the AI Land Rush (2020–Present)
In the spring of 2020, something happened to San Francisco that had never happened to a high-barrier housing market in the modern era: demand simply left. Technology employment held up remarkably well, but the jobs stopped requiring physical proximity. A software engineer earning $220,000 discovered that an apartment justified by a daily commute was no longer necessary, and within months population flows reversed.
The resulting drop was rapid and severe. Bay Area market rents fell 20 to 25 percent within roughly twelve months, with San Francisco and Oakland recording the steepest declines. Not a single competing apartment community caused the downturn; the supply pipeline was emptier than usual. Every structural supply protection Essex owned remained fully intact yet functionally irrelevant.
Policy decisions compounded the operational strain. California and local municipalities enacted eviction moratoriums, and in Los Angeles County those restrictions persisted long after the acute phase of the pandemic ended. Landlords were unable to remove non-paying residents, allowing unpaid balances to accumulate for years. Bad debt — rent billed but never collected — rose from a historical average of roughly half a percent of revenue to several percentage points. The Los Angeles delinquency problem lingered well beyond the Bay Area's rent recovery, highlighting a key operating reality: Essex's revenue depends not just on rental rates and physical occupancy, but on collectible rent, making municipal policy a direct factor in cash-flow stability.
Falsification: does supply constraint prevent cash flow collapse?
It does not, as performance in 2020 and 2021 demonstrated. Essex recorded same-property net operating income declines in the mid-to-high single digits across that stretch — the steepest contraction in its public history — despite zero new competing supply. The claim that West Coast barriers to entry protect landlord cash flows under every macroeconomic condition is refuted by empirical evidence.
The defensible version of the thesis is more measured: supply constraints amplify the recovery by ensuring that when demand returns, no new inventory exists to absorb it. Subsequent results supported that distinction. Key forward indicators — specifically office attendance metrics, corporate return-to-office mandates, and net domestic migration back into the Bay Area and Seattle — signaled the timing of the rebound.
The recovery did not follow a straight line. Through 2022 and into 2023, major technology employers reversed headcount growth, with companies including Meta, Google, Amazon, Microsoft, and Salesforce collectively eliminating well over 100,000 positions. For a landlord serving high-wage tech workers, those corporate cuts curtailed renewal pricing power across Silicon Valley and Seattle's Eastside just as regional fundamentals began to stabilize.
Amid this environment, leadership transitioned. In April 2023, Michael Schall retired after thirteen years as chief executive, and Angela L. Kleiman — who joined Essex in 2009 and served as chief financial officer and chief operating officer — became president and chief executive officer.6 Promoting an executive with background in finance and operations over acquisitions signaled a strategic priority: focusing on balance sheet preservation and operational efficiency rather than portfolio expansion.
The turn
The artificial intelligence capital cycle reshaped the Bay Area's economic trajectory faster than markets anticipated in 2021. Beginning in 2023 and accelerating through 2024 and 2025, venture capital and corporate investment concentrated heavily in San Francisco and along the Peninsula. Companies such as OpenAI, Anthropic, Databricks, xAI, and Scale AI expanded rapidly, offering compensation packages above historical tech sector averages. Crucially, these firms favored in-person engineering collaboration, establishing mandatory three- and four-day office schedules that re-anchored workers to local submarkets.
Essex's operational metrics mirrored the capital inflow. Northern California, the company's weakest segment from 2020 through 2022, emerged as its primary growth driver, with same-property revenue growth accelerating through 2025 and continuing to lead regional performance into 2026.2[^7] Management consistently attributed the Northern California outperformance to AI-driven hiring paired with a constrained supply pipeline, raising full-year earnings guidance across consecutive quarters.[^7]7
A cautious perspective remains warranted. Rent growth fueled by capital inflows differs fundamentally from rent growth backed by mature corporate profits. Much of the AI hiring wave in 2025 and 2026 relied on venture funding and corporate research budgets rather than profitable software operations. If capital markets tighten, Essex's top-performing submarkets could face renewed pricing pressure, echoing the 2001 tech downturn. Under that scenario, supply barriers would once again offer limited downside protection.
On the regulatory front, the November 2024 election eliminated a primary headwind. California voters rejected Proposition 33, which sought to repeal the Costa-Hawkins Rental Housing Act and grant local governments broad authority to expand rent control.8 Preserving Costa-Hawkins allowed landlords to continue resetting apartment rents to market rates upon tenant turnover — the primary mechanism Essex relies on to capture rent upside — restoring investor confidence across California multifamily real estate.
Capital allocation during this period shifted heavily back toward the Bay Area. Between 2024 and 2026, Essex deployed hundreds of millions of dollars into Northern California acquisitions at capitalization rates in the mid-5 to 6 percent range, funding purchases through joint ventures and redeemed preferred equity positions rather than new debt or development.2[^7] Management's strategy represents a concentrated reinvestment in its core submarkets — purchasing stabilized assets below replacement cost while avoiding construction risk. Whether that concentration proves to be disciplined conviction or cyclical exposure depends entirely on the durability of the AI expansion.
VIII. Operational Engine, Capital Allocation & Management Deep Dive
If the first three decades of Essex focused on acquiring target properties, the current era concentrates on extracting greater operating efficiency from existing communities — a shift reflecting both capital costs and strategic maturity.
President and Chief Executive Officer Angela L. Kleiman joined Essex in 2009 with a background in corporate finance and investment banking, including experience at J.P. Morgan, serving in senior finance and operations roles before assuming executive leadership.6 Her public messaging emphasizes balance-sheet preservation, disciplined capital allocation, avoiding development risk at elevated construction costs, and expanding operating margins through technology. In quarterly investor communications, management evaluates acquisitions primarily on discount to replacement cost and projected internal rates of return rather than top-line portfolio expansion.[^7]7
Barb Pak, executive vice president and chief financial officer, manages the liability structure conservatively, preserving Essex's investment-grade credit ratings — Baa1 from Moody's and BBB+ from S&P.9 In a capital-intensive sector, unsecured borrowing costs function as a primary cost of capital, where a single-notch rating differential provides meaningful flexibility when underwriting acquisitions across real estate cycles.
Founder and Chairman George M. Marcus retains a substantial equity stake, creating structural alignment between executive leadership and shareholders while concentrating significant governance influence in a long-tenured board leader.3
Executive compensation metrics align with these operational priorities: core funds from operations (FFO) per share against annual guidance, three-year relative total shareholder return compared against the FTSE Nareit Equity Apartments Index, same-property net operating income growth, and balance-sheet targets maintaining net debt to EBITDA at or below roughly 5.5 times.2 Evaluating relative shareholder return against the broader apartment index protects against compensating management for sector-wide valuation rallies driven by interest-rate shifts.
Despite this operational discipline, strategic vulnerabilities remain. Essex's deliberate geographic concentration leaves the REIT exposed to West Coast economic cycles without national diversification. Additionally, co-investment and joint-venture vehicles introduce structural complexity that reduces look-through leverage transparency. Meanwhile, the preferred equity and structured finance book presents a risk profile that management has actively recalibrated following recent market stress.
Structured finance: the claim, and the record that tests it
The preferred equity program was designed to capture double-digit returns by leveraging Essex's West Coast underwriting expertise while holding senior positioning relative to developer equity. The portfolio has operated in the low hundreds of millions of dollars, generating tens of millions in annual income — providing a modest contribution to core FFO while representing a minor fraction of total revenue.1
This structure faced a direct test during the 2023–2024 rate tightening cycle. As rising interest rates expanded capitalization rates, exit valuations for third-party development projects in Seattle and California dropped below original underwriting assumptions. The equity buffers beneath Essex's preferred positions thinned, prompting credit losses and impairments in the low-to-mid tens of millions of dollars. In response, management signaled plans to reduce the accrual portfolio toward roughly $100 million, downsizing exposure rather than maintaining original scale targets.[^7]
This performance provides a clear empirical lesson. While marketed as downside-protected credit capital, preferred development equity functions as subordinated risk capital with capped upside and equity-like downside risk during valuation drawdowns. Conversely, management demonstrated discipline by recognizing impairments promptly and scaling back exposure within a year. Consequently, structured finance operates effectively as a cyclical yield enhancer whose loss provisions tend to cluster during broader market downturns. Investors can track ongoing risk through reported non-accrual balances and quarterly credit loss provisions.
The rent roll underneath all of it
Beyond financial metrics and regulatory policies, Essex's underlying driver remains tenant economics. The typical resident household consists of high-earning single or dual-income professionals paying between $2,800 and $3,400 monthly in rent. In West Coast coastal metros, renting remains compelling not because residents lack qualifying credit for homeownership, but because purchasing a comparable single-family home requires significantly higher monthly debt service and substantial down-payment capital.
This resident demographic delivers strong creditworthiness, maintaining minimal historical delinquency outside mandated pandemic eviction moratoriums. However, high earning power also provides resident mobility. When regional economic conditions or housing arithmetic shift unfavorably, tenants can relocate rapidly across state lines — a dynamic demonstrated during the 2020 outflow.
The technology layer
Operational efficiency relies increasingly on the Essex Innovation Hub. Self-guided touring capabilities allow prospective tenants to view units independently, while centralized maintenance systems pool technicians across regional property clusters. Dynamic revenue-management software optimizes unit pricing based on real-time demand and lease expiration schedules, replacing manual pricing practices. In addition, smart-lock deployments streamline unit turnovers and vendor access.
These technological initiatives have reduced property-level headcount and sustained net operating income margins in the high-60s to 70 percent range despite rising insurance premiums, property taxes, and labor costs.2 While these operating gains provide durable margin support against fragmented private landlords, peer REITs like AvalonBay and Equity Residential deploy similar technology platforms, diminishing the relative advantage among institutional competitors.
IX. Historical Falsification Stress Test: Testing Essex's Key Moats & Thesis Claims
Four core claims underpin the Essex investment thesis. Each has been tested across the company's history, and each survives only within specific boundaries.
Test 1 — The "unassailable" supply constraint. The claim holds that California's regulatory barriers permanently shield Essex's cash flows from downturns. The empirical record refutes this absolute framing. During the 2020–2021 Bay Area contraction, Essex recorded double-digit rent declines and the steepest same-property net operating income drop in its public history without facing any new competing supply. That pattern echoed the early-1990s defense sector drawdown three decades earlier. The evidence rejects the strong thesis while validating a narrower concept: supply constraints do not establish a floor during a demand shock, but they do accelerate the recovery once demand returns because returning tenants encounter an empty construction pipeline. The Bay Area's 2023–2026 rebound provides clear evidence for this limited protection. What to watch: return-to-office attendance, hybrid-work adoption rates across Essex's core submarkets, and net migration trends in the Bay Area and Seattle. These remain demand-side variables, which represent the primary point of failure for the supply moat.
Test 2 — Integration discipline. The claim asserts that Essex is a skilled consolidator capable of acquiring portfolios without execution loss. The historical record validates this for stabilized properties but refutes it for inherited development pipelines. While corporate overhead savings from the $4.3 billion BRE Properties merger materialized on schedule, BRE's $1.35 billion development pipeline generated construction cost overruns, below-target returns, and years of portfolio pruning. The claim holds only in a narrowed form: Essex excels at acquiring and operating stabilized real estate, but lacks a proven advantage in ground-up development. Management's recent capital allocation aligns with this lesson, keeping development activity minimal while channeling capital into stabilized acquisitions. What to watch: realized returns on invested capital across joint ventures and developments relative to initial yield targets.
Test 3 — Structured finance as risk-free yield. The claim posits that Essex's preferred equity and structured finance program generates accretive returns without taking equity-like risk. Credit losses and impairments recorded during the 2023–2024 rate tightening cycle falsified this risk-free narrative, prompting management to reduce the accrual portfolio toward roughly $100 million. The claim survives only as a tactical tool: structured finance functions as a modest, cyclical yield supplement whose downside risks cluster during broader real estate downturns. What to watch: non-accrual loan balances and quarterly credit loss provisions.
Test 4 — Regulatory immunity. The claim suggests that Proposition 13 and the Costa-Hawkins Rental Housing Act permanently shield California apartment owners from adverse regulatory shifts. The political record offers little room for complacency. Statewide ballot initiatives seeking to expand local rent control reached California voters in 2018 as Proposition 10, in 2020 as Proposition 21, and again in 2024 as Proposition 33.8 Although all three measures were defeated, opposing them required the housing industry—with Essex as a major contributor—to fund costly defensive campaigns. These efforts represent recurring capital outlays and a persistent tail risk rather than true immunity. Moreover, three ballot attempts in six years reveal a durable base of voter support, and a single passage would alter market dynamics. Beyond ballot initiatives, statewide legislation caps annual rent increases on older properties, while local municipalities continue to enact tenant protections and eviction restrictions, with Los Angeles's recent delinquency challenges illustrating the direct operational costs. The verdict rejects regulatory immunity in favor of a probabilistic outlook: while current protections remain intact, preserving them requires ongoing defense, leaving long-term outcomes tied to political shifts beyond management's operational control. What to watch: proposed legislation in Sacramento targeting Costa-Hawkins and municipal tenant ordinances across Los Angeles, San Francisco, Oakland, and Seattle.
Taken together, these four stress tests outline the boundaries of the Essex investment case. The company's supply-side protections are real and repeatedly proven, yet its core vulnerabilities rest on regional demand stability and political climate. Every major drawdown in Essex's public history has stemmed from shifts in tenant demand or policy decisions rather than from a rival building competing inventory next door.
X. Bear vs. Bull Case & Investor Stress Test
                           BEAR VS. BULL CASE MATRIX

       BEAR CASE                                       BULL CASE
 +----------------------------------+            +----------------------------------+
 | 1. California Out-Migration &    |            | 1. Record Low Supply Pipeline    |
 |    Population Loss Narrative     |            |    (West Coast Starts Down 40%)  |
 | 2. Permanent Hybrid/Remote Work  |            | 2. AI Boom & Tech RTO Mandates   |
 | 3. Regulatory Headwinds (Rent    |            |    Driving Bay Area Demand       |
 |    Control, Tenant Protections)  |            | 3. Unbeatable Rent vs. Own Gap   |
 | 4. High Cost of Debt Refinancing |            |    (Home Ownership Unaffordable) |
 | 5. Los Angeles Delinquency /     |            | 4. Long Dividend Growth Record   |
 |    Bad Debt Persistence          |            |    & Investment-Grade Balance    |
 +----------------------------------+            +----------------------------------+
The bear case begins with the demographic argument, which frequently headlines economic coverage but is structurally the weakest of the bear arguments on its own. California has experienced population outflows to lower-cost states, and that trend is well-documented. However, Essex does not rent to the median state resident; it targets the upper-income cohort employed by high-paying regional employers. The essential analytical question is not whether California is losing residents overall, but whether it is losing high-wage positions within Essex's specific submarkets. Conflating broad state population trends with submarket employment fundamentals misreads the underlying tenant base.
The stronger bear points are narrower and more structural:
- Permanent hybrid work. Even with corporate return-to-office mandates, the pre-2020 assumption that a Peninsula or Seattle Eastside job requires a nearby apartment has loosened at the margin. A resident commuting to an office three days a week can live significantly farther away than one commuting five days, expanding the effective housing supply and competitive set beyond Essex's core clusters.
- Regulatory and operational friction. Rather than a single statewide measure like a Costa-Hawkins repeal, the ongoing risk stems from an accumulation of local tenant protections, extended eviction timelines, and lingering bad debt—dynamics clearly illustrated by recent operating challenges in Los Angeles.
- Elevated cost of capital. In an asset class where property acquisitions are underwritten at capitalization rates in the mid-5 to 6 percent range, spreads over unsecured borrowing costs remain tight. Refinancing maturing debt at higher interest rates directly compresses funds from operations, regardless of property-level performance.
- AI concentration risk. Silicon Valley and San Francisco serve as the epicenter of current tech demand. If capital funding for artificial intelligence cools or engineering talent disperses to lower-cost regions, Essex's top-performing submarkets face renewed revenue pressure without a fourth geographic market to offset the decline.
The bull case rests primarily on supply arithmetic, which offers rare clarity in real estate forecasting. Multifamily construction starts across West Coast metros have dropped 40 to 50 percent from their 2022 peak as rising construction expenses and elevated financing costs rendered new developments uneconomic.[^11] Because coastal apartment projects require two to three years from ground-breaking to delivery, low construction starts in 2024 and 2025 create a near-certainty of constrained competing supply through the late 2020s. This multi-year supply vacuum represents the most predictable element of the investment thesis.
Demand dynamics provide the second pillar. The Bay Area and Seattle maintain the world's highest concentration of AI research and technology engineering talent, generating compensation levels that support high rents. Concurrently, mandatory in-office schedules have re-established the physical link between employment centers and residential demand.
Third, the affordability gap between owning and renting remains historically wide. With West Coast median home prices elevated and mortgage rates remaining well above pandemic-era lows, the monthly cost of single-family homeownership significantly exceeds apartment rents, keeping high-earning households in the tenant pool longer.
Finally, balance-sheet strength and distribution continuity reinforce downside protection. Essex has increased its annual dividend every year since its 1994 initial public offering—a three-decade track record spanning multiple economic cycles—underpinned by investment-grade credit ratings and a largely unencumbered property portfolio.29
Synthesizing these dynamics against core competitive frameworks reveals a distinct operating profile: Essex's supply protection is exceptionally strong, currently reinforced by a market-wide construction slowdown. Its operational efficiency over fragmented private landlords remains a structural advantage, while its competitive position against peers like AvalonBay and Equity Residential is largely neutral, defined by market concentration rather than operational divergence. However, supplier cost pressures from insurance and taxes, alongside the permanent availability of remote work as an alternative, leave the company more exposed than it was a decade ago.
Ultimately, Essex functions as a leveraged play on geographic concentration: a focused bet that high-wage technology employment will remain physically anchored to its three core coastal markets.
XI. Epilogue, Key KPIs & "What Would We Do?"
Three metrics carry nearly all the information in this business, and each is published quarterly.
First, same-property revenue and net operating income (NOI) growth broken out by region. This is the single most important disclosure Essex produces. The regional split reveals whether the Bay Area recovery is continuing, whether Seattle is tracking, and — critically — whether Southern California's delinquency drag is normalizing or persisting. A quarter where Northern California leads and Southern California improves indicates the operating engine is firing across markets; a quarter where Northern California carries the portfolio alone highlights growing concentration risk despite acceptable headline results.
Second, new lease rate growth versus renewal rate growth, and the resulting blended spread. Renewal pricing reflects tenant switching costs — moving is expensive and disruptive, allowing renewal rates to hold up longer. New lease pricing reflects current market demand without friction. When new lease growth turns negative while renewal growth stays positive, it provides the earliest warning of a turning market, typically appearing two to three quarters before impacting reported revenue. This metric would have signaled the 2020 downturn first.
Third, the job-to-permit ratio across core submarkets. This metric serves as the long-horizon health check on the structural thesis. If West Coast municipalities meaningfully liberalize housing production — a direction state-level supply legislation has pursued in recent years — the ratio compresses, eroding the supply moat over time. It measures whether the market dynamics George Marcus identified in 1971 remain structurally intact.
If we were running Essex
Capital allocation choices in 2026 are sharply constrained, providing strategic clarity. Ground-up development does not pencil: at current construction and financing costs, building new coastal communities generates yields inferior to acquiring existing properties. Management's decision to avoid new development is analytically sound, and maintaining that discipline as market peers resume building will be critical to monitor. Productive capital deployment centers on acquiring stabilized Bay Area and Seattle assets below replacement cost, paying down debt, and — when shares trade at a discount to net asset value — repurchasing stock, which offers an acquisition at a guaranteed discount to an intimately understood portfolio.
On the regulatory front, funding ballot-measure defense is necessary but strictly reactive. A more durable long-term strategy involves supporting state-level supply legislation. While counterintuitive for a landlord whose moat relies on scarcity, political risk for Essex stems from housing unaffordability driving voter backlash. The primary structural mitigation to that anger is expanding housing supply. A landlord perceived as contributing to housing solutions faces lower long-term risk of rent control expansion or Costa-Hawkins repeal than one viewed as benefiting from constrained construction. Accepting gradual moat compression in exchange for reduced political tail risk represents a strategic trade-off.
On operations, internal technology initiatives represent the primary lever within management's direct control. Operating margin gains achieved through centralization and automation yield predictable efficiency, independent of macroeconomic trends, voter behavior, or technology funding cycles.
A central irony defines the company's trajectory. George Marcus's 1971 insight — that California would constrain housing supply, allowing existing residential assets to compound in value for decades — proved accurate, creating one of the most durable cash-generation platforms in public real estate. Yet that same mechanism reflects a broader policy failure that has elevated housing costs and sparked recurring statewide ballot challenges targeting real estate operators. Essex's financial returns and California's housing affordability crisis represent two sides of the same structural dynamic. The primary long-term risk to the investment case remains unchanged: that unhoused residents and renters eventually alter that balance at the ballot box.
References
-
Essex Property Trust Form 10-K for Fiscal Year Ended December 31, 2024 — U.S. Securities and Exchange Commission, 2025-02-21 ↩↩↩↩↩↩↩
-
Essex Property Trust Form 10-K for Fiscal Year Ended December 31, 2025 — U.S. Securities and Exchange Commission, 2026-02-20 ↩↩↩↩↩↩
-
George Marcus Profile & History of Marcus & Millichap and Essex Property Trust — Forbes, 2023-09-20 ↩↩↩↩
-
Essex and BRE Properties Announce Merger to Create $16 Billion West Coast Apartment REIT — NAREIT REIT News, 2013-12-19 ↩↩↩↩↩
-
Essex Property Trust Form S-4 Registration Statement (BRE Properties Acquisition) — U.S. Securities and Exchange Commission, 2014-01-29 ↩↩
-
Essex Property Trust Investor Relations Landing Page — Essex Property Trust, Inc. ↩↩
-
Essex Property Trust Reports Q2 2026 Financial Results and Raises Full-Year Guidance — Business Wire, 2026-07-29 ↩↩
-
California Proposition 33 Rent Control Ballot Measure Results — California Secretary of State, 2024-11-05 ↩↩
-
Essex Property Trust Credit Rating Rationale — Moody's Investors Service, 2024-05-10 ↩↩
 LinkedIn
 WhatsApp
 Reddit
 Hacker News
 Email
Email Kindle
 RSS Feed
 Spotify
 Apple Podcasts
 Amazon Music
 Audible
 YouTube