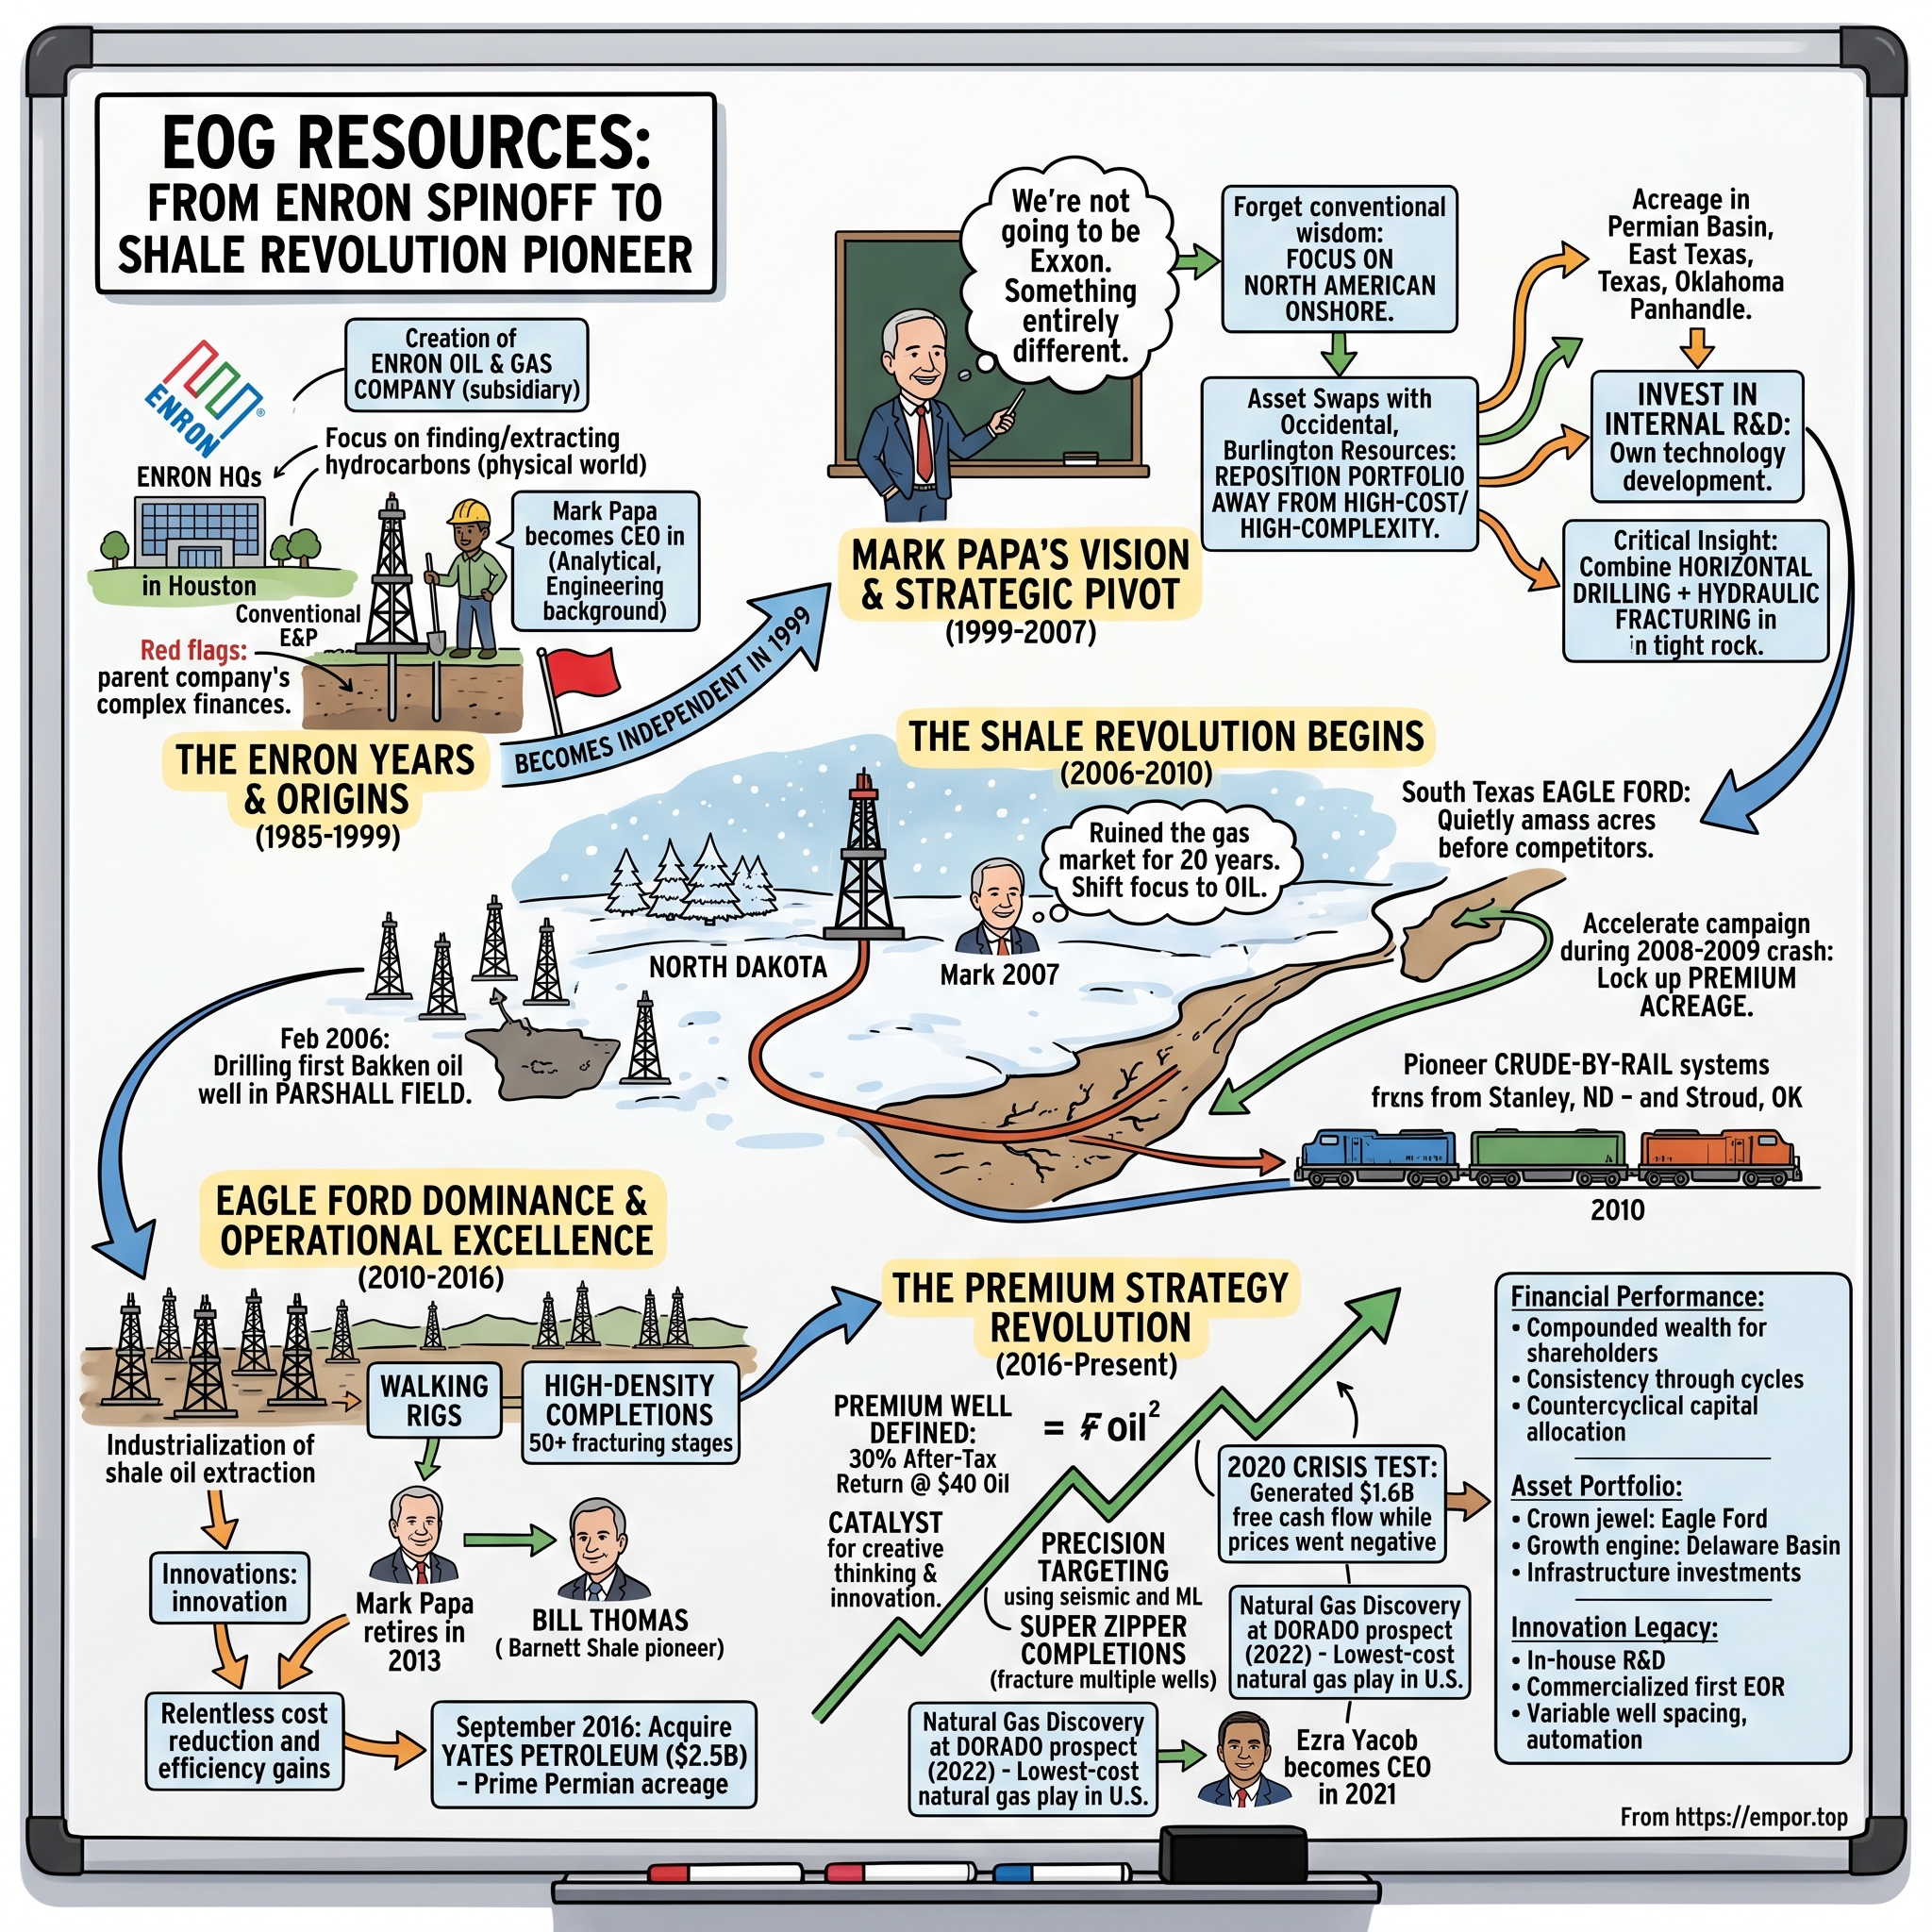
EOG Resources: From Enron Spinoff to Shale Innovation Powerhouse
I. Introduction & Episode Roadmap
There is a particular kind of corporate history that American business favors: the subsidiary that escapes a failing parent. EOG Resources represents a distinct case where the separation was deliberate rather than fortuitous. In August 1999, petroleum engineer Mark Papa finalized the company's separation from its parent, Enron Corp., securing oil and gas assets, the balance sheet, and the corporate name. Twenty-seven months later, Enron filed what was then the largest corporate bankruptcy in U.S. history. The subsidiary survived while the parent collapsed.
That separation remains a well-known corporate origin story, but it is not the defining characteristic of EOG's business model.
More significant is how the company operated in the decades that followed: attempting to build a competitive advantage in a commodity business through operational engineering rather than scale alone. Crude oil is fundamentally fungible. A barrel of West Texas Intermediate produced from EOG's Delaware Basin acreage is chemically indistinguishable from one produced by ExxonMobil three miles away, and both sell into the same global market at identical benchmark prices. In an industry with no product differentiation, extraction cost is the primary operational lever. EOG built its strategy around controlling that cost—developing in-house geology software, operating proprietary hydraulic fracturing sand mines, designing custom drill bits, and delegating field operational choices to engineers through internally built mobile applications. Industry observers frequently characterized EOG as the "Apple of oil" for its insistence on controlling components of the technology stack that competitors typically rented from oilfield service providers.
EOG operates as an independent exploration and production company listed on the New York Stock Exchange, with proved reserves and production concentrated in three foundational U.S. plays alongside an established international position in Trinidad.1 The company's asset base, reserve accounting, and cost structure are detailed in its 2024 Form 10-K.2 In August 2025, EOG completed a $5.6 billion acquisition of Encino Acquisition Partners, establishing the Ohio Utica shale as a third foundational play alongside the Delaware Basin and the Eagle Ford.[^3]
This analysis tests a central thesis: whether EOG's low-cost structure is structural and reproducible, or primarily the result of favorable legacy asset timing. Management attributes performance to a durable engineering advantage built by avoiding debt-funded volume growth, retaining internal technical innovation, and approving only wells that clear fixed return hurdles at conservative oil prices. Conversely, a critical analysis suggests EOG may simply benefit from an early-mover advantage in high-quality rock—a geological head start that cannot be replicated elsewhere and will eventually deplete.
The distinction is critical for evaluating long-term value creation. An engineering-led cost advantage can be transferred to newly acquired acreage such as the Ohio Utica, whereas a geology-dependent advantage remains confined to legacy plays. The integration of Encino serves as a direct test of EOG's operational portability.
The following sections examine EOG's development: the separation from Enron and early corporate culture; the strategic shift from natural gas to crude oil prior to the U.S. shale gas expansion; the technical operating stack and its degree of differentiation; the Premium hurdle-rate framework established after the 2015–2016 commodity downturn; the leadership transition under CEO Ezra Yacob and executive compensation alignment; productivity trends across the core Delaware and Eagle Ford basins; the performance of optionality plays in the Utica and Dorado gas fields; capital allocation and balance sheet management under commodity stress; the primary elements of the bear case; a structural analysis using standard strategic frameworks; and the core operational metrics that indicate whether EOG's low-cost model remains intact.
 Subscribe on LinkedIn
II. The Enron Separation & Establishing Independence (1985–1999)
In Houston during the late 1990s, Enron's corporate focus shifted heavily toward its trading floor—where executives structured natural gas derivatives, built speculative bandwidth markets, and devised off-balance-sheet vehicles. Several floors away, Enron Oil & Gas Company operated a conventional exploration and production business: discovering physical hydrocarbons and selling them into the physical market.
EOG had been founded in 1985 as the exploration and production arm of Kenneth Lay's expanding pipeline network, assembled from conventional oil and gas properties that Enron's corporate predecessors had accumulated.1 Within a parent company increasingly oriented toward financial engineering, a capital-intensive drilling business sat uncomfortably. Drilling requires upfront capital investment years before producing free cash flow, whereas mark-to-market trading desks generated immediate, paper-based earnings. In practice, the subsidiary served as both a funding source and a tangible asset base for a parent reliant on mark-to-market accounting.
This internal dynamic shaped EOG's operating culture. Throughout the 1990s, EOG's engineers competed for corporate capital against trading desks promising immediate accounting profits. To secure funding, EOG management had to justify drilling programs based on return metrics rather than raw production growth. That internal friction established a capital allocation discipline that outlasted the parent company.
When petroleum engineer Mark G. Papa became chief executive of Enron Oil & Gas in 1998, he recognized that the subsidiary would remain undercapitalized as long as it competed internally against Enron's trading desks. He viewed Enron's high-leverage, financialized culture as a structural risk to EOG's asset base. Papa favored an engineering approach grounded in geology and cash returns, prioritizing early action before broader industry consensus emerged.
The definitive separation took place in August 1999, when Enron exchanged its roughly 53% stake in the subsidiary for EOG's assets in India alongside a cash payment, and the company renamed itself EOG Resources, Inc.1 Transactionally, Enron divested a non-core asset to raise capital. Operationally, the split granted EOG an independent balance sheet, an autonomous board, and full operational control. Executed two years prior to Enron's December 2001 collapse, the deal isolated EOG from what became the largest corporate bankruptcy in U.S. history at the time.
The separation reflected strategic capital management rather than prescience regarding Enron's accounting practices. No public evidence indicates EOG leadership anticipated Enron's eventual fraud. Instead, Papa identified a fundamental capital allocation conflict and executed a spinoff while Enron was willing to negotiate.
The enduring consequence of the spinoff was an institutional skepticism toward financial engineering. Having operated inside a parent company where accounting figures diverged from physical asset performance, EOG developed a capital allocation framework rooted strictly in rock quality and full-cycle returns. That return-hurdle framework faced its first major test not during a corporate crisis, but during the volatile natural gas cycles of the early 2000s.
III. The Gas-to-Oil Strategic Pivot & Shale Discovery (1999–2010)
In the early 2000s, EOG was fundamentally a natural gas company. Its acreage, technical expertise, and cash flow were heavily weighted toward gas, including a position in North Texas's Barnett Shale—the play where George Mitchell demonstrated that combining hydraulic fracturing with horizontal drilling could liberate hydrocarbons from dense rock formations once considered non-productive.
Understanding EOG's strategic shift requires examining the underlying reservoir physics. Conventional oil and gas reservoirs consist of porous, permeable formations where hydrocarbons flow to the wellbore under natural pressure. Tight shale, by contrast, behaves more like compressed layers of paper: while hydrocarbon volumes are immense, the passages between pores are too narrow for natural flow. Horizontal drilling addresses part of the challenge by routing the wellbore laterally for thousands of feet through the target formation to maximize contact. Hydraulic fracturing completes the process by pumping water and proppant at high pressure to crack the rock and create artificial pathways for fluid migration.
By the mid-2000s, this technology was spreading rapidly across North American gas shales. Analyzing the trend, Chief Executive Mark Papa concluded that widespread application across basins such as the Haynesville, Fayetteville, and Marcellus would trigger a severe market imbalance. If multi-basin supply expanded faster than domestic demand could absorb it, natural gas prices would face long-term structural pressure. Papa publicly warned that the industry risked depressing domestic gas markets for up to two decades.
That projection created a direct strategic dilemma for EOG. Rather than continuing to drill gas wells while prices remained temporarily elevated, EOG redirected its technical research and land acquisition efforts toward a question industry consensus considered unviable: whether tight shale could yield crude oil at commercial rates.
The prevailing skepticism was rooted in fluid dynamics. Because crude oil molecules are significantly larger than methane molecules, geological consensus held that oil would not flow through microscopic pore throats at economic rates, treating oil-bearing shales strictly as non-productive source rocks.
EOG hypothesized that higher fracture density and precise landing-zone targeting could overcome those flow constraints. To prevent land prices from inflating, the company conducted its initial testing and leasing programs without public announcement, avoiding competitive bidding dynamics that would inflate acreage valuations.
That effort culminated in the South Texas Eagle Ford. Between 2008 and 2010, EOG assembled a large contiguous position in the crude oil window of the South Texas Eagle Ford—the portion of the formation where the geology produces light sweet crude rather than gas.1 By securing the acreage before the market priced in commercial oil production from shale, EOG captured core land at pre-discovery valuations.
By 2010, oil revenue surpassed natural gas revenue, completing a transformation of the revenue base within roughly four years of the decision.1 EOG transitioned from a gas producer facing depressed commodity pricing into the dominant operator in one of North America's most economic crude oil plays.
From an investment perspective, this strategic pivot demonstrates an institutional process rather than mere managerial luck. Facing adverse structural trends in its primary market, EOG acted on internal research before consensus formed, accepting short-term market skepticism to reallocate capital into higher-margin assets.
Securing low-cost acreage, however, established only an initial asset baseline. Converting early geological positioning into a durable cost advantage required building proprietary operational capabilities and supply chain logistics—a strategy developed during the subsequent shale expansion.
IV. Technical Power: The Decentralized "Apple of Oil" Playbook
The standard American shale operating model is closer to general contracting than to manufacturing. An exploration and production company holds the leases, raises the capital, and hires external contractors: Halliburton or SLB designs and pumps the hydraulic fracture, a drilling contractor supplies the rig and crew, a proppant supplier sells the sand, and a water company handles the fluids. An operator's differentiation in this model rests primarily on its acreage quality and its ability to negotiate service contracts.
The structural weakness of this model is that innovation leaks. If a service company engineers a superior completion technique for one operator, that technique becomes available to competitors by the following quarter because the service company's business model relies on broad deployment. Operators running an outsourced playbook tend to converge on roughly the same cost curve, leaving rock quality as the primary remaining variable.
EOG's approach was to insource core operational components and retain technical learning internally. The company wrote its own subsurface algorithms rather than relying entirely on vendor software, designed custom drill bits for specific formations, and built an internal data organization to analyze well performance across its portfolio.[^4] Individually, these represent modest engineering choices. Cumulatively, they create an internal knowledge base that compounds over time rather than diffusing to competitors through shared service providers.
The most concrete expression of this strategy is proppant supply. A modern long-lateral shale well consumes immense quantities of fine sand pumped downhole to hold fractures open. In the early shale era, operators purchased premium Northern White sand from Wisconsin and transported it by rail to Texas, making sand and freight one of the largest single completion expenses. EOG moved upstream into proppant logistics, developing its own sand processing and mine infrastructure rather than purchasing entirely at spot market prices.[^4] The company has consistently cited self-sourcing of sand and water as a central pillar of its cost advantage in investor materials.3
Evaluating this mechanism requires precision. Self-sourcing eliminates a supplier's profit margin and decouples EOG from proppant price spikes during activity booms, when completion costs for peer operators typically inflate. That structure provides a counter-cyclical cost advantage. However, it does not constitute an unassailable structural moat: other large operators have since developed local sand sourcing, and the industry's broader transition toward in-basin sand has narrowed the gap that existed when EOG initiated the strategy. A measured evaluation indicates that EOG established early infrastructure, generating a meaningful cost benefit that scaled peers have now partially replicated.
A similar dynamic applies to water management. Hydraulic fracturing consumes millions of gallons per well and generates substantial volumes of flowback water. EOG built gathering and recycling infrastructure to reuse produced water rather than relying on trucks to haul fresh water in and wastewater out. Trucking is capital-intensive, logistically constrained, and vulnerable to labor and fuel inflation. Pipelines and recycling facilities convert a recurring variable expense into an upfront capital expenditure that amortizes across a dense acreage position. This model requires an operator's acreage to be contiguous, linking directly back to the land acquisition strategy of the prior decade; the infrastructure advantage is a direct output of the underlying acreage assembly.
EOG also developed a proprietary software architecture. The company built an internal mobile application platform that places custom analytics directly in the hands of field personnel—including pumpers, drilling engineers, and completion supervisors—to monitor wellhead pressure, artificial lift performance, and directional steering in real time.[^4] The operational philosophy emphasizes decentralization: rather than routing routine decisions through a central command center, EOG provides field personnel with real-time data to make immediate adjustments.
The underlying rationale is that across thousands of active wells, operational value accumulates through thousands of routine daily decisions—such as adjusting a pump rate, responding to a pressure variation, or altering a steering plan along a lateral. Centralized decision-making introduces operational latency. Making marginal improvements hours faster across a broad asset base produces a compounding cost advantage over time.
On the completion side, operational development has focused on completion density and continuous pumping. Well spacing tightened substantially from early wide patterns as operators gained a clearer understanding of fracture propagation, though tighter spacing introduces the risk of "parent-child" interference, where newer wells drain rock already depleted by older adjacent wells and yield lower recovery rates. EOG also refined execution techniques to maintain continuous pumping operations between stages, increasing completed lateral footage per day. Faster completion rates translate directly into lower cost per lateral foot without requiring changes in geological quality.
From an investment perspective, EOG's technical model has demonstrated a lower cost position through real, internally managed operational capabilities. However, claims that this advantage is inimitable are overstated. Technical practices diffuse across the industry through service contractors and workforce mobility, and scaled peers have constructed comparable sand and water systems. A defensible assessment is that EOG has maintained a leading position on the cost curve through insourcing, data control, and field-level execution, though verifying the durability of this margin requires examining performance at the cost line itself.
V. The Premium Strategy Revolution & Historical M&A Record (2016–2021)
Between mid-2014 and early 2016, crude oil prices fell from more than $100 per barrel to below $30. The sharp decline exposed a structural vulnerability across the U.S. shale sector, where operators had spent the preceding five years funding production growth with debt under the assumption that high commodity prices would persist. As cash flows collapsed, a wave of bankruptcies followed.
EOG responded not by launching a standard cost-cutting program, but by altering its fundamental capital allocation criteria—redefining the operational rules governing well approvals.
In 2016, the company instituted a "premium well" standard: capital was restricted to wells capable of generating at least a 30% direct after-tax rate of return at $40 West Texas Intermediate crude oil and $2.50 per MMBtu Henry Hub natural gas.3 The critical feature was a fixed low price deck. Conventional exploration and production companies typically evaluate project economics using current spot or futures prices. When oil trades at $95 per barrel, marginal acreage appears profitable, prompting capital deployment at cycle peaks when oilfield service costs are highest. By evaluating prospective wells against a permanently depressed price baseline, EOG made project approvals dependent on rock quality and operational engineering rather than favorable market pricing.
Consequently, EOG defined its economic inventory far more narrowly than its peers. Locations viable at $70 oil but unprofitable at $40 were excluded from official counts. This conservative methodology complicated direct inventory comparisons with competitors using looser return metrics, while understating EOG's total drillable inventory under higher commodity prices.
In 2020, when the COVID-19 pandemic severely reduced energy demand and briefly pushed West Texas Intermediate futures into negative territory, EOG tightened its capital criteria further by introducing a "double premium" standard requiring a 60% direct after-tax return at the same $40 oil assumption.3 Rather than waiting for commodity prices to recover, raising the hurdle forced the engineering organization to improve well economics through technical design—extending lateral lengths, refining subsurface targeting, and lowering completion costs.
This framework reflects strategic counter-positioning. While competitors could theoretically adopt fixed-price hurdle rates, doing so proved challenging for leveraged peers reliant on continuous production growth to service debt. For EOG, backed by a strong balance sheet, the self-imposed restriction constrained capital to high-margin projects; for debt-laden operators, it would have required sacrificing necessary production volumes.
Benchmark Acquisition Pass #1: Yates Petroleum (2016). In September 2016, near the trough of the commodity cycle, EOG acquired Yates Petroleum Corporation—a privately held New Mexico producer—for approximately $2.3 billion in stock and cash, alongside roughly $245 million of assumed debt.[^6] The transaction expanded EOG's acreage footprint across the Permian's Delaware Basin and the Powder River Basin, adding a substantial inventory of drilling locations that management stated met its premium standard.[^6]
The transaction offered clear structural advantages. EOG acquired cash-flow-generating assets at low valuation metrics near the bottom of the cycle using mostly equity, avoiding the peak-cycle valuation premiums that resulted in widespread asset impairments across the industry. Furthermore, the acquired Delaware Basin acreage sat directly adjacent to EOG's core position, allowing the company to extend its existing sand, water, and gathering infrastructure without redundant capital expenditure.
Historical falsification pass — Yates integration and tier-2 acreage. Evaluating whether Yates immediately expanded EOG's premium inventory requires examining post-acquisition operational results.
Subsequent capital allocation indicates that a significant portion of the acquired Yates footprint—particularly in parts of New Mexico and the Powder River Basin—failed to meet EOG's premium return hurdle upon detailed evaluation. Development of these properties lagged behind headline expectations; the Powder River Basin remained a secondary asset for years following the transaction, and EOG eventually divested non-core conventional properties from the portfolio. Holding un-drilled acreage incurred ongoing lease maintenance and administrative costs while generating limited cash flow.
This execution record does not negate the strategic value of the Yates transaction. The low acquisition cost meant the Delaware Basin core acreage alone largely justified the purchase price, and EOG avoided the write-down cycles that affected peers paying peak multiples. However, it refines the transaction's narrative: rather than providing immediate premium inventory across its entire footprint, Yates delivered a core block of Delaware Basin acreage alongside secondary acreage requiring years of technical evaluation. The rigorous application of EOG's hurdle rate exposed these asset distinctions, confirming the integrity of the capital framework while demonstrating the time required to absorb unproven land.
Ultimately, EOG's historical acquisition record reflects valuation discipline and cycle timing rather than an ability to rapidly convert secondary acreage into premium inventory. This distinction provides an essential benchmark for evaluating the $5.6 billion Encino acquisition—a substantially larger transaction involving broader operational commitments.
VI. Current Leadership & Corporate Governance: The Ezra Yacob Era (2021–Present)
Executive succession in the exploration and production sector frequently tests institutional discipline. When a founder-era leader who made early contrarian bets retires, successors often revert to industry norms, prioritizing volume growth over return hurdles.
EOG managed its leadership transition in two stages. Mark Papa handed the chief executive role to Bill Thomas, who guided the company through the 2014–2016 commodity downturn and instituted the premium return standard. In October 2021, Thomas was succeeded by Ezra Yacob.4
Yacob brought a distinct professional background to the role. A geologist by training rather than a petroleum engineer, Yacob spent more than 15 years advancing within EOG, most notably leading its Delaware Basin operations as that play became the company's primary growth engine.4 His executive leadership team includes Chief Operating Officer Jeffrey Leitzell and Chief Financial Officer Ann D. Janssen.4
Yacob's technical background reflects a shift in operational priorities. Whereas Papa's leadership centered on macroeconomic positioning across commodity cycles, Yacob's expertise lies in subsurface characterization—identifying precise landing zones and optimizing reservoir recovery. As the initial North American shale land grab concluded, incremental value creation shifted toward maximizing recoveries from existing acreage through precise targeting and refined completion designs. A geologist-led executive team matches that operational phase, though it may offer less strategic flexibility if industry conditions demand another macroeconomic portfolio pivot rather than ongoing subsurface optimization.
The alignment of corporate governance with this strategy is visible in executive compensation structures disclosed in EOG's proxy filings.5 Base salary represents a minor component of total CEO compensation—approximately $1.43 million—with the vast majority delivered through multi-year performance units and restricted stock.5 Performance metrics directly track operational efficiency and capital discipline: return on capital employed, absolute and relative total shareholder return, free cash flow generation, and cash operating costs per barrel of oil equivalent.5
Notably, raw production growth is absent from the compensation formula. In an industry historically prone to over-investing to expand output, excluding volume targets from executive pay reinforces capital discipline over unhedged production expansion.
A key structural provision stipulates that performance units cannot vest above target if absolute total shareholder return over the three-year evaluation period is negative, regardless of EOG's relative performance against peers.5 Relative return metrics in commodity sectors often allow executives to receive full performance payouts during market downturns simply by outperforming declining peers. The absolute-return cap eliminates that outcome. While commodity price swings remain the primary driver of total returns outside executive control, the provision prevents above-target payouts during periods of net shareholder value destruction.
Stock ownership guidelines further bind executive compensation to long-term equity performance, requiring the chief executive and board members to hold shares equal to specified multiples of base compensation.5 However, mandatory ownership policies reflect governance compliance rather than voluntary open-market share purchases, limiting their utility as a direct signal of insider conviction.
The primary test of this governance model occurred in 2022, when global energy market disruptions pushed crude prices above $100 per barrel, generating record free cash flow. While the traditional industry response to price spikes was to increase drilling activity, EOG maintained disciplined capital spending and returned excess cash to shareholders via special dividends rather than expanding production volumes.3 Across subsequent investor communications, management has continued evaluating performance based on returns and free cash flow per share rather than aggregate volume targets.6
This operational continuity suggests that EOG's capital allocation discipline is embedded within the organization rather than tied exclusively to its former leadership. The framework successfully navigated two leadership transitions and a major commodity price spike. Its ultimate test, however, remains execution through a prolonged low-price environment under Yacob while integrating large-scale corporate acquisitions, such as the Encino transaction.
VII. The Core Engine: Delaware Basin & Eagle Ford Operational Economics
Beyond executive discipline and technical strategy, EOG's operational engine rests on two major drilling programs in Texas-centered basins, complemented by smaller domestic assets and an established international footprint in Trinidad. The company's financial reporting shows a heavily domestic orientation, with U.S. operations generating the vast majority of revenue and operating profit while Trinidad contributes a smaller share and other international or emerging-play activities account for a minor remainder.2 The product mix further clarifies this business model: crude oil and condensate represent roughly half of total production volume but generate a disproportionately larger share of revenue, with natural gas liquids and natural gas supplying the balance.2 This divergence between volume share and revenue share illustrates the core economic rationale behind the earlier gas-to-oil pivot—a barrel of crude oil yields several times the revenue of an energy-equivalent volume of natural gas. It also highlights the revenue mix risk inherent in EOG's expansions into the Utica and Dorado plays, as both introduce gas-weighted volumes to a revenue base anchored by higher-margin liquids.
As disclosed in its financial filings, EOG's proved reserves exceed 3.5 billion barrels of oil equivalent.2 Under Securities and Exchange Commission guidelines, proved reserves represent a standardized accounting metric governed by trailing commodity prices rather than a static engineering estimate of total recoverable resources. Consequently, disclosed reserve figures across the exploration and production sector fluctuate alongside market price swings as much as with operational drilling results.
The Delaware Basin. As the western sub-basin of the Permian, the Delaware Basin serves as EOG's primary revenue driver. Its defining geological feature is vertical stacking: rather than containing a single productive layer, the formation features multiple hydrocarbon-bearing intervals—including the Wolfcamp and Bone Spring formations—layered across thousands of vertical feet. This vertical concentration enables a single surface location to support multiple wells targeting distinct subterranean zones. Economically, vertical stacking maximizes surface infrastructure efficiency, as roads, well pads, water recycling systems, and gathering pipelines built for one zone serve several stacked layers. As a result, unit development costs decline as fixed infrastructure expenses are amortized across a larger number of wells.
EOG reports wellhead breakeven costs in its core Delaware acreage well below prevailing market prices, supported by horizontal laterals that frequently extend beyond 10,000 feet.3 Extended laterals represent a crucial efficiency lever: because vertical drilling represents a fixed expense that produces no hydrocarbons, extending the horizontal segment maximizes contact with productive rock for only incremental drilling costs. Consequently, capital costs per productive foot fall significantly. Drilling three-mile laterals requires contiguous land holdings, reinforcing the operational value of EOG's earlier acreage assembly.
The Eagle Ford. The South Texas play that validated EOG's initial crude oil strategy has matured into a steady cash-generating asset. Its economic advantages are both geographic and structural. Proximity to Gulf Coast refining complexes and export terminals reduces pipeline transport expenses, allowing EOG to realize pricing closer to West Texas Intermediate benchmarks than landlocked Permian producers subject to regional price discounts. Furthermore, because gathering and processing infrastructure was constructed over the preceding decade and is largely paid for, capital expenditures remain low, maximizing net free cash flow.
Competitive benchmarking. Corporate consolidation has significantly reshaped EOG's competitive environment. Major sector transactions include ExxonMobil's acquisition of Pioneer Natural Resources for approximately $60 billion, Chevron's agreement to acquire Hess, Diamondback Energy's $26 billion purchase of Endeavor Energy Resources, and ConocoPhillips' acquisition of Marathon Oil.7 Independent peers such as Devon Energy and Coterra Energy also compete across similar basins. Within this peer group, EOG has positioned itself around cost leadership, citing finding and development costs in the high single digits per barrel of oil equivalent and cash operating expenses of roughly $10 to $11 per barrel of oil equivalent.3
Why EOG wins from here. The bull case for EOG relies on four primary operational factors: an overall cost structure positioned near the lower bound of the North American cost curve; an organic exploration model that has historically expanded reserves at lower costs than large-scale corporate acquisitions; an unhedged production posture that fully captures price upside during commodity rallies; and self-sourced sand and water logistics that buffer the company against oilfield service inflation during industry upturns.
Why EOG may not win. Conversely, industry consolidation poses a direct competitive challenge. Consolidating peers now command significantly larger contiguous acreage blocks across the Permian Basin, enabling them to drill three-mile laterals at scale, exert greater pricing leverage over oilfield service providers during downturns, and access lower capital costs via supermajor balance sheets. EOG's historic margin advantage stemmed partly from superior operational sophistication at a given scale. As larger competitors replicate these technical practices across broader asset bases, EOG's relative cost edge faces compression, leaving it operating as a mid-sized Permian producer competing against entities with greater purchasing power and balance sheet scale.
Historical falsification pass — Eagle Ford tier-1 inventory and productivity flattening. A central claim supporting EOG's long-term outlook is that the company commands an effectively open-ended inventory of high-return Eagle Ford drilling locations.
The disconfirming evidence is empirical and basin-wide. Data published by the U.S. Energy Information Administration demonstrates that new-well productivity gains across mature shale basins, including the Eagle Ford, have flattened compared to the rapid improvements achieved during the 2010s.8 The underlying geological mechanisms are well established: initial development targets the highest-quality acreage, causing average rock quality to decline over time; denser infill drilling increases parent-child well interference; and maturing reservoirs experience rising gas-to-oil ratios and water cuts as formation pressure dissipates. A rising gas-to-oil ratio is particularly consequential because wells yield a higher proportion of natural gas over time, shifting the revenue mix away from higher-margin crude oil.
This empirical evidence does not diminish the value of EOG's Eagle Ford position, which continues to function as a low-cost, cash-generative asset backed by fully amortized infrastructure. However, it decisively refutes the unlimited runway narrative. The Eagle Ford is more accurately evaluated as a mature harvest asset designed to generate free cash flow rather than volume expansion. Consequently, the responsibility for future production growth shifts entirely to the Delaware Basin and newly acquired plays such as the Ohio Utica.
The forward test for this transition is measurable through public disclosures: tracking estimated ultimate recovery per completed lateral foot in core Eagle Ford counties alongside the crude oil percentage. If recovery per foot continues declining while gas-to-oil ratios rise, tier-1 inventory depletion is confirmed, making capital allocation into expansion plays such as the Utica essential to sustaining the corporate growth profile.
VIII. Emerging Plays & Real Optionality: Ohio Utica & Dorado Gas
For most of its independent history, EOG maintained a consistent growth strategy centered on organic exploration rather than large corporate acquisitions. Under that philosophy, discovering resources through the drill bit was more cost-effective than purchasing proven assets, where sellers price in established value. The Eagle Ford served as the original proof of concept for that organic model.
That historical pattern makes the company's 2025 acquisition strategy a notable departure from its traditional playbook, requiring analysis beyond management's framing.
Benchmark Acquisition Pass #2: Encino. In May 2025, EOG announced the acquisition of Encino Acquisition Partners for $5.6 billion—structured as approximately $3.5 billion in debt and $2.1 billion in cash—adding roughly 675,000 net acres in the Ohio Utica Shale. The transaction closed in August 2025.[^3] It established the Utica as EOG's third foundational play, expanding the company's total Utica footprint to approximately 1.1 million net acres and, according to management, unlocking a resource base measured in billions of barrels of oil equivalent.[^3] Contemporaneous market coverage placed the deal within a broader industry consolidation wave and noted its scale relative to EOG's historically organic posture.9
The rationale for departing from organic growth is straightforward. Encino provided an immediate, contiguous position in the liquids-rich and oil window of a basin that had been historically undercapitalized by private-equity operators lacking the balance sheet scale to deploy advanced completion designs. EOG could apply its self-sourced sand, water logistics, and completion engineering to acreage where prior operators had not fully deployed such techniques. Valuation was also a primary factor: EOG acquired the asset at roughly 3.5 times enterprise value to EBITDA and under $8,000 per flowing barrel of oil equivalent—a fraction of the per-acre valuations paid for Permian assets during the 2023–2024 consolidation wave.9
A critical analysis suggests a secondary motivation that management has not explicitly emphasized. Purchasing inventory typically occurs when organic exploration cannot replace depleted reserves fast enough to sustain development pace. The maturation of the Eagle Ford and the Encino purchase are interconnected realities of asset life cycles. Depletion is an inherent condition of extractive industries, and acquiring low-cost acreage early is economically superior to overpaying later. However, Encino functions partly as inventory replacement rather than purely an opportunistic expansion.
EOG's historical acquisition record—most notably the 2016 Yates transaction—demonstrates strong purchase-price discipline alongside a slower pace in converting secondary acreage into premium inventory. Applied to Encino, that precedent indicates the Utica will likely deliver value over a multi-year horizon rather than through an immediate operational step-change, and a portion of the 675,000 acres may not meet EOG's return hurdles. The central operational test is whether EOG's completion techniques can be successfully transferred to Utica rock, which differs from Permian and Eagle Ford formations in depth, pressure, and fluid characteristics. While management expresses confidence in this technical transfer, empirical results remain to be demonstrated.
The Dorado play. EOG's second optionality asset represents an organic, in-house discovery from 2020 focused entirely on dry natural gas. Located within the Eagle Ford and Austin Chalk dry gas window in South Texas, Dorado holds an estimated net resource potential exceeding 20 trillion cubic feet, with breakeven costs below $1.50 per thousand cubic feet at Henry Hub due to shallow reservoir depths and high initial pressure.3 Shallow depths lower drilling costs, while high pressure enables natural fluid flow without immediate reliance on artificial lift. Furthermore, Dorado's proximity to the Agua Dulce hub places it near the Gulf Coast export corridor where U.S. liquefied natural gas capacity is concentrated.3
A low-cost natural gas asset located adjacent to expanding export demand presents a compelling investment thesis, but verifying its economic impact requires examining operational performance during market stress.
Historical falsification pass — Dorado versus the 2023–24 gas collapse. The claim under evaluation is whether Dorado provides immediate, high-margin growth optionality tied to liquefied natural gas demand.
Dorado's operating history offers empirical evidence to test this assertion. When U.S. natural gas prices dropped below $2.00 per MMBtu during 2023 and 2024 due to mild winter demand and elevated storage levels, EOG did not treat Dorado as an active growth driver. Instead, management deliberately curtailed drilling activity and deferred completions, choosing to hold back production volumes until market pricing recovered rather than selling gas at cyclical lows.6
This operational response demonstrates EOG's hurdle-rate discipline in practice: production was withheld because returns fell short of target metrics. However, it also clarifies the nature of the asset. A resource that generates minimal cash flow during price troughs and depends on commodity recoveries acts as a long-term call option on Henry Hub pricing with ongoing holding costs, rather than an active cash-generating buffer. Its economic value rises during sustained gas rallies but contracts during market gluts.
On balance, the empirical record does not invalidate Dorado's low-cost potential, but it narrows its classification from an active growth engine to price-dependent optionality where commercialization timing is governed by macro factors. The primary forward indicator is the operational timeline and long-term contracting pace of Gulf Coast export infrastructure, which will determine when regional demand absorbs new production.
Taken together, EOG's two emerging plays present distinct risk profiles. Encino is a large, debt-funded position contingent on EOG's ability to transfer its completion engineering to new geology. Dorado is an unlevered, low-cost asset reliant on external natural gas demand. Both expand the proportion of natural gas and natural gas liquids within a company built on crude oil economics, shifting focus to how EOG's balance sheet manages this evolving commodity mix.
IX. Capital Allocation Framework & Financial Resilience
In exploration and production, financial leverage—rather than reservoir engineering—frequently determines corporate survival. During the 2015–2020 commodity downturns, failing shale operators followed a consistent pattern: accumulating debt based on high price assumptions, suffering severe cash flow shortfalls as prices fell, breaching credit covenants, and wiping out equity value. While subterranean assets remained operational, balance sheet structures failed.
EOG built its financial strategy around avoiding that leverage trap, structuring its capital allocation framework around two main pillars.
The first pillar is a commitment to return at least 70% of annual free cash flow to shareholders.3 The mechanism operates on two levels. A regular base dividend—set at a level management considers sustainable through commodity troughs and expanded over time—establishes the payout baseline. Supplemental distributions, consisting of special dividends and opportunistic share repurchases, fluctuate alongside cash generation.
This tiered framework addresses the inherent volatility of commodity cash flows. Operating companies that anchor fixed dividends to peak commodity prices are often forced to cut payouts during market downturns, damaging investor confidence when equity values are already under pressure. By setting the base dividend low enough to weather pricing troughs while routing cyclical cash surpluses into variable payouts, EOG absorbs commodity volatility through flexible distributions rather than financial distress. The company states in investor filings that it has never cut or suspended its dividend since becoming independent, a track record supported by its public distribution history.3
The second pillar centers on balance sheet management: maintaining a low net debt-to-capital ratio and preserving an investment-grade credit rating.2 The practical utility of this balance sheet capacity was demonstrated in the Encino acquisition, which EOG funded entirely through cash and debt rather than equity issuance.[^3] Preserving investment-grade credit metrics allowed the company to execute a $5.6 billion purchase without diluting existing shareholders.
However, this transaction shifted EOG's capital structure from an exceptionally low-leverage posture to a more conventional debt load, coinciding with its largest integration process in nearly a decade. While the balance sheet provided strategic flexibility, a portion of that reserve capacity has now been deployed. The central analytical question is how quickly free cash flow will deleverage the balance sheet, and whether the 70% return commitment will hold if weak commodity prices force management to choose between debt reduction and shareholder payouts. Management maintains the payout target is durable, though that policy remains untested under sustained price weakness with the expanded debt load.
Historical falsification pass — the 2015–16 and 2020 stress tests. The claim: EOG's capital discipline prevents balance sheet vulnerability during commodity crashes.
The company's historical filings provide nuance to this assertion. EOG reported substantial net losses in fiscal 2015 and 2016, driven primarily by non-cash property impairments alongside falling revenues, and reduced capital expenditures significantly to protect liquidity.2 Production growth halted. A similar, compressed retrenchment occurred during the 2020 market downturn. Discipline did not prevent write-downs on assets capitalized under higher price expectations, nor did it insulate the company from sharp operational spending cuts.
A closer examination of those stress tests clarifies the nature of the losses. The reported declines stemmed largely from non-cash accounting impairments—revaluing assets carried at $90 oil down to $30—rather than operating cash shortfalls. EOG avoided covenant breaches, debt restructurings, and dilutive equity raises during both downturns. Furthermore, those downturns prompted direct structural changes: the 2016 premium return standard and the 2020 double-premium standard directly resulted from those operational disruptions.
Ultimately, the empirical record does not invalidate EOG's financial resilience, but it places its evolution in context. Pre-2016 EOG operated as a disciplined yet conventional producer subject to standard cyclical pressures. Post-2016 EOG instituted explicit return rules designed to decouple capital deployment from commodity price peaks. While the 2020 downturn tested this framework, the collapse was sharp and brief. A prolonged period of depressed commodity prices under the current Encino debt load represents the ultimate test of EOG's capital model.
That untested scenario forms the basis of the primary bear case.
X. Skeptical-Investor Stress Test & Current Risk Radar
Every investment thesis requires an adversary. Evaluating EOG's long-term outlook requires examining the counterarguments an activist investor or short seller would present against the company's operating model.
1. The inventory longevity trap. The primary structural challenge is that EOG's capital discipline is constrained by inventory arithmetic. The company's premium return standard defines high-quality drilling locations narrowly, which ensures financial rigor but leaves a smaller inventory count that depletes as core acreage is developed. Meanwhile, ExxonMobil-Pioneer and Diamondback-Endeavor now hold Permian positions that dwarf EOG's on a contiguous-acreage basis.7 A skeptical reading of the Encino acquisition is straightforward: an operator with an abundant supply of low-cost organic locations in Texas does not commit $5.6 billion to acreage in Ohio. Under this view, the transaction itself indicates inventory pressure in legacy plays, challenging management's framing of the deal as purely opportunistic.
The counterargument is that EOG acquired the asset at a low valuation multiple in an undercapitalized basin rather than paying peak prices for Permian land—a more disciplined choice than stretching balance sheet capacity for expensive Permian inventory. Both perspectives carry validity: the transaction was favorably priced and simultaneously prompted by long-term inventory depletion.
2. The unhedged posture. EOG has historically operated with minimal commodity hedging, maintaining that a low cost structure functions as an implicit hedge and that shareholders invest in exploration and production equities specifically for direct commodity exposure. While this approach captures full upside during market rallies, it leaves operating cash flow directly exposed to OPEC+ supply decisions, geopolitical shocks, and global demand cycles without a derivative buffer. If OPEC+ targets market share and depresses crude prices into the $40 range for an extended period, EOG's cash flow would decline sharply while the company services its Encino debt load and maintains its shareholder payout targets. Being a low-cost producer ensures corporate survival during market downturns, but survival alone does not guarantee superior equity returns.
3. Gas and NGL realization drag. A third structural risk stems from product mix dilution. Both major expansion vectors—the Ohio Utica and the Dorado gas play—increase natural gas and natural gas liquids weighting within a revenue base historically anchored by crude oil. Unlike crude oil, which trades in an integrated global market, natural gas prices are governed by regional supply and takeaway dynamics. In West Texas, Waha hub spot prices have repeatedly turned negative during periods when associated gas production outstripped pipeline capacity, forcing producers to pay to move gas. Similarly, Appalachian natural gas carries persistent regional basis discounts. Consequently, EOG is expanding production in streams where realized pricing depends on local pipeline geometry rather than the global crude market that drove its earlier growth. As a result, consolidated revenue per barrel of oil equivalent can decline even as total production volumes expand, a distortion masked by standard energy-equivalent accounting metrics that convert gas on thermal output rather than realized market value.
Current risk radar. Four specific operational exposures warrant close monitoring.
Permian gas takeaway. Delaware Basin crude wells generate associated gas regardless of local midstream capacity. When pipeline takeaway is constrained, operators face negative regional gas prices, production curtailment, or flaring—the last of which carries regulatory penalties and reputational risk alongside lost revenue.
Service cost inflation. EOG's efficiency gains are measured against a shifting baseline. Casing steel, skilled labor, and rig day rates inflate during industry upcycles. While self-sourced sand and water logistics insulate specific cost lines, they do not shield the entire operating stack. In a tight service market, external inflation can outpace internal operational efficiency gains.
Regulatory exposure in New Mexico. A significant portion of EOG's Delaware Basin footprint is situated on federal land in New Mexico, exposing operations to shifting federal leasing policies and permitting timelines. In addition, federal methane emissions rules add compliance capital and operating expenses across the portfolio—exposures that purely Texas-focused operators avoid.
Execution risk on Encino. Integrating 675,000 net acres in a basin where EOG has limited operational history, while adapting completion designs to distinct subterranean geology, represents the largest operational integration of Ezra Yacob's tenure. As demonstrated by the Yates integration, converting newly acquired land into premium inventory often requires more time than initial announcements suggest.
None of these risks individually dismantles the investment thesis. Collectively, however, they outline a company whose structural margin edge remains real but narrower than its market reputation, operating in an industry where scale economics have increasingly favored supermajor consolidators. This broader perspective provides the necessary framework for evaluating EOG's structural performance.
XI. Strategic Moats & Helmer's 7 Powers Analysis
flowchart TD
    subgraph Helmer Powers in EOG Resources
        PP["Process Power<br>(In-house algorithms, self-sourced sand, mobile field apps)"]
        SE["Scale Economies<br>(Eagle Ford & Delaware regional density, processing plants)"]
        CP["Counter-Positioning<br>(Rejecting volume growth for 60% ATORR Premium Hurdle)"]
        CR["Cornered Resource<br>(Contiguous low-cost tier-1 acreage positions)"]
    end
    PP --> CostAdv["Industry-Leading F&D & Operating Cost Position"]
    SE --> CostAdv
    CP --> FCF["Resilient Free Cash Flow Generation"]
    CR --> LongTerm["Multi-Decade High-Return Inventory Runway"]
Hamilton Helmer's 7 Powers framework evaluates what prevents competitors from replicating a company's business model and competing away its returns. Applied to a commodity producer, the framework distinguishes structural competitive advantages from temporary operational outperformance.
Process Power — the strongest, and the most contested. Helmer defines process power as an embedded organizational capability accumulated through extended practice that cannot be easily transferred by hiring individual employees or purchasing off-the-shelf technology. EOG's process power centers on the integration of proprietary subsurface analytics, self-sourced proppant and water infrastructure, custom equipment designs, and field-level mobile software. Each component reinforces the others: proprietary data refines subsurface algorithms, which improve completion design, which field applications deploy in real time, generating operational data that feeds back into the analytics suite.
However, process power in the shale sector erodes faster than in software or advanced manufacturing. Oilfield service companies disseminate technical best practices across the industry, engineers transition between operators, and scaled peers have constructed comparable in-basin sand and water systems. EOG has sustained a leading cost position across multiple commodity price cycles, indicating that operational capability extends beyond favorable geology. Nevertheless, the operational cost gap between EOG and scaled peers has narrowed as competitors replicate elements of the insourced playbook.
Counter-Positioning — high, and unusually clean. Counter-positioning occurs when an incumbent adopts a business model that competitors decline to copy because doing so would damage their existing operations or financial structure. EOG's premium and double-premium hurdle rates are publicly disclosed and technically replicable. However, evaluating projects against a permanent $40 price deck requires an operator to forgo volume growth targets, reduce drilling programs, and—for leveraged producers—risk failing to generate the cash flow needed to service debt obligations. The limitation of counter-positioning is that it decays if industry norms shift. Following the 2020 downturn, broad sector adoption of capital discipline narrowed EOG's differentiation on this axis. If peers maintain capital restraint through future commodity upcycles, EOG's counter-positioning edge diminishes; if peers resume debt-funded growth during price rallies, EOG's structural discipline retains its advantage.
Scale Economies — moderate, and importantly regional. Because EOG is not the largest overall producer across every operating basin, it lacks absolute scale advantages over supermajor consolidators. Instead, the company relies on asset density: maintaining contiguous acreage blocks in targeted areas to amortize gathering systems, water recycling facilities, sand logistics, and field processing plants across many wells. In shale operations, regional density rather than total corporate volume lowers extraction costs per barrel. This scale advantage functions effectively across mature acreage in the Eagle Ford and Delaware Basin, but remains unproven in the newly acquired Ohio Utica position, where midstream and logistics infrastructure require further capital deployment.
Cornered Resource — moderate and depleting. Early, low-cost leasing of contiguous tier-1 acreage represented a cornered resource: core geological rock secured at pre-discovery valuations. However, extractive resources are finite. Every completed well depletes the inventory of high-return locations. Flattening productivity trends in the Eagle Ford demonstrate the gradual depletion of this original asset base, while the Encino transaction represents an effort to replace core inventory via corporate acquisition at market valuations, yielding narrower profit margins than original land acquisitions.
The remaining Helmer powers—branding and switching costs—are absent in commodity exploration and production. Refiners purchase crude oil based on benchmark specifications, offering no price premium for EOG-produced barrels and facing no switching costs when sourcing from alternative suppliers.
Porter's Five Forces.
Buyer power is low due to global market liquidity, as crude oil and natural gas are fungible commodities with broad buyer bases. Conversely, producers possess zero pricing power, taking prevailing benchmark prices set by global supply and demand. EOG influences price realization primarily through logistics: securing Gulf Coast transport access and direct infrastructure connections reduces regional pricing discounts relative to landlocked peers.
Supplier power is moderate but actively managed. The oilfield services sector remains concentrated among key providers that raise rates during activity booms. EOG's insourcing of sand, water, and completion design reduces cost exposure during upcycles, though the company remains subject to broader market inflation in drilling rigs, casing steel, and field labor.
Threat of substitutes represents a long-term strategic risk tied to transport electrification and renewable energy expansion. For a low-cost producer, declining demand exerts asymmetric pressure: high-cost marginal production is retired first. While a low-cost structure enables a producer to maintain margins longer than higher-cost peers during a structural demand decline, long-term terminal value remains subject to macroeconomic transition risks.
Threat of new entrants is low. High capital requirements, specialized technical demands, midstream infrastructure needs, and the concentration of high-quality acreage among established operators create substantial barriers to entry.
Competitive rivalry is high and intensifying. Corporate consolidation has created larger, better-capitalized peers competing for acreage, oilfield services, and pipeline takeaway capacity. In commodity extraction, rivalry manifests not through product price competition, but through competition for lower-cost inputs and core drilling inventory.
The composite structural read indicates that EOG possesses a real but narrowing operational edge, a durable counter-positioning framework contingent on peer behavior, and a depleting cornered resource base that requires ongoing capital allocation into expansion plays. These dynamics define a low-cost operator navigating a consolidating industry, shifting analytical focus to the specific operational metrics that indicate whether EOG's low-cost structure remains intact.
XII. Key Investment KPIs & Forward Watchlist
Evaluating an exploration and production company based primarily on prevailing oil prices obscures operational performance. Because benchmark commodity prices affect all producers equally, meaningful performance metrics must isolate factors within management's control. For EOG, three key performance indicators determine whether its structural cost thesis remains intact.
1. Finding and development cost per barrel of oil equivalent. Finding and development (F&D) cost directly measures the core thesis by capturing what EOG spends to replace and add proved reserves. The metric combines underlying rock quality, drilling and completion efficiency, and proppant and water logistics into a single financial figure. EOG has positioned its strategy around maintaining all-in F&D costs in the high single digits per barrel of oil equivalent.3
Because annual F&D figures fluctuate with reserve accounting rules and trailing commodity price assumptions, long-term trends and peer comparisons provide the relevant analytical signal. If EOG's F&D costs rise over consecutive years while peers maintain flat cost structures, the operational process power thesis breaks down—indicating either tier-1 geological depletion or an inability to offset oilfield service inflation. Conversely, if EOG maintains or widens its cost advantage over competitors through a full commodity cycle, its engineering-led cost thesis remains validated.
2. Return on capital employed at mid-cycle pricing. Return on capital employed (ROCE) serves as EOG's primary internal benchmark for corporate performance and forms a central component of its executive compensation formula.5 The metric evaluates whether capital deployed downhole generates returns above the company's cost of capital.
Proper evaluation requires measuring ROCE against a normalized mid-cycle price deck rather than peak commodity prices. During periods of $100 crude oil, high market pricing masks underlying operational inefficiencies across the sector. The true analytical test occurs at moderate commodity prices; EOG's capital allocation framework targets sustained returns well above its cost of capital under conservative price assumptions.3 Generating high-teens ROCE in an environment of $60 WTI crude and $2.50 per MMBtu natural gas confirms a structural cost advantage. Conversely, an ROCE that expands only during price rallies signals market-driven profitability rather than operational differentiation.
3. Encino/Utica integration economics — completed well cost per lateral foot. Well cost per completed lateral foot represents the primary metric evaluating the current executive team's capital deployment in Ohio. Following the 2025 acquisition, EOG targeted operational synergies by framing the Utica expansion around driving completed well costs down toward levels achieved in legacy basins through the deployment of self-sourced sand, water infrastructure, and proprietary completion designs.[^3]
Evaluating completed well cost per lateral foot normalizes for varying horizontal lengths, directly tracking engineering efficiency. If Utica well costs converge toward Permian and Eagle Ford baselines over subsequent years, EOG confirms that its operational capabilities are portable across distinct subterranean geology, turning the acquisition into a driver of value creation. If costs remain elevated, the integration risks repeating the pattern of the 2016 Yates transaction on a larger scale—delivering a reasonably priced asset that requires an extended timeline to achieve target return hurdles.
Finally, aggregate production growth remains a secondary metric for evaluating EOG's strategy. Management explicitly removed volume targets from executive incentive structures to avoid incentivizing unhedged production expansion. Evaluating EOG on volume growth misaligns analysis with a corporate model designed around return hurdles and capital discipline.
XIII. Playbook: Business & Investing Lessons
Contrarian capital deployment requires acting before consensus forms and enduring the period where the strategy appears premature. In 2006, Mark Papa concluded that horizontal shale drilling would oversupply the natural gas market. That insight proved valuable only because EOG acted before industry consensus developed, securing acreage in the Eagle Ford crude oil window at pre-discovery valuations. Had leadership waited for market confirmation, core acreage prices would have already adjusted. The broader lesson is that the financial return on a contrarian thesis is inversely proportional to how many market participants already share it. Executing early requires accepting a stretch of market skepticism, a hurdle many public companies avoid due to quarterly earnings pressure.
In a commodity business, insourcing key operations creates rare structural differentiation. When output is chemically identical and benchmark prices are set globally, extraction cost becomes the primary operational lever. EOG's insourcing of sand logistics, water recycling, proprietary software, and custom drill bit design reflects a recognition that margins otherwise captured by oilfield service contractors can be retained internally. Beyond energy, this principle applies to any industry producing undifferentiated goods: competitive edge depends on evaluating which intermediary margins can be economically internalised. The trade-off, reflected in EOG's financial results, is that insourcing transforms variable service expenses into fixed infrastructure investments—a distinct advantage during activity booms, but a capital burden during extended market downturns.
Decentralized decision-making outperforms top-down mandates when value accumulates in routine choices. EOG's field-level software culture succeeds because an operator managing thousands of active wells cannot optimize daily field tasks from a central headquarters. Routing routine decisions upward introduces operational latency that accumulates costs over time. Providing field engineers and pumpers with real-time analytics enables immediate adjustments at the wellhead, producing compounding operational improvements across the portfolio. The prerequisite is rigorous measurement: delegating authority without standardized, real-time data leads to operational inconsistency rather than efficiency.
Aligning executive incentives with capital returns addresses the core governance flaw of cyclical industries. The most durable element of EOG's governance framework was tying executive compensation directly to return on capital employed and free cash flow per share, while excluding volume growth targets from incentive formulas. Across the broader shale sector, a decade of capital destruction stemmed not from engineering failures, but from incentive structures that rewarded unhedged production expansion regardless of return thresholds. In capital-intensive cyclical businesses, proxy compensation metrics disclose an organization's actual operational strategy far more accurately than corporate presentations.
A fixed-price hurdle rate functions as an enforced mechanism rather than a tactical slogan. The defining operational constraint in EOG's capital allocation framework is evaluating project economics against a permanently low commodity price deck. While many exploration and production companies proclaim capital discipline during market downturns, EOG established a structural approval system that restricts capital deployment even during price rallies. Evaluating prospects against a fixed low baseline ensures project approvals depend on rock quality and operational engineering rather than favorable market pricing, separating structural governance from temporary cyclical restraint.
XIV. Epilogue & Conclusion
EOG Resources today bears little physical resemblance to the subsidiary Mark Papa separated from Enron in 1999, yet the institutional line connecting the two remains clear. Operating within a parent focused on financial engineering taught EOG's management to justify capital deployment strictly by physical returns. The company embedded that discipline into a formal return framework, navigated multiple commodity downturns without diluting equity or cutting its base dividend, and grew to an enterprise scale measured in tens of billions of dollars by systematically reducing well costs.1
The historical record supports a measured assessment of EOG's model rather than an uncritical narrative. Its cost leadership has persisted across multiple commodity price cycles, providing empirical support for its operational strategy. Furthermore, the capital allocation framework survived a chief executive transition and the 2022 commodity price surge without reverting to debt-funded volume growth, indicating that capital discipline is embedded within the organization. Executive compensation structures further align management incentives with return on capital rather than raw output growth, a structure uncommon across the broader exploration and production sector.
At the same time, the tier-1 acreage that funded EOG's growth over the past decade and a half is maturing. Well productivity across core legacy plays such as the Eagle Ford has flattened, while scaled peers have partially replicated EOG's insourced sand and water logistics. Concurrently, sector consolidation has created larger competitors with broader Permian acreage positions and lower capital costs. Consequently, EOG's response to long-term inventory depletion centers on its $5.6 billion acquisition in the Ohio Utica shale—a basin where the company has yet to demonstrate that its completion engineering can achieve legacy return hurdles.
This integration represents the primary test of Chief Executive Ezra Yacob's tenure. The central analytical question is whether an organization built on organic exploration and internal engineering can absorb its largest acquisition without incurring integration drag or drifting toward volume-driven growth. The 2016 Yates acquisition demonstrated that converting secondary acreage into premium inventory requires time and technical evaluation, suggesting caution regarding initial headline inventory claims. Conversely, EOG's track record in subsurface engineering indicates that transferring operational practices remains plausible, though empirical confirmation will depend on upcoming drilling results.
Over more than a quarter-century of independence, EOG has demonstrated that in a commodity industry with undifferentiated output and global pricing, disciplined operational engineering, supply chain control, and strict return hurdles can generate structural cost advantages. Whether that operational model can be successfully extended to acquired acreage in Ohio defines the company's next phase—a test that will ultimately be measured in completed well costs per lateral foot.
References
-
EOG Resources Investor Relations Portal — EOG Resources, Inc. ↩↩↩↩↩↩
-
EOG Resources 2024 Form 10-K Annual Report — EOG Resources IR, 2025-02-25 ↩↩↩↩↩↩
-
EOG Investor Events, Webcasts & Presentations — EOG Resources IR ↩↩↩↩↩↩↩↩↩↩↩↩
-
EOG SEC Proxy Statement Form DEF 14A — EOG Resources IR, 2025-03-20 ↩↩↩↩↩↩
-
EOG Resources SEC EDGAR Filings & Annual Reports — U.S. Securities and Exchange Commission ↩↩
-
Drilling Productivity Report & Basin Data — U.S. Energy Information Administration (EIA) ↩
-
EOG Resources to Acquire Encino Acquisition Partners for $5.6 Billion — S&P Global Commodity Insights, 2025-05-30 ↩↩
 LinkedIn
 WhatsApp
 Reddit
 Hacker News
 Email
Email Kindle
 RSS Feed
 Spotify
 Apple Podcasts
 Amazon Music
 Audible
 YouTube